Well as you can tell we are a little late on this article. Last week AMD launched their new CPUs with Vega graphics. Without getting too much into it right now (I’ll explain later) but I spent well over a week fighting with issues when trying to test and I didn’t get things worked out until just before this past weekend. Anyhow, testing is done, now we just need to talk a little about what AMD is doing with these new CPUs and then dive into the results! So let's go see what AMD's new Raven Ridge CPUs are all about!
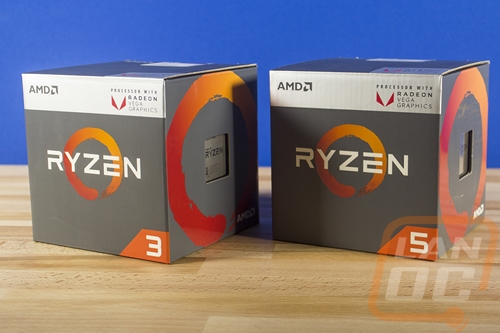
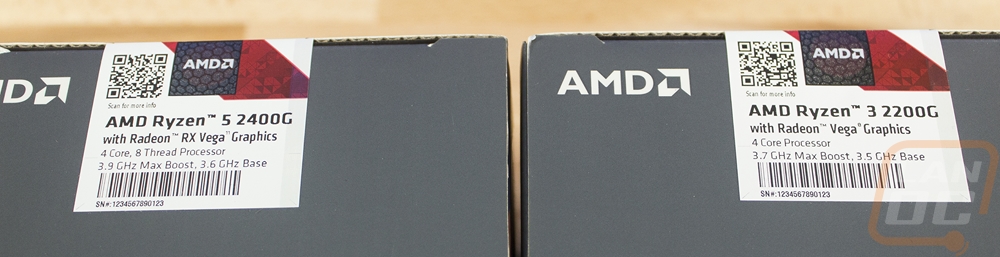
Product Names: AMD Ryzen 5 2400G and Ryzen 3 2200G
Review Sample Provided by: AMD
Written by: Wes Compton
Pictures by: Wes Compton
Amazon Affiliate Links: Ryzen 5 2400G and Ryzen 3 2200G
Ryzen with Vega Graphics
So the original plan, like our past launch CPU reviews was to dive into every detail of Raven Ridge but honestly, at this point, I think most of you have a decent idea of what it is. So today we are going to keep things a little shorter so we can get into the performance testing that most of you are wanting to see.
Last year with the Ryzen launch it was a huge launch for AMD not just because of the implications at that moment with them in most ways catching up to Intel on the CPU market. Ryzen and the Zen architecture as a whole is a big investment in AMD's future because of their Infinity Fabric design that allowed AMD to be able to shrink and expand the number of cores. Threadripper was a great example of that. Well, the other half of that coin is being able to customize their architecture for APUs and for video game consoles as well. While the Vega launch wasn’t without its issues, hell you still can’t find them. But when you put the two launches together you now have really interesting potential in both the APU and integrated console market.
So a Scalable APU, especially one with Zen and Vega behind it is really interesting because to date most CPUs with onboard graphics leave a lot to be desired when it comes to gaming performance. With Raven Ridge, AMD decided to make some core changes to things to try to realign it to work with both desktop and mobile applications. This meant shrinking the die size down by cutting L3 cache down to 4MB from 8MB and also cutting back on the number of GPU PCI lanes from x16 to x8. To compensate they did bump up clock speeds though. For comparison, the 2400G is similar to the Ryzen 5 1400 but the 2400G has a base clock of 3.6 GHz and a Boost Clock of 3.9 GHz vs 3.2 and 3.45 GHz on the 1400. The PCI lanes change was a cost-saving one as was the move to TIM over soldering under the heat spreader. overclockers and enthusiasts aren’t going to love this change, but officially these are mid-range CPUs and word is AMD isn’t planning on doing this on their higher end CPUs when they get refreshed.
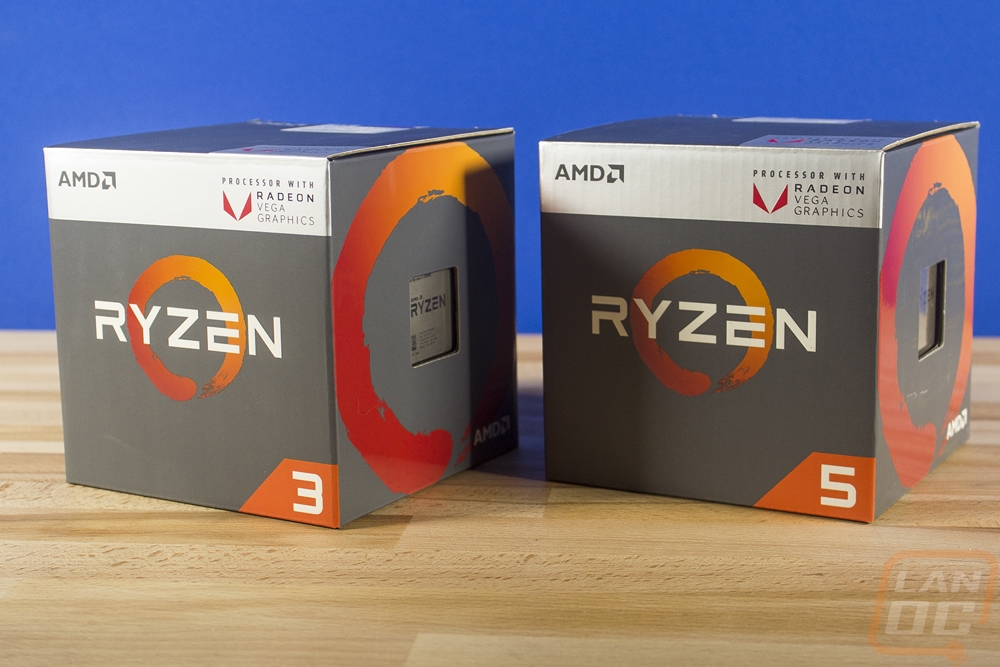
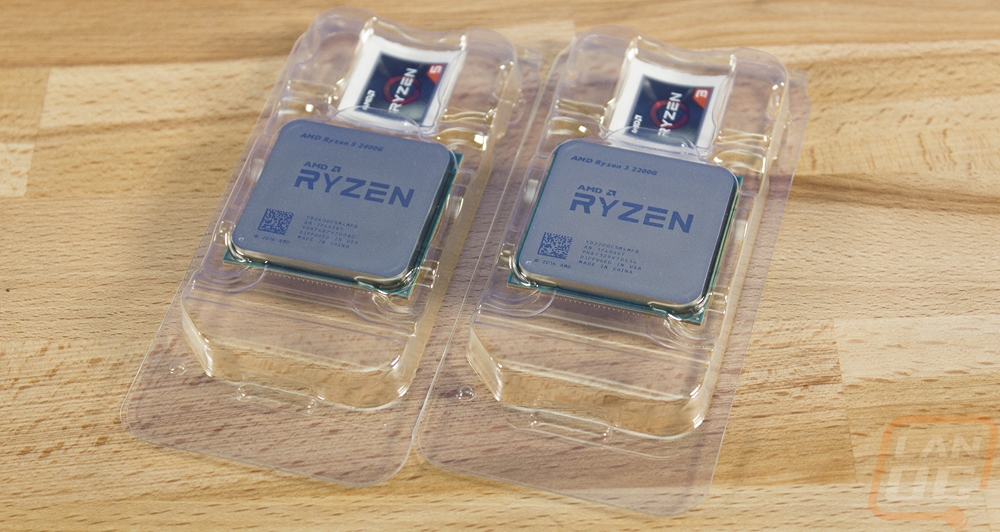
So AMD sent us both the Ryzen 5 2400G and the Ryzen 3 2200G so to take a quick look at the differences. They both have the same 4 core 8 thread configuration and really the base clock speeds aren’t that far apart (3.6 vs 3.5). The 2400G has a little more on the boost clock (.2 GHz) but the main difference is in the onboard graphics. The 2400G has 11 Vega CUs where the 2200G has 8 and the 2400G has a higher clock speed as well. Then from there, they both have the same TDP and Cache and they also now support up to 2933 MHz DDR4 before it is considered overclocking and we learned last year just how much Ryzen likes fast memory. The biggest difference though is in the pricing. The 2200G comes in at $99 where the 2400G is $169, I will have to wait to see the performance before I judge if that is justified or not though.
|
|
AMD Ryzen™ 5 2400G |
AMD Ryzen™ 3 2200G |
|
CPU Cores |
4 Cores, 8 Threads (1 CCX) |
4 Cores, 8 Threads (1 CCX) |
|
CPU Base Clock |
3.6GHz |
3.5GHz |
|
CPU Max Boost Clock |
Up to 3.9GHz |
Up to 3.7GHz |
|
GPU Cores |
11 Radeon™ Vega CUs |
8 Radeon™ Vega CUs |
|
GPU Clock |
Up to 1250MHz |
Up to 1100MHz |
|
L1 Cache |
64K I$, 32K D$ per core |
64K I$, 32K D$ per core |
|
L2 Cache |
512K per core |
512K per core |
|
L3 Cache |
4MB Shared |
4MB Shared |
|
TDP |
65W |
65W |
|
DRAM Supported |
Up to DDR4-2933 (Dual Channel) |
Up to DDR4-2933 (Dual Channel) |
|
Transistors and Die Size |
209.78mm2 / ~4.94 billion |
209.78mm2 / ~4.94 billion |
|
GPU Max Clock |
Up to 1250MHz |
Up to 1100MHz |
|
“Vega” Graphics Cores |
11 Compute Units (704 ALUs) |
8 Compute Units (512 ALUs) |
|
TMUs |
44 |
32 |
|
ROPs |
16 (32-bit) |
16 (32-bit) |
|
FP32 Graphics TFLOPS |
1.76 |
1.126 |
|
FP16 Graphics TFLOPS |
3.52 |
2.252 |
|
MSRP |
$169 |
$99 |
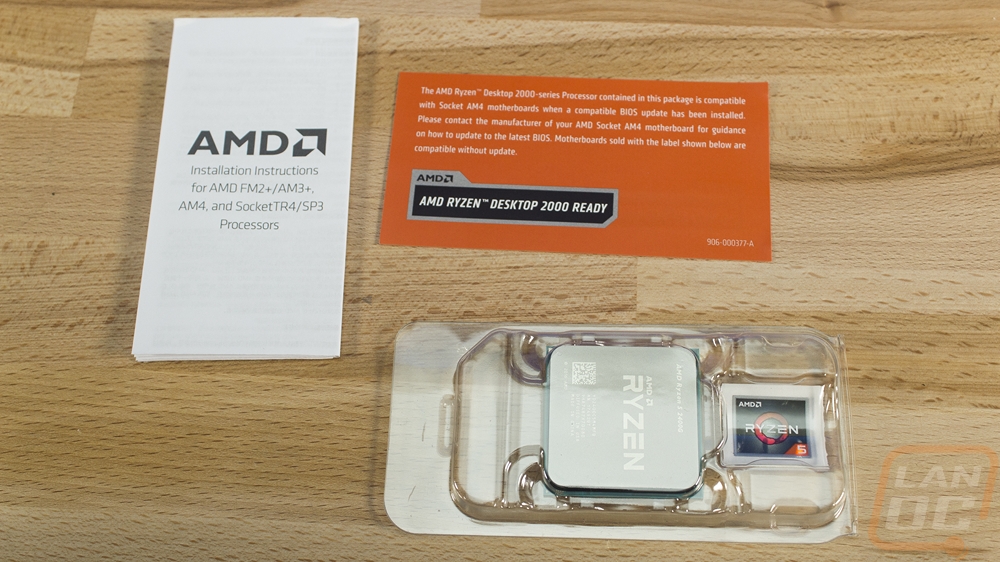
What’s in the BOX!
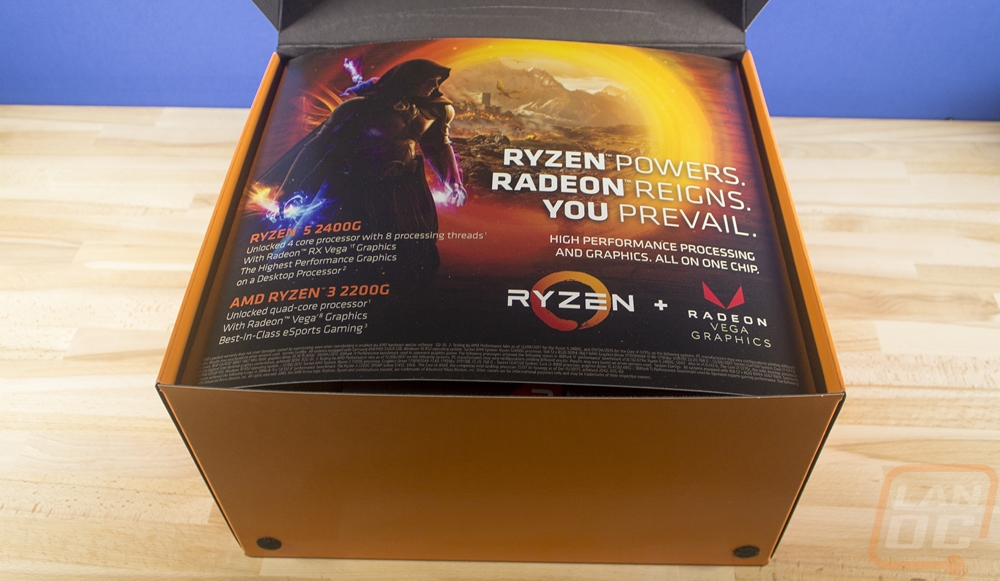
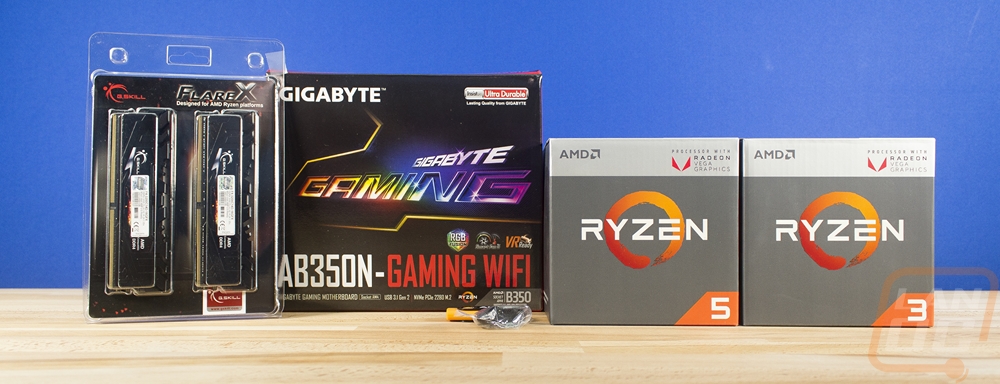
Let's also take a look at what AMD sent over for the review kit and what you will get when you buy one of the APUs. So once again they sent over a large box that is decked out in Ryzen theme. This one was designed to have the same silver strip across the top just like the actual boxes.
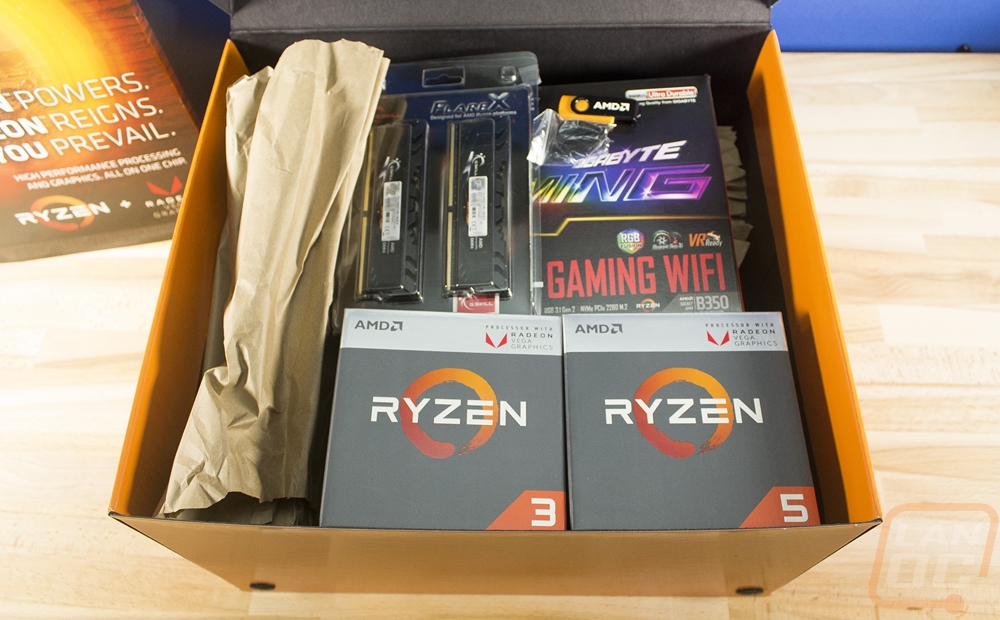
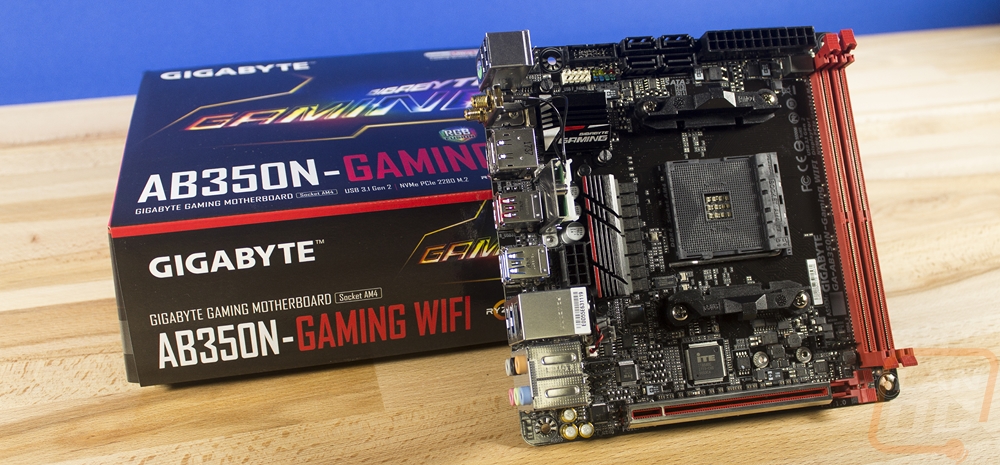
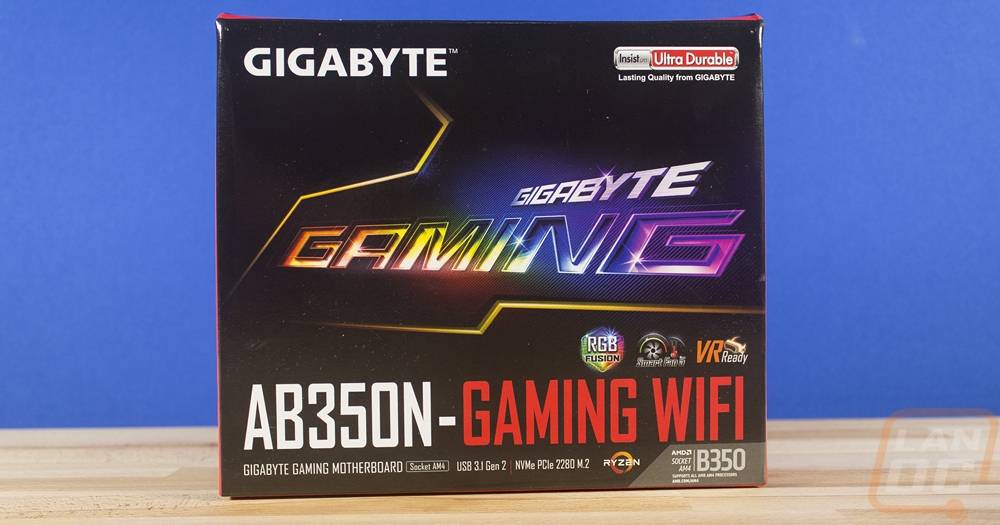
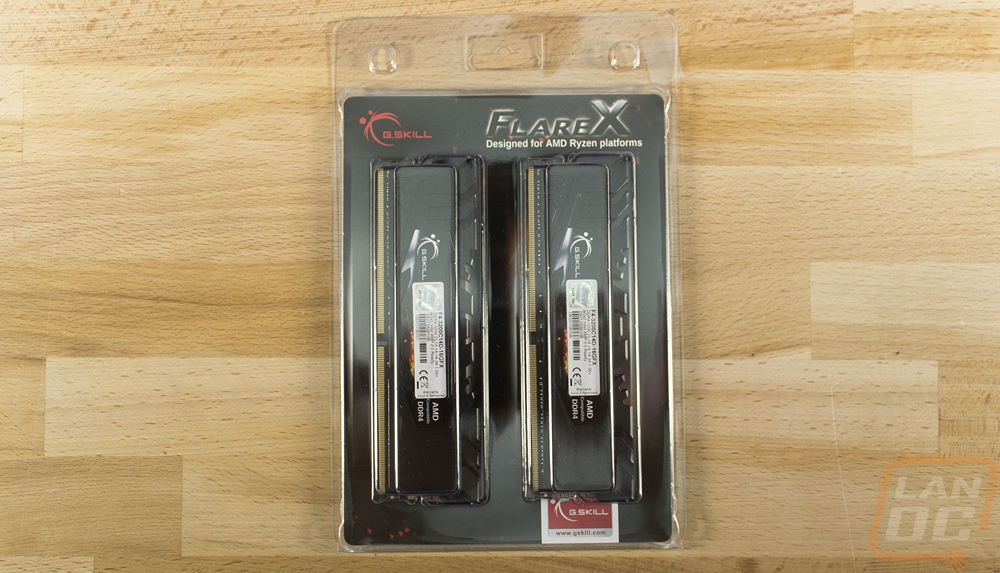
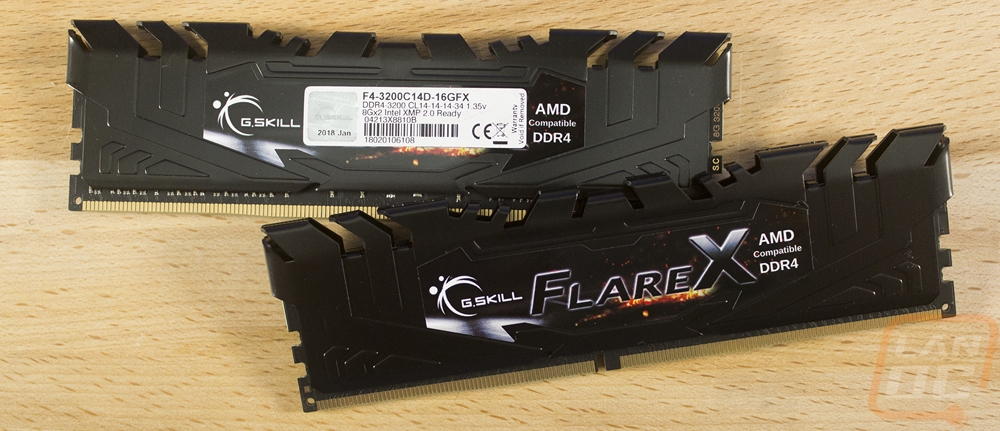
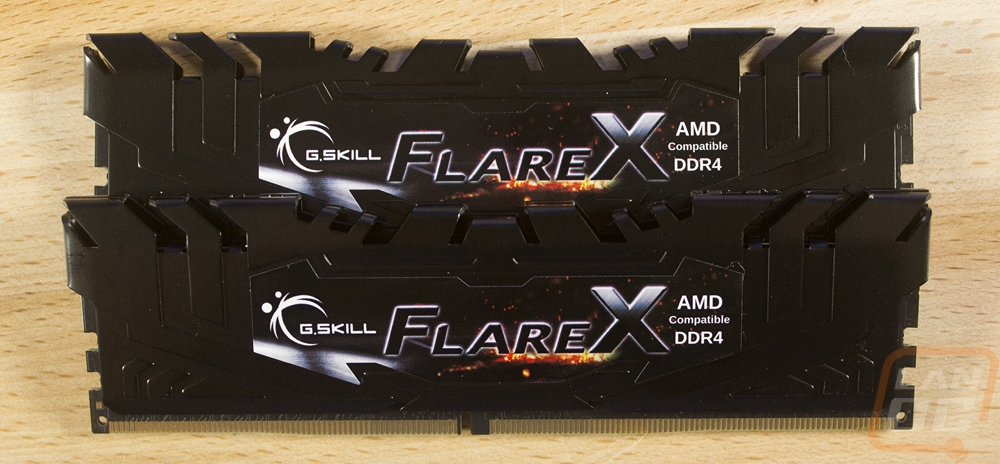
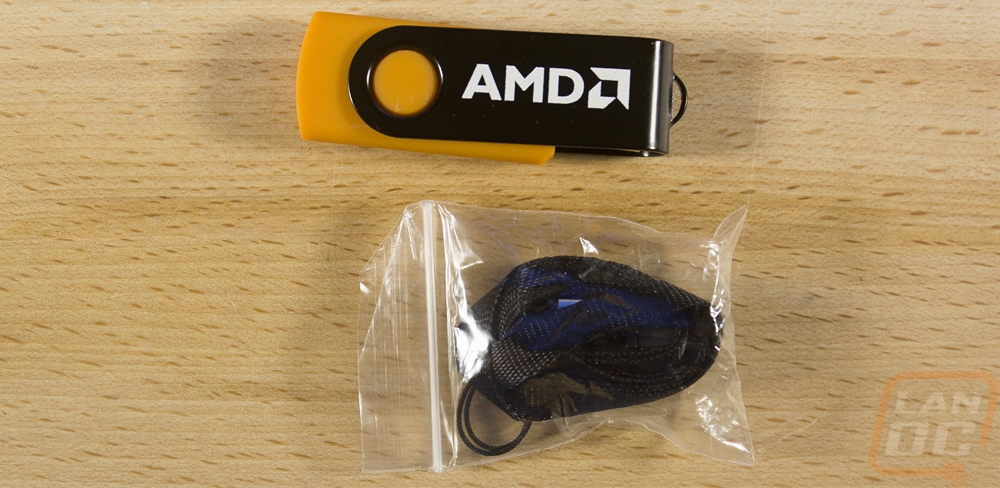
Inside the box, AMD's kit came with nearly a whole PC. They sent the Ryzen 5 2400G and the Ryzen 3 2200G in their boxes with coolers. Then they included a Gigabyte AB350N-Gaming WIFI ITX for a motherboard. For memory G-Skill Flare-X AMD compatible memory and they also included an orange AMD branded USB drive as well.
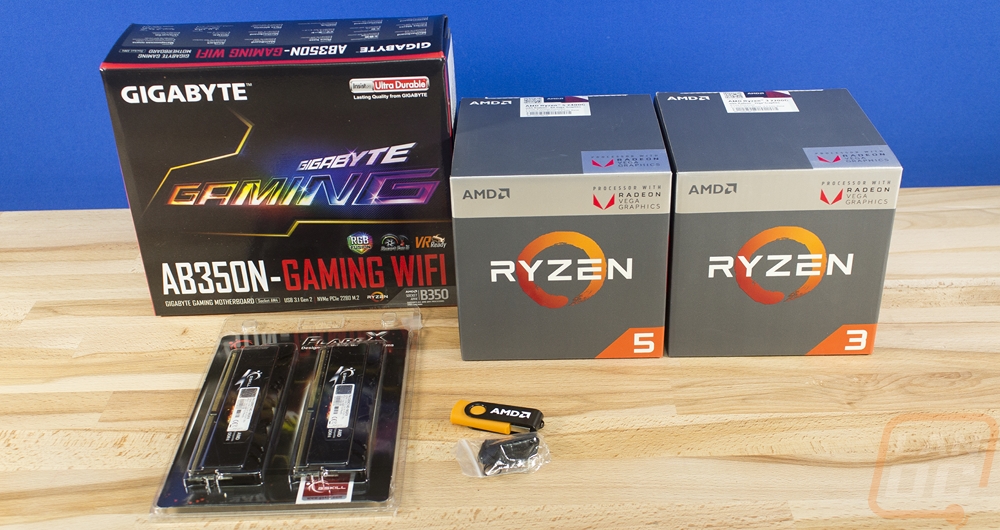
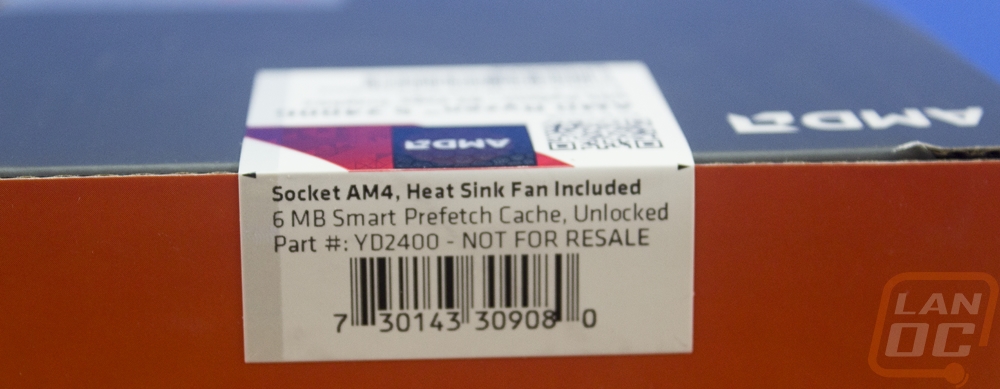
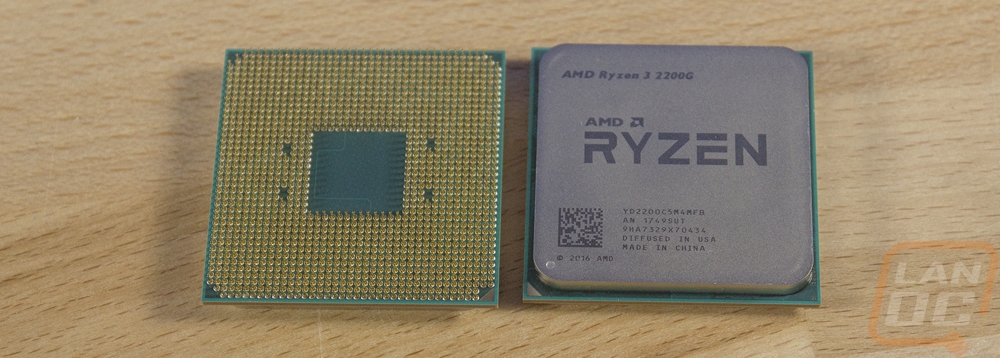
So the AMD CPUs they sent look like production models but they are not for resale labeled. I don’t plan on selling them or anything but I do mention that these aren’t randomly picked off the production line or anything.
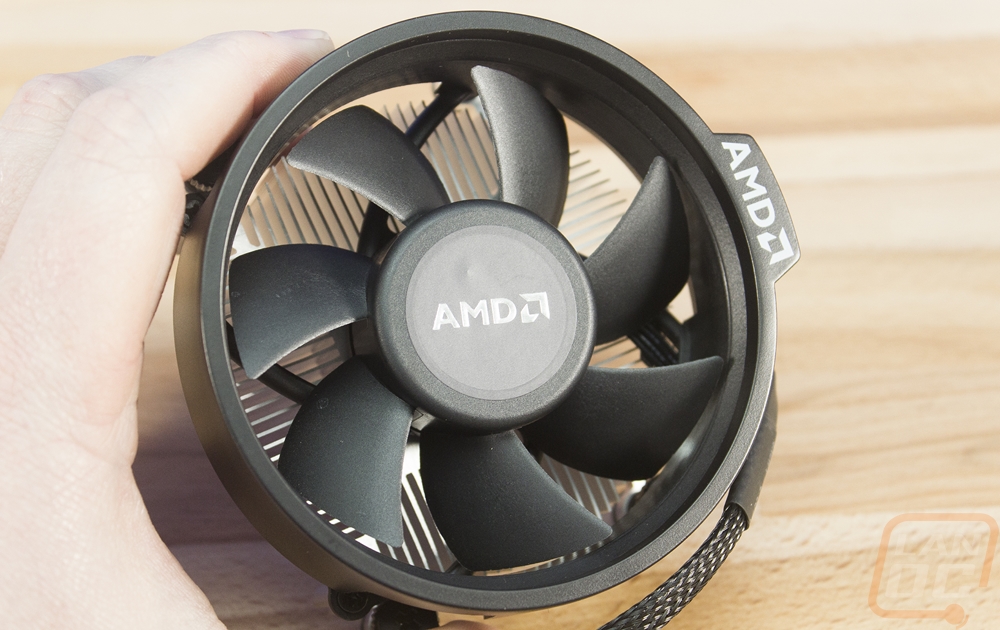
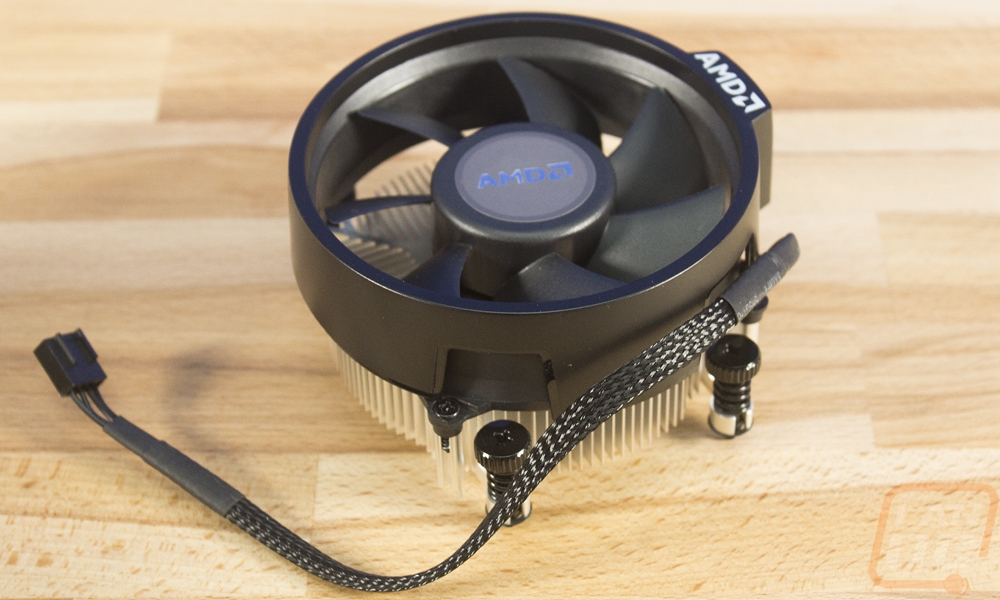
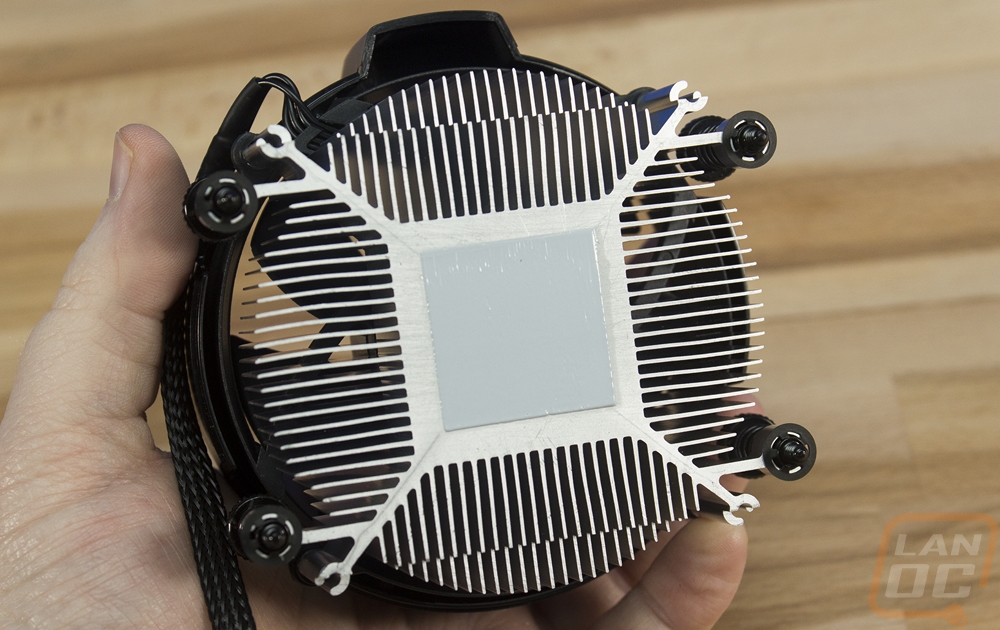
Inside each box, they both come with Wraith Stealth coolers. This is the lowest end of all three of AMDs stock coolers. I’ve actually spent a lot of time testing and diving into these as well as stacks of other coolers directly on Ryzen at the two links below
Anyhow this does come with thermal paste but isn’t as great at cooling as the other two models.
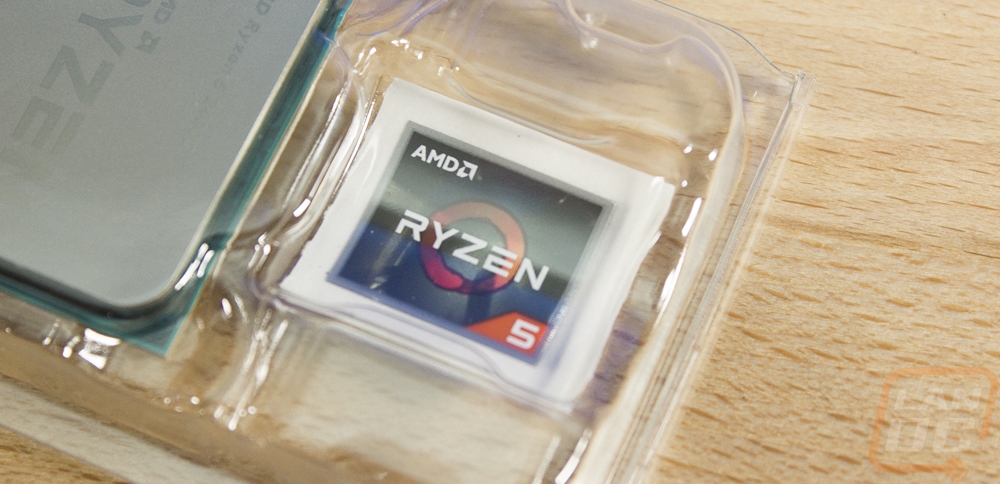
Also in the box, you get the CPU in a plastic tray, installation instruction, a note about BIOS compatibility for Ryzen 2000 series processors, and you also get two stickers. One is a matching Ryzen 3 or 5 sticker and the other is a Vega sticker. The Vega one isn’t pictured because it is tucked up under the Ryzen one and I didn’t see it until much later.
Now the Gigabyte AB350N Gaming WiFi might look familiar if you read my articles often. This is because I actually covered it back when it launched. In fact, we were the first English review of the board and I was also the first to damage it. I also did all of our Ryzen ITX testing on it and its been in at least one case review as well. Well, our original now has a twin brother. Check out our review for more information on the board.
As for the memory, this is the first time I’ve had a chance to check them out. The Flare-X sticks have Samsung dies on them and that is what has made them great for Ryzen, even back in the early days when most RAM didn’t work with it. The black heatspreaders look good and have just a little styling up on the top edge without being too overdone or making the sticks too tall.
Last but not least is that orange USB drive. There wasn’t anything on it but it should be perfect to have around the office for a windows installer drive or to be able to move drivers between PCs. I can’t complain about the color given how much I love orange and it is covered so it won’t get dirt or funk into the USB connection over time.
Test Rig and Procedures
|
Ryzen AM4 w/onboard Test System |
||
|
Motherboard |
Gigabyte GA-AB350N-Gaming WIFI |
|
|
Cooling |
Noctua NH-U12S for cooling Noctua NT-H1 Thermal Paste |
|
|
Memory |
G.SKILL Flare X Series 16GB (2 x 8GB) DDR4 3200 MHz |
|
|
Storage |
Kingston HyperX 240GB SSD |
|
|
Video Card |
Nvidia GTX 1080 Ti |
|
|
Power Supply |
Thermaltake 850w |
|
|
Case |
Dimastech Test Bench |
|
|
OS |
Windows 10 Pro 64-bit |
|
|
CPU Testing Procedures |
|
|
Team Fortress 2 |
1080p – high, very high, high, reflect world, high, enabled, 8x msaa, x16, multicore on. Testing is then run with this benchmark |
|
Ashes of the Singularity: Escalation |
1080p – Standard quality setting, DX12, built in benchmark on the CPU-focused setting |
|
Tom Clancy's Ghost Recon: Wildlands |
Built-in Benchmark, 1080p, High detail setting |
|
Deus Ex: Mankind Divided |
1080p – Ultra Setting – DX11 – Vsync Turned off using built-in benchmark |
|
Dolphin 5.0 Benchmark |
For information on configuration, view this thread |
|
3DMark Fire Strike |
Physics Score – Performance benchmark |
|
7-Zip |
Built-in benchmark set to 32MB, run 4 passes |
|
Jetstream |
http://browserbench.org/JetStream/ |
|
wPrime |
1024M |
|
X264 HD Benchmark |
Pass 1 and Pass 2 |
|
Cinebench R15 |
CPU and CPU (Single Core results) |
|
Passmark 8 |
CPU Mark Score |
|
PCMark 10 |
Normal test ran, not the express or extended |
|
AIDA64 |
Memory, Cache, and FLOPS testing done with built-in GPGPU and Memory benchmarks |
|
Power Usage |
Idle and load testing using a Kill-A-Watt and wPrime to put the CPU under load |
|
Temps |
Aida64 stability test to load and to record temperature readings |
|
Onboard Testing Procedures |
|
|
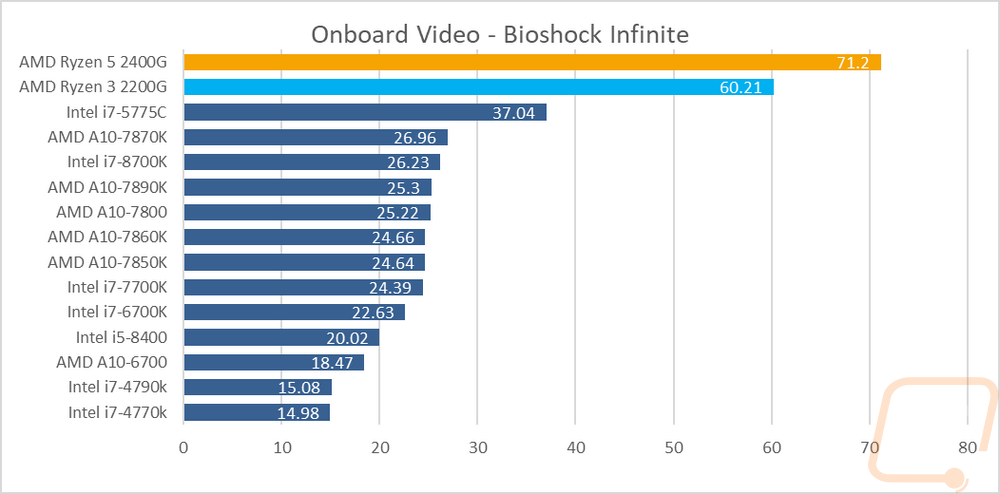
Bioshock Infinite |
Adrenaline Action Benchmark Tool on the “Medium” quality setting at 1080p |
|
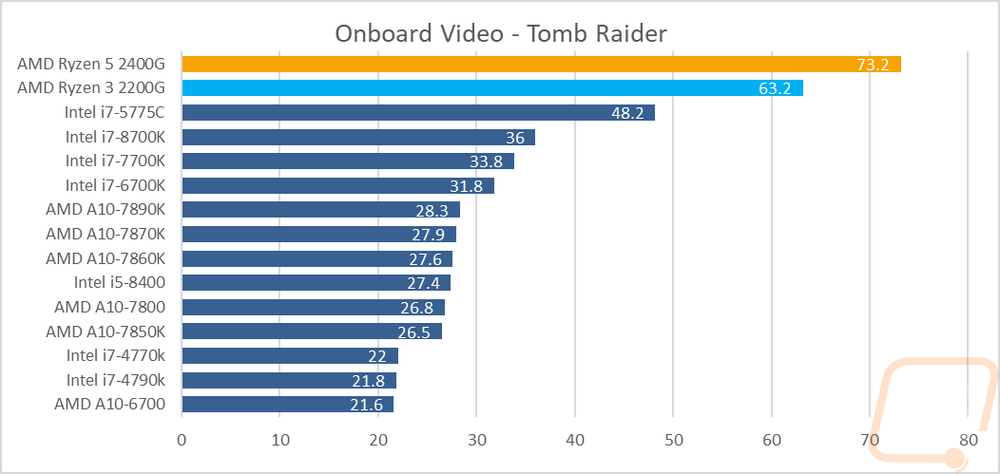
Tomb Raider |
Adrenaline Action Benchmark Tool on the “Medium” quality setting at 1080p |
|
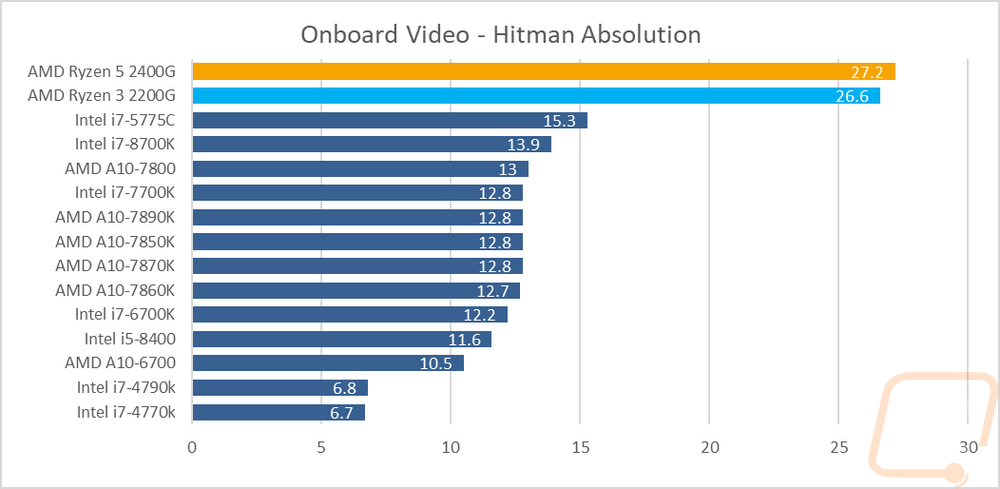
Hitman: Absolution |
Adrenaline Action Benchmark Tool on the “Medium” quality setting at 1080p |
|
Sleeping Dogs |
Adrenaline Action Benchmark Tool on the “Medium” quality setting at 1080p |
|
GRID Autosport |
Ultra and Medium presets at 1080p |
|
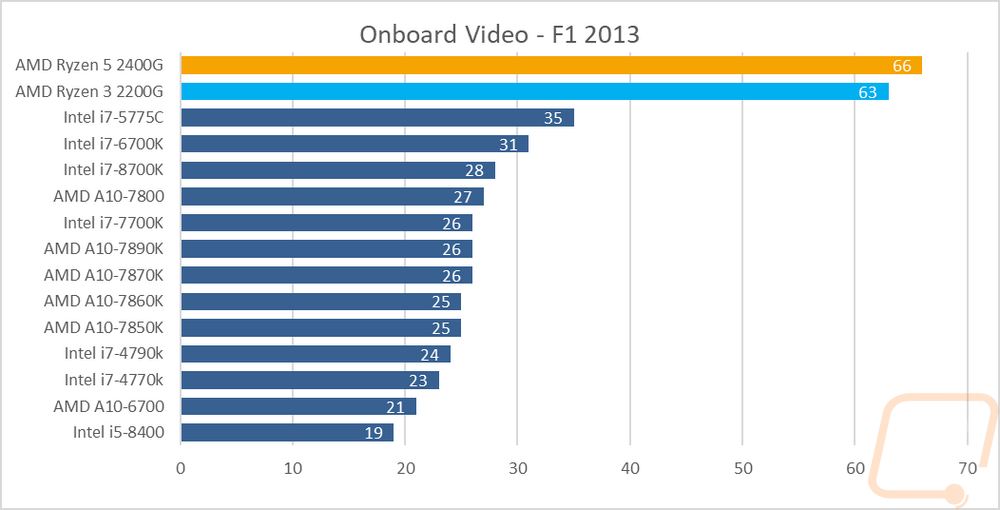
F1 2013 |
Ultra Preset |
|
Team Fortress 2 |
1080p – high, very high, high, reflect world, high, enabled, 8x msaa, x16, multicore on. Testing is then run with this benchmark |
|
Unigine Valley Benchmark 1.0 |
Extreme HD Preset |
|
Unigine Superposition |
720p Low and 1080p Medium settings |
|
3DMark Fire Strike |
Performance setting – GPU Score |
|
3DMark Time Spy |
GPU Score |
|
Cinebench R15 |
OpenGL benchmark |
Problems? What happened
Okay before I dive into the good and bad with these CPUs, I figured this is as good of a place as any to talk a little about the issues I ran into during testing that caused our delays. I obviously got everything working but I like to be completely open about anything I run into just in case anyone else has the same issues. I basically had two issues. The first one right out of the hole happened when using onboard and when I was using a GPU and this was where a lot of my time was wasted trying to figure things out. Basically, when I hooked everything up and got up I was missing some resolutions including 1080p. I’ve had this same issue once before on Intel and it was a chipset driver not being installed but I had all of the drivers AMD had provided. This issue was preventing me from doing any of our in game testing and some of the other tests that test at 1080p full screen also wouldn’t run.
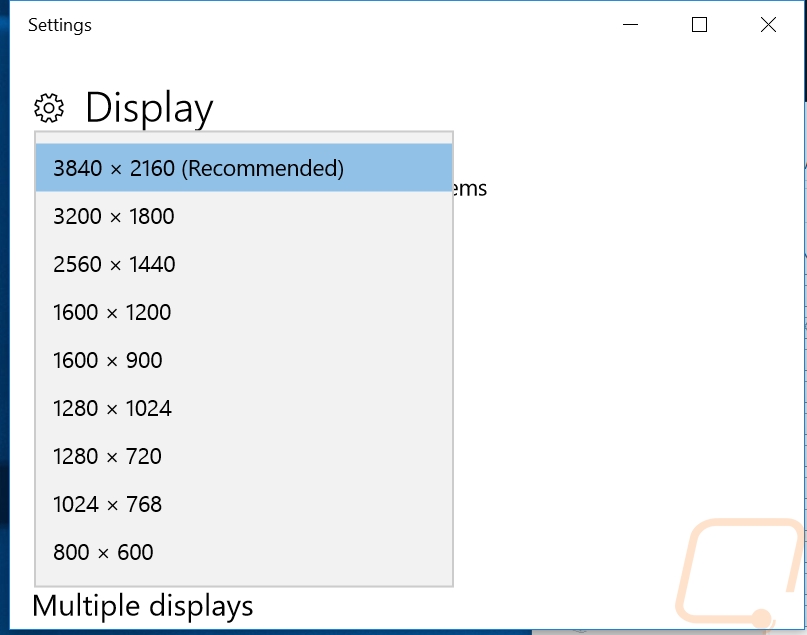
I spent days reinstalling and fighting with this one because I thought a bad SSD was causing it and I did seem to be having data loss but after reinstalling windows and redownloading everything on three different SSDs it didn’t fix the issue. From there I tried different CPUs and video cards. I even pulled our matching Gigabyte board out of a build an after having to update the BIOS with another CPU in it I confirmed that wasn’t the issue as well. I tried redownloading and using a different USB drive for our copy of windows and in all, I think I reinstalled 5 or 6 times, that takes up a huge about of time. I even tried a different power supply. I even tried different monitor cables, both type and then multiple of each type. Monitor drivers didn’t do it, mind you our test monitor is a Gsync compatible display so I thought maybe that was the issue as well. In the end, I just forced the resolution down to 1080p by digging out a 1080p monitor and that worked at the time.
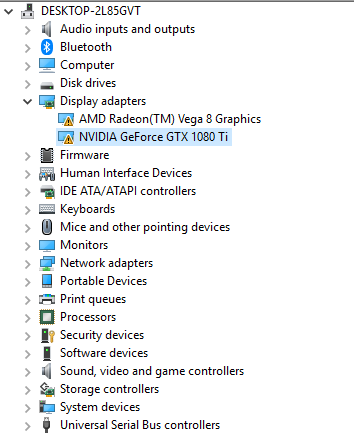
Then from there I did some of my testing and then noticed another issue when I wanted to test the onboard. I was getting weird results and eventually some of the games and tests that needed stuff like newer OpenGL didn’t work. As it turns out the GPUs were showing up as errored and that windows has shut them down. They both had "Windows has stopped this device because it has reported problems (Code 43)” as the error. It didn’t matter if I was on onboard or if I installed a GPU. So this slowed me down for days trying to figure it out and eventually, AMD asked if I had tried using the BIOS option to force PCI or onboard graphics. Doing that oddly enough fixed the problem lol.
There seemed to be some sort of compatibility issue between the Nvidia and AMD drivers that was bugging out when they ran at the same time. I don’t think you can expect novice users to use the BIOS setting when swapping between onboard and GPUs so hopefully it was specific to me or they get it figured out in the future.
CPU Performance
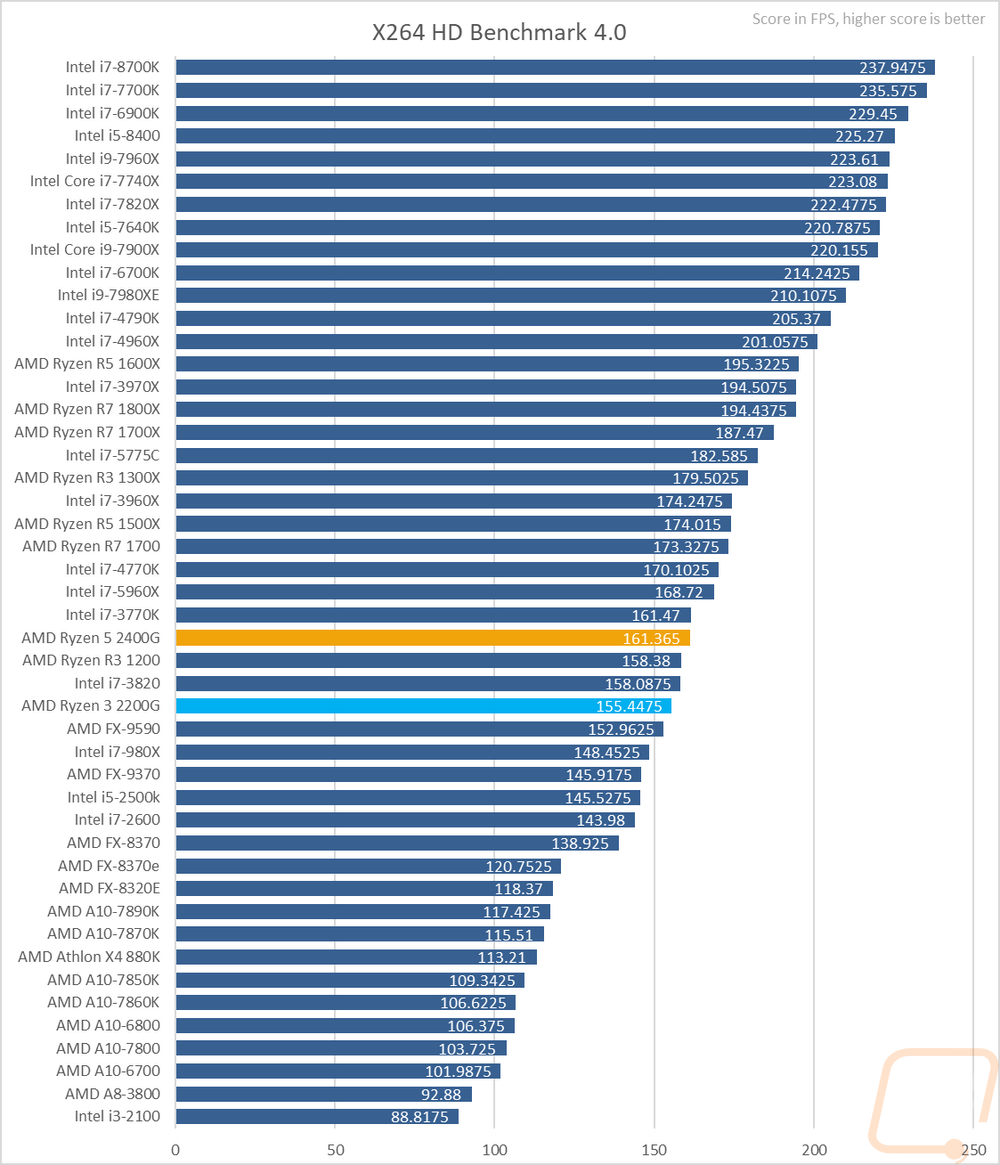
So to start off my testing I jumped in with X264 HD Benchmark 4.0. This one is a little dated but is a great way to check out video encoding performance. The test runs through four times encoding a video and then I take all four FPS averages from the entire encode and average them together. So with the 2400G and 2200G, these are Ryzen 5 and 3 CPUs so I didn’t come in expecting the world from them but being four core 8 threads both of them did well here for what they are. The 2400G came in just below the 3770K and 4770K, both were amazing at the time and aren’t that old really.
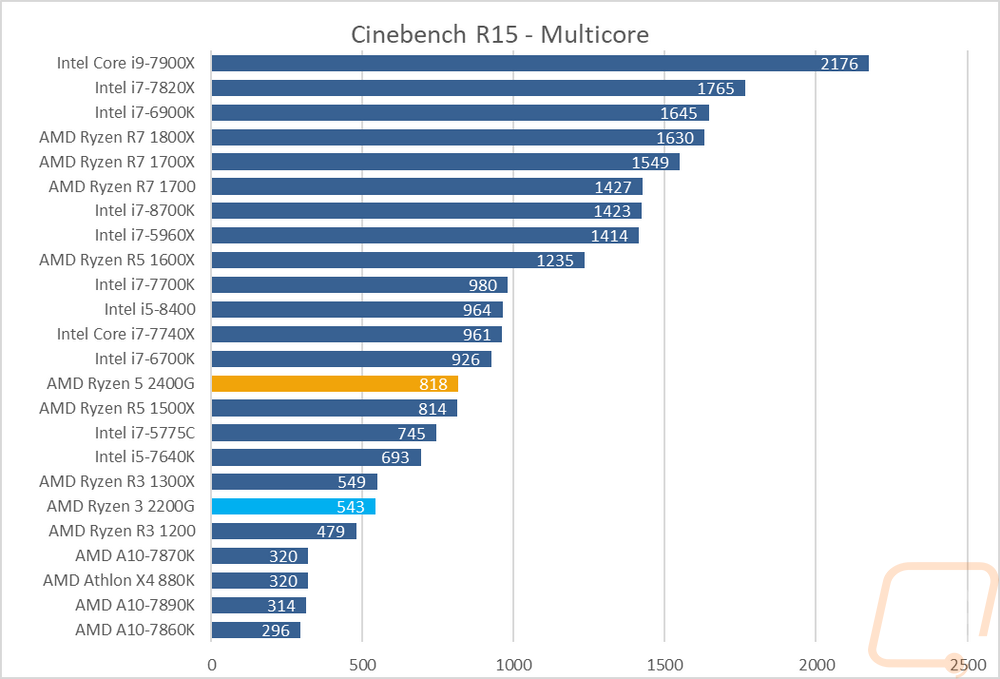
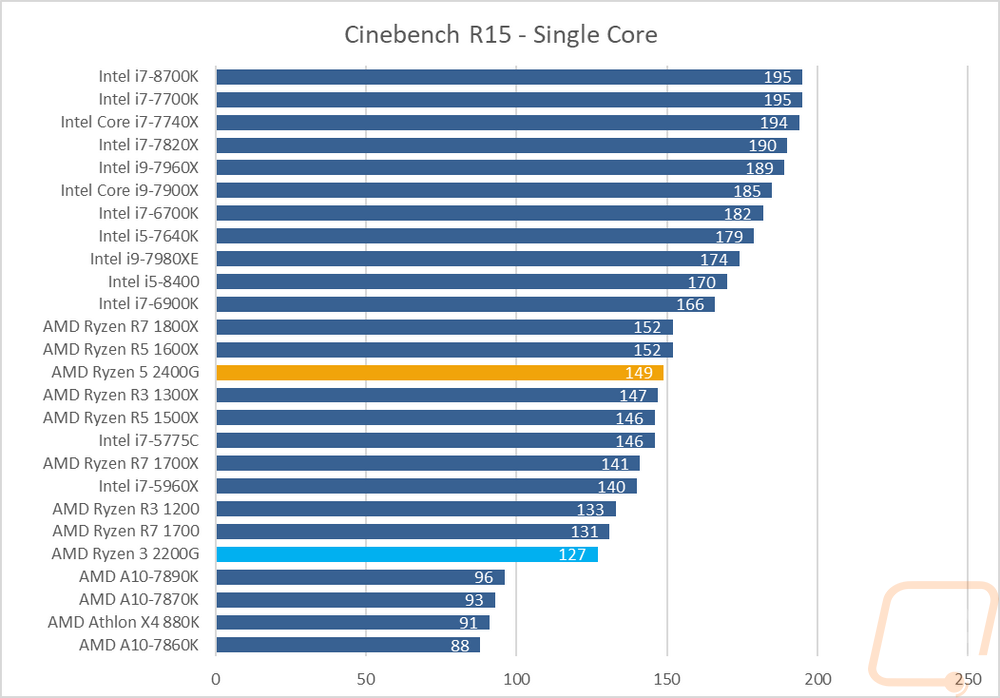
Next, I jumped into my two favorite benchmarks, both in Cinebench R15. I like these because we can check out single core and overall performance together. Single core is important because it gives us a better look at the architecture and clock speeds as well as shows how performance will be affected with older or less optimized software. So in the multicore test, the 2400G did surprisingly well, up with the 1500X and the 6700K was the next closest CPU. The 2200G was down almost completely on par with the 1300X, decent but closer to the bottom of the charts. For single core performance, the results were similar. The 200G was down closer to the bottom and the 1400G was near the middle of the pack with single core performance in between the 1300X and the 1600X.
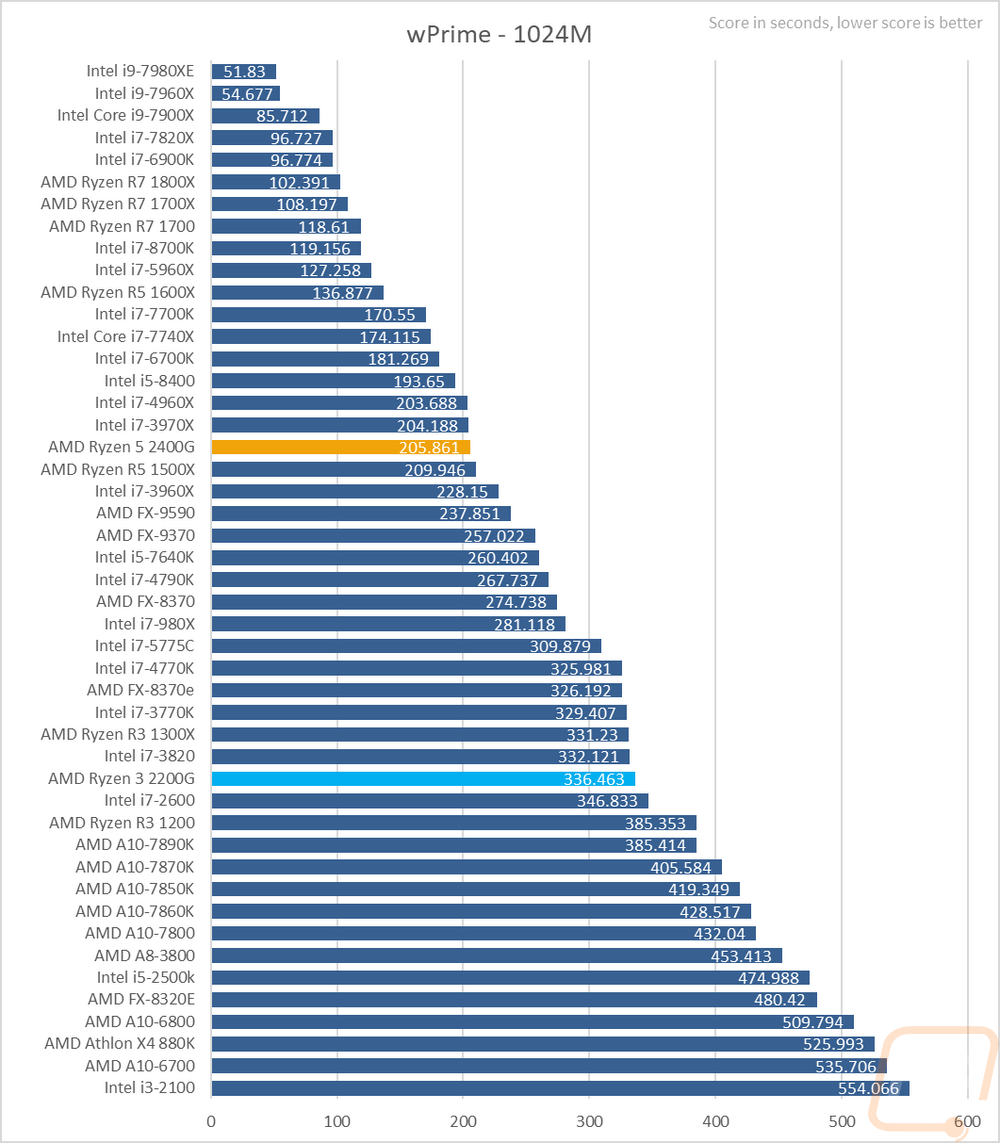
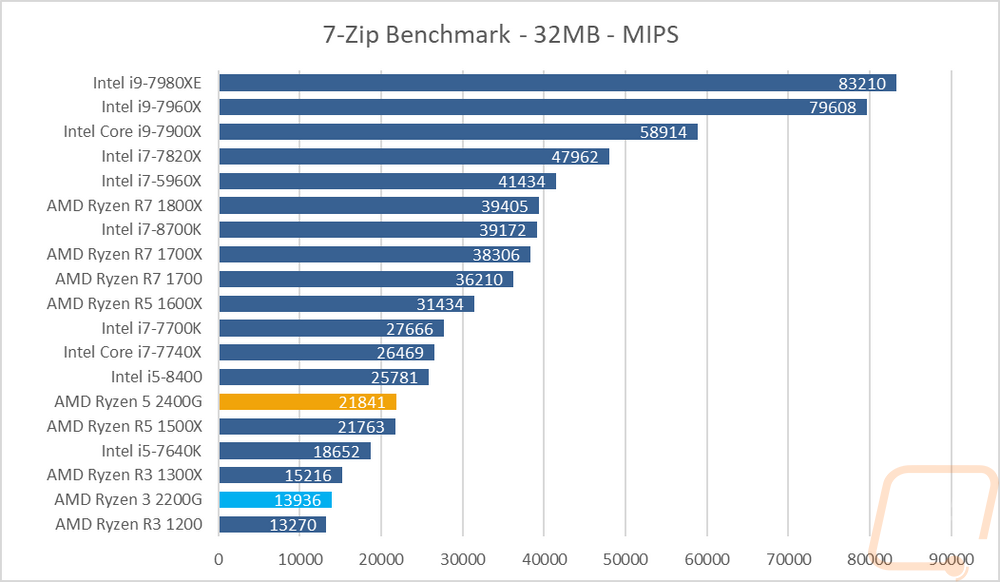
Next, I took a look at two math-focused tests in wPrime and 7Zip. wPrime shows how long it took to compute prime to 1024 million digits and 7-zip just shows performance when compressing files. Again here in wPrime the 2200G didn’t do as well and was close with the older i7-2600 and with the 1300X where the 2400G was with the 1500X and with some of Intel’s older high core count CPUs. 7-Zip, on the other hand, the two CPUs were a lot closer together mostly because it likes higher core count CPUs more.
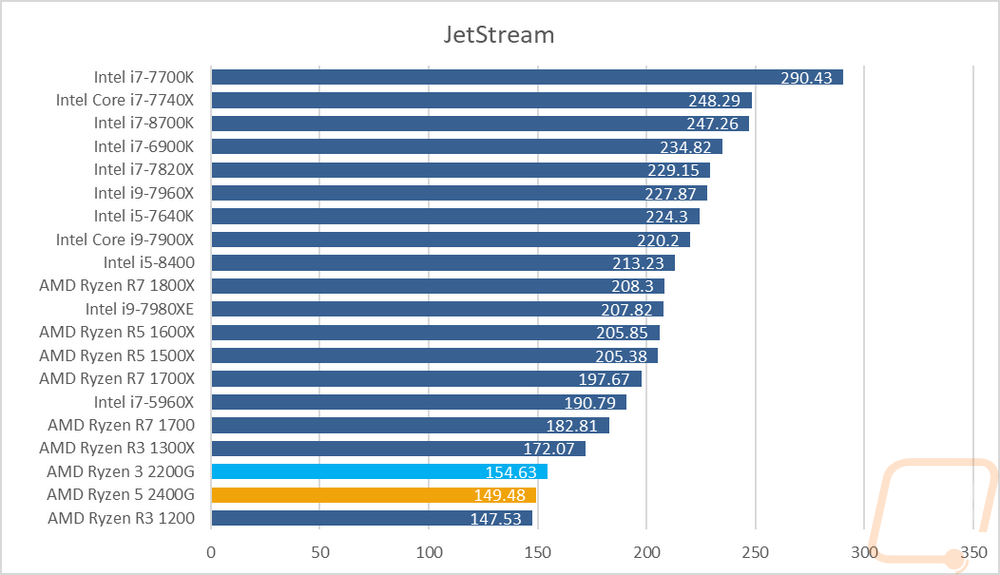
I like to check out what you can expect from browser-based stuff using the browser-based JetStream benchmark. It uses a whole list of benchmarks, runs them three times, then gives you an average score. Ironically even with the multiple tests, this test is always a little weird on the results for me. The 2200G did a little better here but they were both close together and right in line with the 1300X. This was lower down the charts but without the older CPUs included in the previous tests, they look lower than they would be.
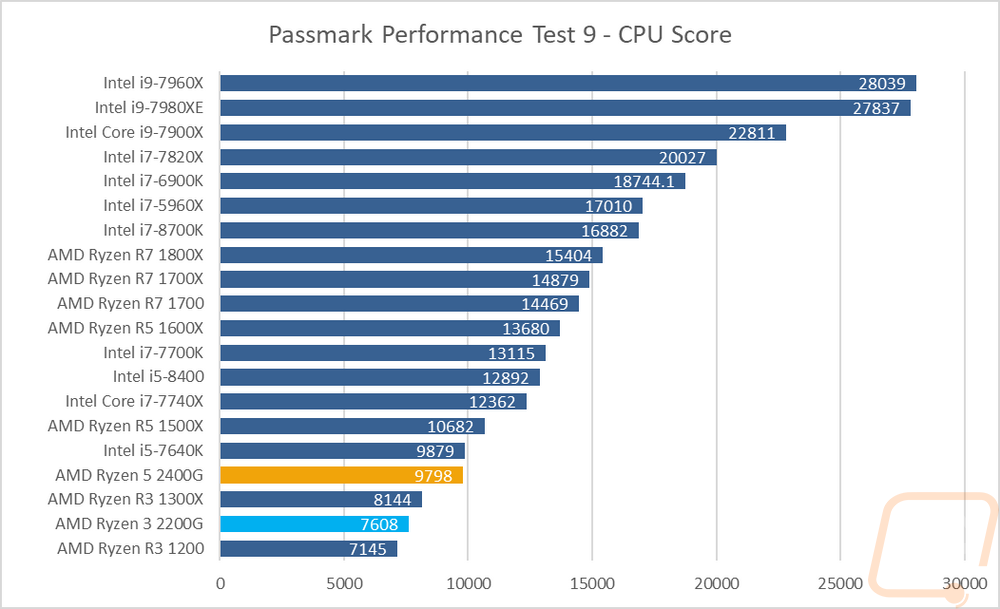
With Passmark Performance Test 9 I just use the CPU score that does a list of CPU compute tasks. I prefer this over including results that focus on the SSD and GPU. Anyhow here the 2400G was just below the i5-7640K and the 2200G was right between the 1300X and 1200, I think this shows the lower L3 cache the most that it is missing over the 1300X.
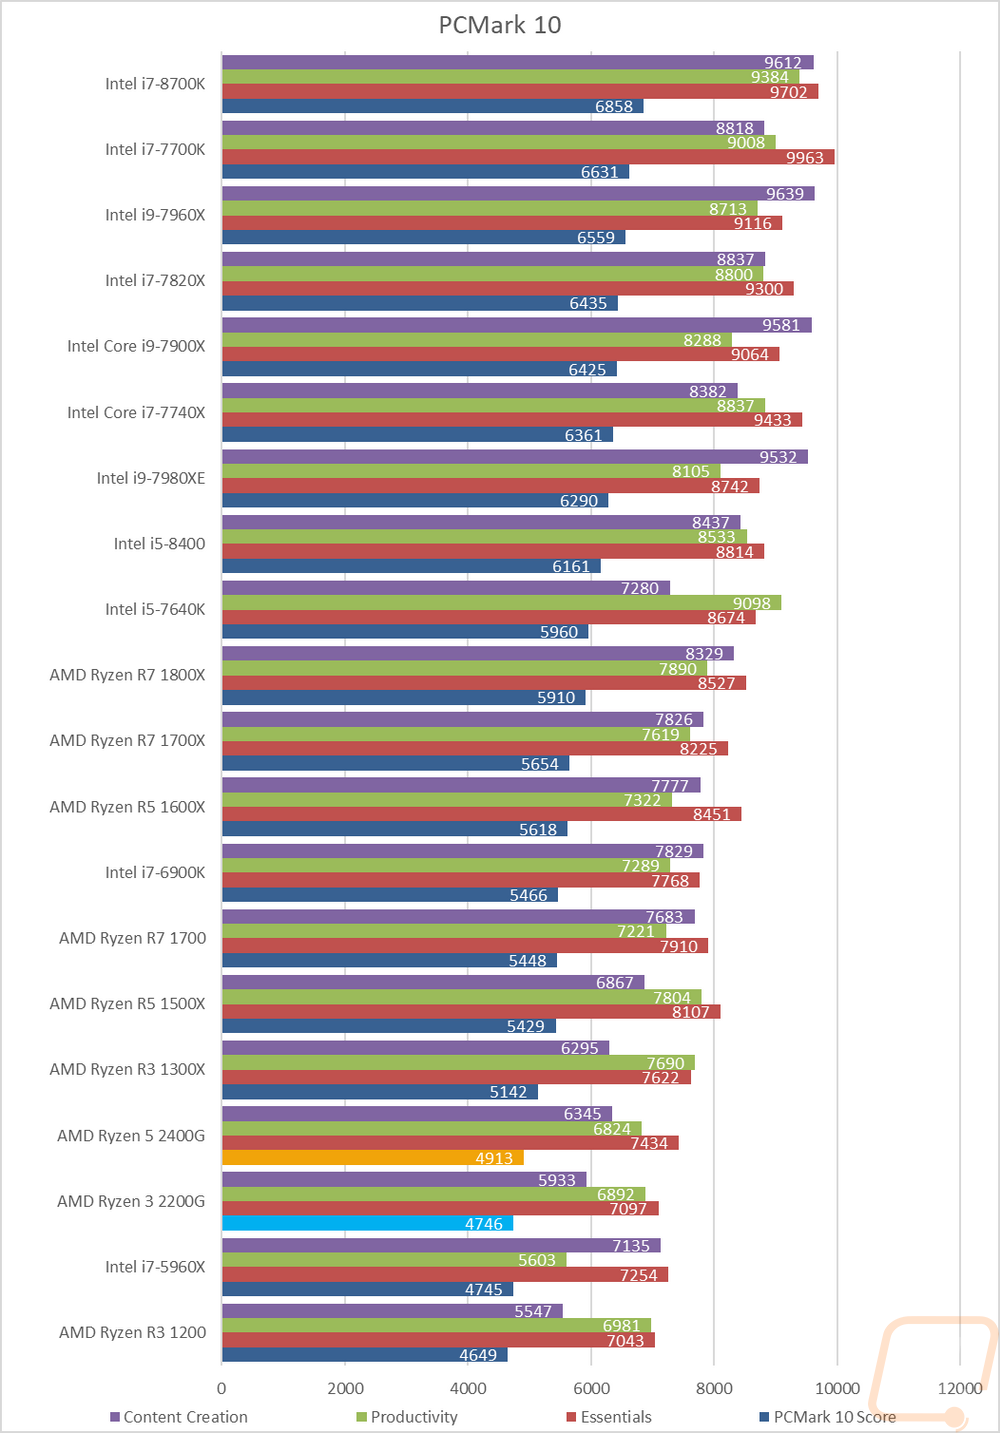
With PCMark 10, I like to run this test because they have integrated a lot of the regular everyday programs like web browsing, video chatting, writing, spreadsheets, photo editing, consuming media, and gaming. Basically everything I use my own PC for. So here the 2400G and the 2200G are both near each other. But the gap is a little farther apart in the essentials and content creation tests. Overall though they are both about comparable to the 1300X.
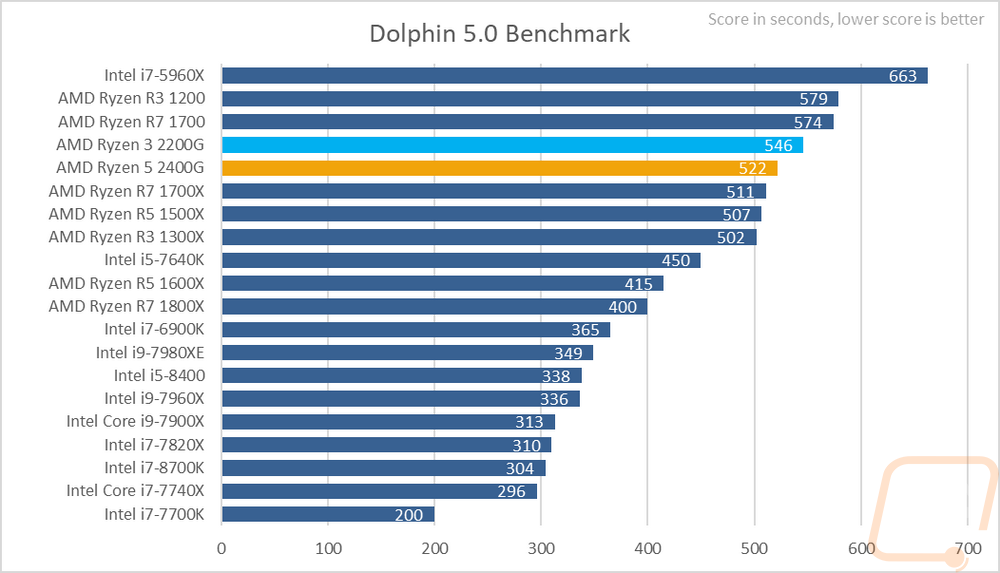
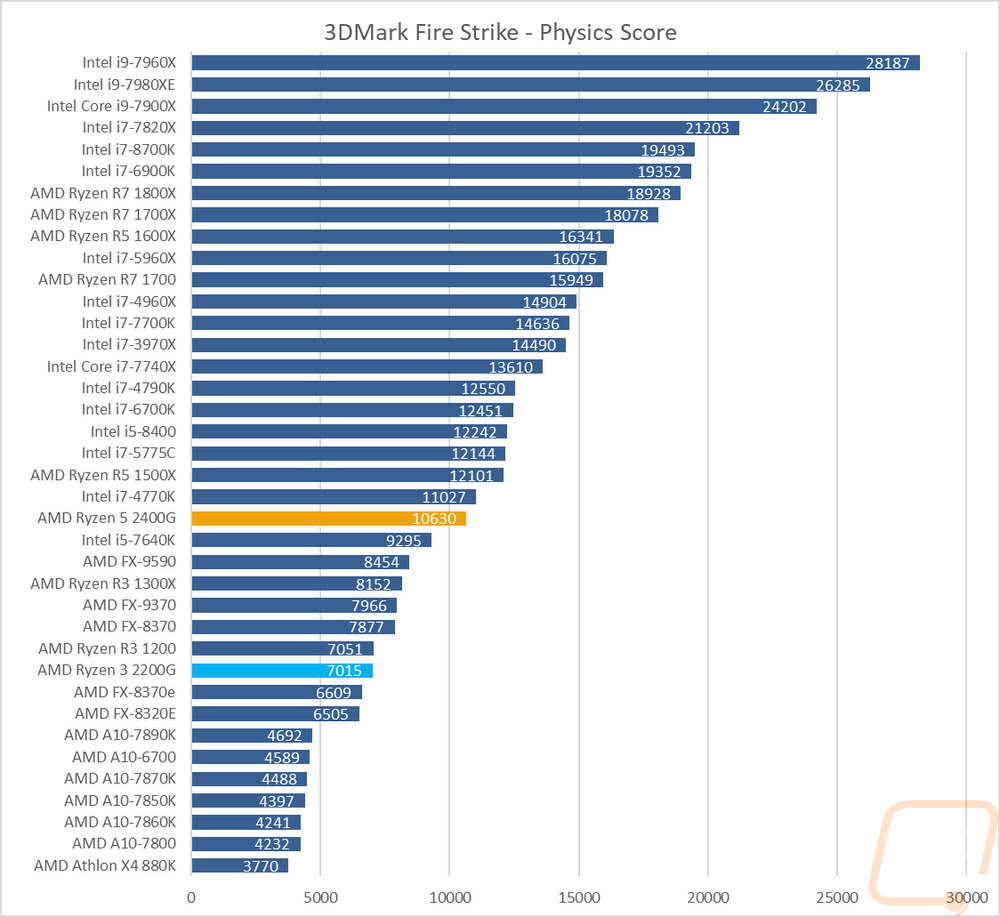
Before getting into in-game benchmarks I also like to take a quick look at 3DMark and Dolphin 5.0. 3DMark most people will know is a synthetic gaming benchmark, I focus on the physics score as it shows the CPU performances while mostly ignoring the graphics card. So here the 2400G and 2200G are much farther apart. The 2200G is down on par with the R3 1200 where the 2400G is up with the i7-4770K and well above the 1300X. Dolphin, on the other hand, is actually a Wii emulator that is known for being very CPU intensive. Here higher numbers are worse and the 200G and 2400G are both up closer to the top and together.
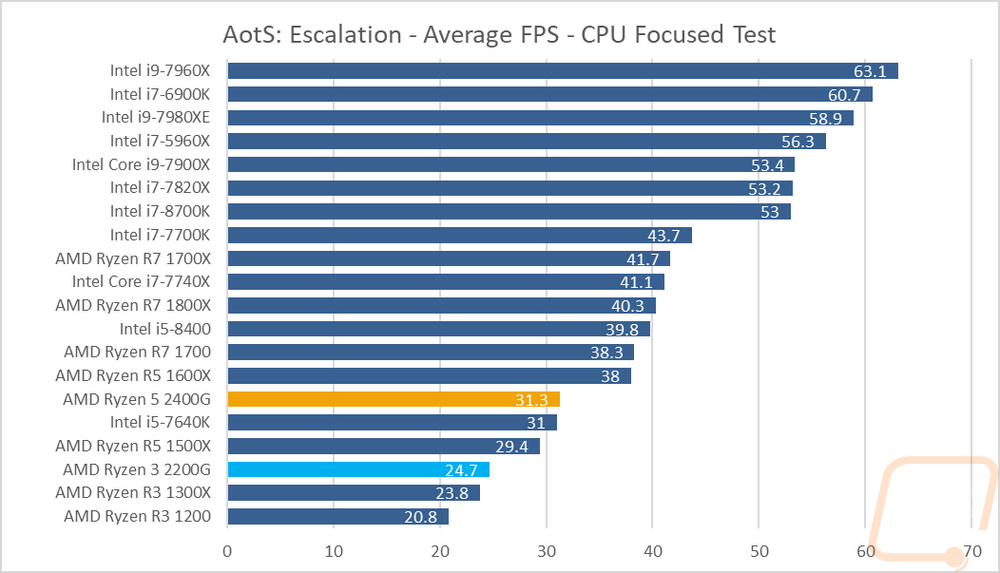
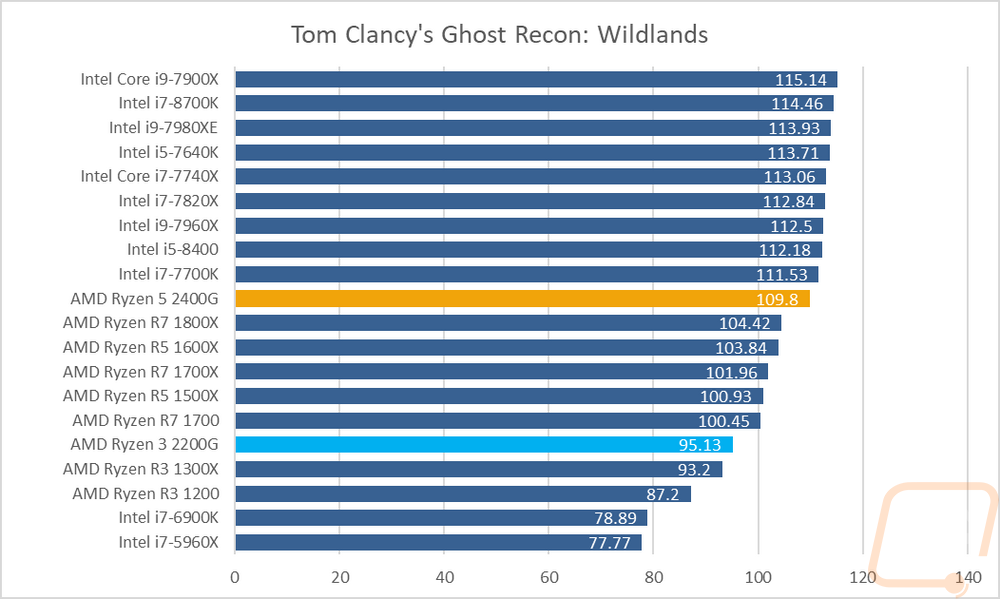
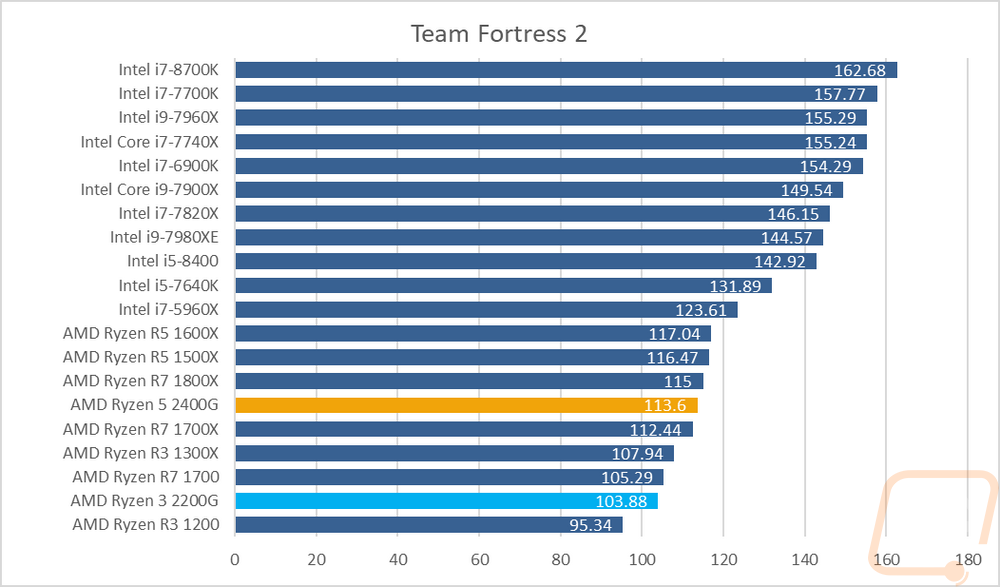
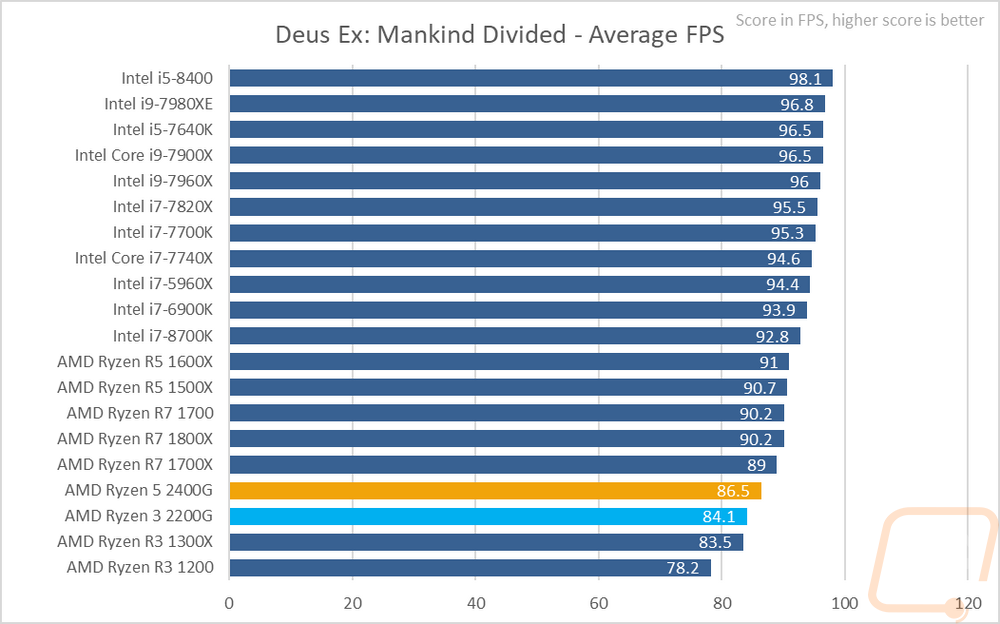
The last few CPU specific tests were all actual in-game performance tests. These are done with the GTX 1080 Ti to prevent a GPU bottleneck. Jump to the next section if you are looking to see how well the onboard GPU performed in game. In the first test, Ashes of the Singularity: Escalation I used the CPU focused test so the gaps between the results are a lot wider than in the GPU focused test. Here the 200G was on par with the 1300X and the 2400G had almost 7 more FPS to be just above the i5-7640K. In ghost recon I found it interesting that the 2400G came in actually at the top for the Ryzen CPUs, I suspect there was some optimization between this test and our original tests but the 14 FPS gap between the 2400G and 2200G is important to note here. Then in TF2, an older CPU limited game, the 2400G was in line with the higher clock speed Ryzen CPUs and the slightly lower clock speeds of the 2200G made a 10 FPS difference. Lastly in Deus Ex: Mankind Divided the 2400G and 200G were a little over 2 FPS apart but near the middle of the Ryzen CPUs, sadly though Intel still dominates in this test.
For my last bit of CPU testing, I ran through a few tests in AIDA64 just to get a look at memory and cache performance. Memory performance with the Flare-X kit was good, not up into the same level as Intel's quad channel CPUs, but on par with the rest of Ryzen. The memory latency was a little high on the 2200G when I tested it though there isn’t any reason that should have happened. Cache performance was good and in line with what is expected and having less L3 cache may also have translated into a little lower latency there as well, or new micro-code updates have improved things.
|
CPU |
Memory Read |
Memory Write |
Memory Latency |
|
Ryzen 5 2400G |
45967 MB/s |
47850 MB/s |
66.6 ns |
|
Ryzen 3 2200G |
35567 MB/s |
36240 MB/s |
118.4 ns |
|
Intel i7-8700K |
38421 MB/s |
40175 MB/s |
57.9 ns |
|
Intel i5-8400 |
38096 MB/s |
40549 MB/s |
59.8 ns |
|
Intel Core i9-7980XE |
77004 MB/s |
68888 MB/s |
73.4 ns |
|
Intel Core i9-7960X |
79416 MB/s |
71554 MB/s |
74.9 ns |
|
Intel Core i7-7820X |
76049 MB/s |
73759 MB/s |
71.6 ns |
|
Intel Core i5-7640X |
30786 MB/s |
31888 MB/s |
68.5 ns |
|
Intel Core i9-7900X |
76856 MB/s |
72856 MB/s |
72.8 ns |
|
Intel Core i7-7740X |
38455 MB/s |
40596 MB/s |
53.2 ns |
|
Intel i7-6900K |
66786 MB/s |
68130 MB/s |
61.9 ns |
|
Intel i7-7700K |
38498 MB/s |
40448 MB/s |
52.7 ns |
|
Intel i7-5960X |
66108 MB/s |
49545 MB/s |
62.8 ns |
|
AMD Ryzen R7 1800X |
44031 MB/s |
43425 MB/s |
81.8 ns |
|
AMD Ryzen R7 1700X |
44493 MB/s |
43749 MB/s |
78.3 ns |
|
AMD Ryzen R7 1700 |
45343 MB/s |
43777 MB/s |
82.6 ns |
|
AMD Ryzen R5 1600X |
44452 MB/s |
43918 MB/s |
83.7 ns |
|
AMD Ryzen R5 1500X |
44289 MB/s |
43746 MB/s |
83.1 ns |
|
|
L1 Cache Read |
L1 Cache Write |
L1 Cache Latency |
|
Ryzen 5 2400G |
485.01 GB/s |
238.29 GB/s |
1.0 ns |
|
Ryzen 3 2200G |
460.55 GB/s |
227.41 GB/s |
1.1 ns |
|
Intel i7-8700K |
1595.6 GB/s |
803.65 GB/s |
0.9 ns |
|
Intel i5-8400 |
1417.2 GB/s |
710.79 GB/s |
1.0 ns |
|
Intel Core i9-7980XE |
3758.3 GB/s |
1896.7 GB/s |
1.1 ns |
|
Intel Core i9-7960X |
3532.3 GB/s |
1785.2 GB/s |
1.0 ns |
|
Intel Core i7-7820X |
1969.9 GB/s |
995.02 GB/s |
1.0 ns |
|
Intel Core i5-7640X |
1044.8 GB/s |
31888 GB/s |
1.0 ns |
|
Intel Core i9-7900X |
2418.5 GB/s |
709.16 GB/s |
1.0 ns |
|
Intel Core i7-7740X |
1102.7 GB/s |
561.25 GB/s |
0.9 ns |
|
Intel i7-6900K |
1963.9 GB/s |
999.59 GB/s |
1.0 ns |
|
Intel i7-7700K |
1114.6 GB/s |
560.82 GB/s |
0.9 ns |
|
Intel i7-5960X |
1748.5 GB/s |
874.60 GB/s |
1.2 ns |
|
AMD Ryzen R7 1800X |
917.46 GB/s |
460.16 GB/s |
1.1 ns |
|
AMD Ryzen R7 1700X |
867.89 GB/s |
435.33 GB/s |
1.2 ns |
|
AMD Ryzen R7 1700 |
793.90 GB/s |
398.12 GB/s |
1.3 ns |
|
AMD Ryzen R5 1600X |
689.47 GB/s |
345.95 GB/s |
1.1 ns |
|
AMD Ryzen R5 1500X |
446.84 GB/s |
224.01 GB/s |
1.1 ns |
|
|
L2 Cache Read |
L2 Cache Write |
L2 Cache Latency |
|
Ryzen 5 2400G |
459.80 GB/s |
232.20 GB/s |
3.1 ns |
|
Ryzen 3 2200G |
352.84 GB/s |
177.56 GB/s |
3.3 ns |
|
Intel i7-8700K |
640.37 GB/s |
397.14 GB/s |
2.6 ns |
|
Intel i5-8400 |
543.81 GB/s |
352.90 GB/s |
3.1 ns |
|
Intel Core i9-7980XE |
1671.7 GB/s |
1069.9 GB/s |
5.6 ns |
|
Intel Core i9-7960X |
1571.6 GB/s |
1003.5 GB/s |
5.1 ns |
|
Intel Core i7-7820X |
884.63 GB/s |
574.74 GB/s |
5.6 ns |
|
Intel Core i5-7640X |
397.26 GB/s |
247.00 GB/s |
2.9 ns |
|
Intel Core i9-7900X |
1037.3 GB/s |
521.94 GB/s |
5.2 ns |
|
Intel Core i7-7740X |
424.55 GB/s |
304.30 GB/s |
2.7 ns |
|
Intel i7-6900K |
710.28 GB/s |
310.34 GB/s |
4.1 ns |
|
Intel i7-7700K |
415.45 GB/s |
285.97 GB/s |
2.7 ns |
|
Intel i7-5960X |
623.08 GB/s |
272.77 GB/s |
3.5 ns |
|
AMD Ryzen R7 1800X |
831.95 GB/s |
446.37 GB/s |
4.7 ns |
|
AMD Ryzen R7 1700X |
809.29 GB/s |
419.38 GB/s |
5.0 ns |
|
AMD Ryzen R7 1700 |
742.92 GB/s |
389.73 GB/s |
5.4 ns |
|
AMD Ryzen R5 1600X |
630.99 GB/s |
334.93 GB/s |
4.7 ns |
|
AMD Ryzen R5 1500X |
306.82 GB/s |
211.58 GB/s |
11.8 ns |
|
|
L3 Cache Read |
L3 Cache Write |
L3 Cache Latency |
|
Ryzen 5 2400G |
222.96 GB/s |
181.60 GB/s |
9.6 |
|
Ryzen 3 2200G |
137.30 GB/s |
171.20 GB/s |
10.2 |
|
Intel i7-8700K |
337.00 GB/s |
213.67 GB/s |
11.0 ns |
|
Intel i5-8400 |
270.89 GB/s |
186.82 GB/s |
13.0 ns |
|
Intel Core i9-7980XE |
229.61 GB/s |
118.40 GB/s |
21.0 ns |
|
Intel Core i9-7960X |
220.22 GB/s |
121.04 GB/s |
19.8 ns |
|
Intel Core i7-7820X |
114.40 GB/s |
103.57 GB/s |
19.2 ns |
|
Intel Core i5-7640X |
228.31 GB/s |
163.86 GB/s |
11.1 ns |
|
Intel Core i9-7900X |
124.16 GB/s |
106.78 GB/s |
21.2 ns |
|
Intel Core i7-7740X |
287.01 GB/s |
186.67 GB/s |
21.2 ns |
|
Intel i7-6900K |
243.96 GB/s |
195.41 GB/s |
14.6 ns |
|
Intel i7-7700K |
234.50 GB/s |
188.70 GB/s |
10.4 ns |
|
Intel i7-5960X |
260.72 GB/s |
184.92 GB/s |
15.3 ns |
|
AMD Ryzen R7 1800X |
388.18 GB/s |
386.01 GB/s |
12.4 ns |
|
AMD Ryzen R7 1700X |
369.75 GB/s |
350.31 GB/s |
12.9 ns |
|
AMD Ryzen R7 1700 |
334.36 GB/s |
332.12 GB/s |
14.2 ns |
|
AMD Ryzen R5 1600X |
386.48 GB/s |
326.86 GB/s |
12.3 ns |
|
AMD Ryzen R5 1500X |
306.82 GB/s |
211.58 GB/s |
11.8 ns |
|
|
Single-Precision FLOPS |
Double Precision FLOPS |
AES-256 |
|
Ryzen 5 2400G |
235.9 GFLOPS |
117.8 GFLOPS |
32388 MB/s |
|
Ryzen 3 2200G |
225.8 GFLOPS |
112.6 GFLOPS |
27603 MB/s |
|
Intel i7-8700K |
825.0 GFLOPS |
412.5 GFLOPS |
29406 MB/s |
|
Intel i5-8400 |
728.8 GFLOPS |
364.5 GFLOPS |
25192 MB/s |
|
Intel Core i9-7980XE |
1831 GFLOPS |
915.5 GFLOPS |
69377 MB/s |
|
Intel Core i9-7960X |
1681 GFLOPS |
840.6 GFLOPS |
65409 MB/s |
|
Intel Core i7-7820X |
944.9 GFLOPS |
472.5 GFLOPS |
36420 MB/s |
|
Intel Core i5-7640X |
536.5 GFLOPS |
268.2 GFLOPS |
18547 MB/s |
|
Intel Core i9-7900X |
1148 GFLOPS |
574.5 GFLOPS |
45506 MB/s |
|
Intel Core i7-7740X |
575.4 GFLOPS |
287.8 GFLOPS |
20503 MB/s |
|
Intel i7-6900K |
1023 GFLOPS |
511.7 GFLOPS |
36340 MB/s |
|
Intel i7-7700K |
575.7 GFLOPS |
287.9 GFLOPS |
20519 MB/s |
|
Intel i7-5960X |
895.5 GFLOPS |
447.7 GFLOPS |
31783 MB/s |
|
AMD Ryzen R7 1800X |
472.4 GFLOPS |
236.2 GFLOPS |
64016 MB/s |
|
AMD Ryzen R7 1700X |
446.8 GFLOPS |
223.4 GFLOPS |
61730 MB/s |
|
AMD Ryzen R7 1700 |
408.5 GFLOPS |
204.3 GFLOPS |
56811 MB/s |
|
AMD Ryzen R5 1600X |
354.9 GFLOPS |
177.5 GFLOPS |
49340 MB/s |
|
AMD Ryzen R5 1500X |
229.8 GFLOPS |
114.8 GFLOPS |
31983 MB/s |
|
|
24-bit Integer IOPS |
32-bit Integer IOPS |
64-bit Integer IOPS |
|
Ryzen 5 2400G |
58.94 GIOPS |
58.98 GIOPS |
29.67 GIOPS |
|
Ryzen 3 2200G |
56.32 GIOPS |
56.32 GIOPS |
28.30 GIOPS |
|
Intel i7-8700K |
370.0 GIOPS |
370.0 GIOPS |
51.55 GIOPS |
|
Intel i5-8400 |
323.5 GIOPS |
323.5 GIOPS |
45.55 GIOPS |
|
Intel Core i9-7980XE |
821.2 GIOPS |
821.3 GIOPS |
121.6 GIOPS |
|
Intel Core i9-7960X |
754.0 GIOPS |
753.9 GIOPS |
114.7 GIOPS |
|
Intel Core i7-7820X |
423.7 GIOPS |
423.7 GIOPS |
63.85 GIOPS |
|
Intel Core i5-7640X |
238.1 GIOPS |
138.1 GIOPS |
33.53 GIOPS |
|
Intel Core i9-7900X |
515.1 GIOPS |
515.0 GIOPS |
79.76 GIOPS |
|
Intel Core i7-7740X |
258.1 GIOPS |
258.0 GIOPS |
35.97 GIOPS |
|
Intel i7-6900K |
255.9 GIOPS |
255.9 GIOPS |
63.96 GIOPS |
|
Intel i7-7700K |
258.0 GIOPS |
258.0 GIOPS |
35.98 GIOPS |
|
Intel i7-5960X |
223.9 GIOPS |
223.9 GIOPS |
55.97 GIOPS |
|
AMD Ryzen R7 1800X |
118.1 GIOPS |
118.1 GIOPS |
59.03 GIOPS |
|
AMD Ryzen R7 1700X |
111.7 GIOPS |
111.7 GIOPS |
55.84 GIOPS |
|
AMD Ryzen R7 1700 |
102.1 GIOPS |
102.1 GIOPS |
51.05 GIOPS |
|
AMD Ryzen R5 1600X |
88.74 GIOPS |
88.73 GIOPS |
44.34 GIOPS |
|
AMD Ryzen R5 1500X |
57.43 GIOPS |
57.45 GIOPS |
28.72 GIOPS |
Onboard Performance
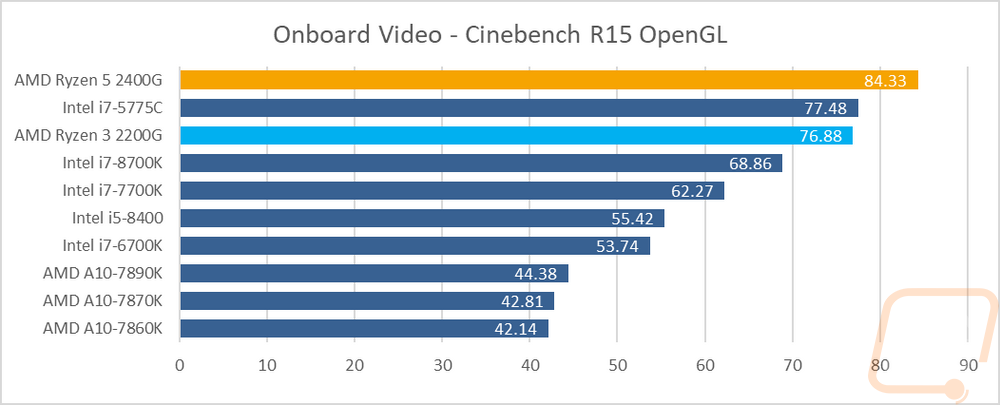
So the CPU performance was interesting because I know people might upgrade later to use dedicated GPUs on their new APUs but the most important thing right now is just how good the onboard performance is. The Vega graphics is what sets these apart from the rest of the Ryzen lineup and the potential of having passable onboard performance that can actually be used for gaming is exciting. To start things off I ran the OpenGL test in Cinebench R15 and the results were promising. The 2400G topped the charts by a good margin and even the 2200G was right there on par with the i7-5775C that Intel brought out a few years ago that had great onboard performance.
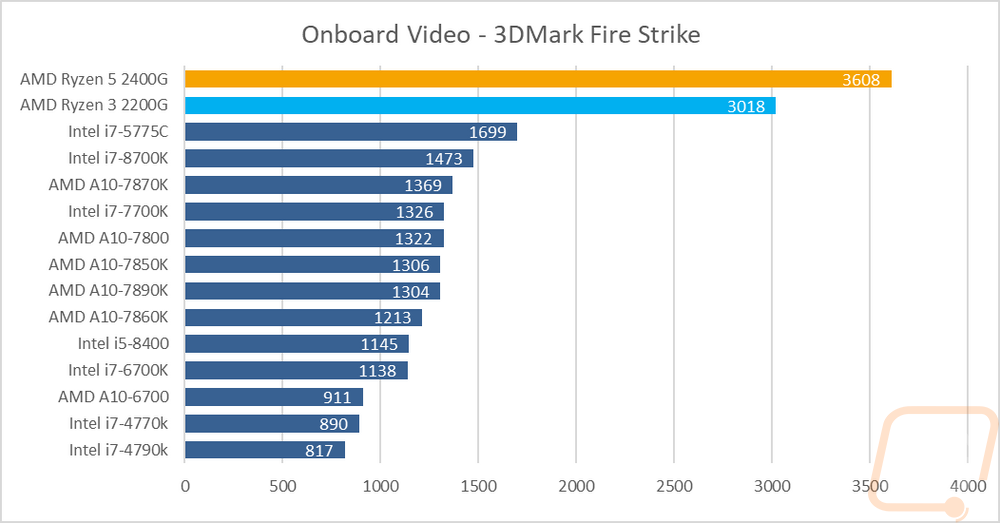
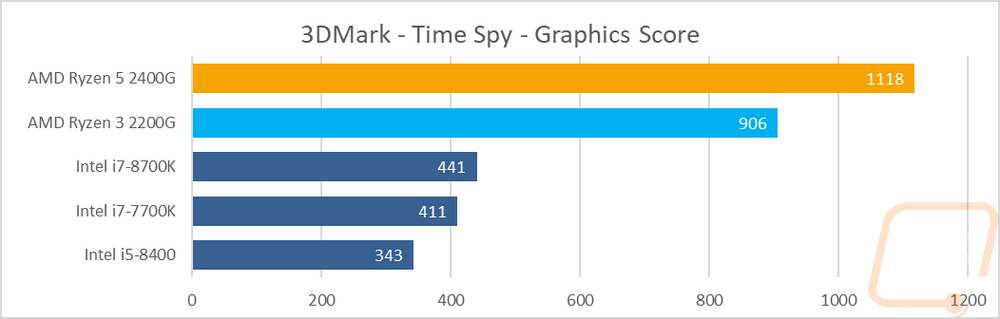
From there I wanted to check out the synthetic benchmark 3DMark using both the Fire Strike and Time Spy tests. These test DX11 and DX12 performance. In Fire Strike, I think the results speak for themselves. Both APUs dwarfed all of the other CPUs with onboard and while the 2400G has a big lead over the 2200G it is had to tell with how far they are both ahead of the 5775C and everything else. Time Spy wasn’t really any different as well, with the 2200G doubling performance and the 2400G doing even more than that.
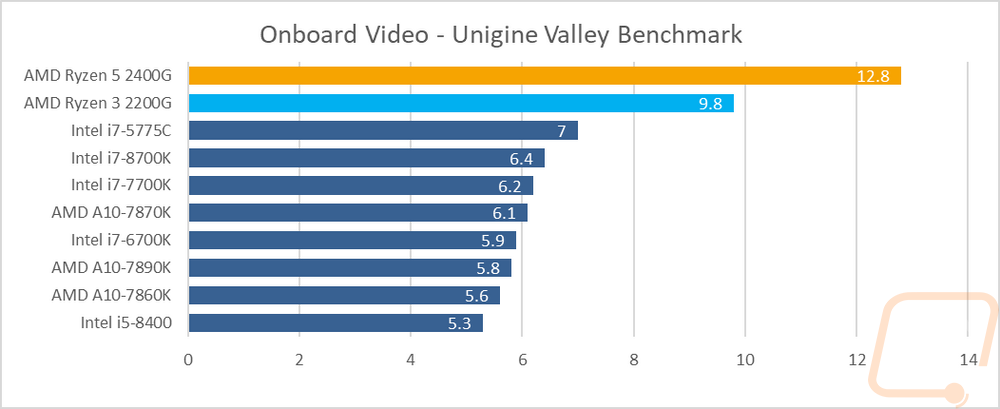
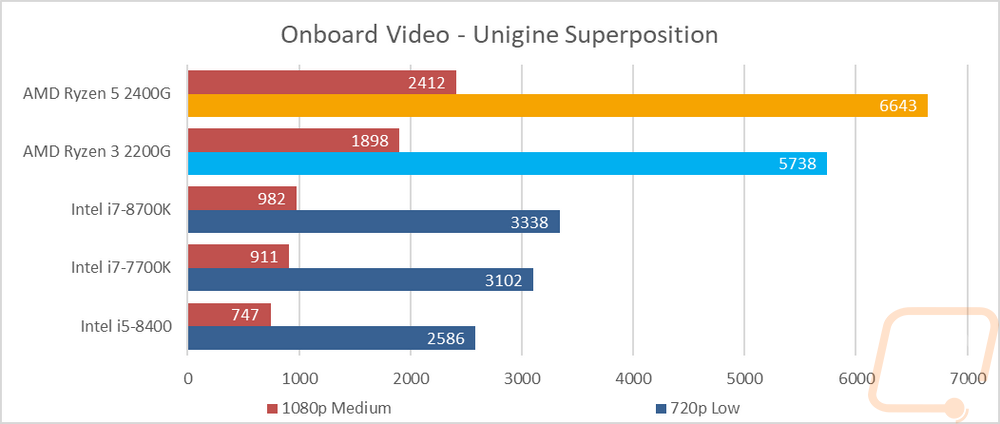
For Unigine based tests I used the old Valley Benchmark as well as the new Superposition test. With Valley, I tested using the ExtremeHD setting and the FPS results were once again well above everything else though not at an FPS that I would consider smooth at all. In Superposition, I tested using the 1080p Medium setting as it is a more realistic benchmark as well as the 720p low setting. Who would have ever thought you would see a low-end Ryzen 3 product with twice the performance of the much more expensive i7’s that launched months ago.
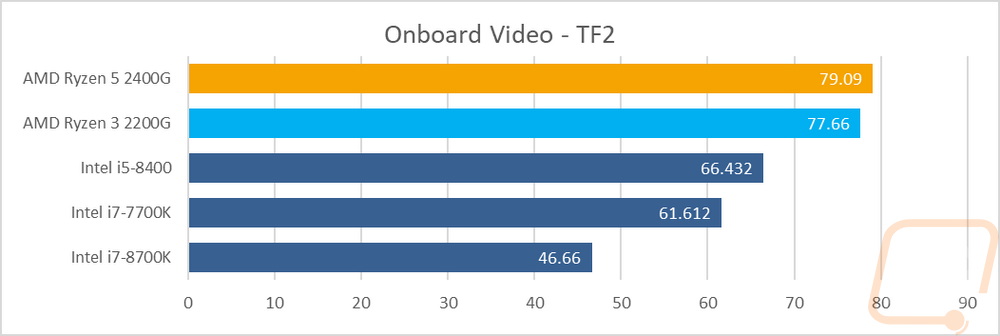
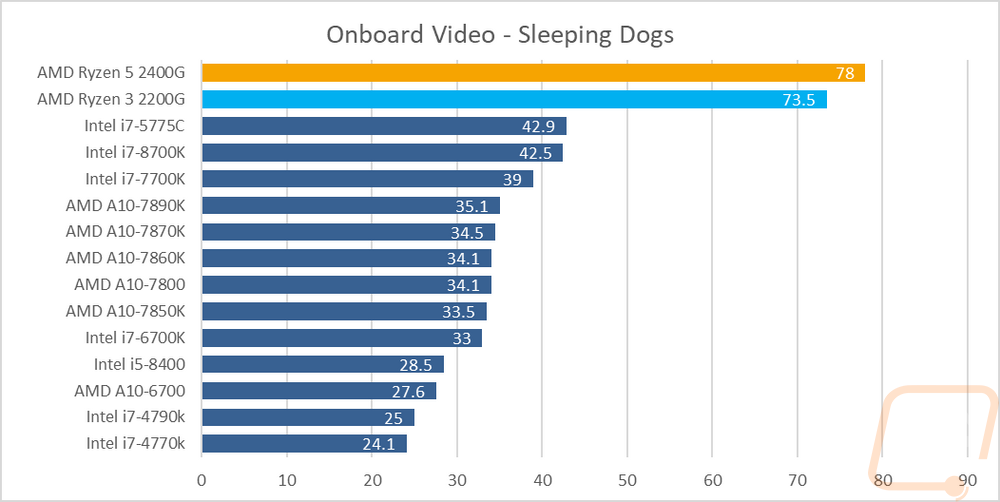
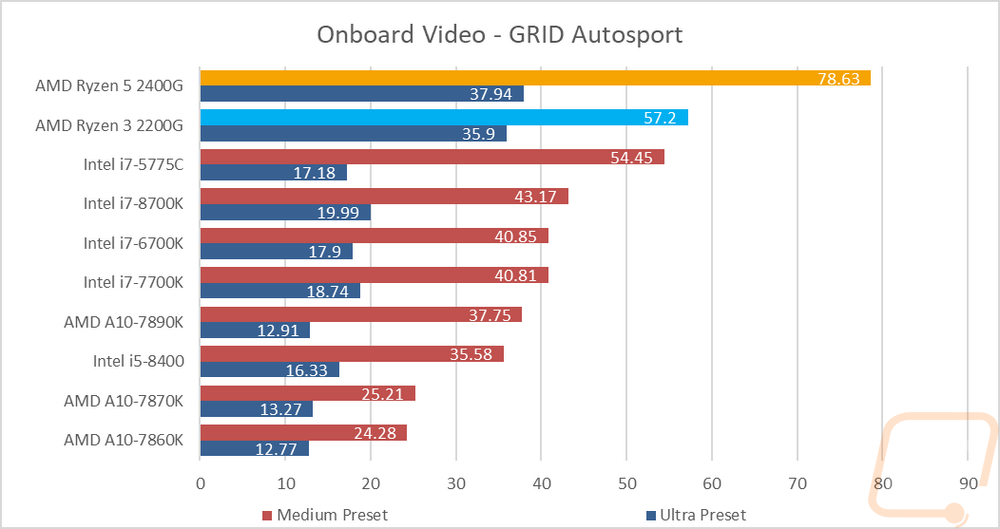
For the rest of my testing, I focused on actual game benchmarks. In TF2 it is an older game that as we saw in the CPU testing is a lot more CU limited so the gap between the two APUs and the rest of the CPUs tested wasn’t as large but they did still do much better. Imagine how well these would perform with a Ryzen 7 CPU attached. Then in the rest of my tests, each game showed over and over that the 2400G and 2200G are worlds above anything else on the DIY market for onboard performance. The biggest thing to take away from these results though was that almost all of the results actually have an FPS up to or above 60 FPS so you can expect smooth gameplay. This is something that every new APU has promised in the past but didn’t really give. Now all of those in that range are at 1080p on medium settings, Grid Autosport, for example, showed that turning things up to Ultra did drop the performance down into the 30 FPS range, but even then they were still both twice as fast as everything else. Now I did try to test using a new game as well with Ghost Recon Wildlands and both APUs played the benchmark but I had trouble with the game locking up at the end of the test every time. I didn’t have any issues with this when testing with a dedicated GPU so I’m curious as to the reason for this, but I did want to warn everyone in case there are other compatibility issues with the game with the current drivers.
Power Usage and Temperatures
For my last bit of testing, I couldn’t let the Ryzen 5 2400G and Ryzen 3 2200G get through the office without taking a look at their power usage and temperatures. Especially given all of the Ryzen testing I did with ITX coolers a while back, I wanted to see how these compared to see if they will be great as a tiny decent LAN rig.
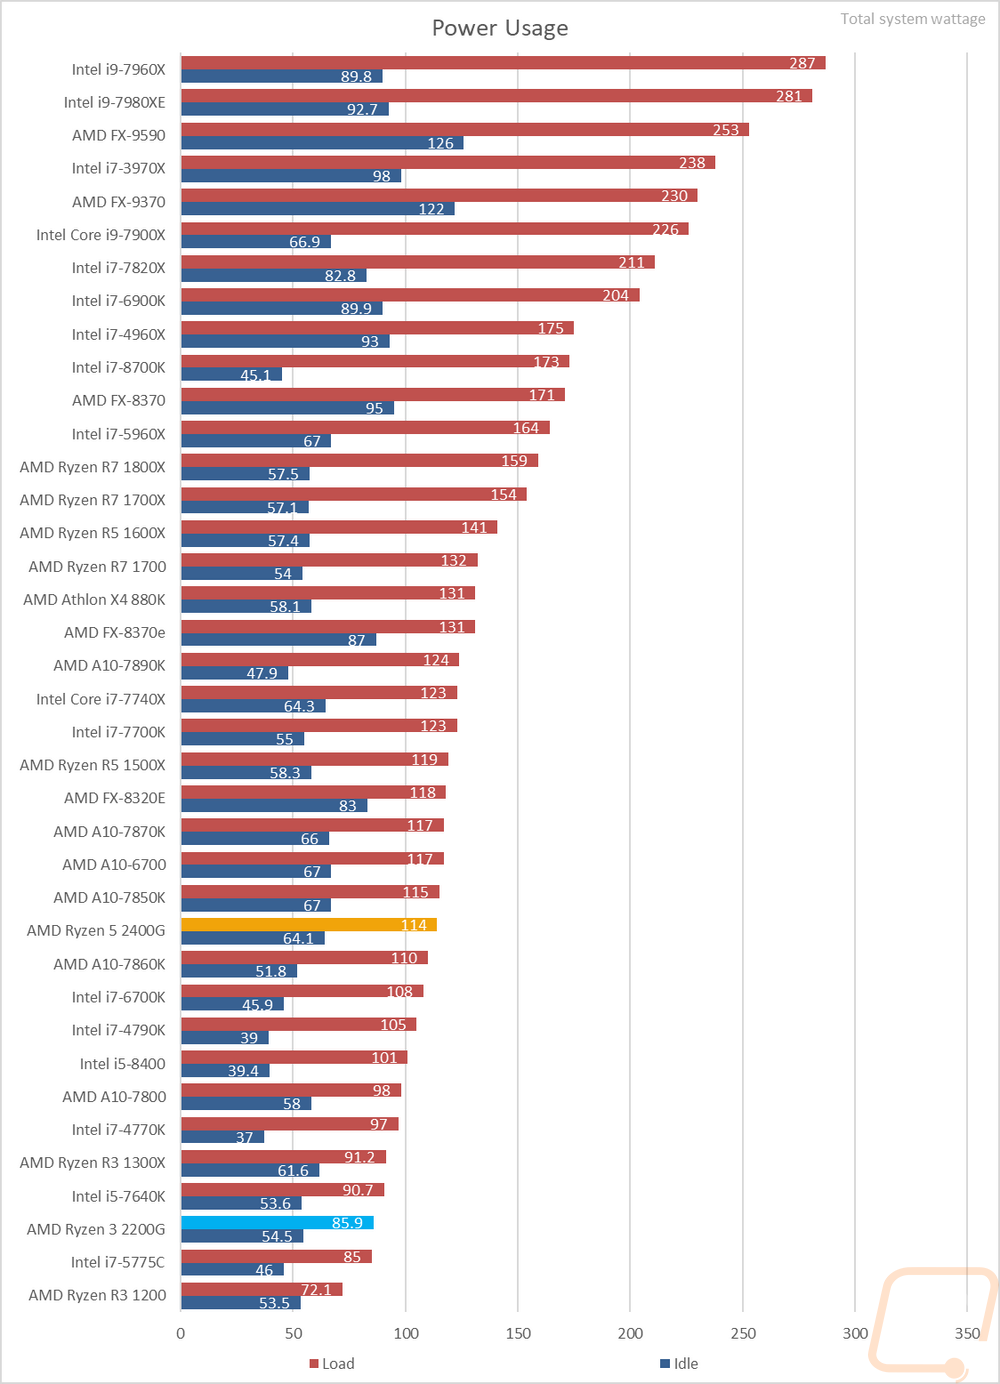
So the first thing I wanted to take a look at was overall power usage. To do this I test our idle and load wattage for the entire system using a Kill-A-Watt. Idle is done without running anything obviously and the 2200G came in at 54.5 watts and the 2400G pulled a little more at 64.1 watts. Then for load wattage, I tested just the CPU, not the onboard to compare it with the other CPUs tested using wPrime to make sure each core was maxed and saw 114 on the 2400G and 85.9 on the 2200G. This put the 2200G in just under the 1200X and the 2400G with the 1500X as expected.
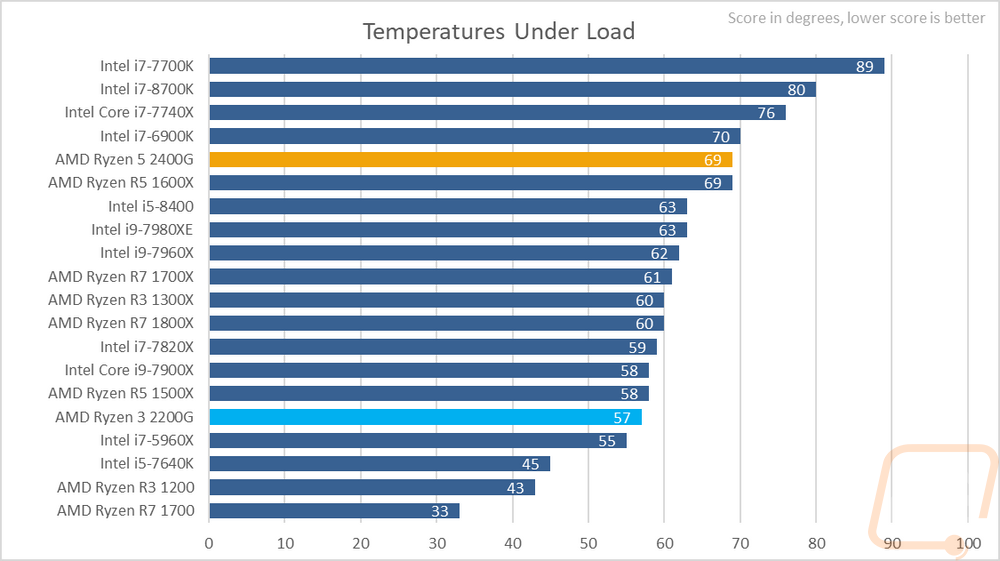
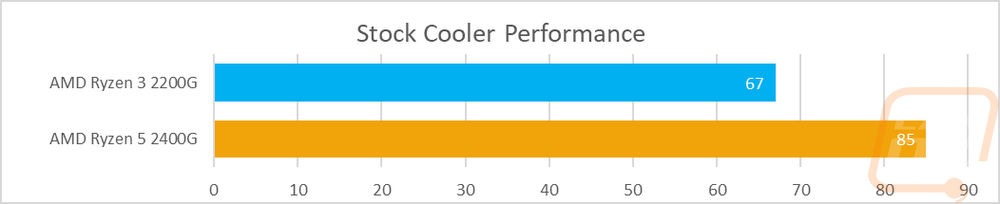
Then for temperature testing, I jumped into AIDA64 and ran their stress test using the FPU only setting because it heats things up the most. I did this using our Noctua NH-U12S cooler but I was a little surprised by my results. In fact, I did them a few times, reseating the heatsink on the 2400G. The 57 degrees of the 2200G was about what I expected but I thought the 2400G would be able the same. They have the same TDP and the 2400G doesn’t run that much higher in clock speed and this test was only checking with CPU power, not any onboard video adding heat. Swapping to the stock cooler I did the same tests. The Wraith Stealth didn’t perform the best in my Ryzen cooler testing so I wanted to confirm that it would be okay with these CPUs. What I found was that it was fine for the 2200G but the 2400G was actually running into some thermal throttling for me. I suspect that our 2400G heat issues are related to AMD's change to thermal paste under the heatspreader. Maybe ours doesn’t have the best application, but I do know that I would look at using an aftermarket cooler for both CPUs if given the chance. The included cooler is fine for a while but something more efficient including one of the other Wraith coolers would be much better suited to keep things cool.
Overall and Final Verdict
Well after a normal few day testing project turned into a few week-long disaster lol, I can finally sit down and reflect on my experience with AMD's new Raven Ridge APUs. First let me say that this might be the first time I’ve had to include a section talking about the issues I had, but at the end of the day (well more like the end of the week) it looks like the issues might be mostly localized to me and at most some weird driver compatibility issues between Nvidia and AMD. I don’t want to focus on those too much here because once I got them figured out most things ran really smoothly. More importantly, once I finished testing and really had a chance to check out the numbers. What AMD is doing here on the onboard graphics side of things is impressive. Onboard has for a while basically been relegated to being just enough to make you want to upgrade to some sort of dedicated video card and for most people, myself included I wouldn’t have it any other way. But there are a lot of situations where more power would be helpful in a package that can’t fit a video card. Not to mention the additional cost.
Both the Ryzen 5 2400G and the Ryzen3 2200G actually have enough gaming performance where you could build a rig without a dedicated GPU and be fine to play most games at medium settings and most of the “e-sports” titles like LoL, CS:GO, and DOTA 2 should run great. You would only need to upgrade later when you get the urge to get into new blockbuster titles or less optimized games (cough PUBG).
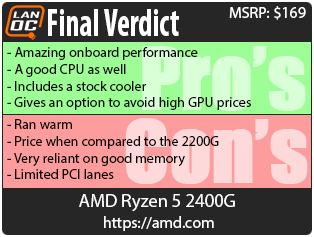
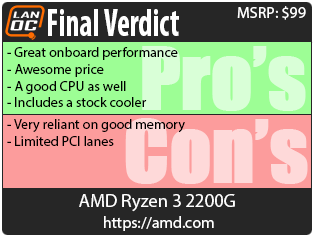
Now the 2200G and 2400G aren’t really high-end CPUs, they were designed to be mid-range so keep that in mind if you plan on upgrading later. The CPU performance is in line with where they are in the market, but it did become a bottleneck in a few of my tests. That said the performance, like any of the CPUs launched in the past year, is still a big improvement over what we were stuck with before Ryzen came in and rocked the market. These are both 4 core 8 thread CPUs where before at these prices you were getting scraps at best.
The onboard performance was the biggest difference between the two APUs. The 2400G has 11 Vega CUs compared to 8 on the 2200G so it did show a big difference in testing. It also had a little more clock speed on both the GPU and CPU as well. This translated to more heat as well though. So much so that our sample seemed to have throttling issues when using the stock cooler. I love that they included them, especially with the 2200G’s price point. But if you plan on pushing the 2400G you might need to look at an upgrade later.
Now the lower L3 cache on both of these do mean that if you plan on adding a dedicated GPU right away you would be better off going with a regular Ryzen CPU. But hey remember AM4 allows you to be able to upgrade all the way up to the higher end CPUs later if needed. Raven Ridge also has lower limits on PCI Lanes so you only get 8 PCIe 3.0 lanes so upgrading to a GPU is still possible but could be limiting later, especially if you are running a full ATX board that would basically have a useless slot because of it.
The other downside with these APUs was that they are dependent on high-speed memory. This isn’t a surprise to anyone who has been following Ryzen. The infinity fabric that ties everything together is clocked with the memory, so faster memory is going to benefit you. Doing so will cost a little more as well, not enough to turn me away from either of them but it is something to keep in mind.
Speaking of pricing, the Ryzen 5 2400G has an MSRP of $169 right now and the Ryzen 3 2200G comes in just under $100 at $99. For starters, the 2200G is a steal! Think about how much more it would have cost you to build a 4 core 8 thread PC with at least some gaming competence a year ago. Pair that with a cheap motherboard and you are going to end up spending more on memory to get 16 gigs than you would the CPU and motherboard! Now the 2400G is a lot more expensive and the value does drop a little, but it was also noticeably faster in all of my tests so you do get something for that investment. I don’t know if it is worth $70 more, but it is still a good deal.
More importantly being able to get by with some basic gaming performance is a huge deal with now with GPUs being hard to find and expensive when you do. Because of that, I can see Raven Ridge being an interim solution for a lot of people trying to wait out the crazy prices. They both also look promising for budget builds and HTPC builds.
Live Pricing: HERE
Live Pricing: HERE


