CPU Performance
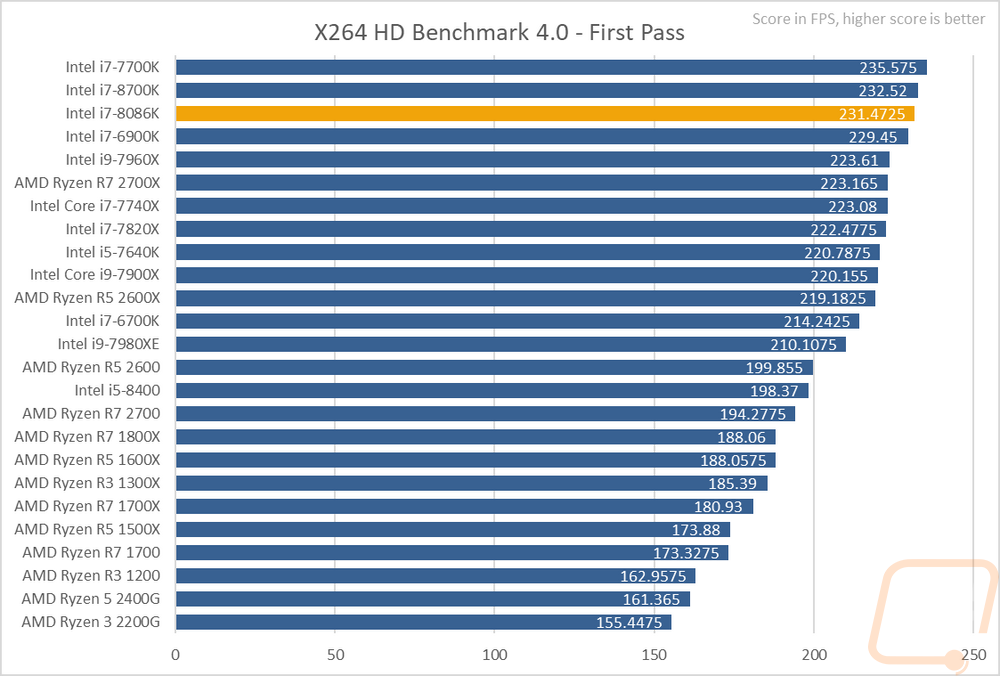
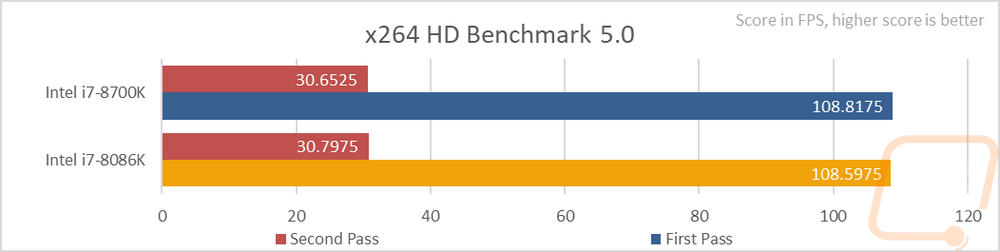
Well, we can finally dive into the performance. Our test suite has expanded a lot to try to bring in more multi-threaded loads with the core wars starting. Most of those are expanding our editing and production tests. But to start things off I have one of our classic encoding tests, the X264 HD Benchmark 4.0. Here the Intel CPUs have always done extremely well as this older encoding benchmark likes clock speeds more than core count. The i7-7700K (pre spectra updates) is still at the top but I suspect that the Spectra updates would fix that. As for the 8700K and 8086K that I am the most interested in, they are about 1 FPS apart with the 8700K coming in ahead surprisingly. I have also gone ahead and added in the X264 HD Benchmark 5.0 as well to give that test a refresh and the two CPUs basically come in exactly the same with .4 of an FPS between them. Being a new test you can expect to see me going back and filling it out later with some of the past CPUs.
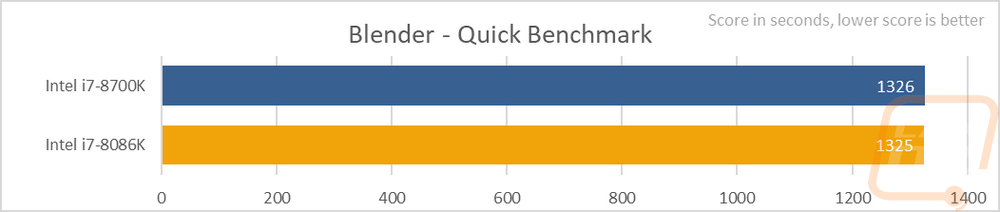
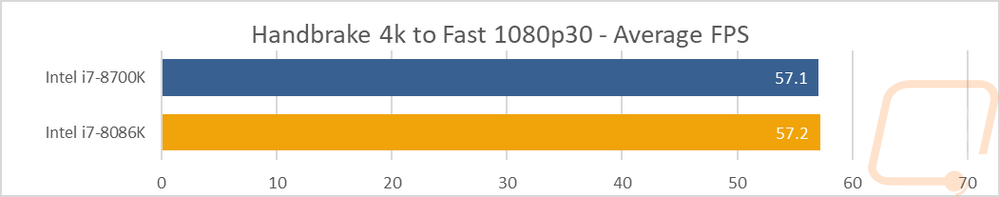
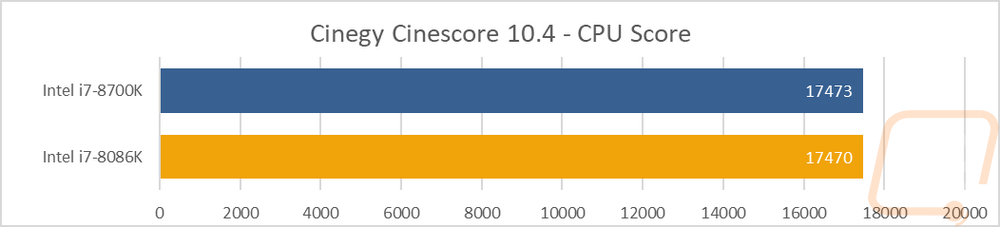
Speaking of our new benchmarks, here are three of them. With Blender, I am using their new timed benchmark. Even the quick benchmark mode takes a while, but it does run through two renders the classic BMW scene and then the longer classroom scene. The times are combined and a lower score is better. The 8700K and 8086K came in almost exactly the same, with just one second between them. In our Handbrake test, I use the 2D 4k60 version of the Big Buck Bunny movie and rip it down using the Fast 1080p30 preset. Near the end of the render, I take the average FPS. Once again both CPUs were basically exactly the same, with just a .1 FPS difference. The i7-8086K was the one that came out ahead. The next test is also a video production test, this is the Cinegy Cinescore 10.4 test. Cinegy is a real media video editing platform. The benchmark runs through a lot of different situations going all the way up to 8K tests across a whole stack of formats for each resolution. For this one I focused on the CPU score and no surprise, they were within 3 points of each other. With the being 8700K was slightly ahead.
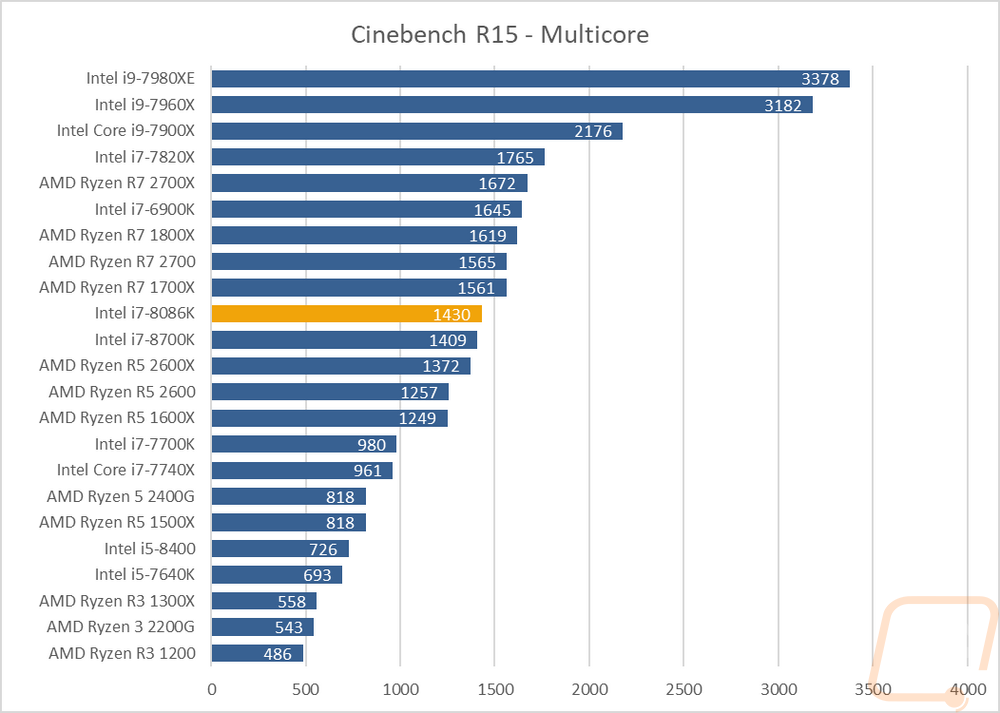
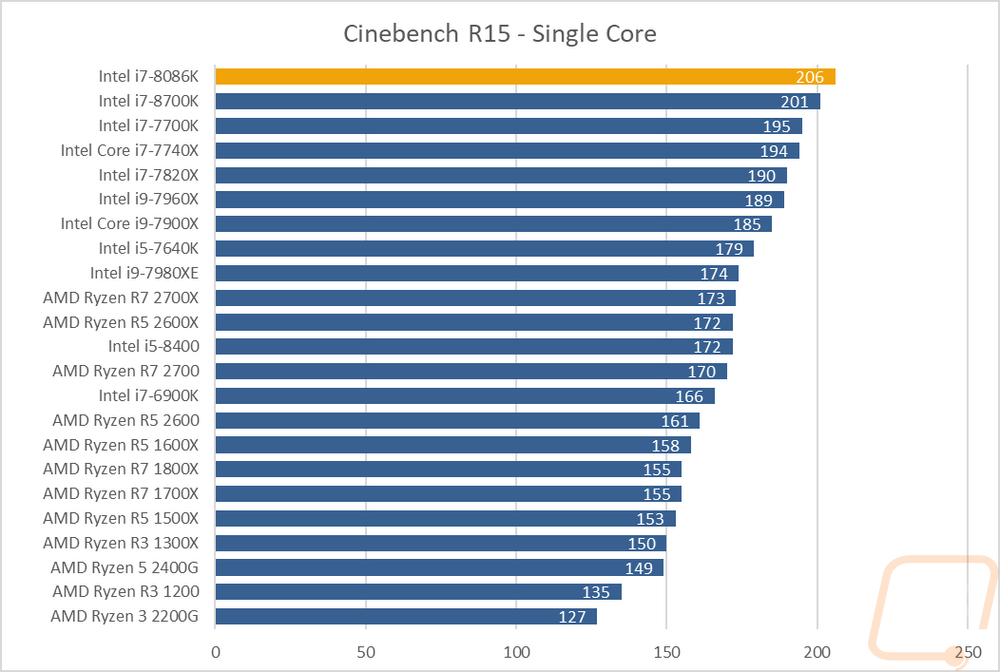
I didn’t forget about my favorite benchmark, Cinebench R15. The reason I love this test is because it lets us look at both single and multi-threaded results to get a good look at both of those situations with the same test. Bonus points because over the last few years we are finally seeing Intel and AMD also promote these results, mostly because of the push for more cores. Anyhow in the Multicore test, the 8086K is just above the 8700K, putting it just behind all of the 8 core Ryzen CPUs. Switching to just one core the 8086K jumps to the top of the charts. The 8700K was the fastest before, so it isn’t a big surprise that the same CPU with a higher base and boost clock would perform well here.
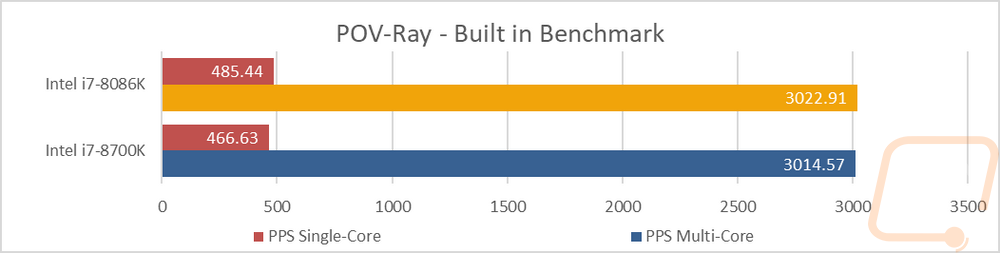
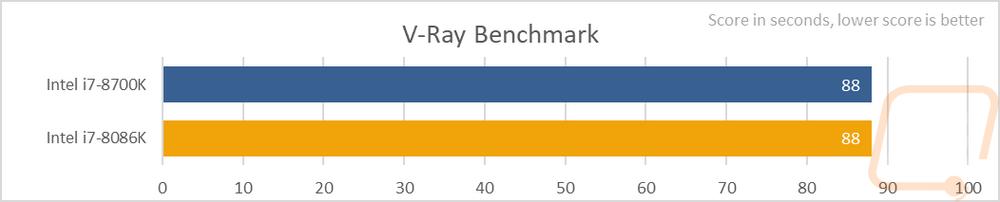
Two more new tests! These are a little trendy given Nvidia’s recent announcements but I actually added them before that. So we have POV-Ray and V-Ray benchmarks, two different ray tracing benchmarks. The POV-Ray benchmark uses the POV-Ray benchmarking guidelines on their website including their benchmark scene. This one is especially cool because it tests with a single core and all 6 cores/12 threads. The 8086K did especially well in the single core test, but it came out ahead in both results. Then the V-Ray benchmark is the standalone benchmark directly from Chaosgroup and it is a simple test that runs on the CPU then again on the GPU. For now, the CPU result is all I needed and both CPUs ended up with the same 88-second score. I can’t wait to get more testing done with the rest of our CPUs to see where everything else lands. I just added these new tests last minute and figured if nothing else giving everyone the change to be able to test their current CPU and compare would be better than hold them back for our next coverage.
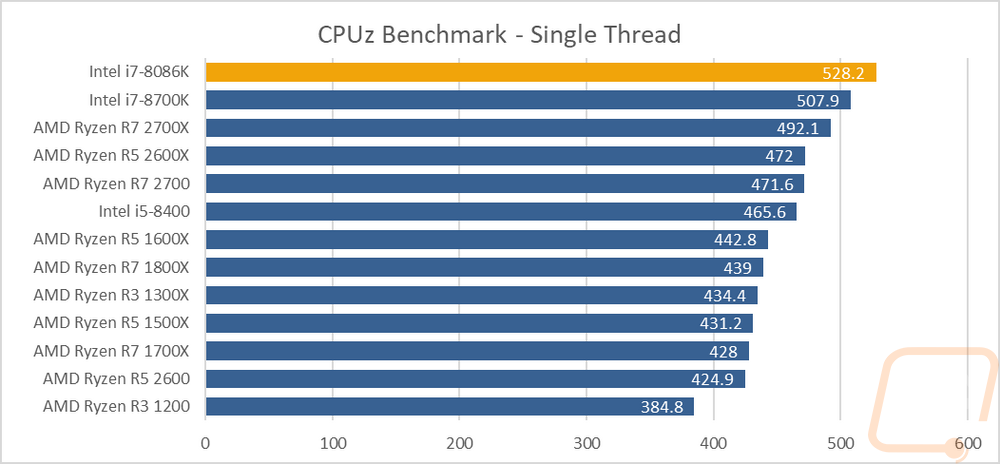
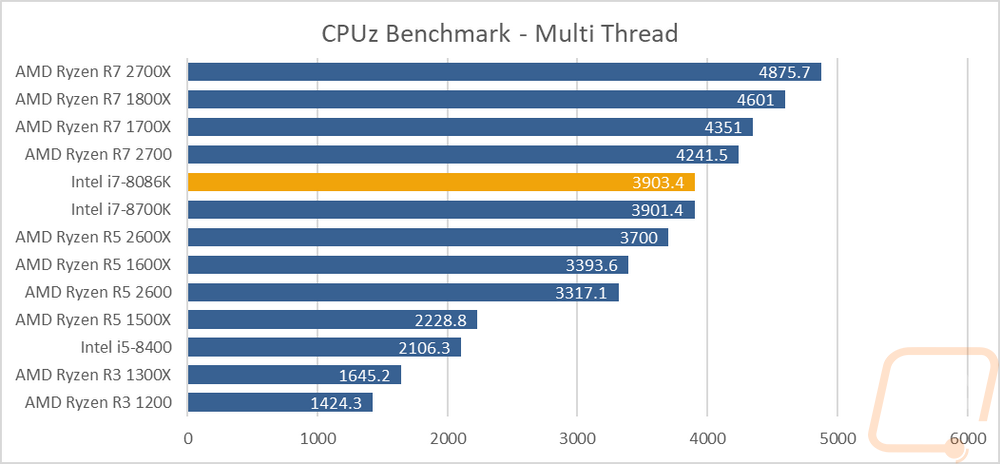
 Our next test is the built-in benchmark in CPUz, this is also another single and multithread test. In the single threaded test, the 8086K was well ahead of the rest of the CPUs tested with the 8700K being the next closest result 21 points lower and the Ryzen 2700X below that by another 15 points. The multi-threaded test, on the other hand, has the 8068k down lower below all of the 8 core Ryzen CPUs. It is up above all of the Ryzen 6 cores and the 8700K as well though only by a tiny margin on that one.
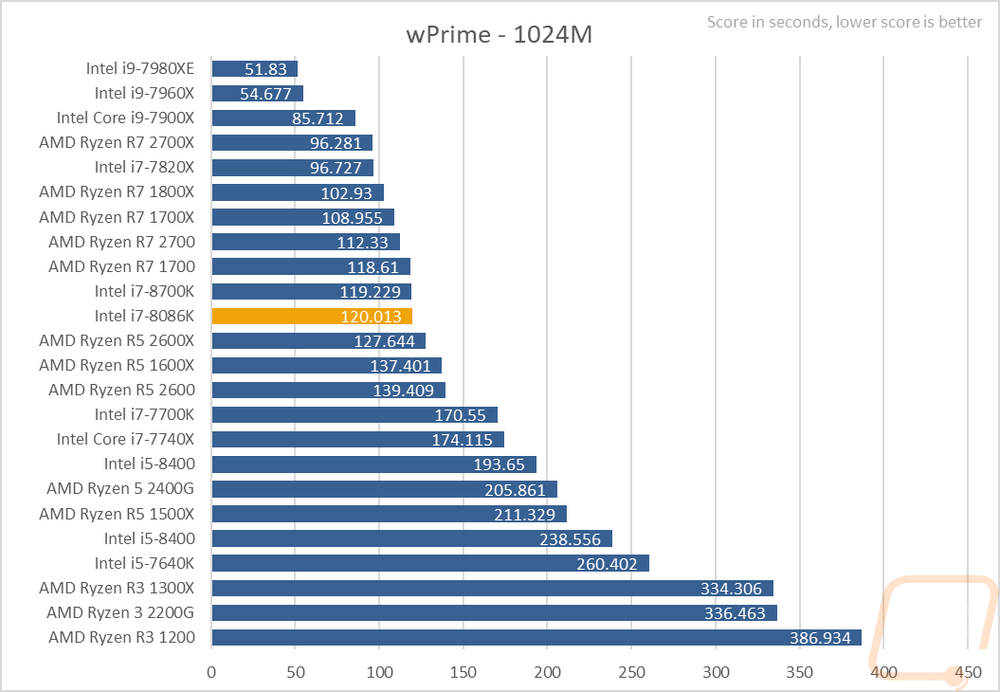
 For a math-based test, we have wPrime that calculates Pi to 1024 million characters and times in. This test the higher core count CPUs did much better including all of the Core-X CPUs up at the top. The 8086K, on the other hand, was still right there with the 8700K, actually performing a little worse by about .8 of a second. Now, this is still above the 2600X but below all of the 8 core Ryzen CPUs again.
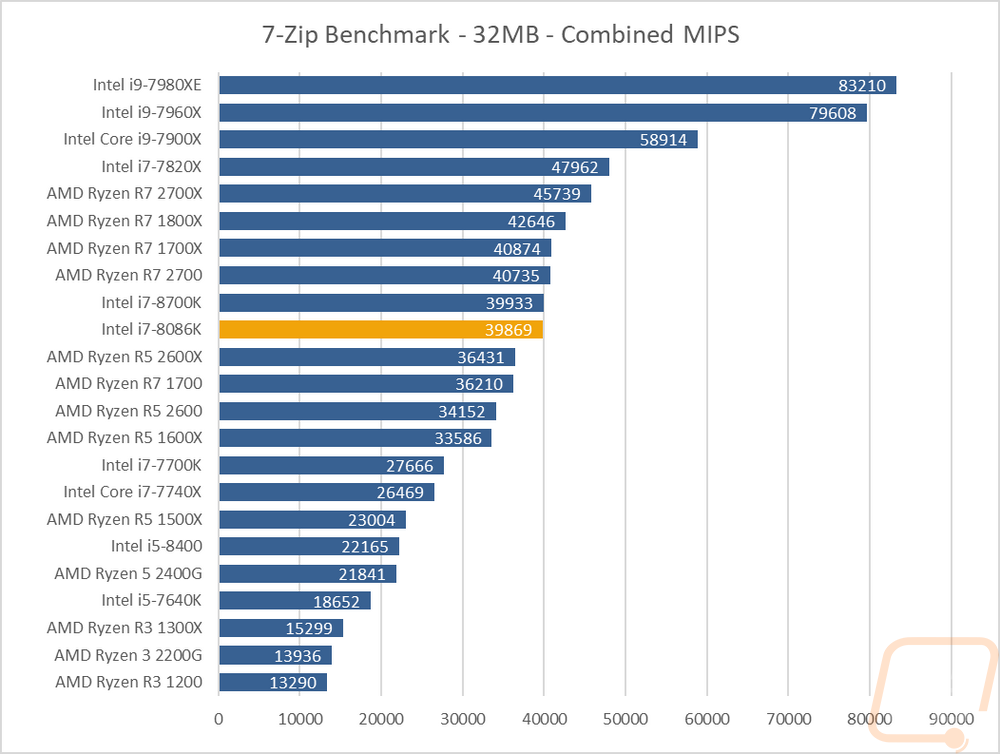
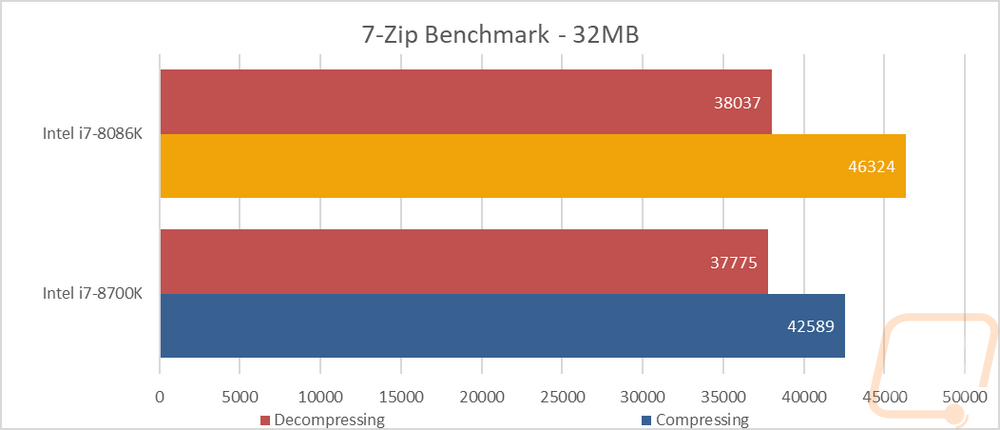
For 7-Zip I did our normal combined MIPS test where we use the combined performance of compressing and decompressing. But I also added in individual results for compressing and decompressing as well. The 8080K came in just behind the 8700K and once again behind all of the 8 core Ryzen CPUs. The new results show a little more though with the compressing performance of the 8086K noticeably better than the 8700K but decompressing was better on the 8700K slightly.
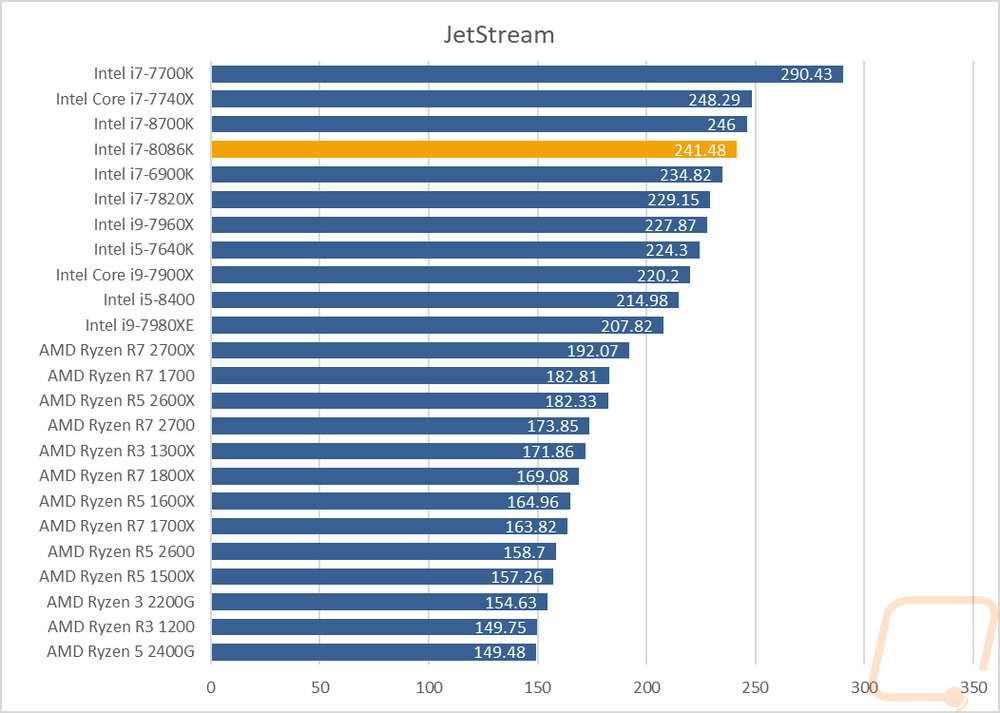
I always like to slip in a look at normal everyday web browser performance because for most people that is the most used program on their PC. Th test I used is the Jetstream test where it runs a long list of available browser benchmarks for Java and HTML5 and averages them all out into a score then retests two more times for an overall average. This test has always favored the Intel CPUs and it was no different this time. The 8700K did score slightly better than the 8086K though.
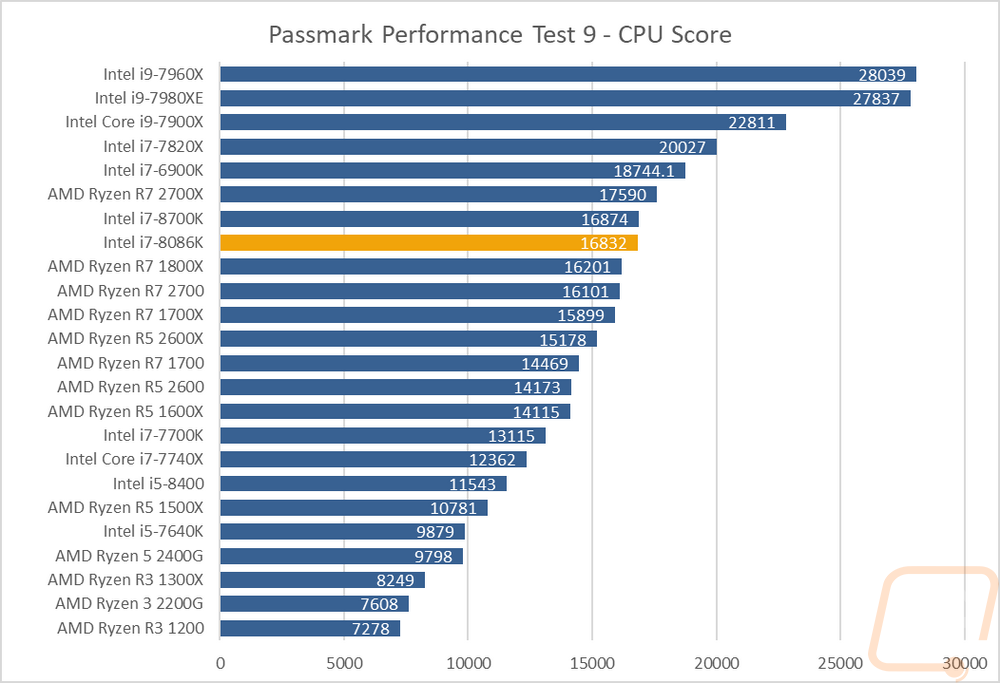
I tested using the Passmark Performance Test 9 CPU benchmark. This touches on a few synthetic tests covering different aspects. The overall score is then put together. Here once again the 8700K did come out ahead by a few points on the otherwise matching numbers. The Ryzen 2700X was ahead of the two but beyond that only the high core count Core-X Intels are higher.
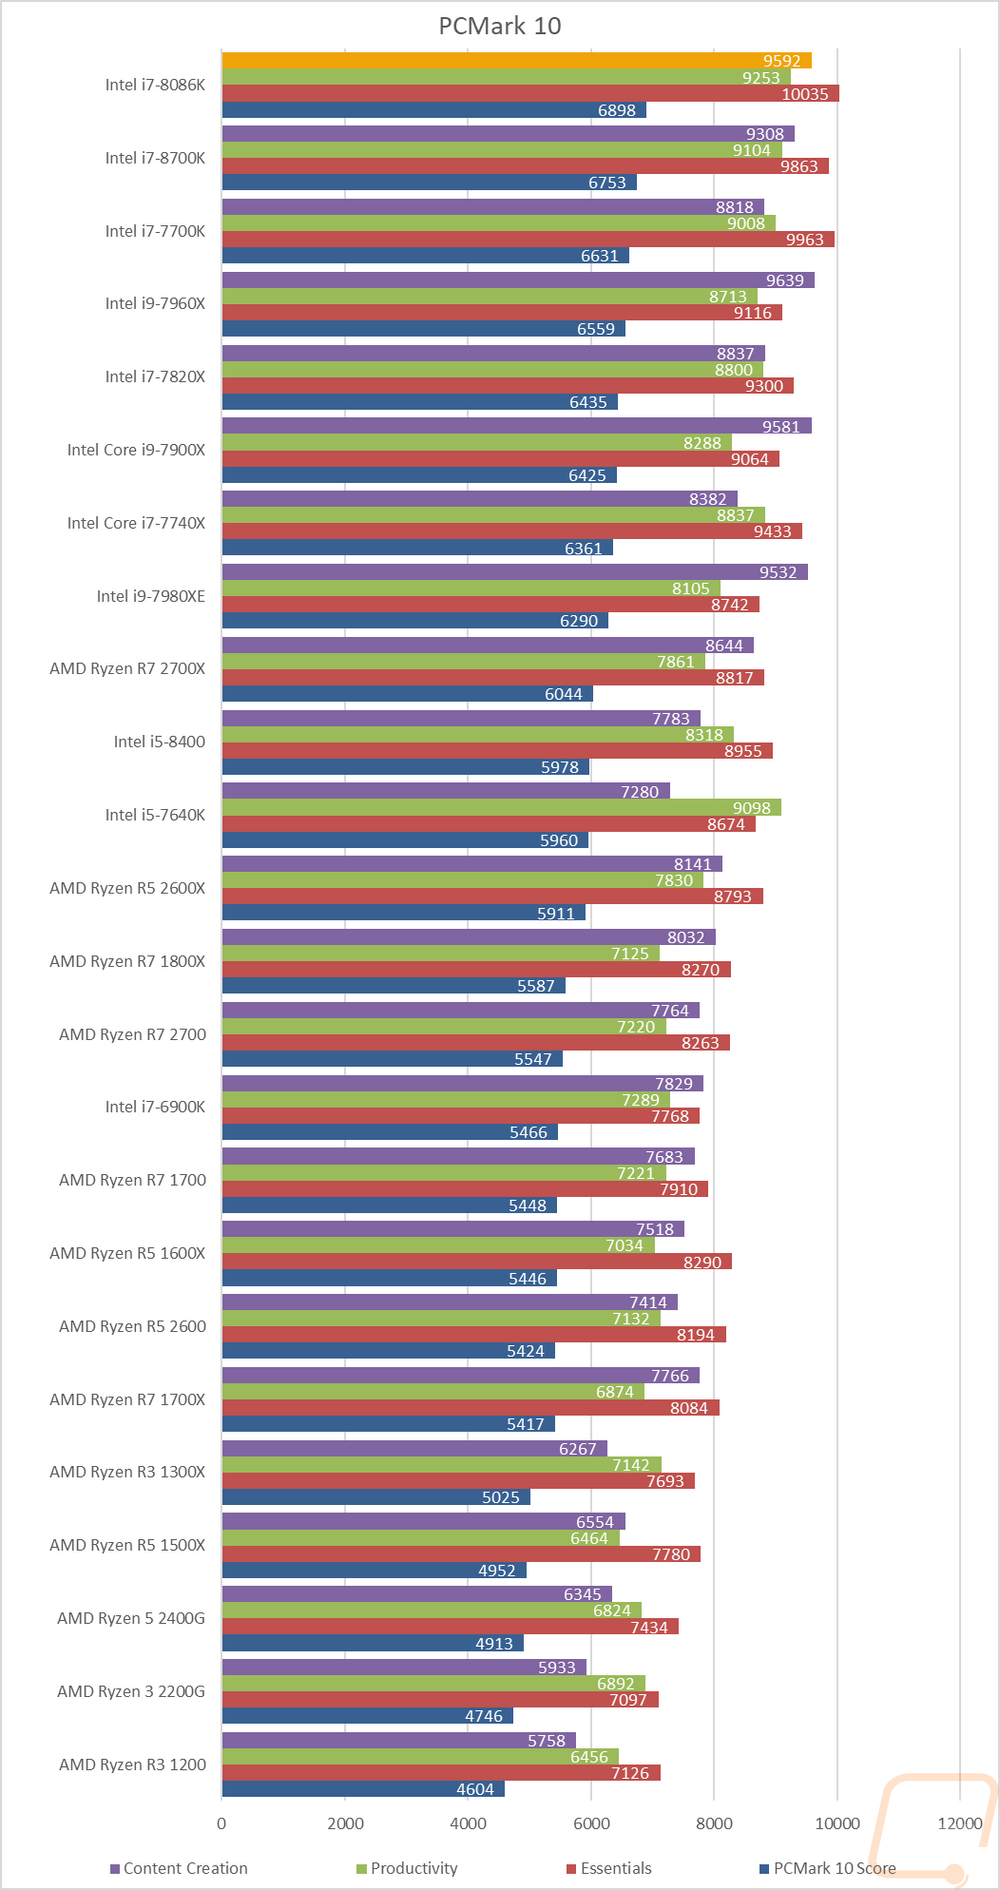
For a nice overall test I love using PCMark 10 because rather than a series of synthetic benchmarks, they use real-life situations like video calls, word processing, spreadsheets, and other work and home workloads. Because a lot of those favor clocks speeds over high thread counts, the 8068K did extremely well here, at the top of the charts in fact. This is one of the tests where it pulled ahead of the 8700K, better representing the higher clock speed than in other tests.
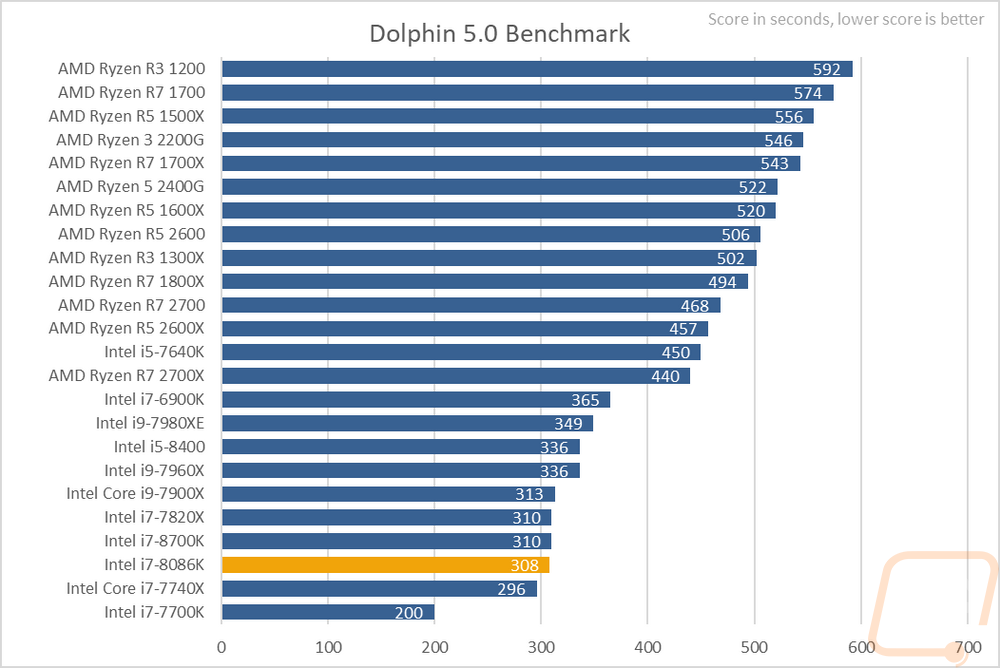
Dolphin 5.0 is a Wii and GameCube emulator and I love to use it to take a look at potential emulator performance, especially given how CPU heavy they are. The 8086K did really well here, coming in just before the 8700K and above even all of the Core-X CPUs. The Ryzen CPUs fair even worse in this specific case, filling up the entire bottom half.
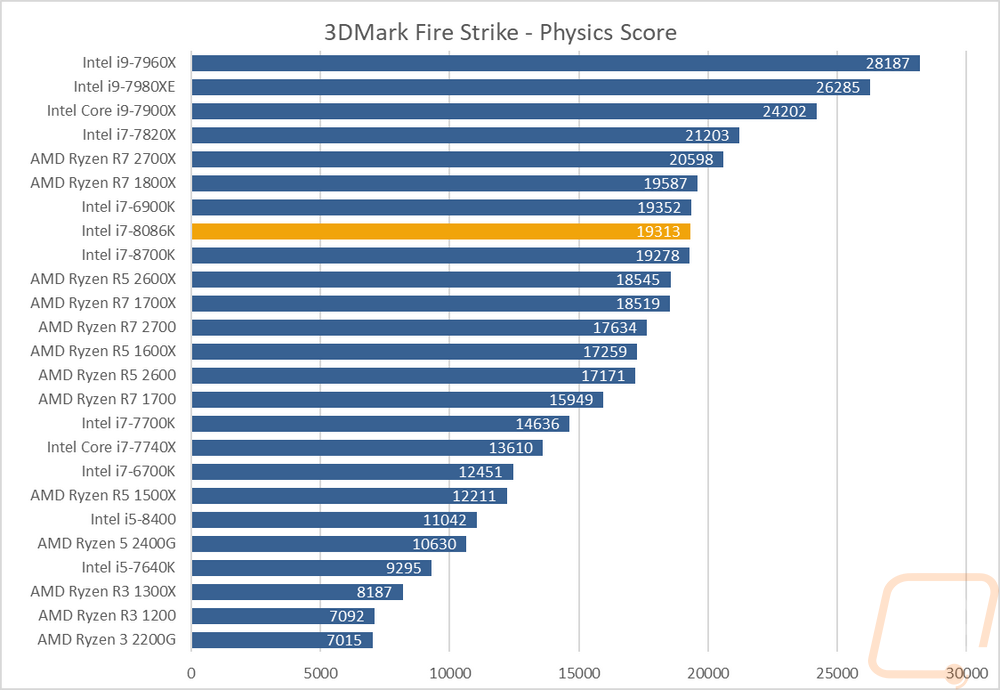
3DMark doesn’t really show exactly what FPS you will get in game, but it is a good fair benchmark that offers repeatable results. In this test, the 8086K and 8700K were both just below the 1800X and 2700X as well as all of the Core-X CPUs. This put it well above the Ryzen 6 core CPUs, including the newer 2600X.
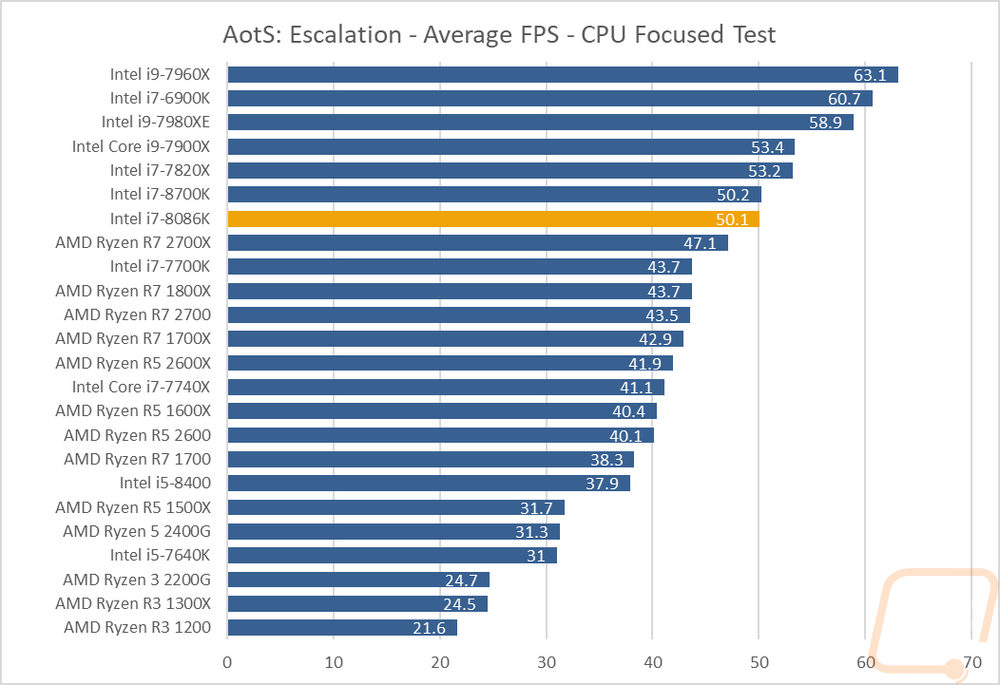
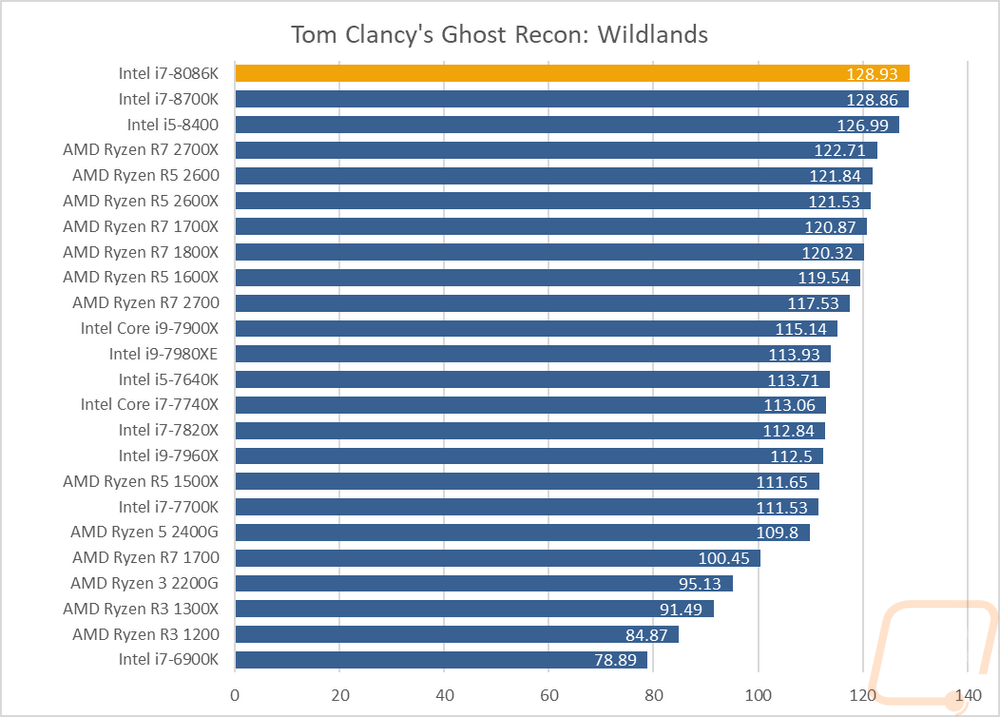
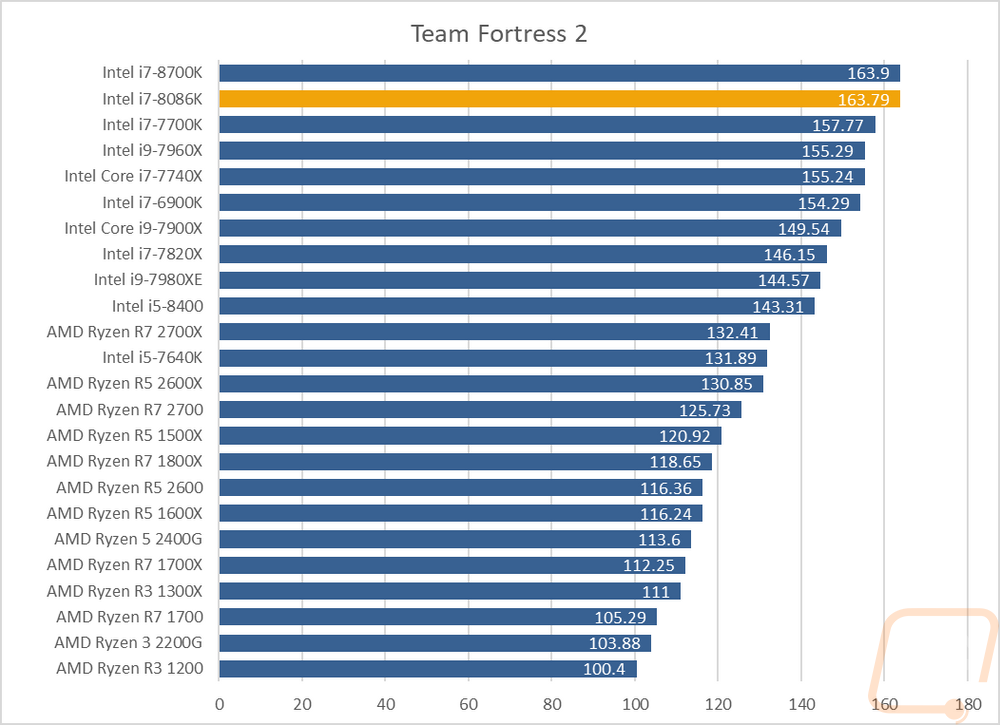
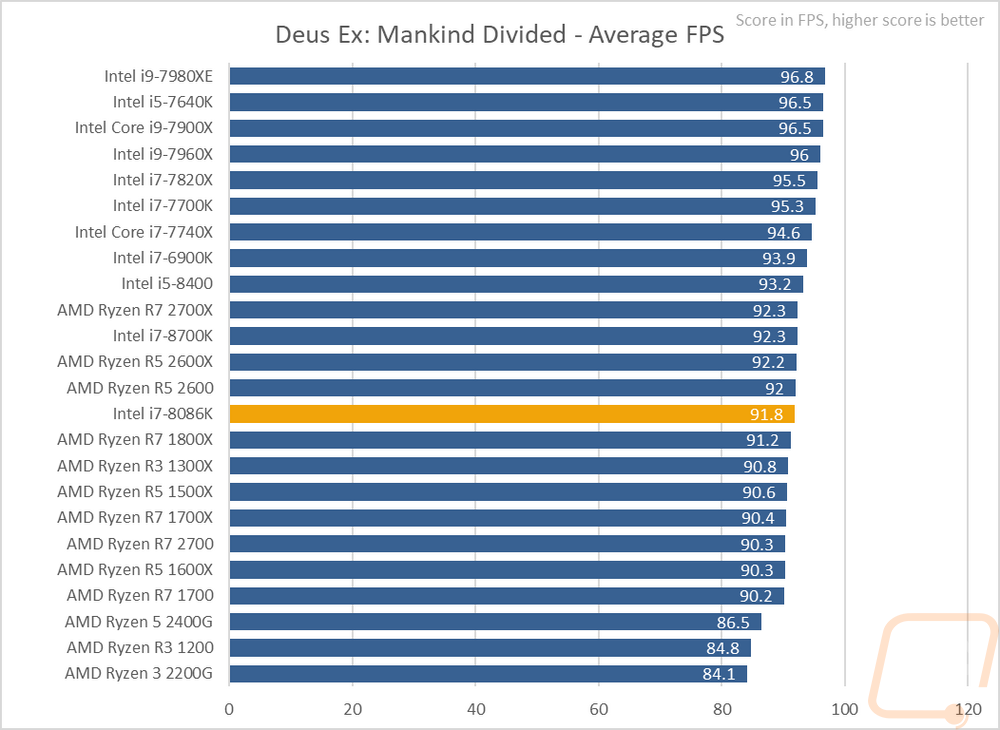
Finally, we have a few real in game benchmarks to take a look at. I try to keep a mix of tests so I include the CPU heavy Ashes of the Singularity using the CPU specific benchmark. The 8086K and the 8700K were basically the same then all of the Core-X CPUs filled out the rest of the top. The 2700X, even with its additional cores was down a little lower than the 8086K. In Ghost Recon Wildlands the 8086K did extremely well, coming in at the top of the charts with the 8700K, of course, chomping at its heels. This was a good 6 FPS up above the 2700X. For an old CPU limited game, we have TD2 and the 8700K and 8086K are once again up at the top only this time the 8700K edged out a .11 FPS lead. Then for the last test, we have Deus Ex: Mankind Divided where all of the CPUs are extremely close with the exception of the bottom three Ryzen CPUs. That said the 8086K didn’t do as well here.
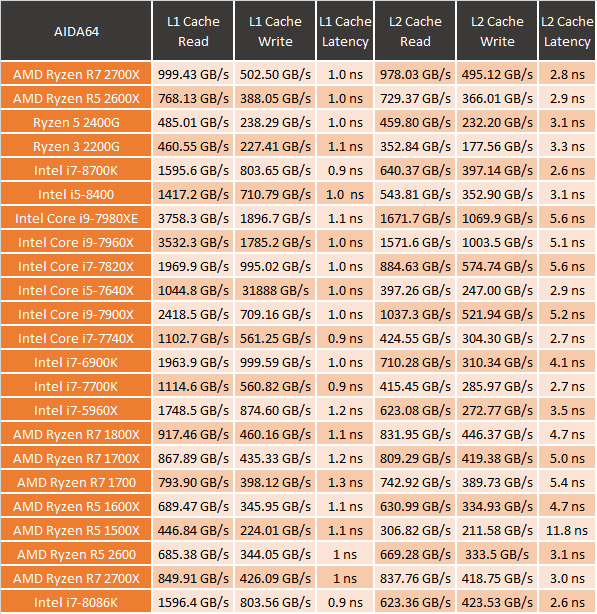
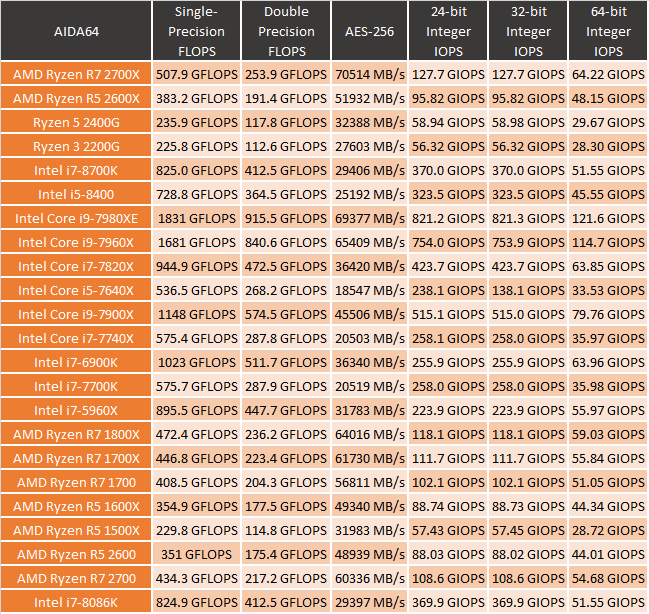
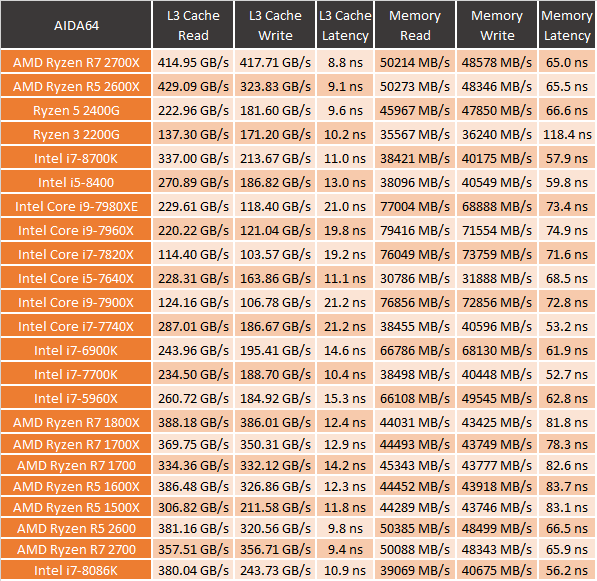
I also include a few tests from ADIA64 to take a look at Cache and memory speeds and latency as well as a few Precision FLOPS and Integer IOPS tests. There is just too much information to pack into a few small graphs though so I have the tables below. The 24 and 32-bit Integer IOPS of the 8086K are great when compared to Ryzen (right in line with the 8700K overall). Overall though all of the results are right there with the 8700K so no big surprised here, not that I expected any.