CPU Performance
Okay, we can finally dive into the testing. I’ve expanded our CPU testing with more multi-core focused workloads and I had the time to do retesting with the AMD Ryzen 2000 series CPUs to get a good look at the 9900K compared to the 2700X. I’ve also added a few more games into our testing as well, Intel is advertising this as the best gaming CPU on the market so I wanted to see it in a few more modern games.
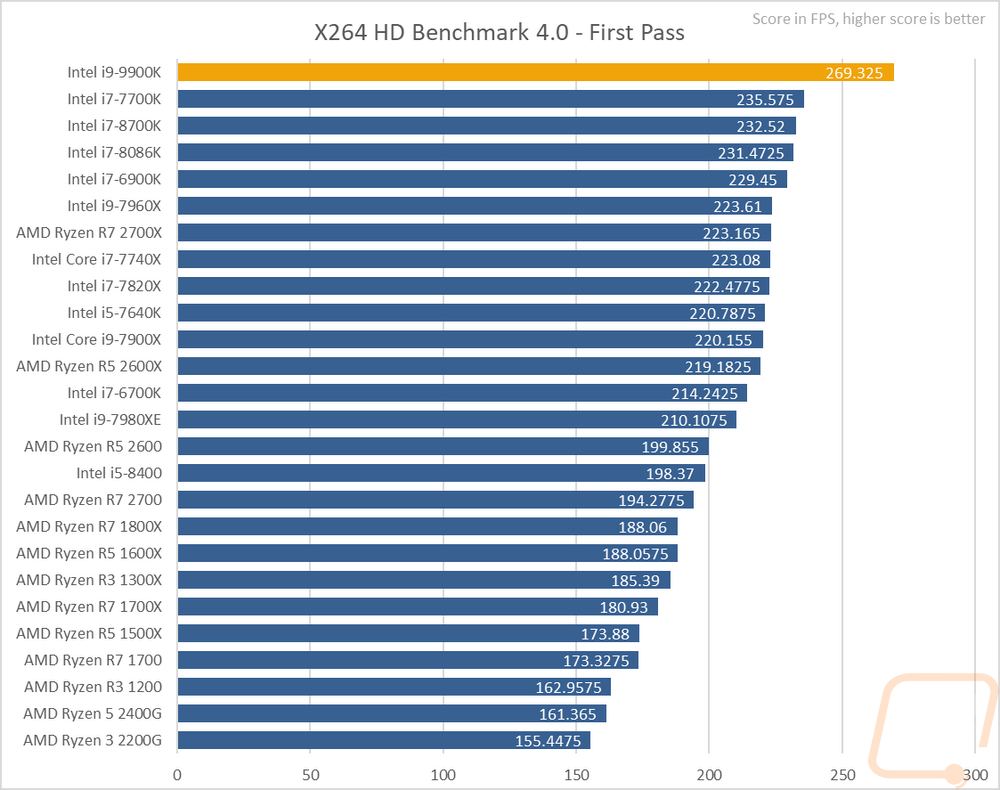
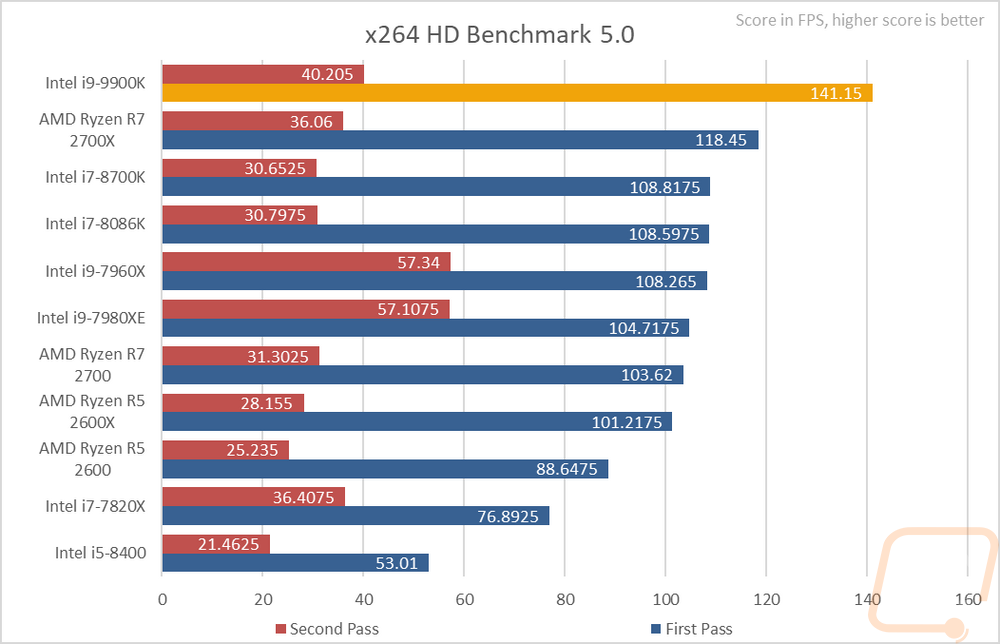
My first two tests were both X264 encoding focused. I used the older HD Benchmark 4.0 test and then the HD Benchmark 5.0 test. In both tests, the 9900K topped the charts. This was surprising because some of the high core count CPUs from Intel are in the mix of these tests as well. The 7960X and 7980XE did outperform in the 5.0-second pass, but with the longer first pass the combination of 16 threads and clock speeds beat out the Ryzen 2700X by 22 FPS.
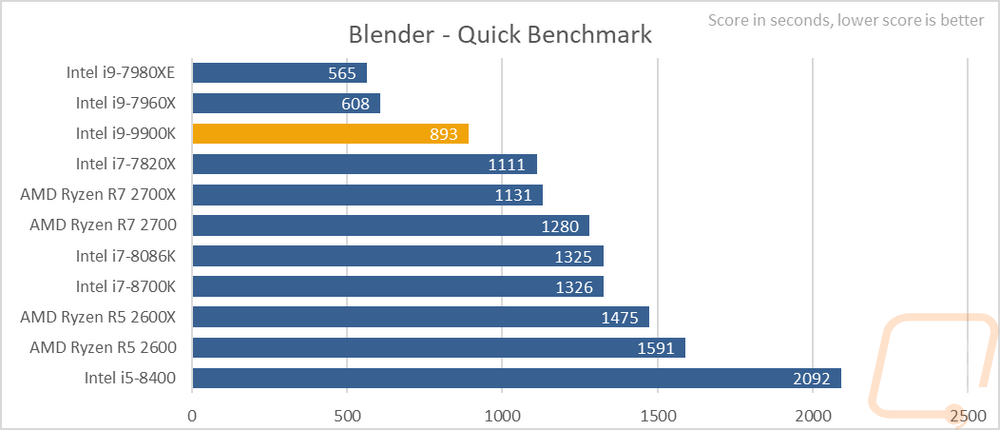
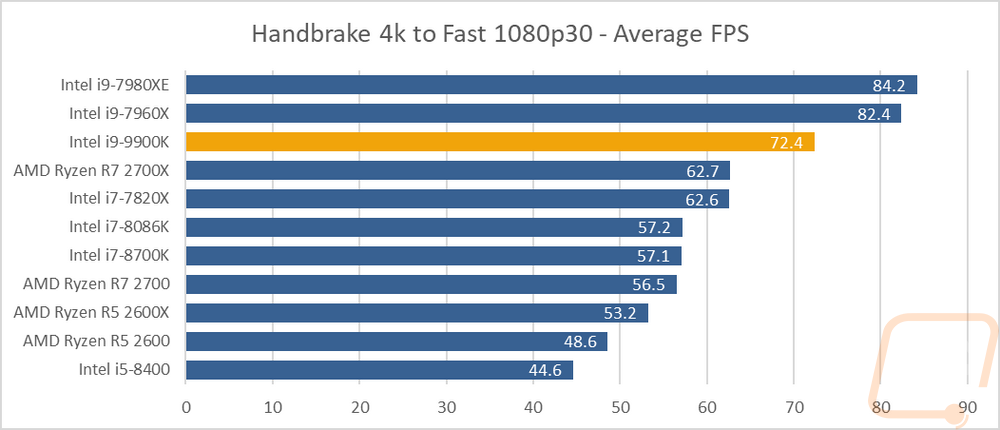
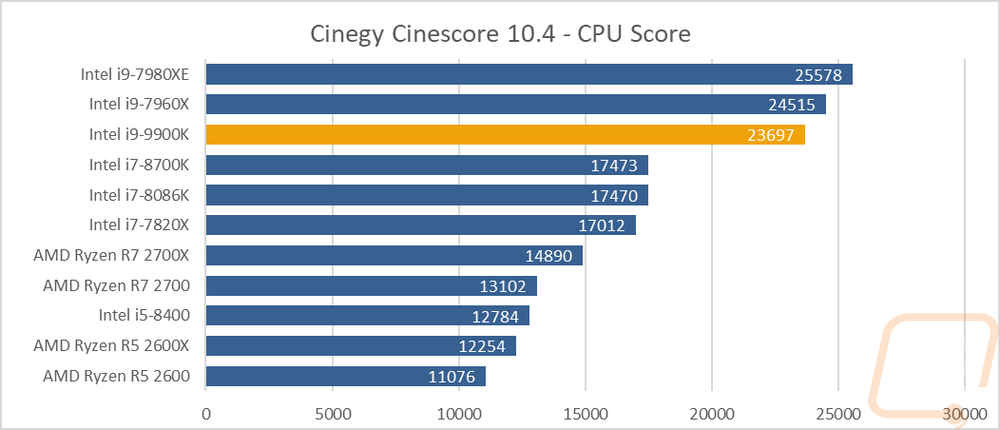
Sticking with the encoding theme I did tests in the always popular Blender application to render in their new dedicated benchmark on the quick benchmark setting. This is time based so lower is better and the 9900K bested the 8 core 16 thread 7820X as well as the 8 core CPUs from AMD to be the third fastest CPU tested. The 18 and 16 core CPUs, of course, were significantly quicker still but the 9900K bridged the gap between the 7820X and the 7960X. In Handbrake I rendered a 4k video down to 1080p30 with similar results again. The two high core count CPUs were still faster but not by as much of a margin. The 9900K outperformed the 2700X by almost 10 FPS and even more impressively was just over 15 FPS faster than the 8086K. Then I ran the entire Cinegy Cinescore benchmark that tests rendering performance across a long list of file formats and resolutions in a broadcast focused benchmark. Here the 9900K did especially well compared to the Ryzen CPUs while still being over 6,000 points higher than the 6 core Intel CPUs and just 1,000 and 2,000 points behind the 16 and 18 core CPUs.
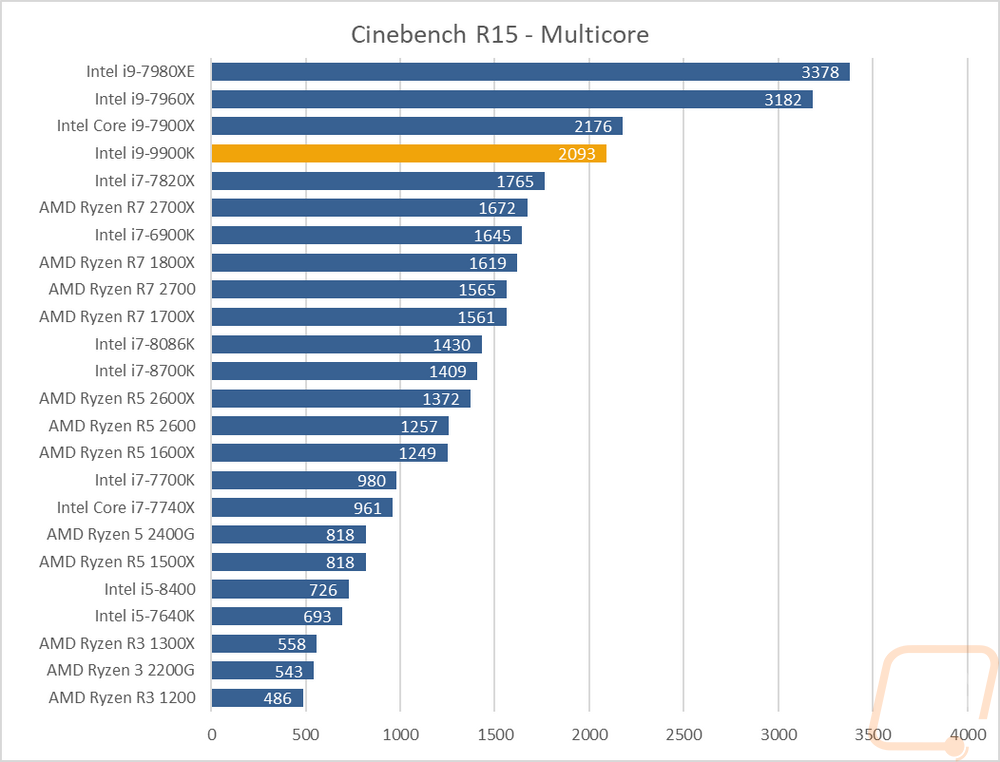
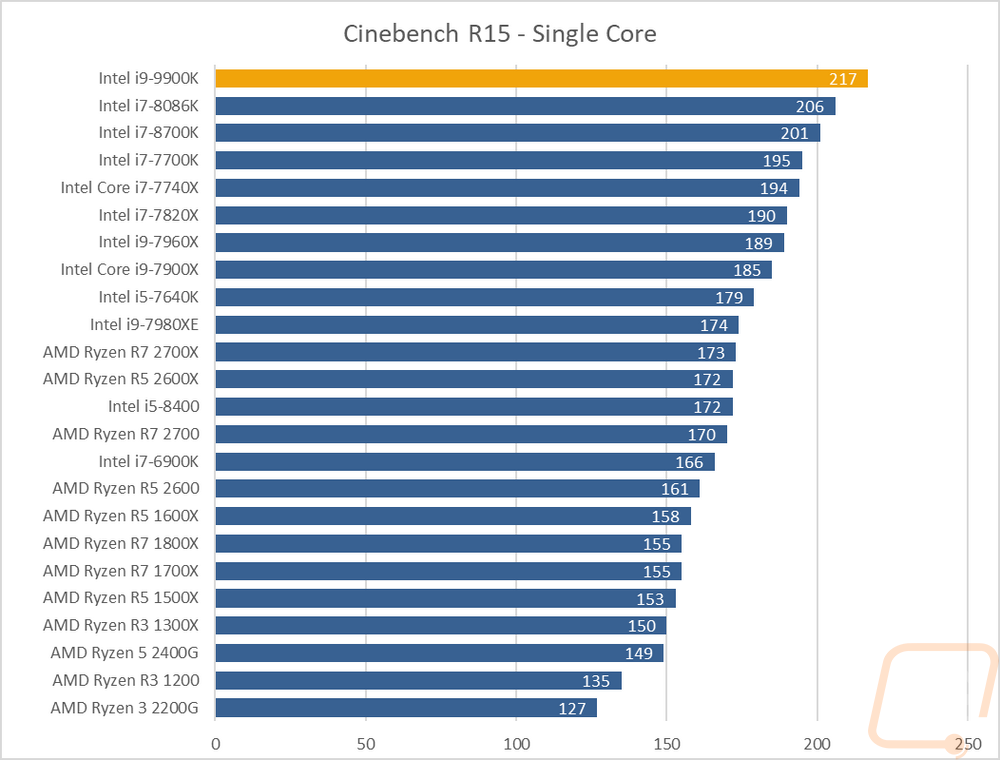
I’ve always loved any benchmark that gives us a look at multi-core and single-core performance and Cinebench R15 has always been a great one for that with its rendering scores. The 9900K I nowhere near the 16/18 core CPUs but it did get close to the 10 core 7900X. It was also well above any other 8 core CPUs in the multi-core test. As for the single-core test, the 9900K topped the chart. No surprised here. Single core performance is still dominated by Intel with the top Ryzen CPU down at the middle of the chart.
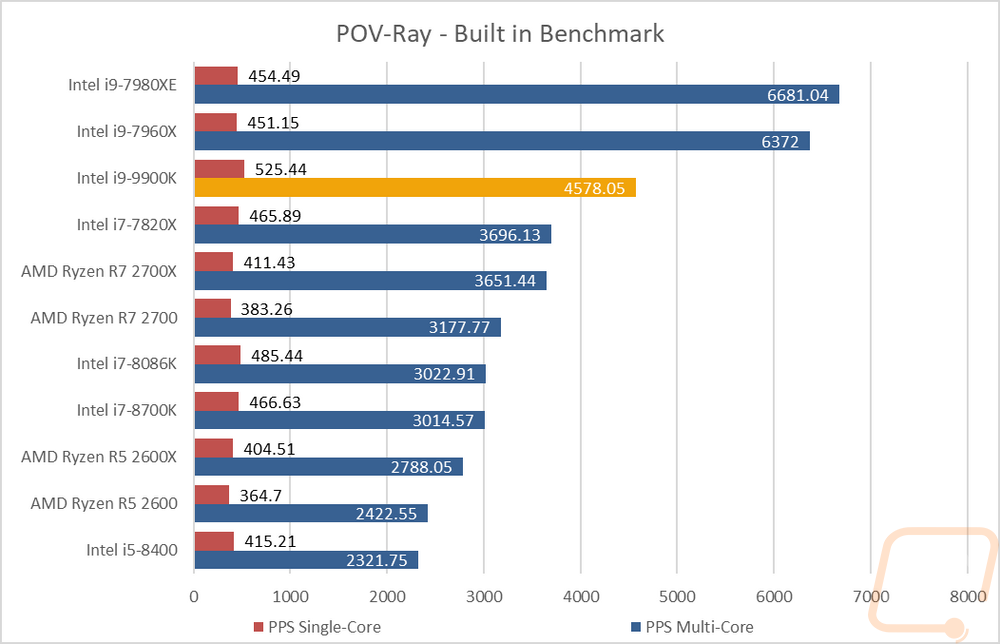
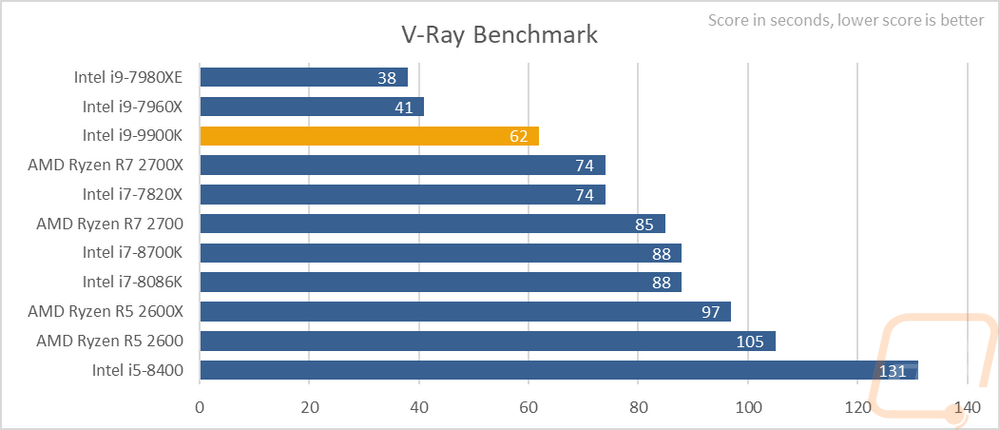
With Ray Tracing being talked about more the POV-Ray and V-Ray tests are both timely. They also are a good look at CPU performance. POV-Ray especially gives us a look at single and multi-core and I just explained how much I love those tests. So no big shockers in POV-Ray the 9900K is fast and up above everything except the 7960X and 7980XE. Single core performance the 9900K was the fastest tested, Intel overall was ahead in the single core testing with the 8700K and 8086K still ahead of the 2700X. The 9900K single core score was 525 vs the 2700X’s 411. V-Ray tests using seconds and again the 16/18 cores were at the top. The 2700X did really well here, matching the 7820X and beating both Intel 6 core CPUs by a big amount but the 9900K finished up 9 seconds quicker still.
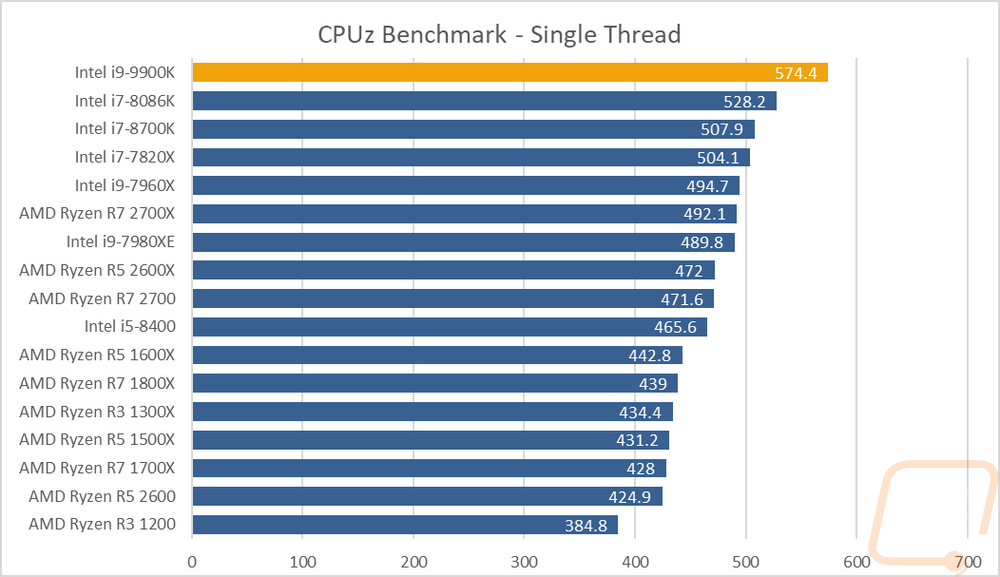
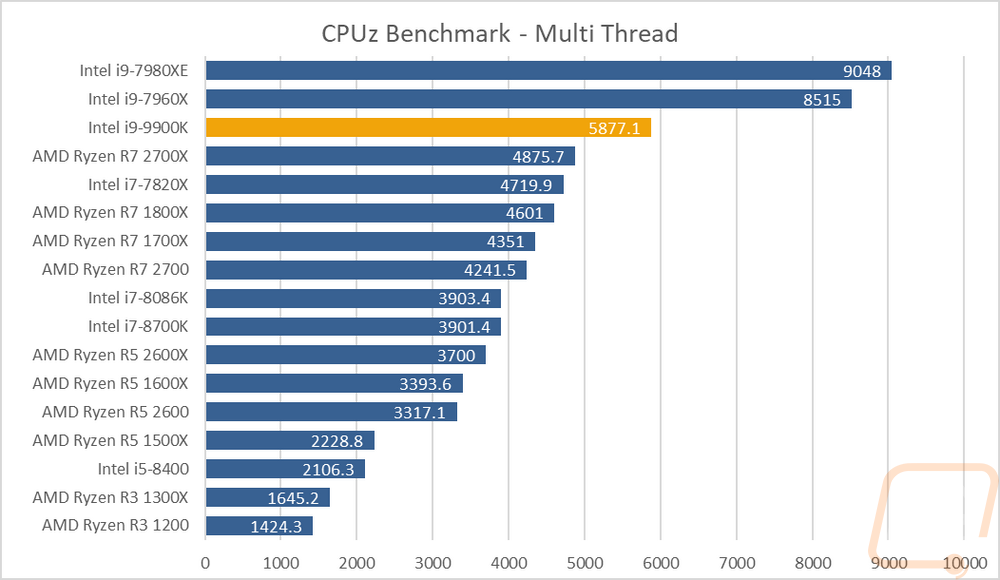
The CPUz benchmark is nice because a lot of people are running CPUz for other reasons and it is just tucked away in the software where anyone could run it. It also tests single and multi-thread performance. Now, this test looks a lot better on our single threaded performance. The 9900K topped the chart by a good margin ahead of the 8086K and 8700K with the 2700X back a few more. Then in multi-thread testing the 9900K and 2700X are a little closer with the 9900K winning and then the 16 and 18 core CPUs changing the bell curve with their scores.
In wPrime, we take a look at mathematical compute performance by timing calculating pie out to 1024 million points. Again 16, 18, and even 10 core CPUs are still faster but then when getting into the 8 core CPUs the 9900K is ahead of the 2700X by about 4.5 seconds. The 9900K did a LOT better than the 6 core 8086K and 8700K here.

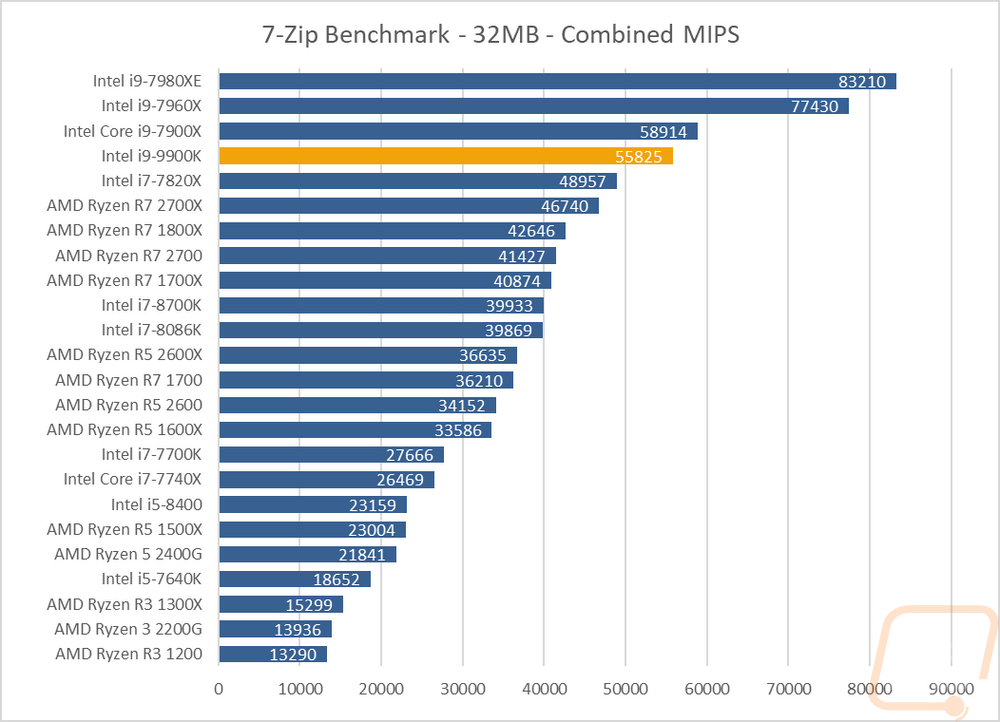
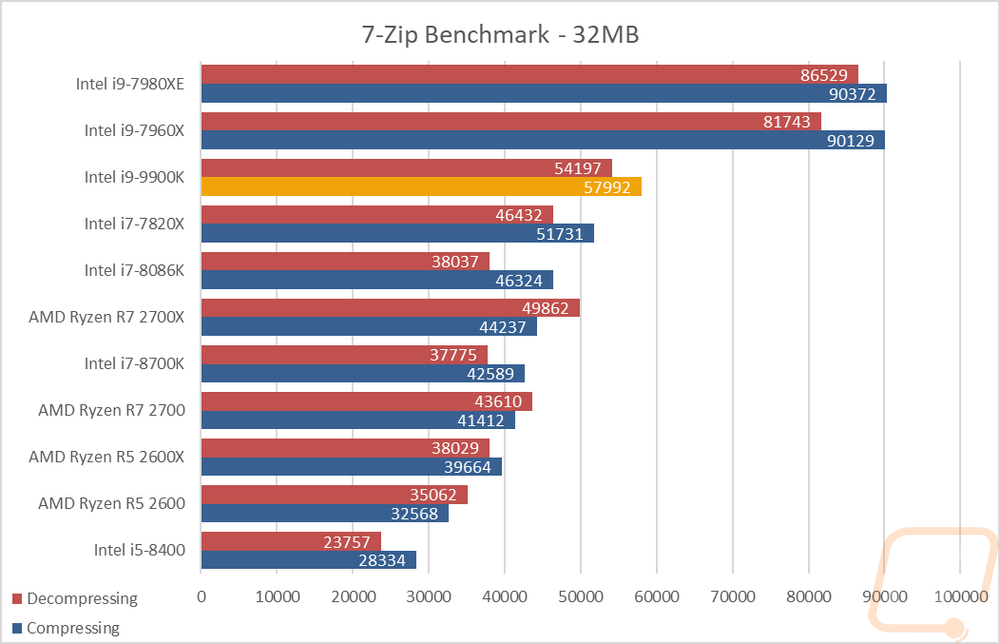
7-Zip is also somewhat math focused, these tests focus on compressing and uncompressing files. I have the combined score as well as individual results as well. High core counts are up top again by the 9900K did really well in the combined test. It did even better in the compressing results. I was surprised though at just how well the 2700X and 2700 did for decompressing. Three of the Ryzen CPUs ended up with higher decompressing scores than compressing. I know I spend a lot more time decompressing files so while in the combined test the 9900K wins out, I would call this a win for the 2700X as day to day I think more people are likely to need better decompressing performance.
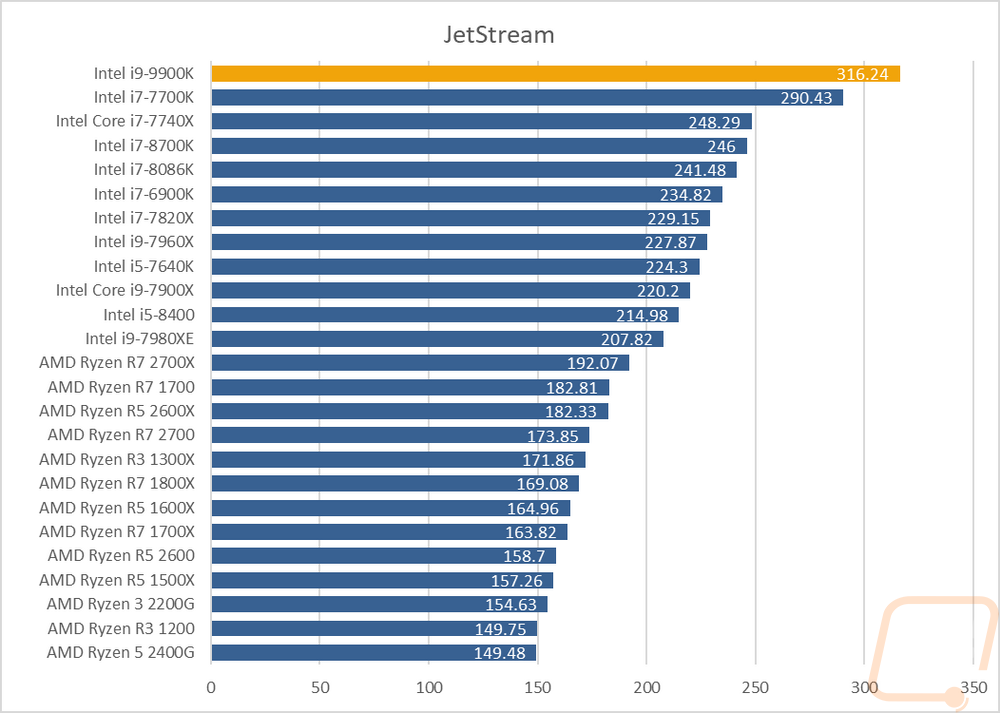
Next was Jetstream, this is an interesting browser-based benchmark that tests flash and HTML5 performance. To me, this might be one of the most important tests because all of us spend way too much time online. The 9900K did really well here and overall this is an area that Intel does better consistently. The Ryzen CPUs are all near the bottom here. Single core performance is important here.
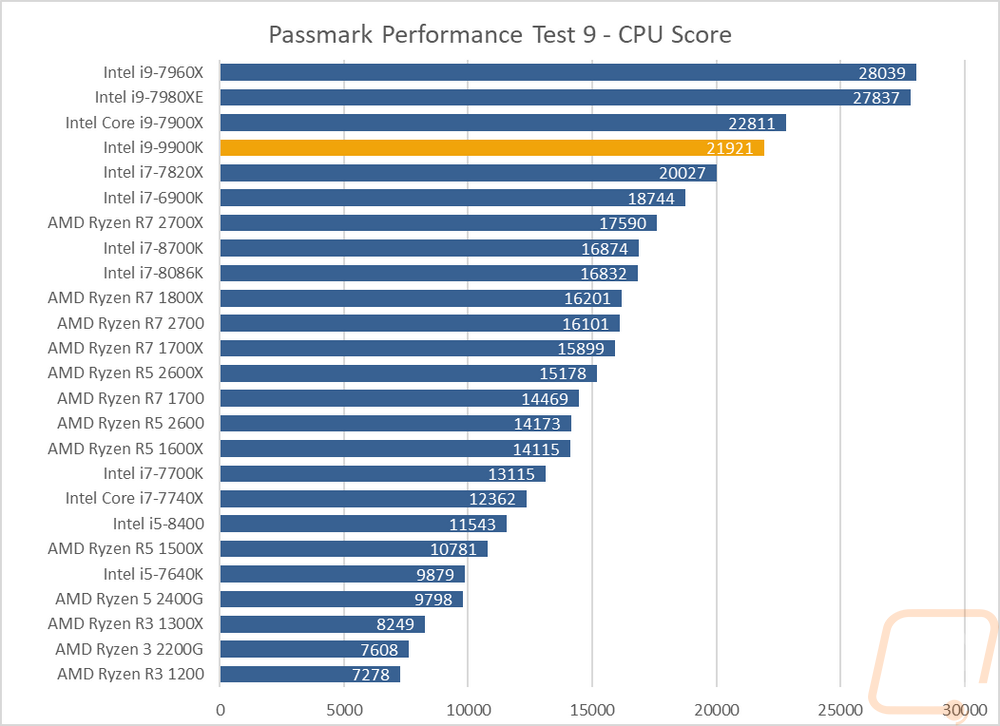
My next test was Passmark Performance Test 9’s CPU test suite and it gives an overall score. This does a full mix of tests some of which are detailed synthetic benchmarks and others are things like gaming performance. The 9900K came in behind the 10/16/18 core Intel Core-X CPUs and right in line with the 7820X showing that this benchmark focuses more on core count than clock speed. That said the 2700X was still a few CPUs behind and about 4k behind the 9900K in the overall score. The 6 core Intel mainstream CPUs are even farther behind that.
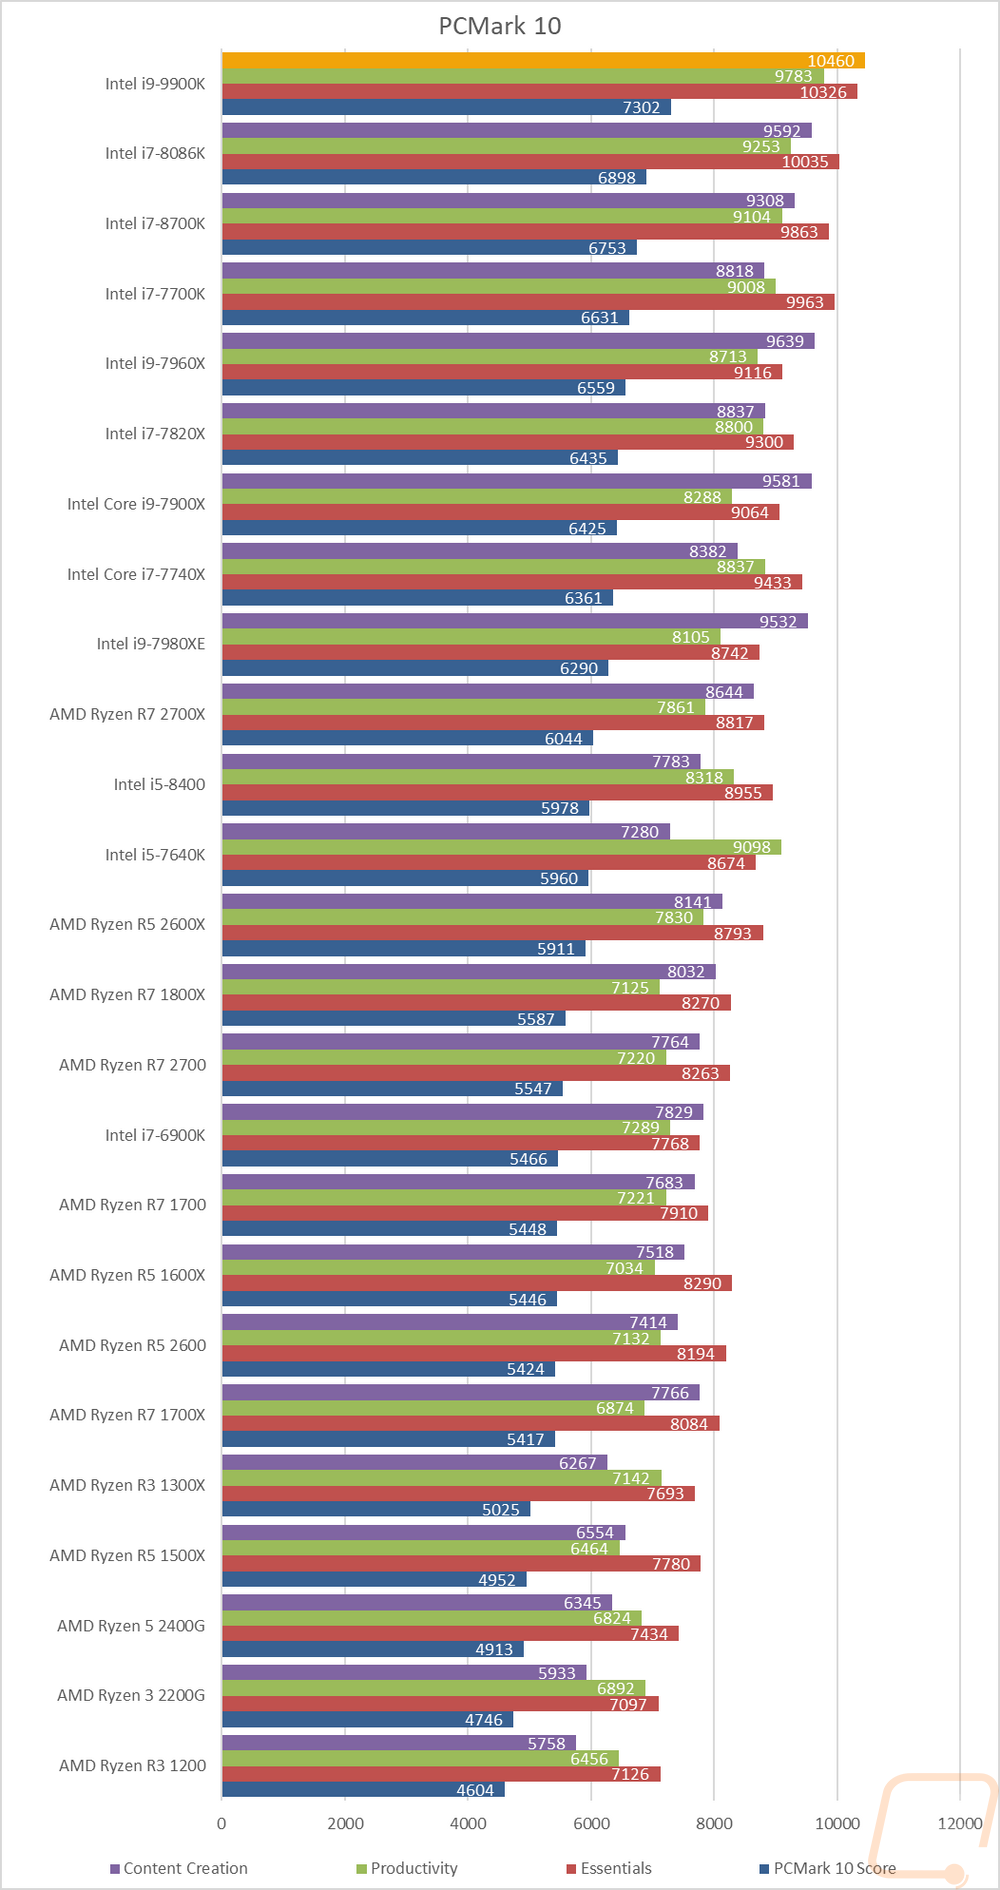
Then in PCMark 10, I love running this test because it does a wide range of real-world workloads like video calls, excel and word performance, web browsing, gaming, and more. In this test, the 9900K was at the top with a significant lead ahead of everything else. Behind that the 8086K and then the 8700K with their 6 cores. This shows that single core performance is favored in these tests. Looking a little closer at the 2700X and 9900K results the 9900K was out ahead in all three of the testing areas.
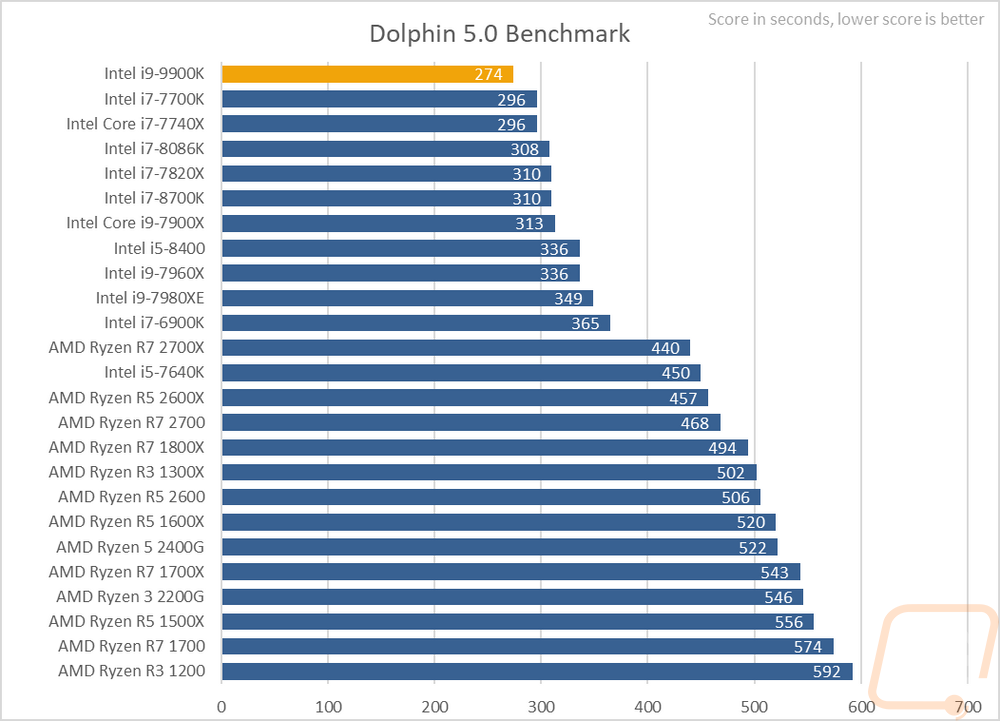
The Dolphin 5.0 Benchmark is a nice look at how well each CPU can handle emulation. This tests Wii emulation and the Intel mainstream CPUs did really well here. The 9900K topped the chart once again, putting even the good numbers from the 7700K to shame.
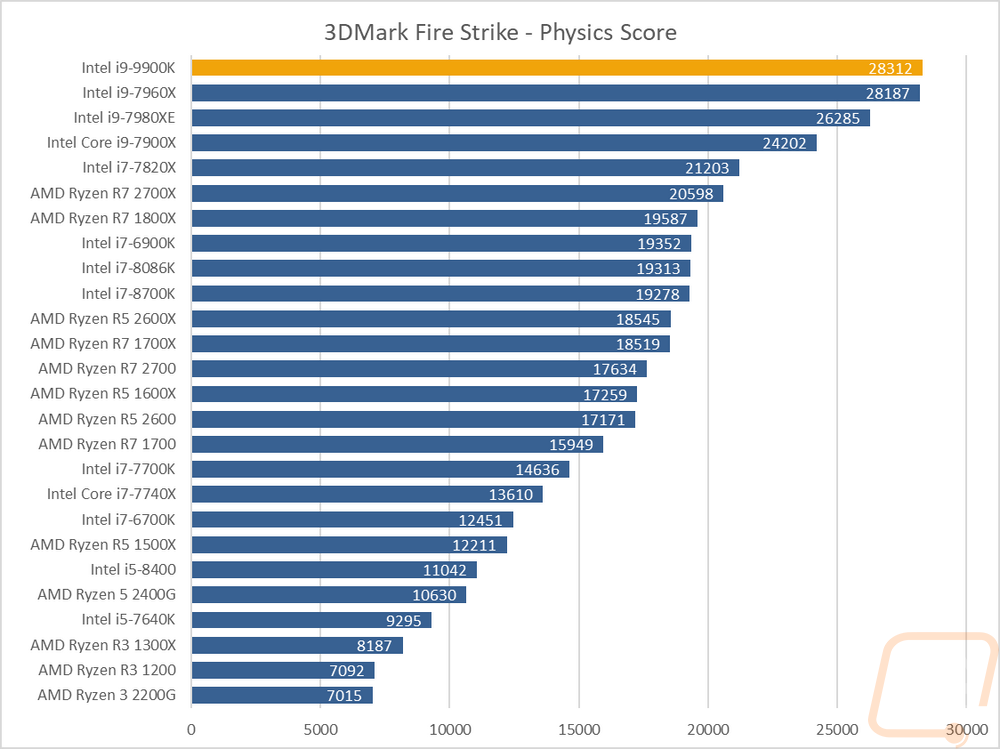
Next, I ran the synthetic gaming focused benchmark 3DMark with its Fire Strike test. I focused just on the physics score that is CPU focused and as you can see the 10/16/18 core Core-X CPUs were out ahead but the 9900K was the next fastest CPU with the 7820X being the next closest one and then finally the 2700X and 2800X.
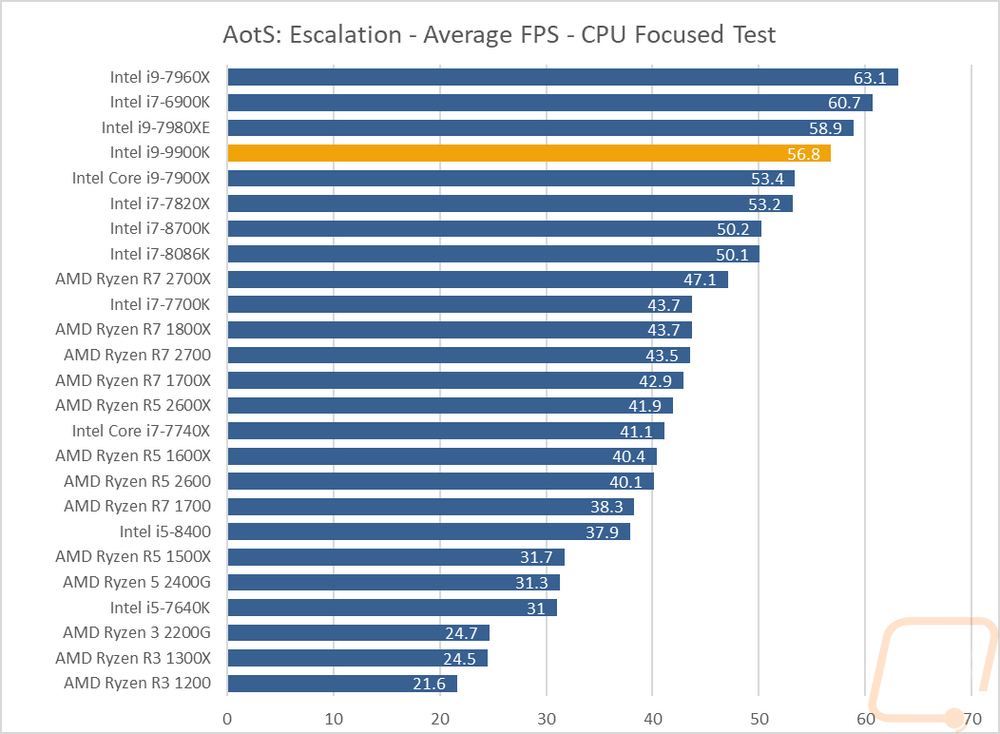
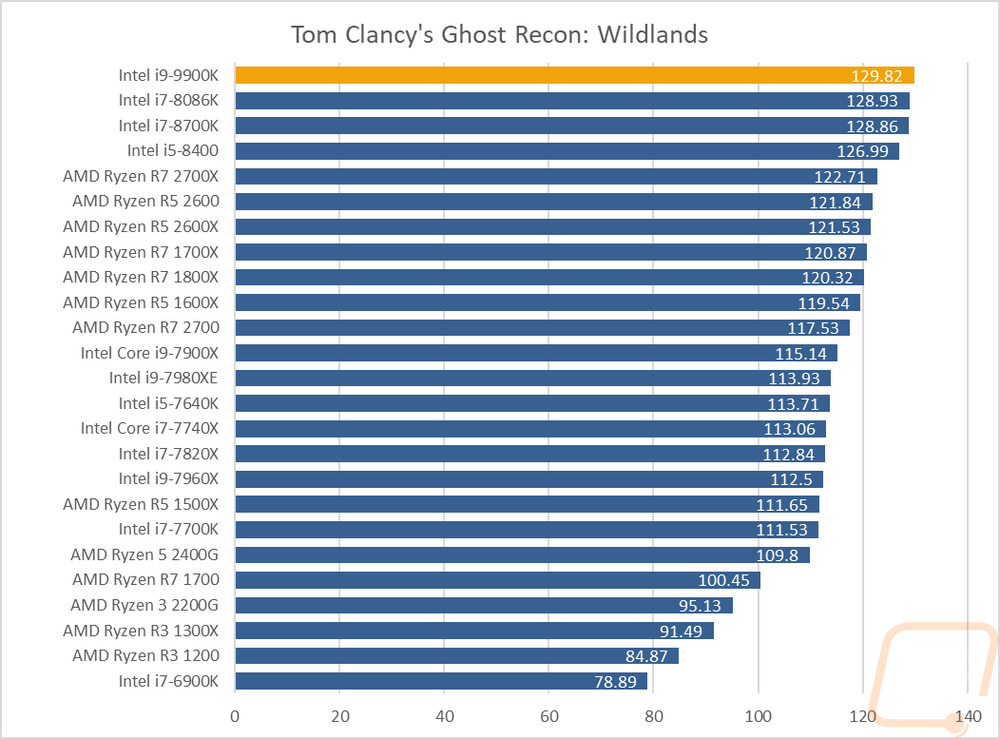
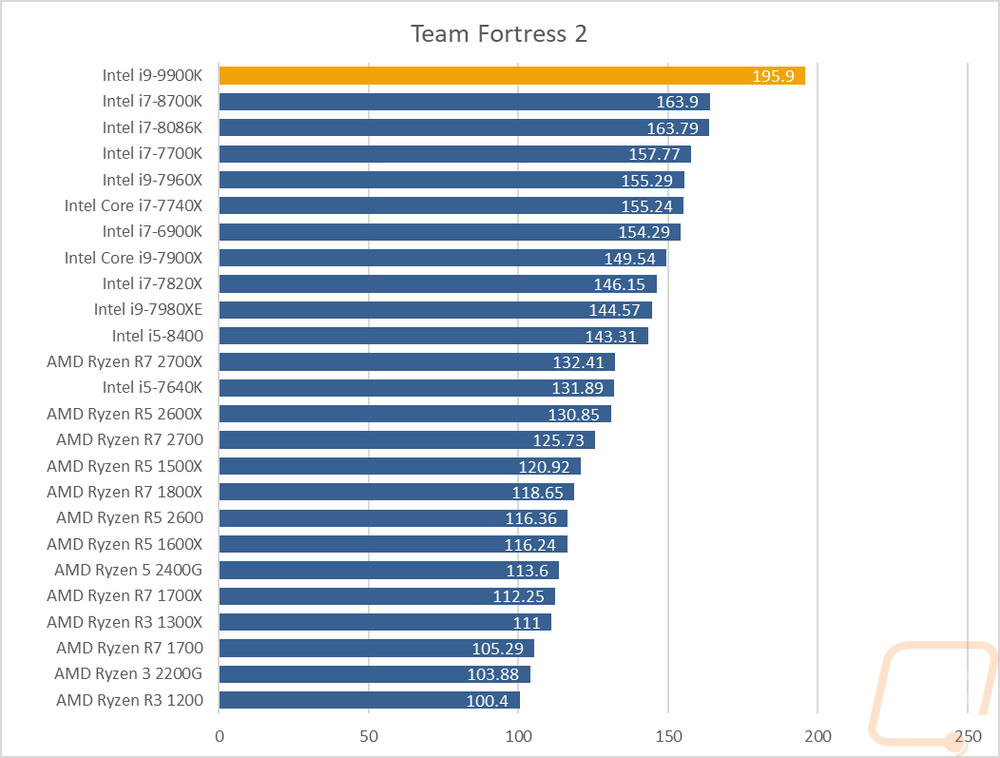
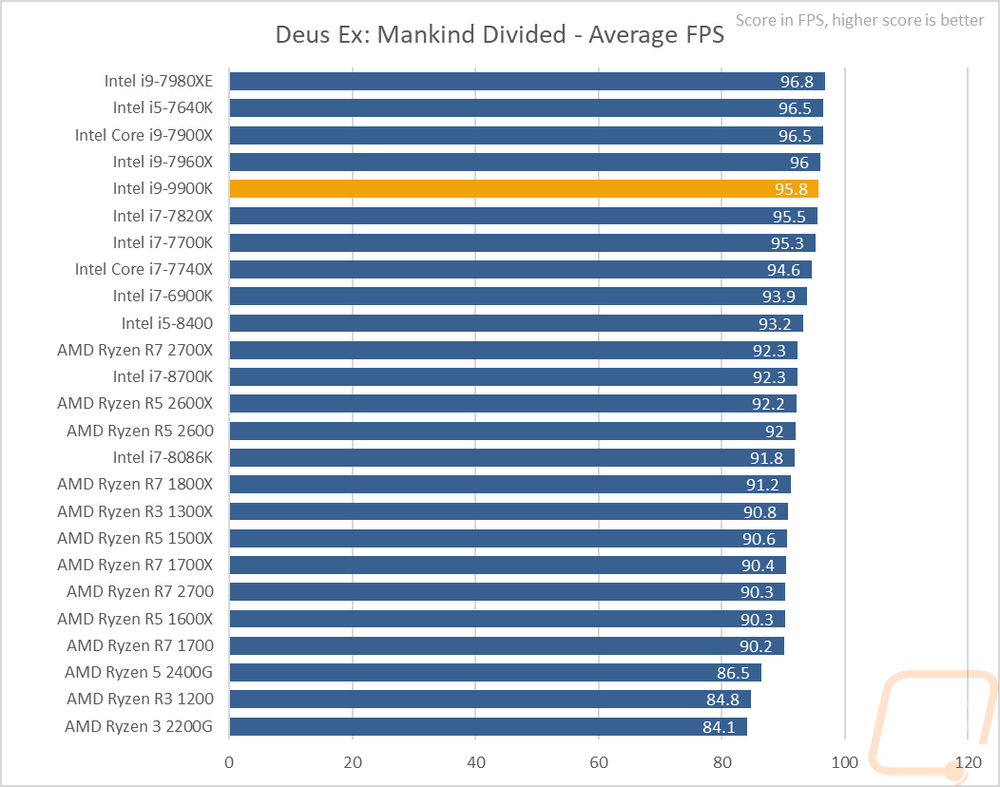
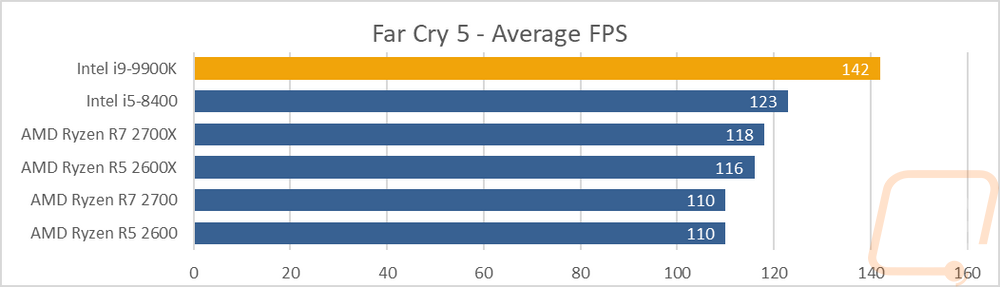
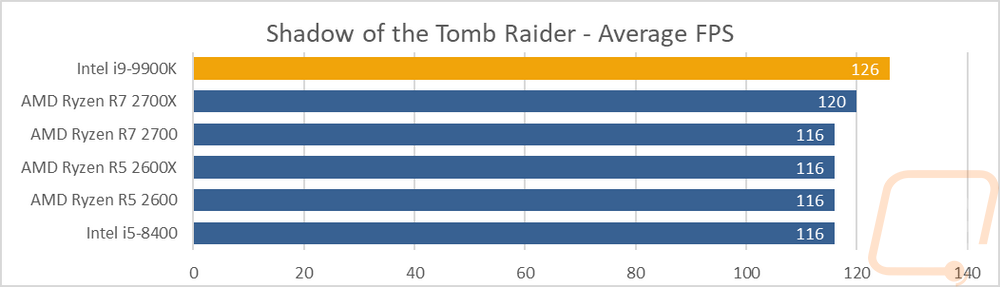
Then from there, I ran through a whole series of actual in game tests. Like I said earlier I was especially interested to see how well the 9900K would do here given Intel’s promotion of the best gaming performance. In Ashes of the Singularity, the CPU focused benchmark takes advantage of all of your threads and with that, the Core-X CPUs did better here. This is also a test known for being optimized for Ryzen CPUs but the 9900K did still come in a little over 6 FPS higher than the 2700X. The 6 core Intel CPUs were 3 FPS behind and the 9900K was right in line with the 7900X and the 7820X. Dues Ex was similar but the gap between any of the CPUs is really small. Then in the four other games, the 9900K was at the top of the charts. Three of those games are newer games. In Far Cry 5 and Shadow of the Tomb Raider, I was impressed with just how far out ahead the 9900K was. Far Cry 5 the 9900K was 24 FPS faster than the 2700X, with even the i5-8400 being faster. SotTR was a lot closer with the gap being 3 FPS for the 2700X and 9900K but then everything else came in at 116 FPS. In TF2, a much older game, the 9900K did really well as well. In fact, there was a 42 FPS gap between the 9900K and 2700X. The other Intel mainstream CPUs, however, were much closer up at the top.
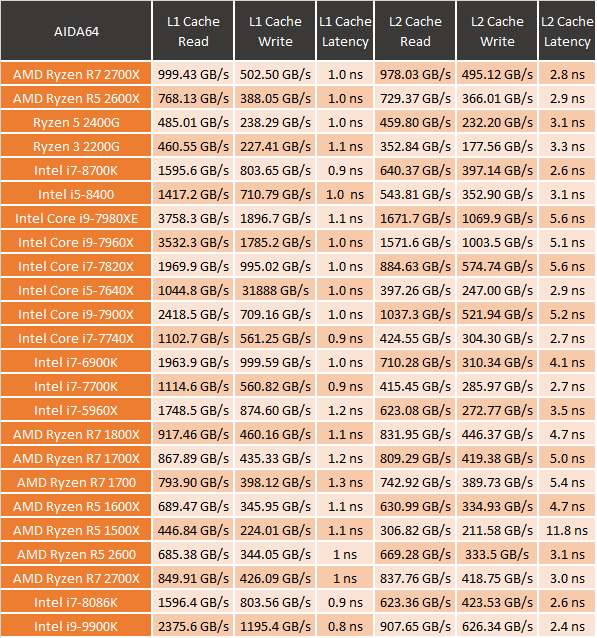
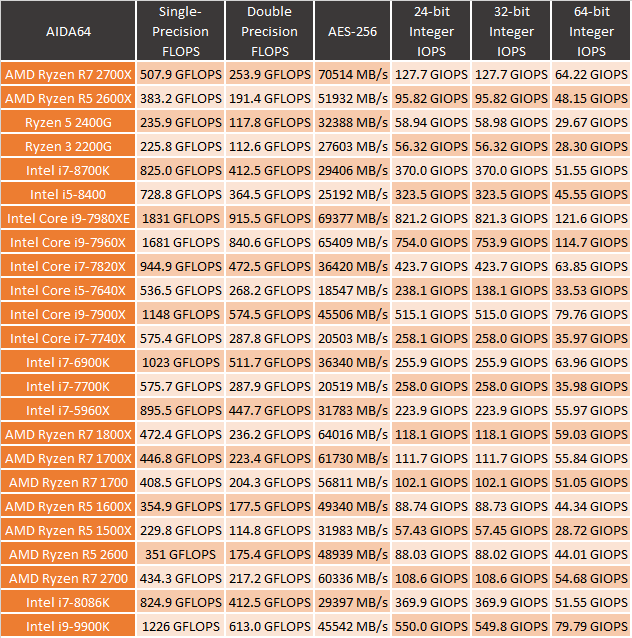
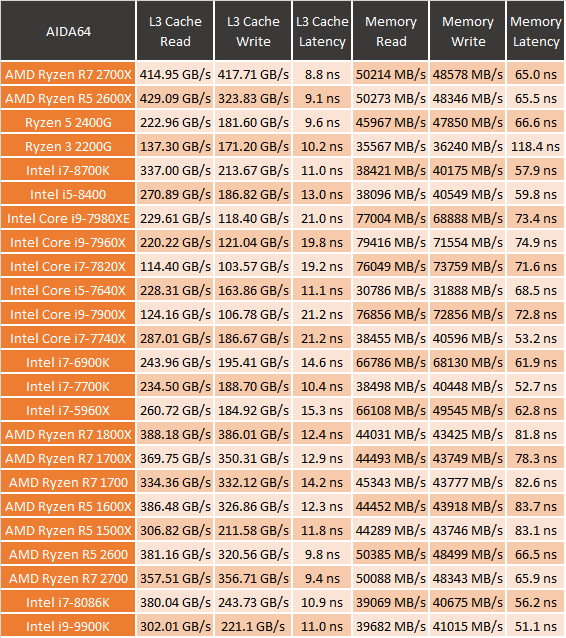
I also did run through a few tests in AIDA64. These were focused on cache and memory performance and latency. There is just too much data to fit into a graph so I have the tables below. A few noticeable things, L1 and L2 cache for the 9900K were both faster than the 2700X with the exception of the L2 read speed where the 2700X was just slightly ahead. This also translated to Cache latency where the 9900K was quicker as well. As for L3 Cache, the 9900K was behind here with the L3 writes being about twice as fast on the 2700X. Memory read and write speeds on the other hand favor Ryzen, at least until you get up into the Core-X CPUs where Intel pulls way ahead. Single and double precision FLOPs and all of the IOPs tests have the 9900K way out ahead of the 2700X, sometimes double. Then AES-256 encryption favors the 2700X by a good amount.