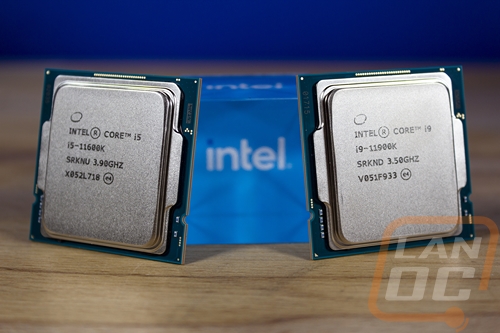
Intel’s Rocket Lake CPUs which are their latest 11th generation of their Core desktop lineup were officially announced earlier this month but they have been a bit of an open secret for a while now. There have even been CPUs available for sale way ahead of the launch so there has been a lot of information all over the place on Intel’s upcoming latest generation of desktop CPUs. Today is finally the day that the embargo lifts and we can take a closer look at the new lineup, namely the performance of two CPUs the Core i9 11900K and the i5-11600K that Intel sent over for us to test out. The competition in the CPU market has been strong and Intel has continued to push the limits so it will be interesting to see what they have in store for the 11th gen CPUs so let's dive in and see what the story is.
Product Names: Intel Core i9-11900K and i5-11600K
Review Sample Provided by: Intel
Written by: Wes Compton
Amazon Affiliate Links: i9-11900K and i5-11600K
Intel 11th Gen Core Desktop Processors
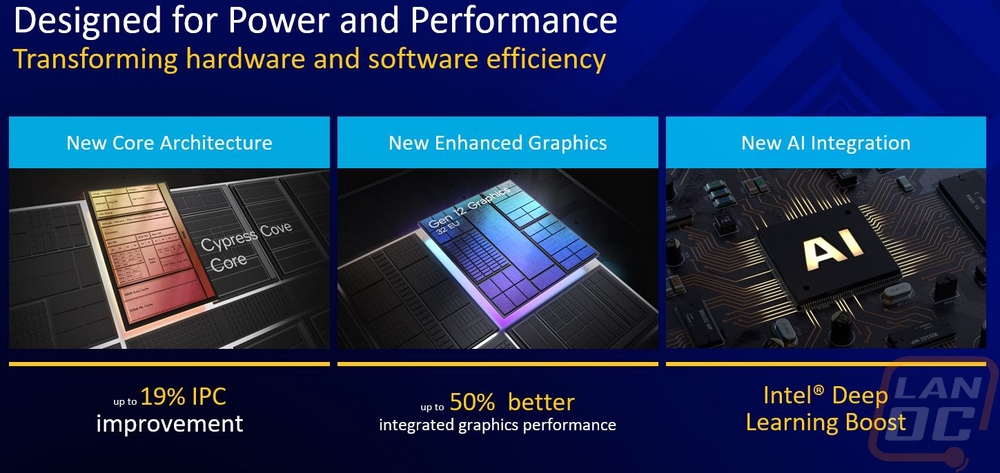
Before jumping into performance testing I did want to check out what Rocket Lake is all about and check out the specifications on the 11900K and 11600K that we have in to take a look at. In Intel’s Rocket Lake briefing they showed off that the new architecture is capable of up to a 19% improvement in IPC (instructions per clock) and the 11th gen CPUs have also received a long-overdue upgrade to the integrated graphics as well which can see up to a 50% performance improvement. They have also worked on integrating AI/Deep Learning performance much like Nvidia has on the GPU side of things.
The new CPUs are still on the same 14 nm FinFET build process which has been being used at Intel for an unheard of amount of time, going back to 2014 with Broadwell. With that Intel has had to get creative in other areas to edge out performance. They have focused a lot on IPC which Is what normally translates into better gaming performance and with programs that don’t focus on using up all of your cores. Memory support without overclocking is up to 3200MHz now over 2666MHz and 2933MHz on the highest end 10th gen CPUs.
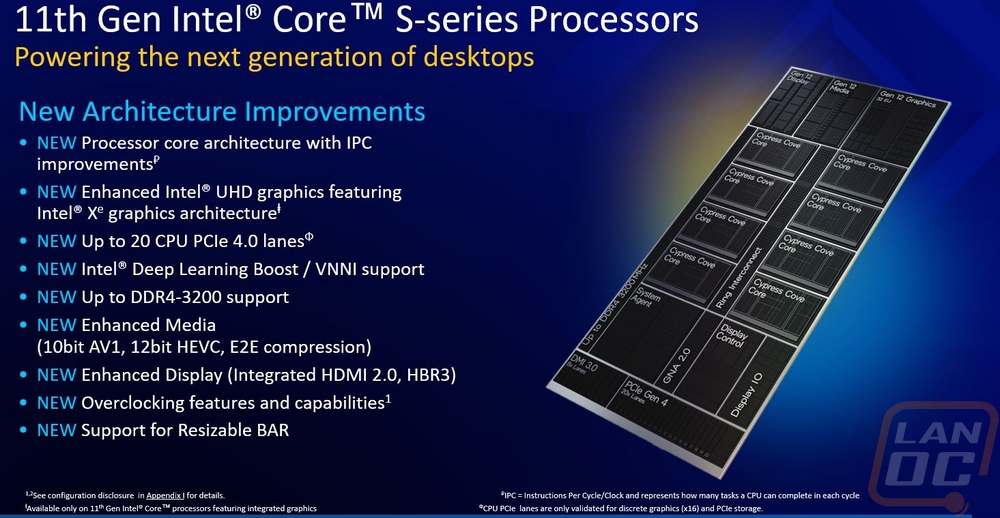
Speaking of overclocking they have added real-time memory overclocking using Intel’s extreme tuning utility and memory overclocking is now available on some of the mid-ranged chipsets as well like the H570 and B560.
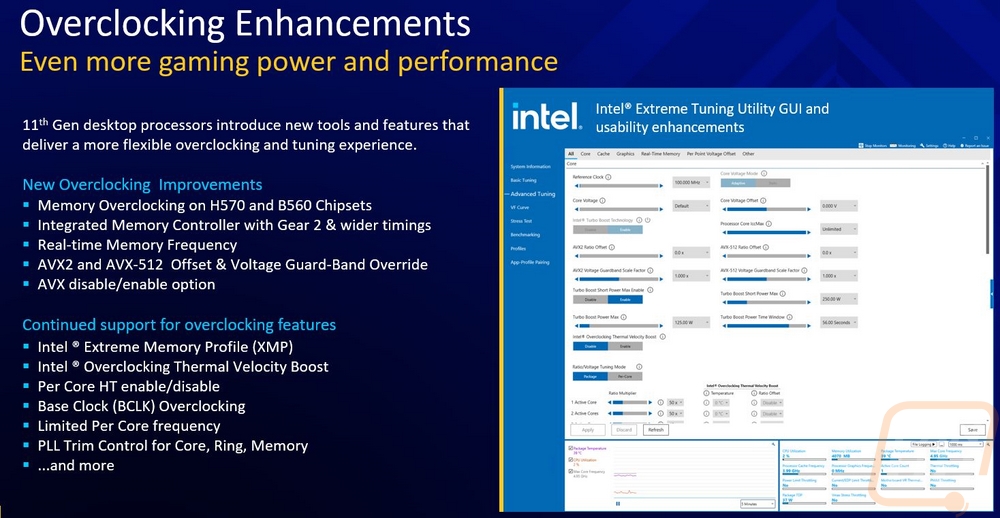
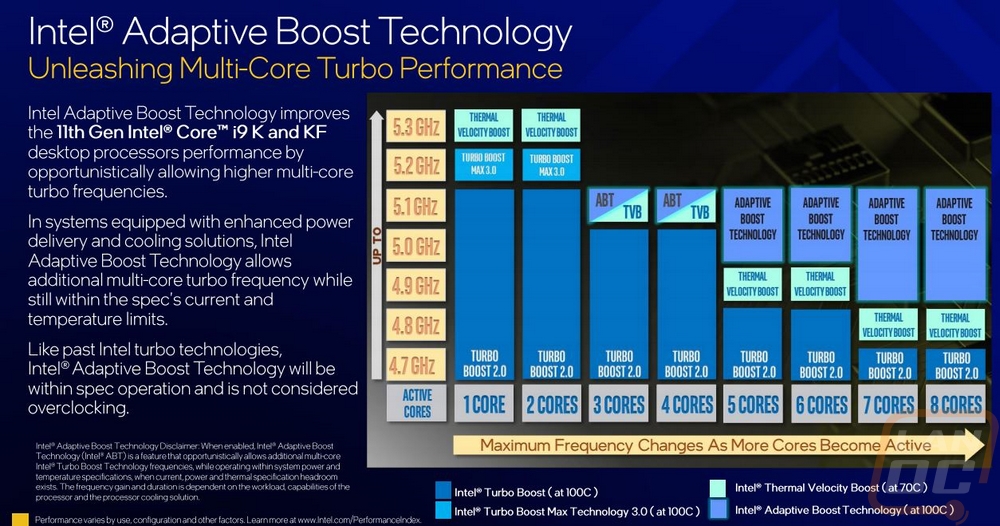
Intel has also been working on new ways to get performance out of CPUs using new boosts. They provided a really useful graph that breaks things down to show how it works on the i9’s by core. You have your normal turbo boost max 3.0 which helps overclock 1 or 2 cores. Each core also has thermal velocity boost which will attempt to overclock all cores up to 70c. Then they have adaptive boost technology which focuses on the cores past the first two that when turned on aims to get more frequency out of those cores up to 100c which is more aggressive. This isn’t turned on by default, it is a setting you turn on in your BIOS.
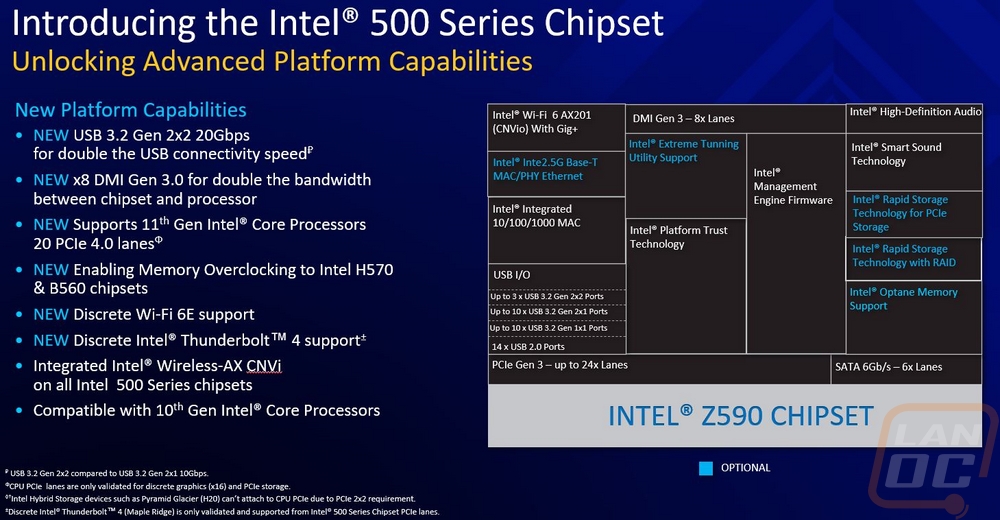
So Rocket Lake or 11th gen CPUs are on the same LGA1200 socket as the 10th gen CPUs but Intel does have new chipsets. Especially the new Z590 chipset which is the new flagship. They have added Thunderbolt 4 support for example. On the USB side of things USB 3.2 Gen 2x2 which is twice the speed of normal Gen 2 is officially supported, last generation you would only see that on some motherboards. They have also upgraded WiFi support from 6 to the new 6E with Intel Wireless AX-CNVi now on all 500 series chipsets.
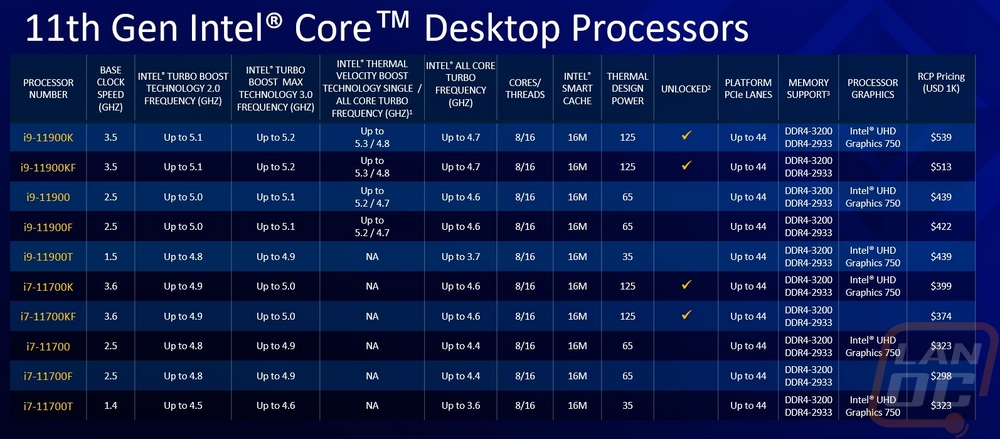
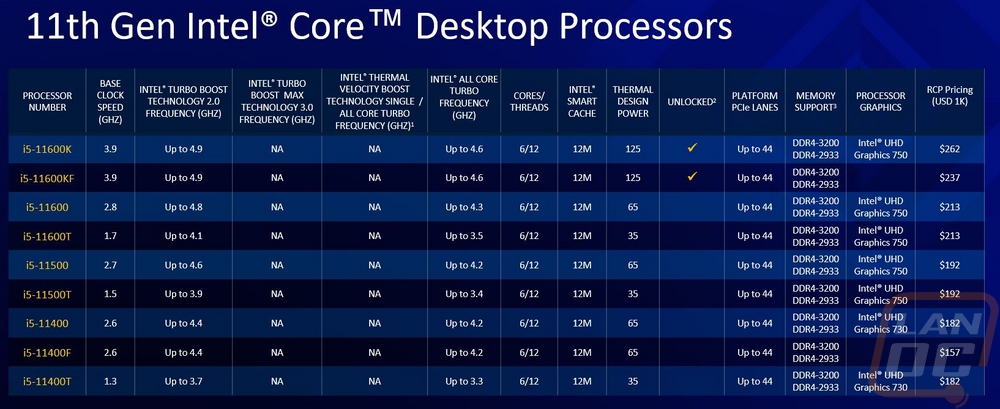
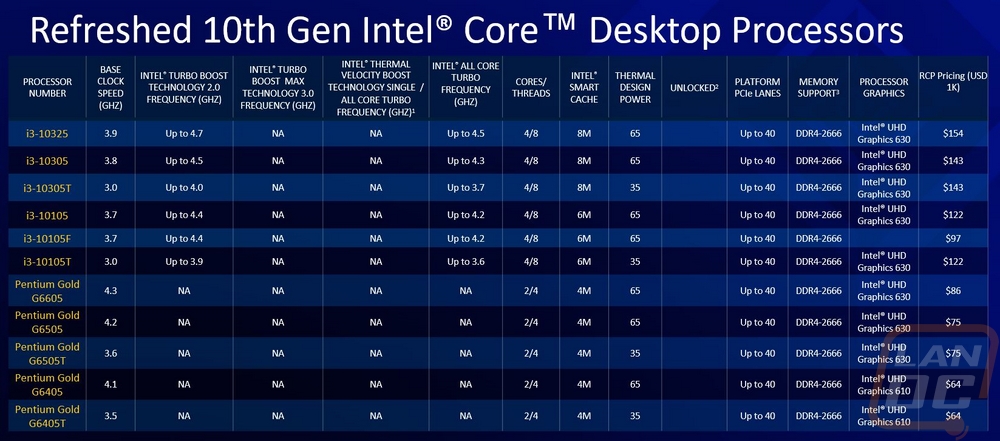
So here is a look at the full product stack with all of their RCP (recommended customer pricing) which isn’t always what we will see in the real world. Especially given the current climate with chip shortages everywhere. The i9-11900K that Intel sent over is their new flagship CPU but there is something very interesting with it. Intel has the 11900K with an 8 core 16 thread configuration. Last year's flagship was a 10 core CPU. Given the same manufacturing process still being used Intel decided to stick with 8 cores as their highest core count in the mainstream lineup to focus on the upgraded integrated video and higher frequencies. Though if you compare the 10900K, it did have a higher base clock and it matched the 5.3 GHz boost clock and had a higher 4.9 GHz all-core turbo frequency. We will find out later in testing, but I suspect that the boost clocks and thermals may be a little more reliable by dropping down to 8 cores. But it is a risky move with AMD reaching up to 16 cores on their “mainstream” socket. Intel also has options available for anyone who doesn’t want the integrated video with any CPU that ends with an F. Then for overclocking there are six models (three if you don’t count the CPUs without integrated video), the 11900K of course, the 11700K, and the 11600K. The 11700K has the same 8 core configuration only without the thermal boost and a lower but still impressive 5 GHz boost clock. Then the 11600K which they also sent over is the one unlocked 6 core CPU. All three have the same 125-watt thermal design, the rest of the Rocket Lake stack takes the 8 and 6 core options and steps them down with different base and boost clock speeds to fit into other thermal options like 65 and even 35-watt designs. The i7 and i9 models all have 16MB smart cache and the i5’s have 12MB smart cache. Intel also refreshed some of their 10th gen CPUs for the i3 and Pentium options.
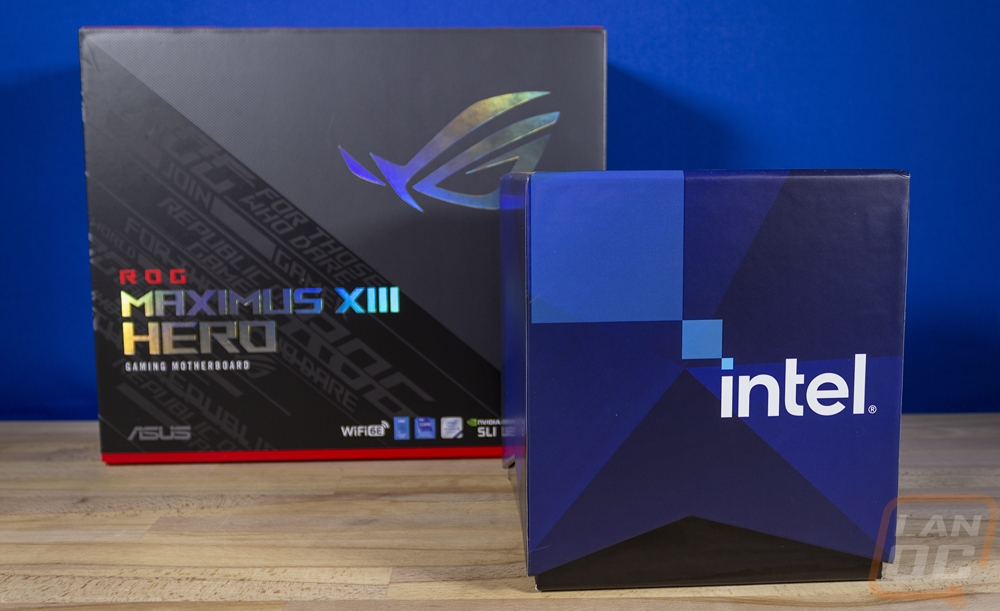
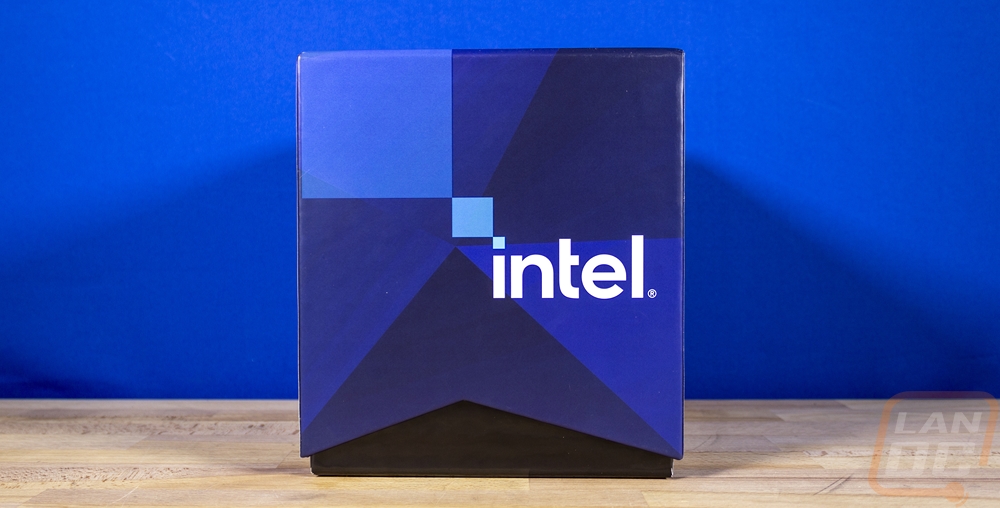
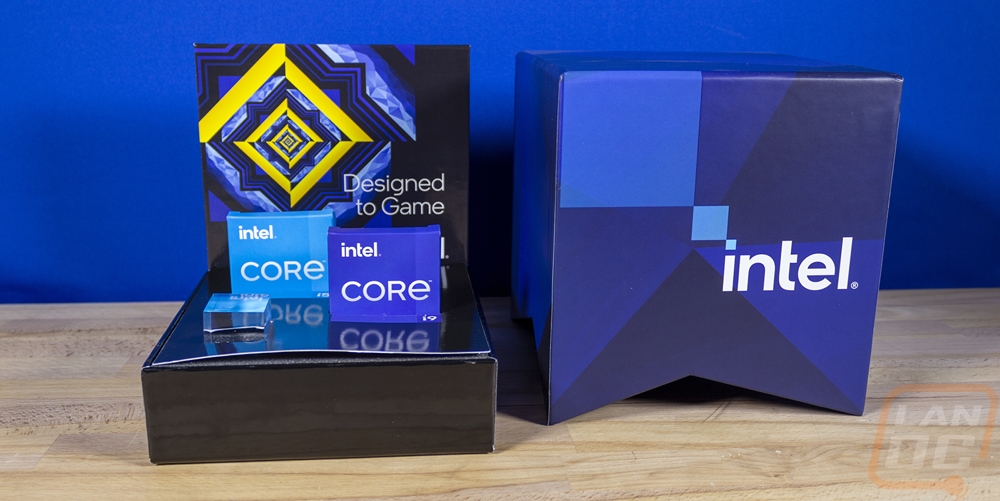
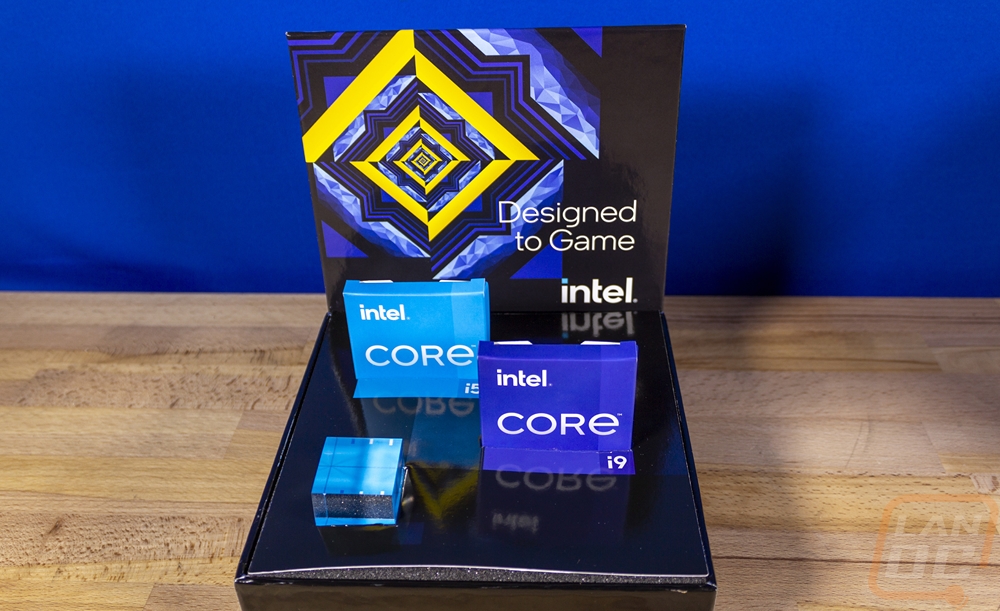
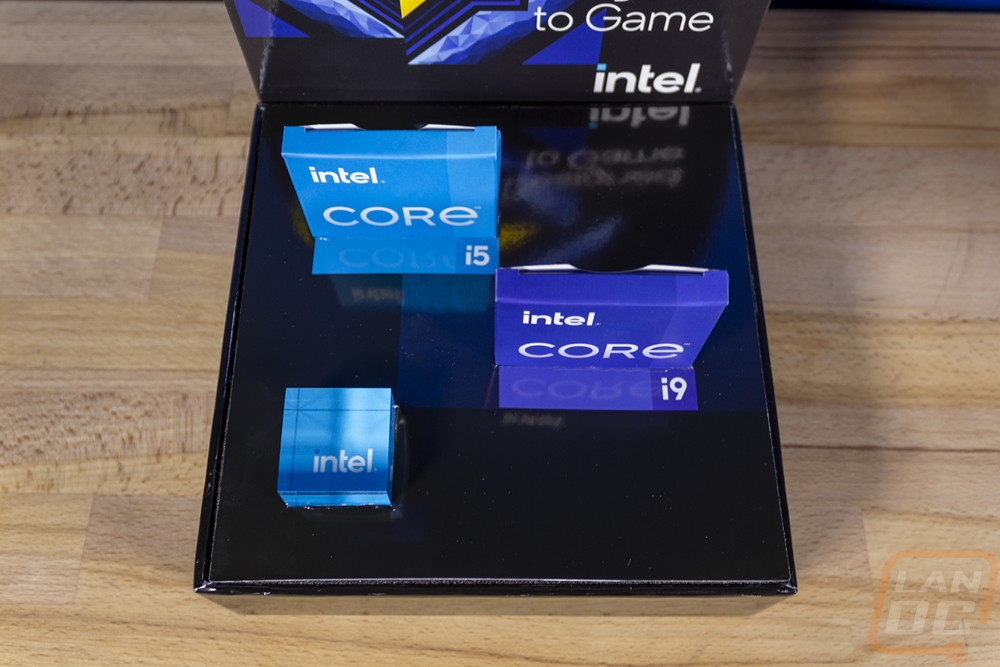
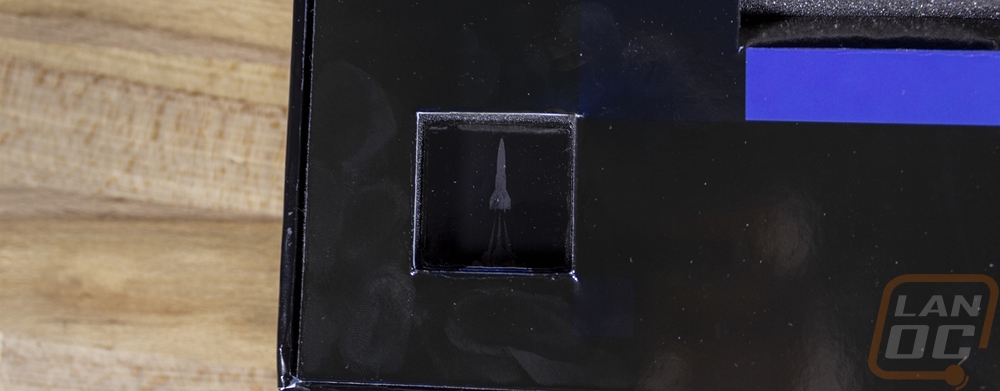
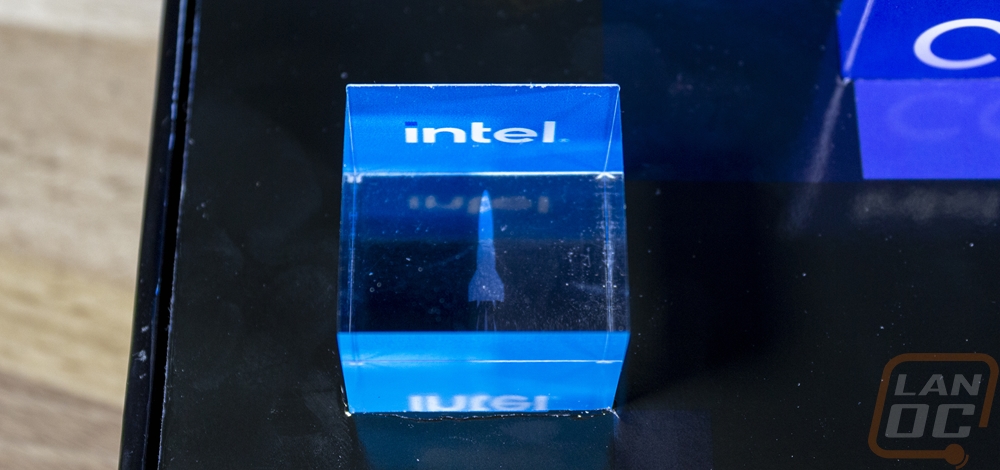
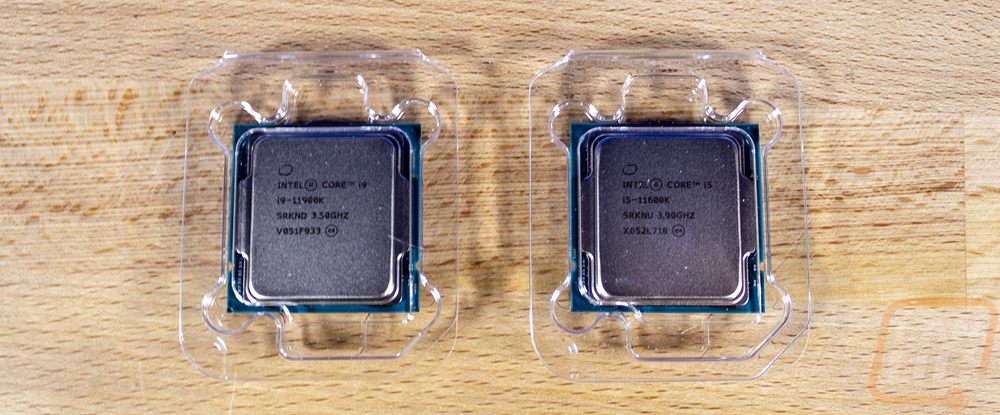
So for testing Intel sent over a special press kit which included an Asus Maximus XIII Hero Z590 motherboard for testing. Then for the CPUs, they skipped sending over retail packaging, and in its place, we received a box with both CPUs displayed. The CPUs come in small labeled boxes and then sit in a foam tray with a clear cube with Intel branding on it and the Rocket logo for Rocket Lake under it. I would still love to get the retail packaging because I think the last few have been especially cool looking. This generation's box isn’t as crazy as a blue plastic die that last-gen came with. But still.
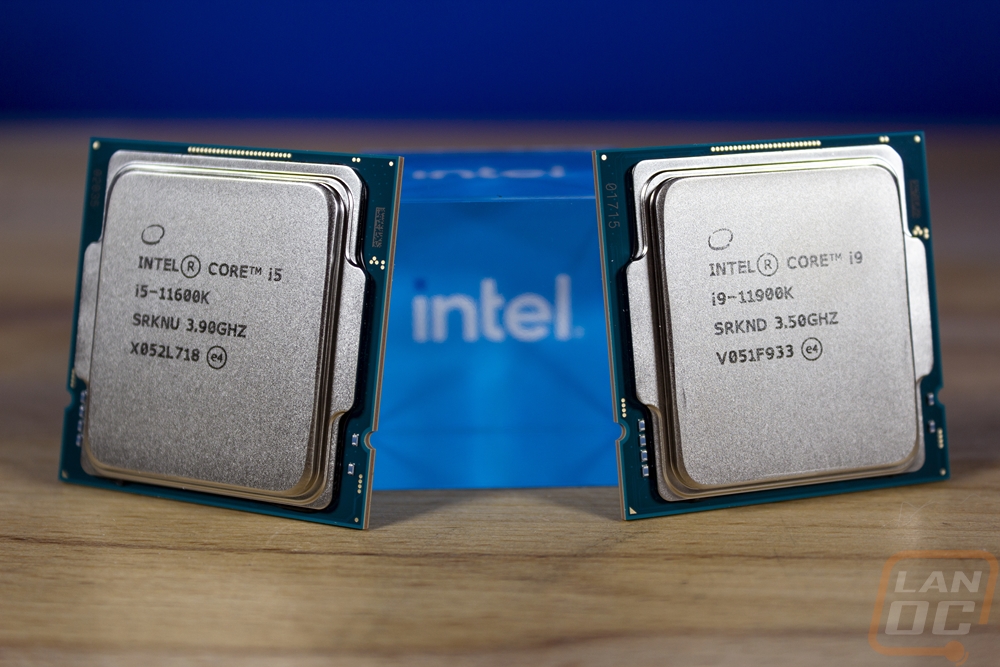
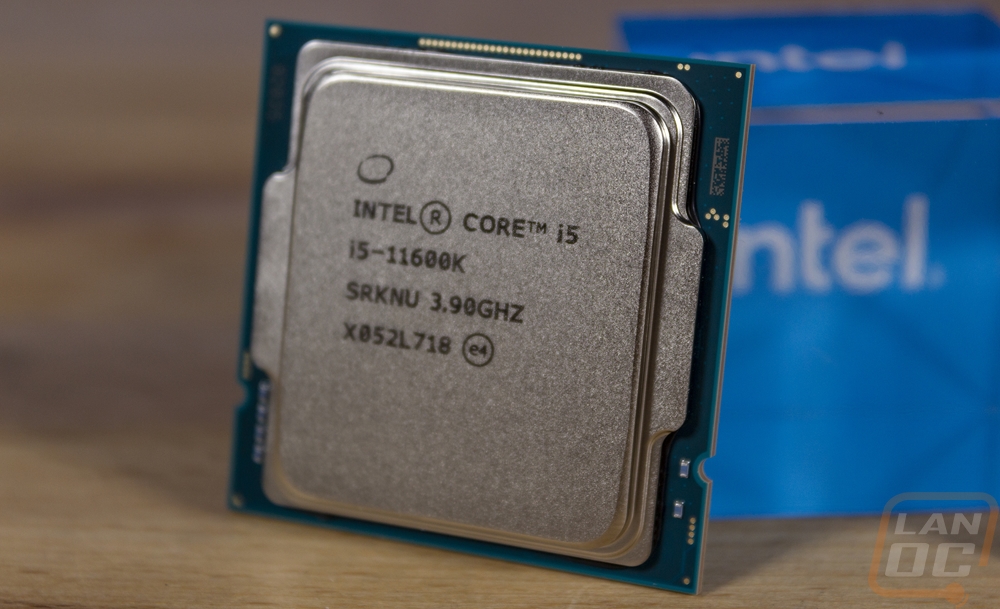
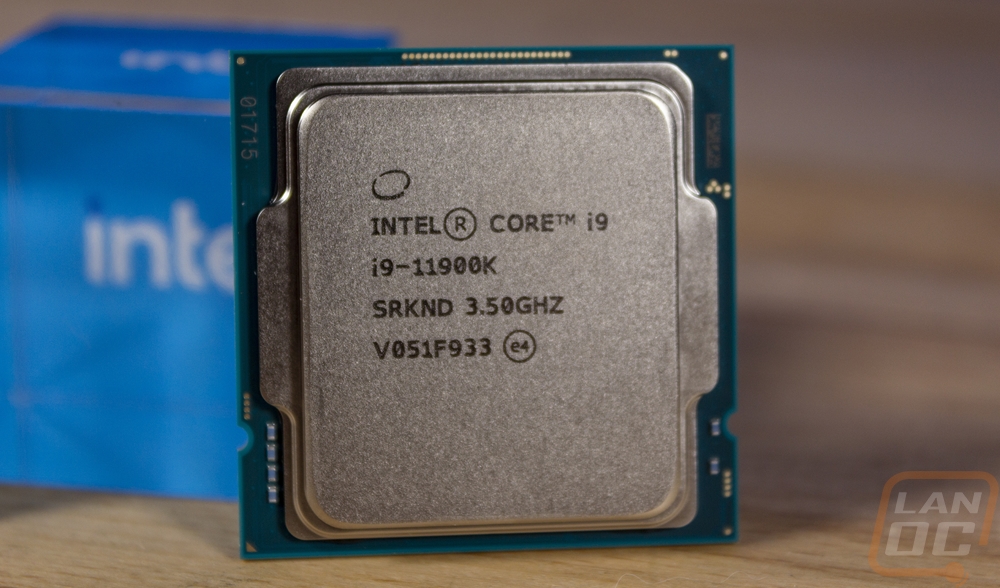
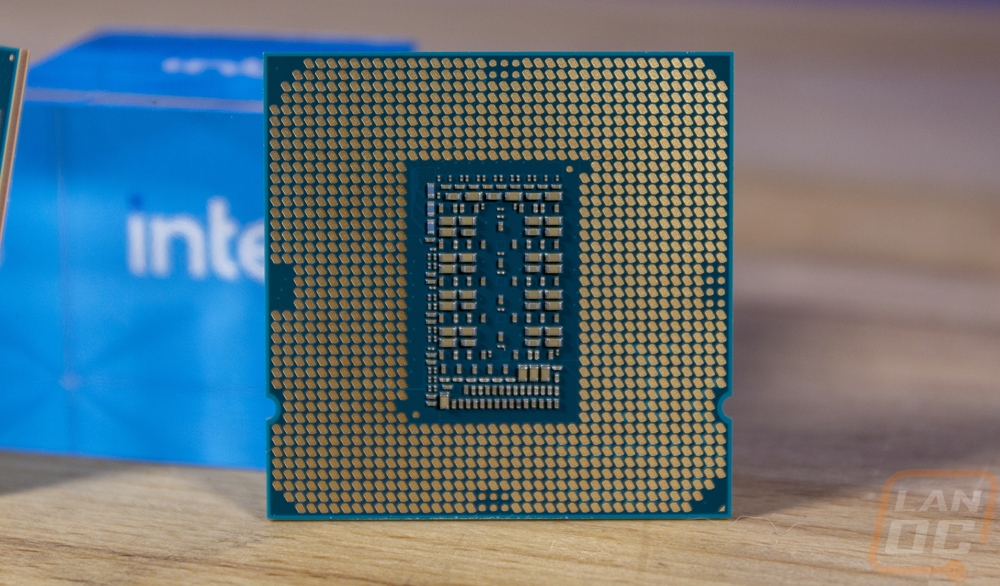
Inside everything, just like the retail packaging the CPUs still come in a normal clamshell. The only thing that also stood out to me was that these CPUs don’t have the normal confidential etching. These look like retail CPUs, much like what AMD sends out. As for the CPUs, Intel doesn’t have any fancy logos etched on the top but it does let you know that one is part of the Intel Core i5 series and i9 series then below that has the model number and then the base clock speed along with the batch number as well. Intel is still running with the same sized LGA socket as the 10th gen (LGA 1200) so these are still small and have the pins on the motherboard.
Test Rig and Procedures
Test System (with affiliate links)
Motherboard: Asus ROG Maximus XIII Hero
Cooling: Corsair H100i RGB Platinum
Noctua NT-H1 Thermal Paste
Memory: Corsair Dominator Platinum RGB 16GB 3000 MHz
Storage: WD Black SN750 1TB
Video Card: Nvidia GTX 1080 Ti
Power Supply: Corsair TX750M
Case: Dimastech Test Bench
(it should also be noted that all testing was done with MCE or Multi-Core Enhancement turned off)
|
CPU Testing Procedures |
|
|
Team Fortress 2 |
|
|
Ashes of the Singularity: Escalation |
1080p – Standard quality setting, DX12, built-in benchmark on the CPU-focused setting |
|
Tom Clancy's Ghost Recon: Wildlands |
Built-in Benchmark, 1080p, High detail setting |
|
Deus Ex: Mankind Divided |
1080p – Ultra Setting and Medium Setting – DX11 – Vsync Turned off using the built-in benchmark |
|
Far Cry 5 |
1080p with High Detail setting using the built-in benchmark |
|
3DMark Fire Strike |
Physics Score – Performance benchmark |
|
Dolphin 5.0 Benchmark |
|
|
Jetstream |
|
|
7-Zip |
Built-in benchmark set to 32MB, run 4 or more passes. Combined MIPS, Compressing, and Decompressing scores all used. Just the Current result, not the resulting |
|
AIDA64 |
Memory, Cache, and FLOPS testing done with built-in GPGPU and Memory benchmarks |
|
wPrime |
1024M |
|
X264 HD Benchmark |
Both version 4.0 and 5.0.1. Pass 1 and Pass 2 are run on 5.0.1 and just pass one on 4.0 |
|
Cinebench R15 |
CPU and CPU (Single Core results) |
|
Cinebench R20 |
CPU and CPU (Single Core results) |
|
CPUz |
CPUz's built-in benchmark, both single and multi-core scores |
|
Passmark 9 |
CPU Mark Score |
|
PCMark 10 |
Normal test ran, not the express or extended |
|
V-Ray |
CPU Benchmark time used as the score |
|
POV-Ray |
Using built-in benchmark. Settings are all set to the "Standard Benchmark Switches" listed on https://www.povray.org/download/benchmark.php |
|
Handbrake |
Tested using 2d 4k 60 FPS version, resized using the Fast 1080p30 preset, average FPS used. Here is the file download location https://bbb3d.renderfarming.net/download.html |
|
Blender |
Using new official benchmark on the Quick Benchmark setting that tests the BMW27 test and Classroom. Timed together |
|
Temps |
Aida64 stability test to load and to record temperature readings |
|
Power Usage |
Idle and load testing using a Kill-A-Watt and wPrime to put the CPU under load |
|
Onboard Testing Procedures |
|
|
Bioshock Infinite |
Adrenaline Action Benchmark Tool on the “Medium” quality setting at 1080p |
|
Tomb Raider |
Adrenaline Action Benchmark Tool on the “Medium” quality setting at 1080p |
|
Hitman: Absolution |
Adrenaline Action Benchmark Tool on the “Medium” quality setting at 1080p |
|
Far Cry 5 |
1080p, Lowest Detail setting, In game benchmark |
|
Shadow of the Tomb Raider |
1080p, Low Detail setting, In game benchmark |
|
Team Fortress 2 |
1080p – high, very high, high, reflect world, high, enabled, 8x msaa, x16, multicore on. https://bit.ly/2vOebin |
|
Unigine Superposition |
720p Low and 1080p Medium settings |
|
Cinebench R15 |
OpenGL benchmark |
|
3DMark Fire Strike |
Performance setting – GPU Score |
|
3DMark Time Spy |
GPU Score |
CPU Performance
Before jumping into testing, I want to address MCE and our testing. Turning on MCE in the motherboard BIOS is officially within Intels specifications but it opens up a lot of variability when testing. For simplicity, I have MCE off in our main testing but I do take a look at MCE performance as well as Intel's Adaptive Boost father down the page. So keep in mind that to compare results with ours MCE or a similar option depending on the motherboard will need to be off. This is especially important later when I look at thermals and power which MCE makes a HUGE difference on. Anyhow all of our testing here is done with XMP turned on and with an H100i 240mm water cooler, see the previous section for more information on the tests and our test system.
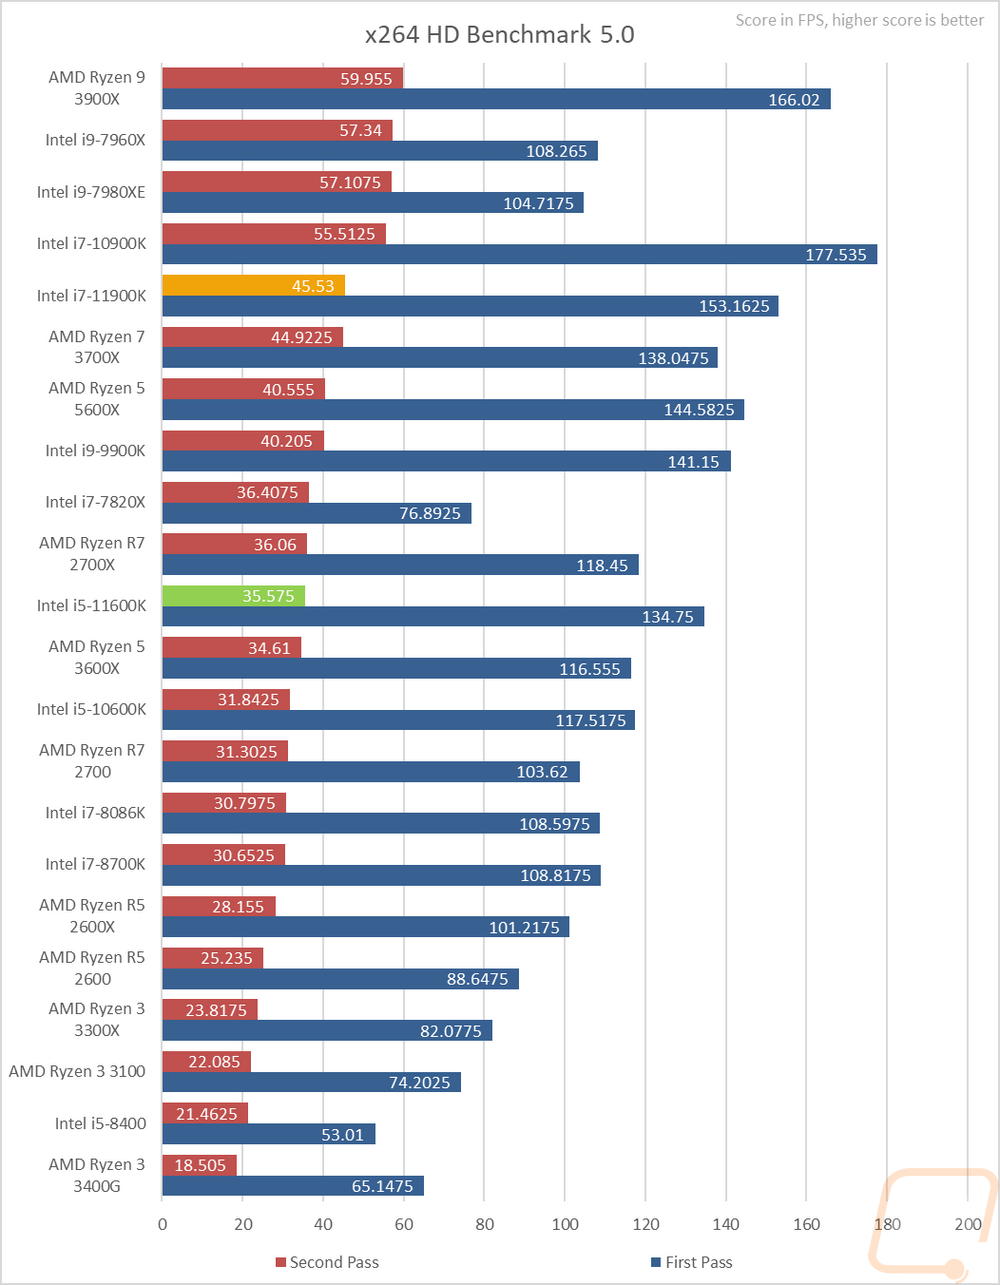
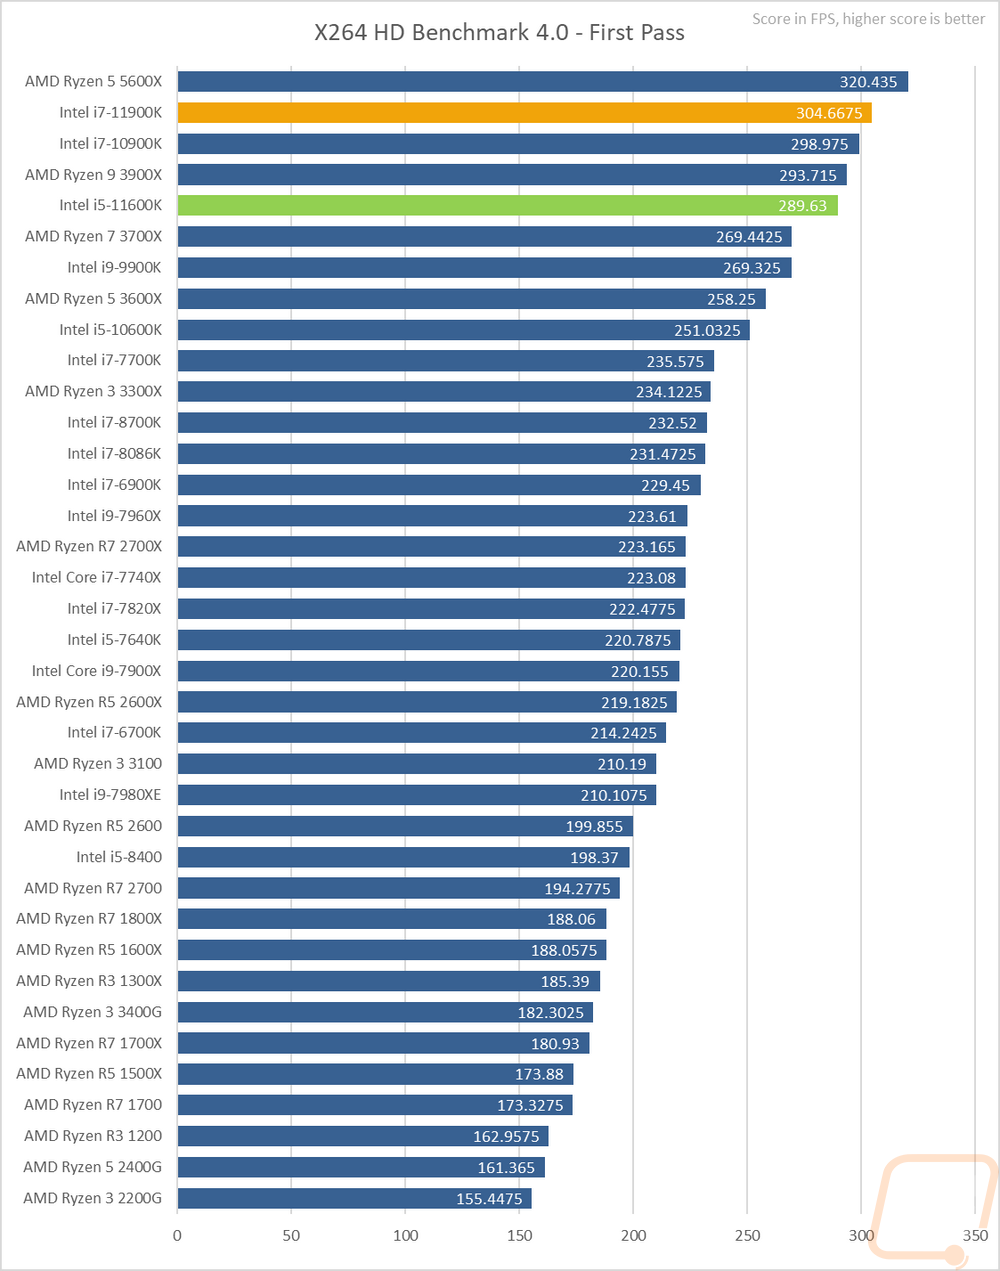
So for my first tests, I take a look at encoding performance using X264 HD with its older 4.0 and newer 5.0 versions. This is an area in which Intel has always done well but the last few generations of Ryzen have made huge steps forward. In the 5.0 test, the 11900K didn’t do too bad but wasn’t up at the top of the charts like you would expect. The decision to drop down to 8 cores made a difference here with the 10 core 10900K even outperforming in the first pass especially. The 11600K on the other hand didn’t do bad but did come in behind the AMD 5600X. In the older 4.0 test the 11900K did better being up at the top of the Intel CPUs test but the Ryzen 5600X (which was the only 5000 series Ryzen CPU we have been able to get our hands on) was out ahead on this IPC focused benchmark.
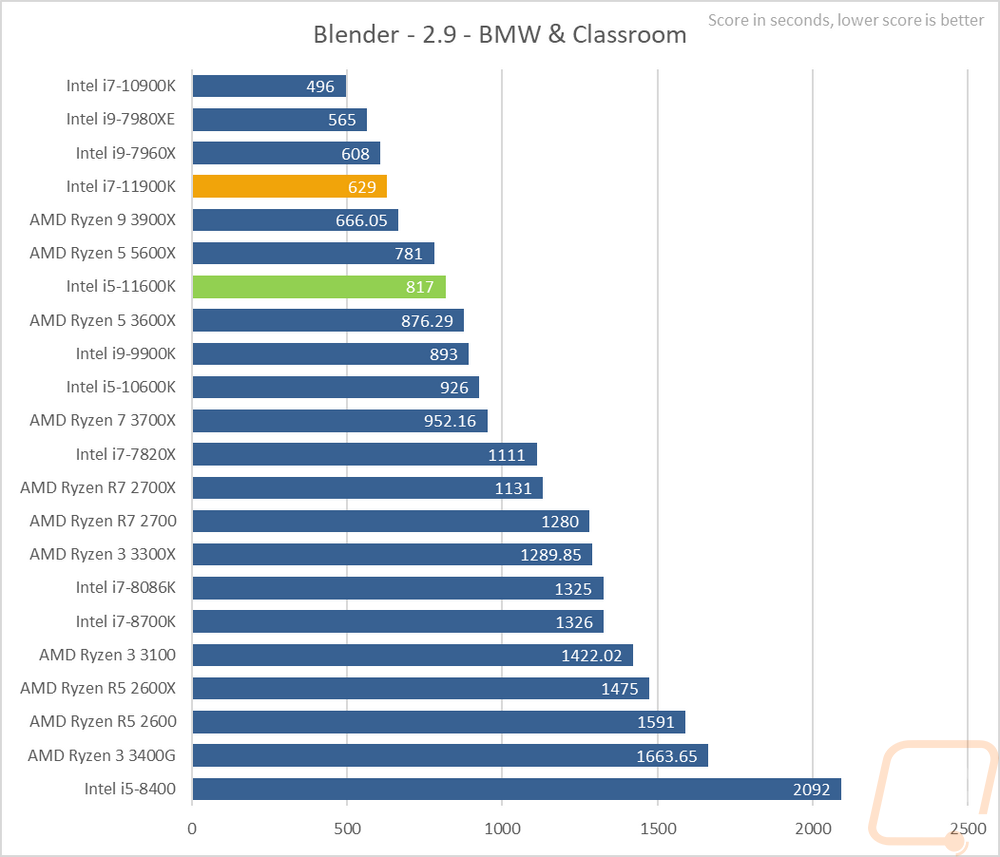
3D modeling is always popular and the open-source program blender is one of the best ways to get into it. I’ve run their standard benchmark on the quick benchmark setting. This test just times running through two files being rendered (BMW and Classroom). Lower scores are better here and while the 11900K didn’t do bad, the older high core count CPUs are still out ahead of it here as well as the 10900K with its extra two cores. The 11600K came in behind the 5600X but is a good bump in performance from last generation's 10600K.
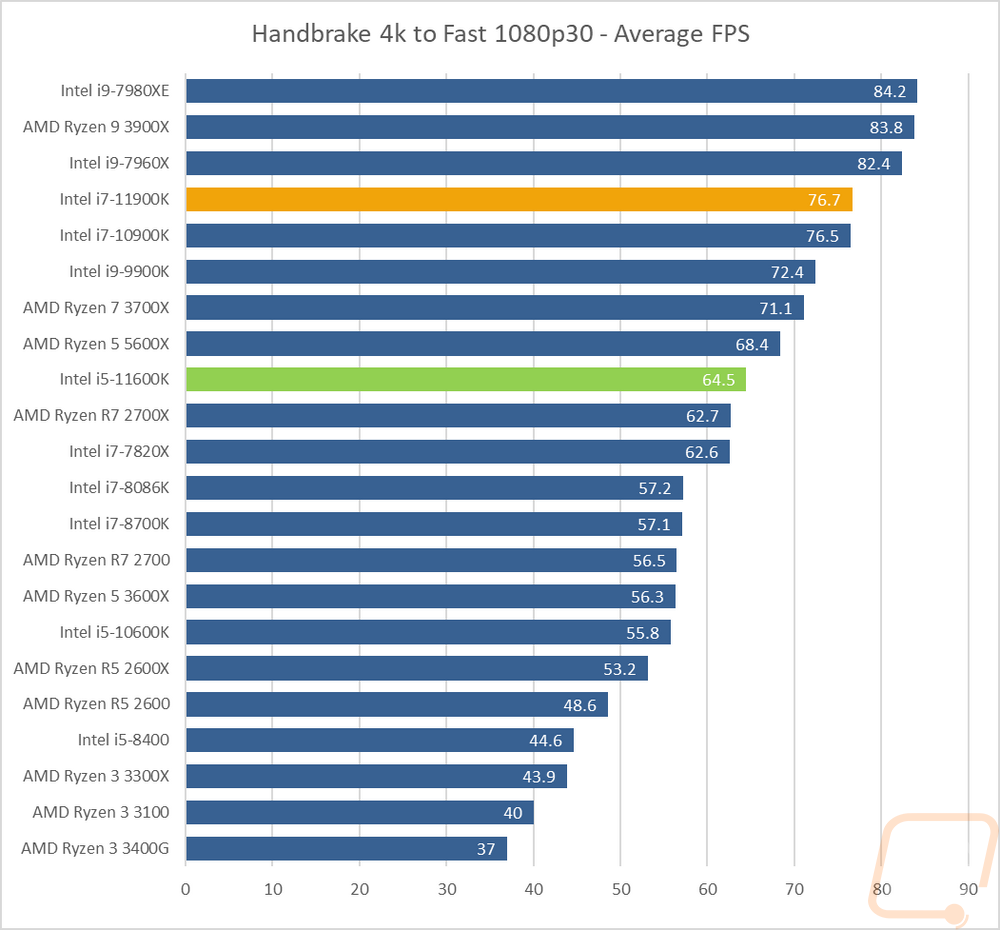
Continuing with the video encoding theme I also have handbrake which is a which is an open-source transcoder. For this test I am taking a 4k video down to 1080p 30 FPS, the results are the average FPS of that task. The higher core count CPUs are mostly out ahead here but the 11900K did come in nearly tied with the 10900K with its 2 extra cores. The 11600K was 4 FPS below the 5600X and a big jump over last year's 10600K.
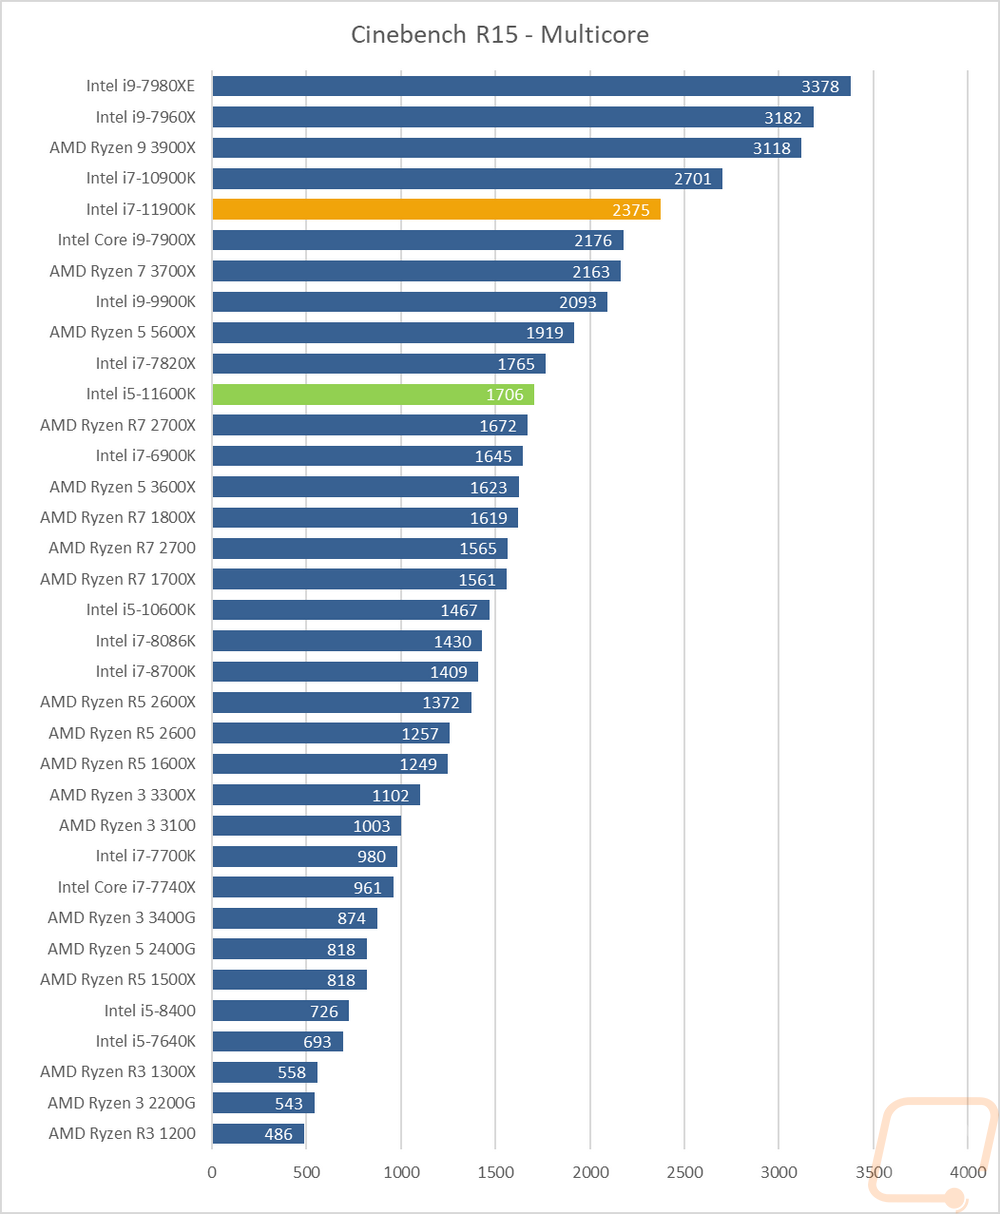
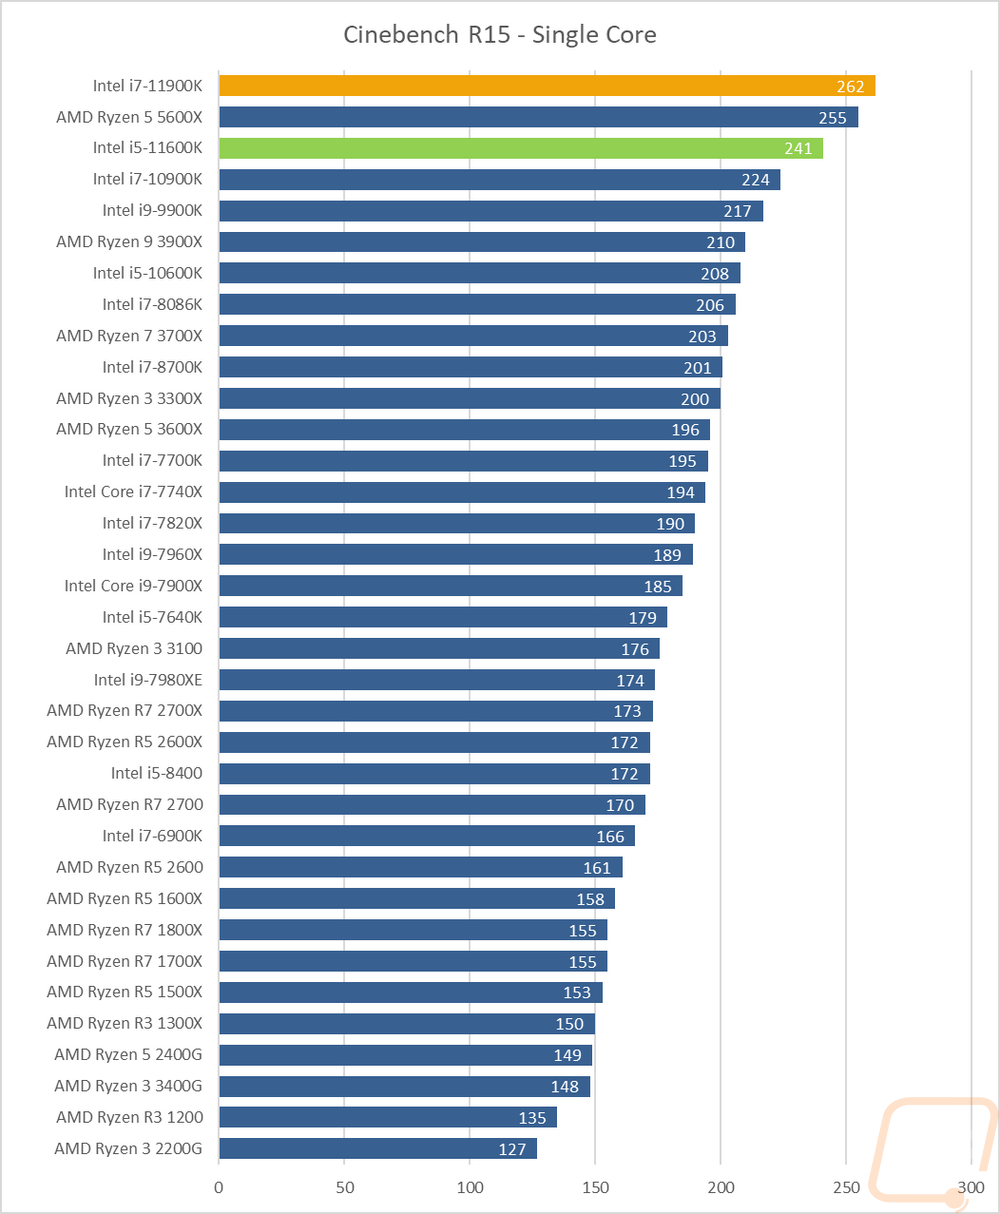
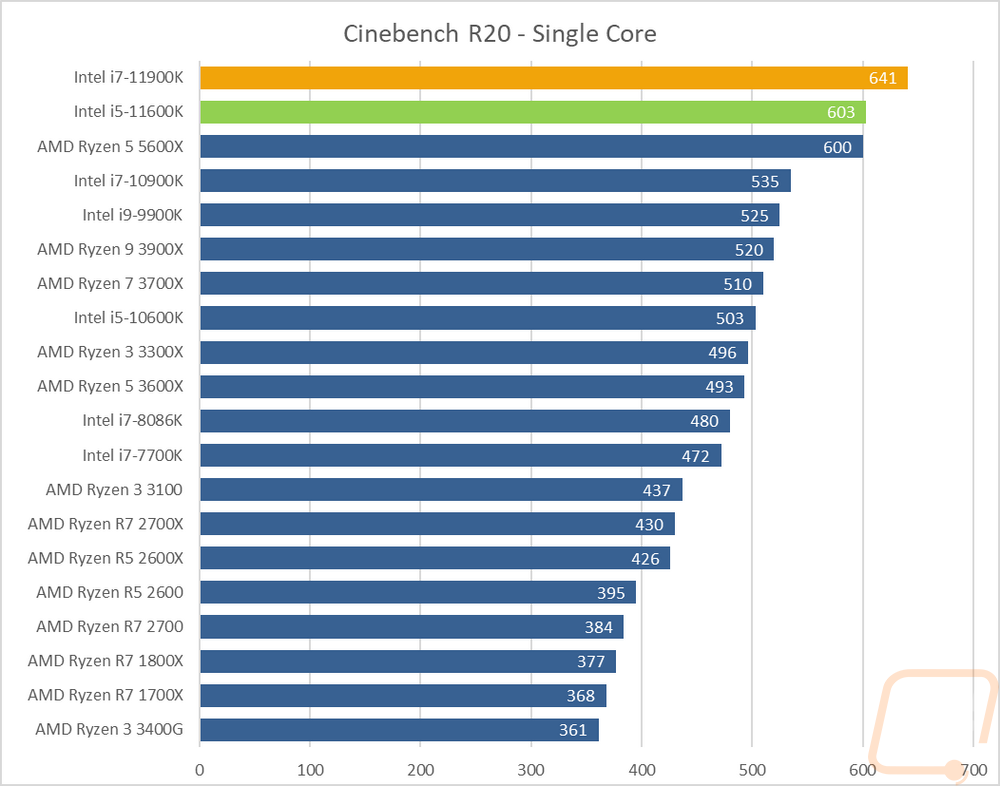
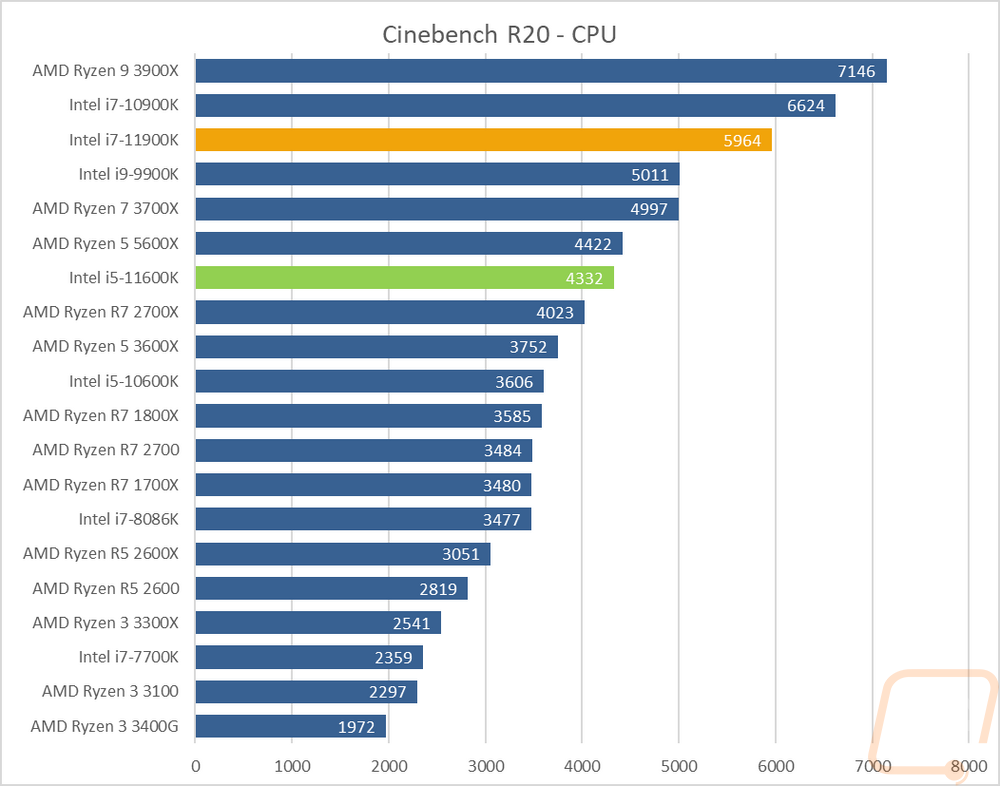
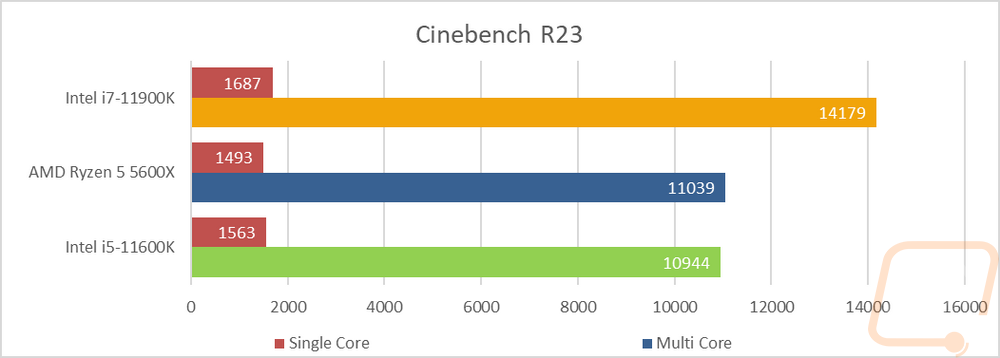
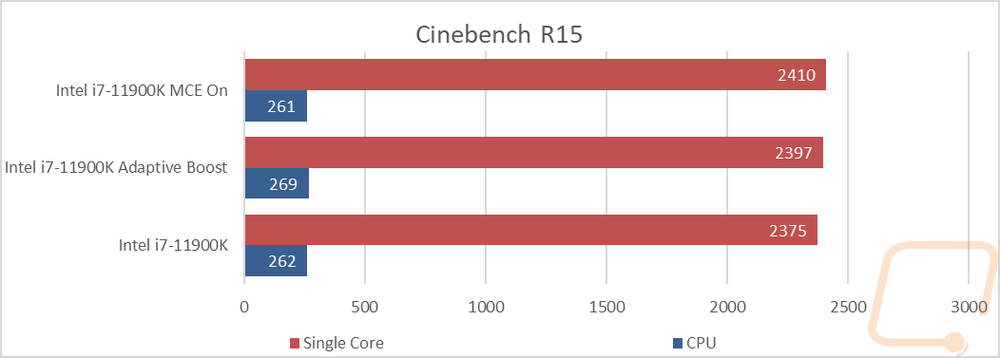
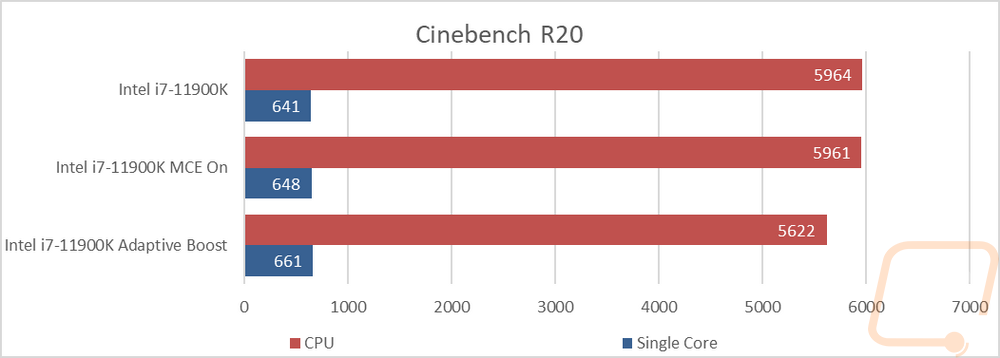
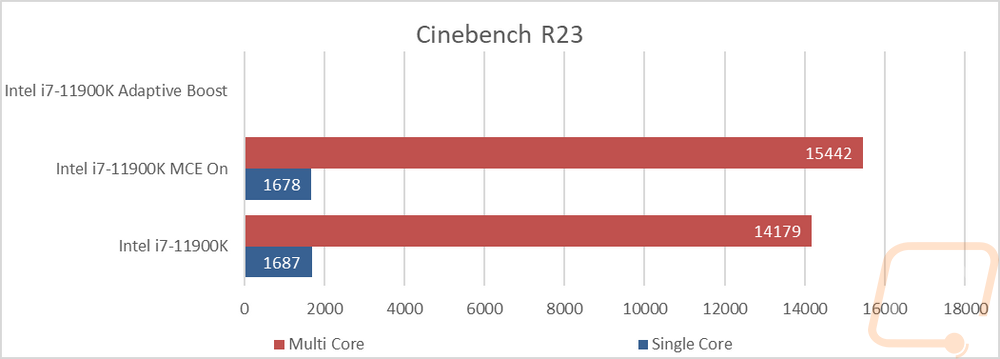
For the always popular Cinebench, I ran the older R15 test which better fits a 4 core CPU, and the new R20 for high core count CPUs as well as the latest R23 as well. R15 multicore has the 10+ core count CPUs out in front including the 10900K. But when it comes to pure IPC the 11900K was out in front with the 5600X behind it then the 11600K and then everything else. This was similar in R20 and R23 which had the two 11th gen core CPUs out ahead of the 5600X as well. But the multi-core tests in all three still come back down to core count as you would expect and the 11900K being down two cores couldn’t keep up even with a higher IPC.
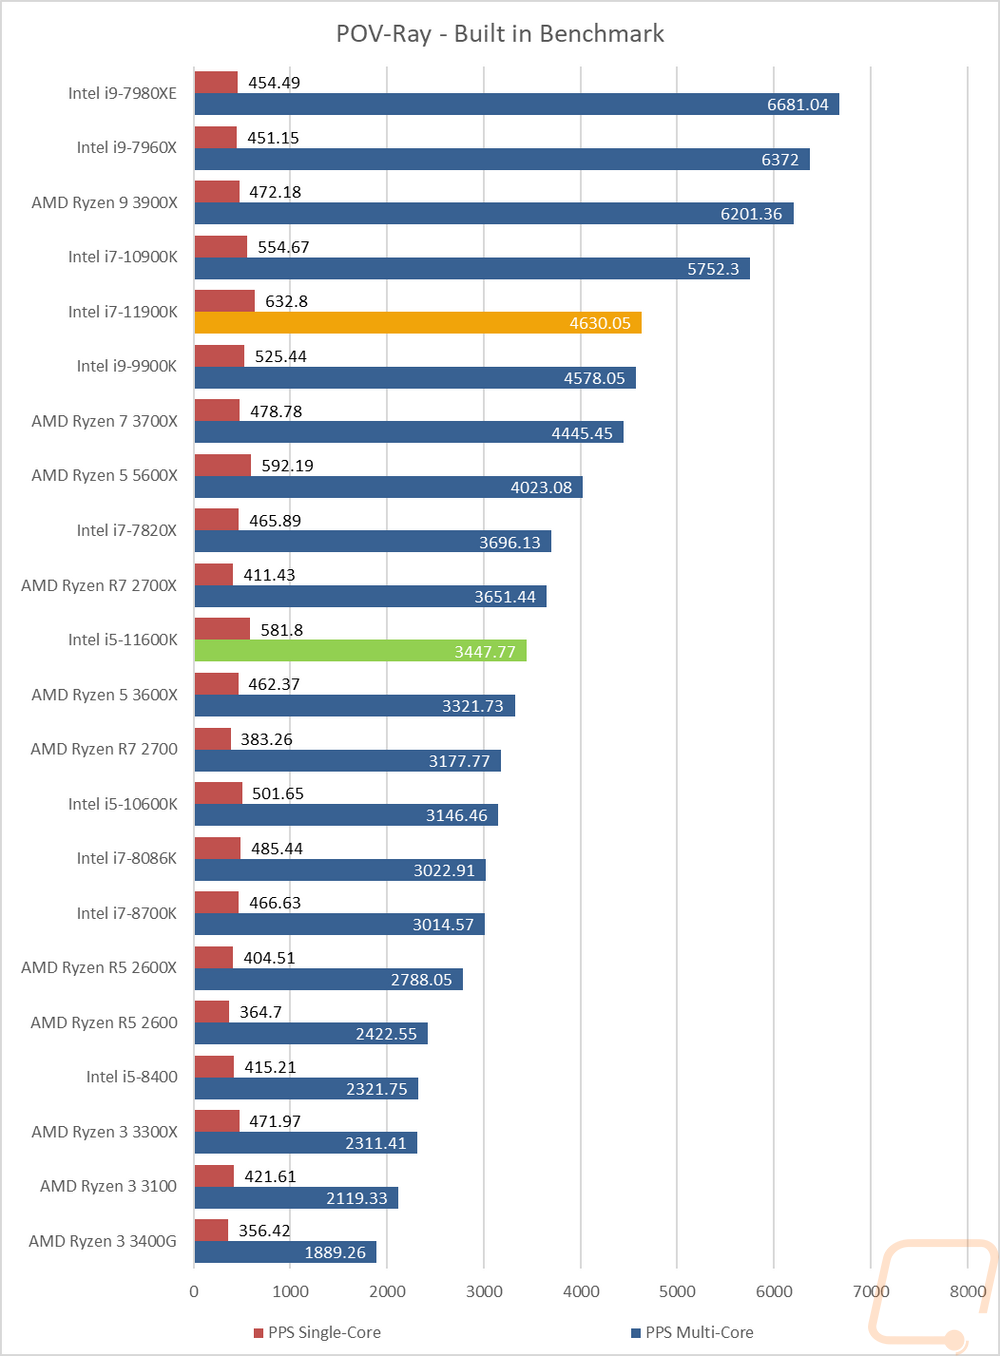
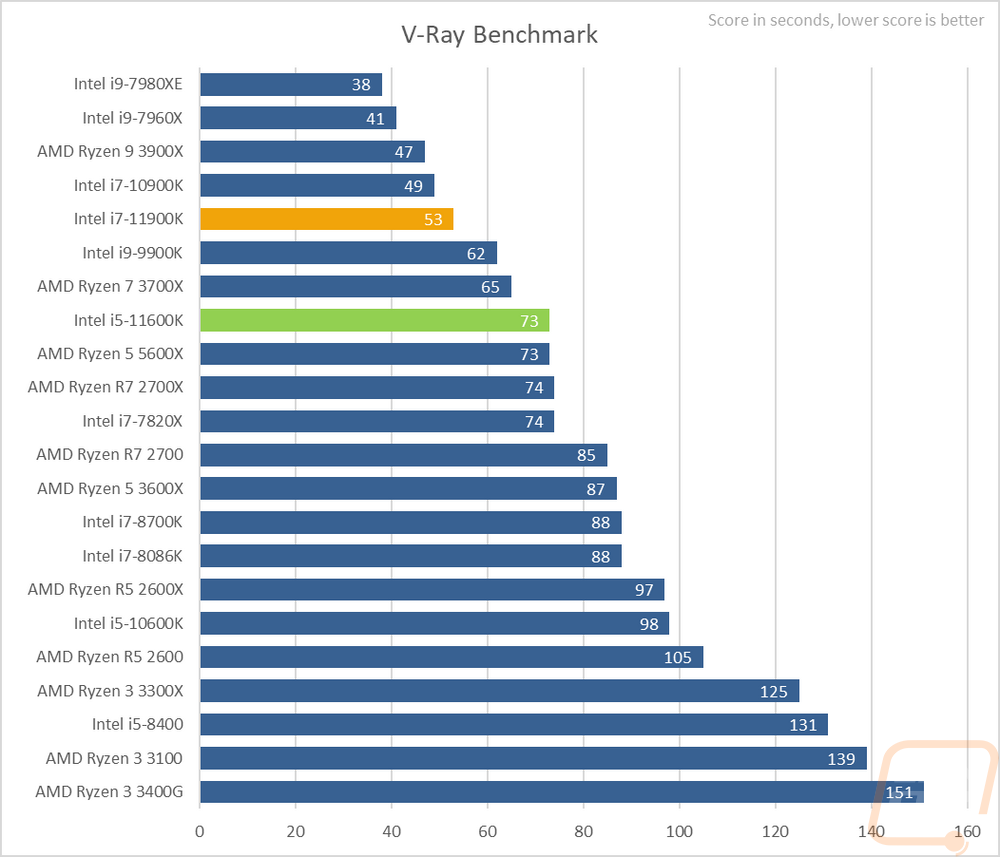
Ray tracing is picking up on the GPU side of things, but when it comes to rendering photos and sometimes videos it has been a thing for a while. I’ve run two benchmarks that check out the performance and in POV-Ray the higher core count CPUs still rule all in the multi-core test which has the 11900K even right with the older 9900K even with a big IPC improvement between the two. The single-core test however has the 11900K out in front there with the 5600X the first CPU back. In V-Ray, the core count still defined the results with even the 11600K and the 5600X tied as well.
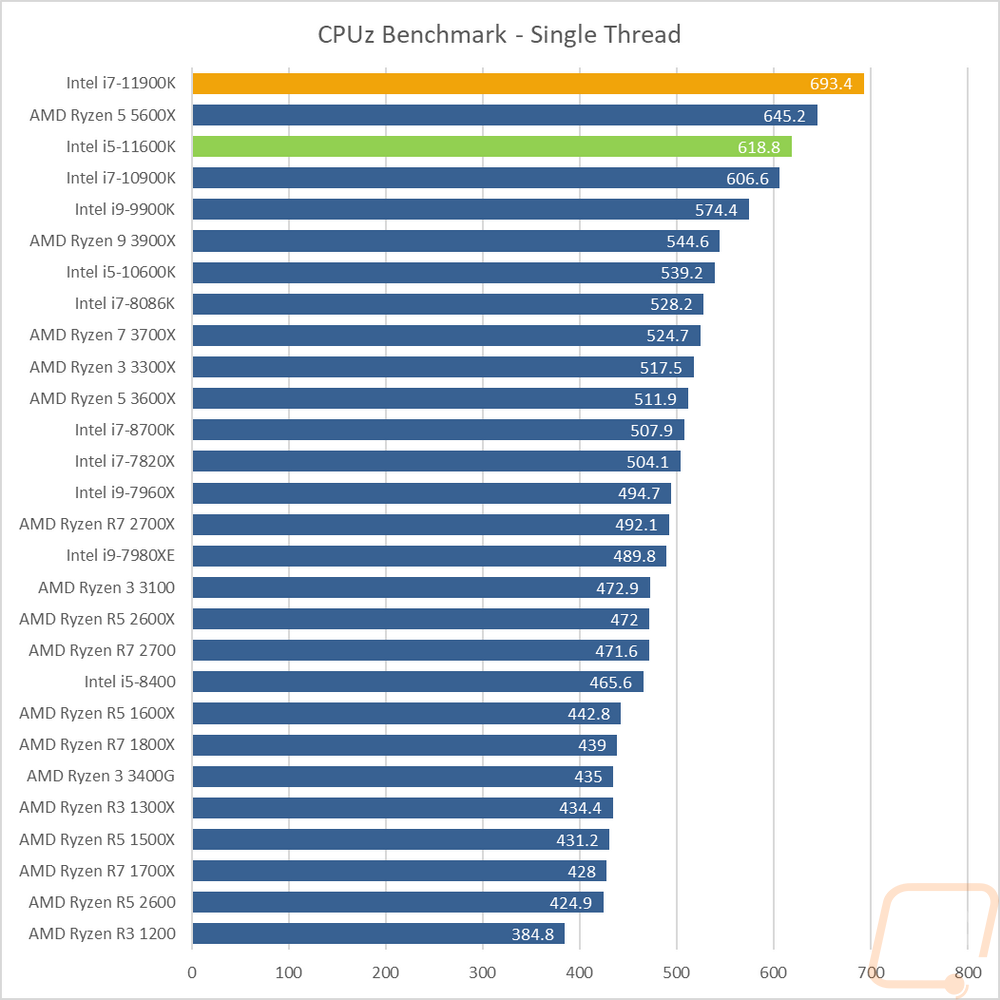
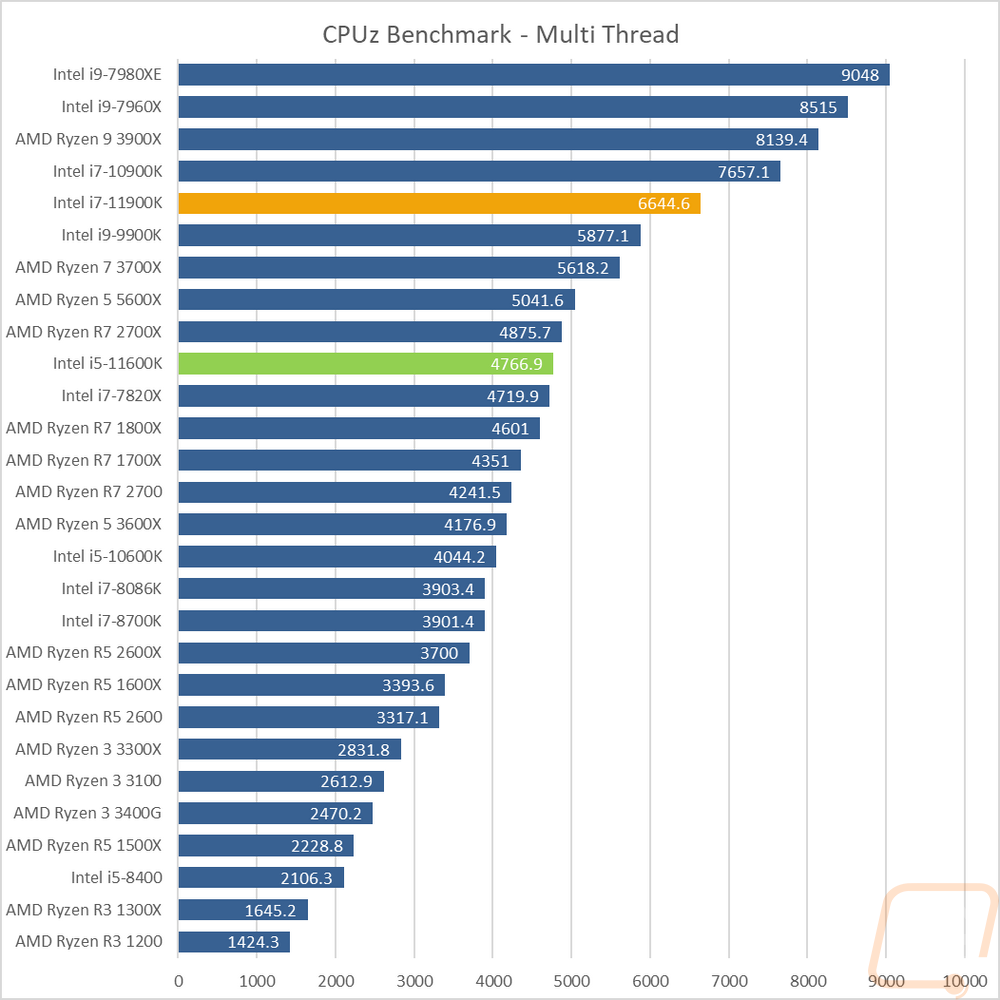
Most people use CPUz to check out a few clock speeds, your BIOS version, and other information. But they do have a benchmark slipped in as well at the back and I like it because it does split up performance between multi-core and single-core. The single-core test here has the 11900K way out ahead of the pack which isn’t a surprise, the 5600X in second, then the 11600K behind that running near the 10900K. The multi-thread test on the other hand is sorted again by core count.
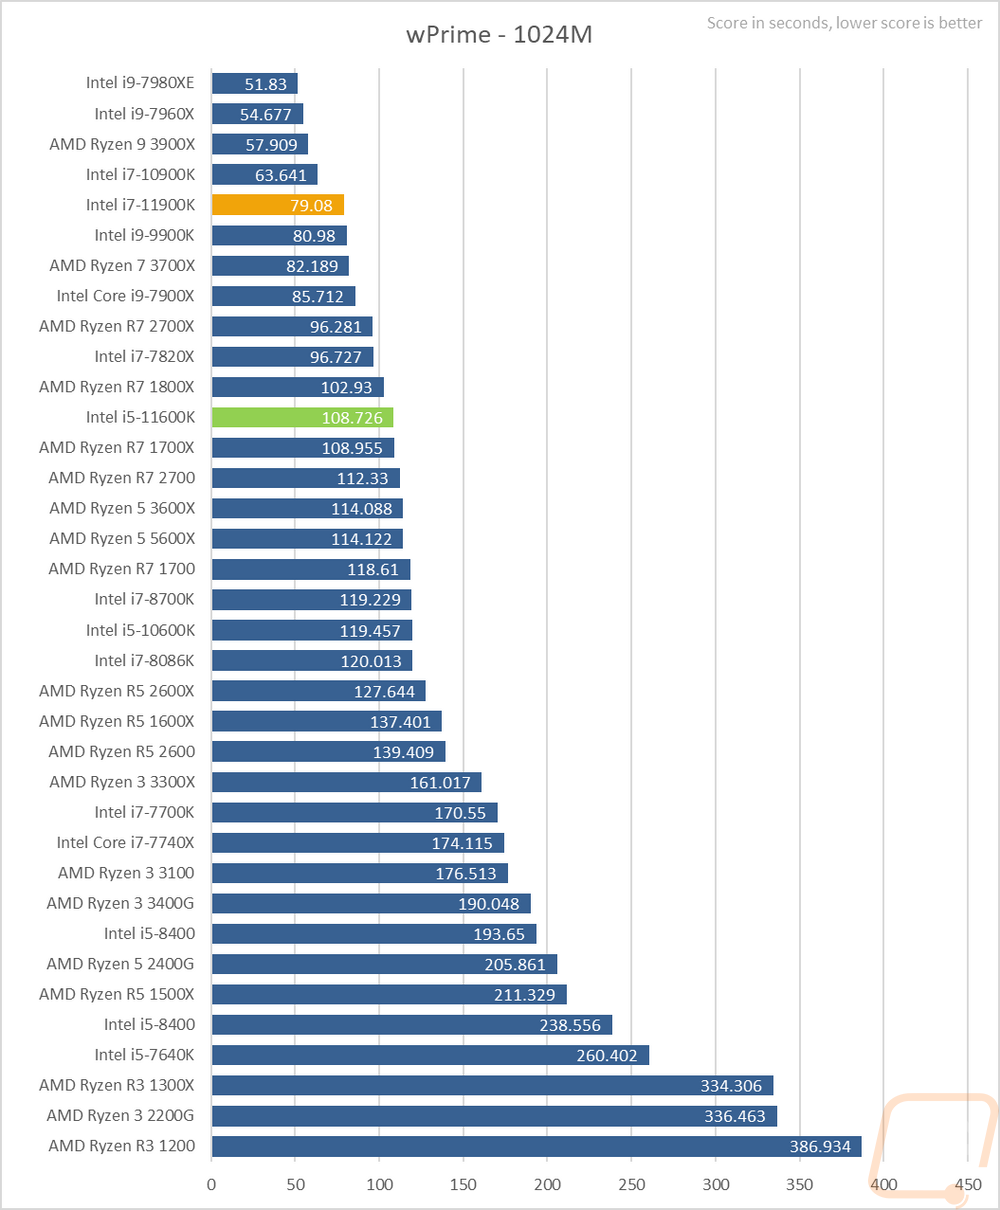
Going back to the basics I tested with wPrime which is an old overclocking favorite that takes a look at the time it takes to calculate prime out to 1024 million. Core count is still king here, but clock speed does help which is why overclockers have used this one. The 11900K is up near the top behind all of the higher core count CPUs. The IPC gap between it and the 9900K was only enough to shave off a little under two seconds when you compare the two. Here the 10600K is out way ahead of the 5600X.
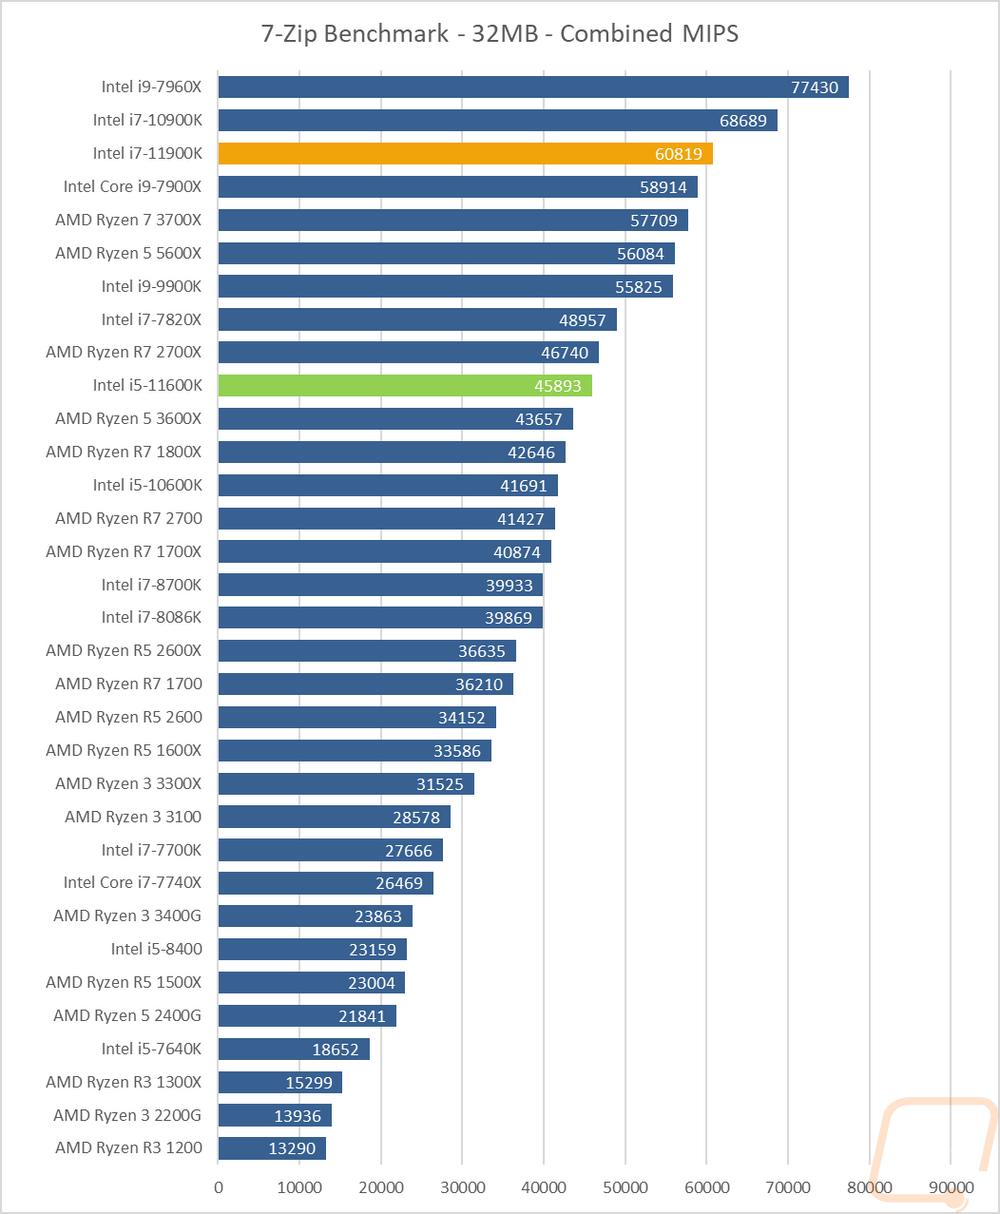
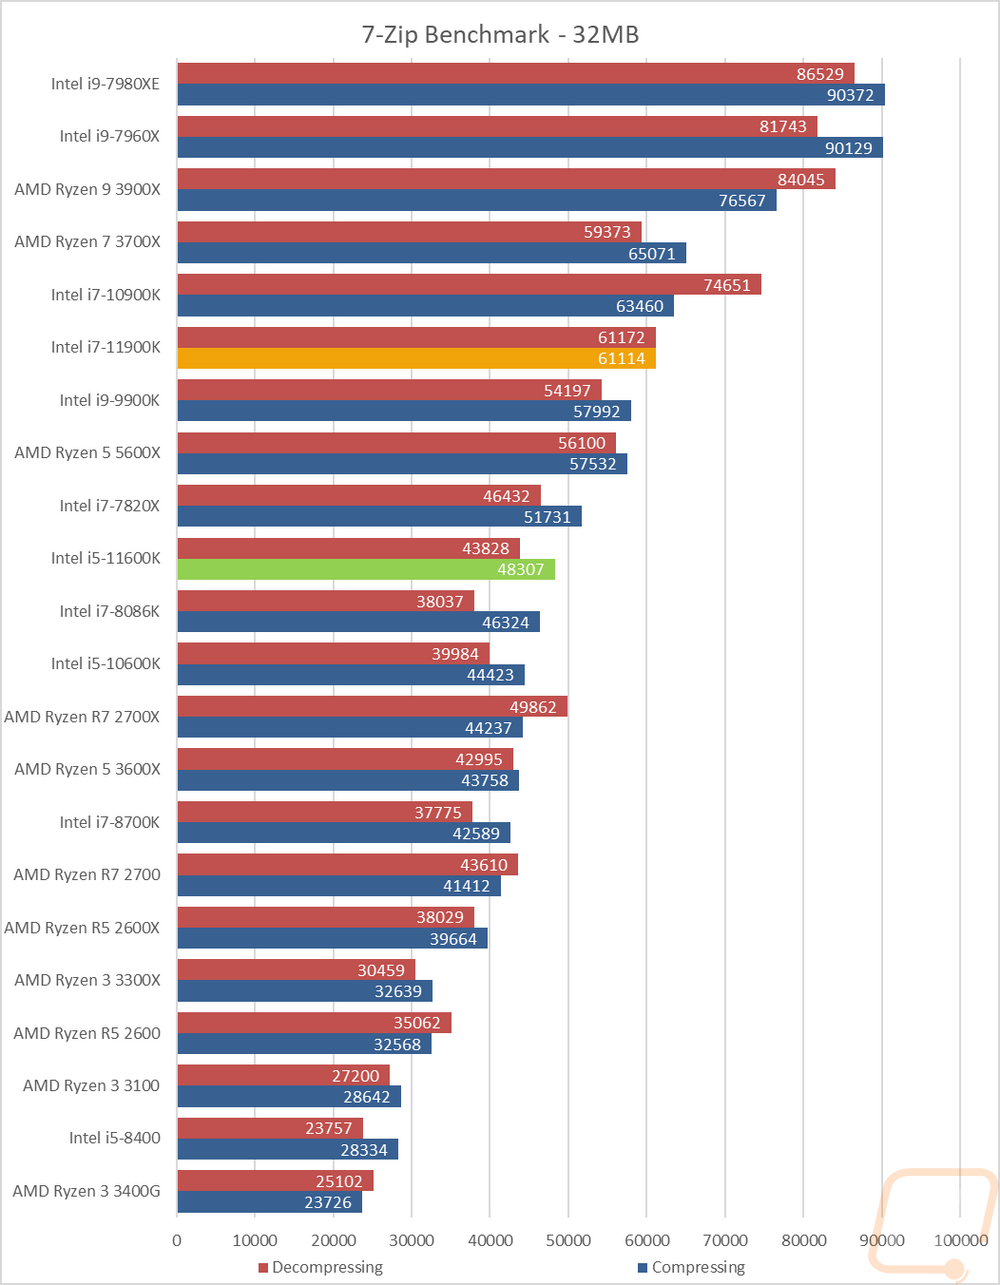
7 Zip is another open-source program, this time for compressing and decompressing all of your files. Here I have run the benchmark and we have three results. The combined MIPS which is a combination of compressing and decompressing performance. Then I have it broken down between the two. This workload likes extra cores which can be seen with the Core-X CPUs, 10900K, and high core count Ryzen CPUs up at the top. The combined MIPS results on the other hand still have the higher core counts up top but with the 11900K up closer to the top.
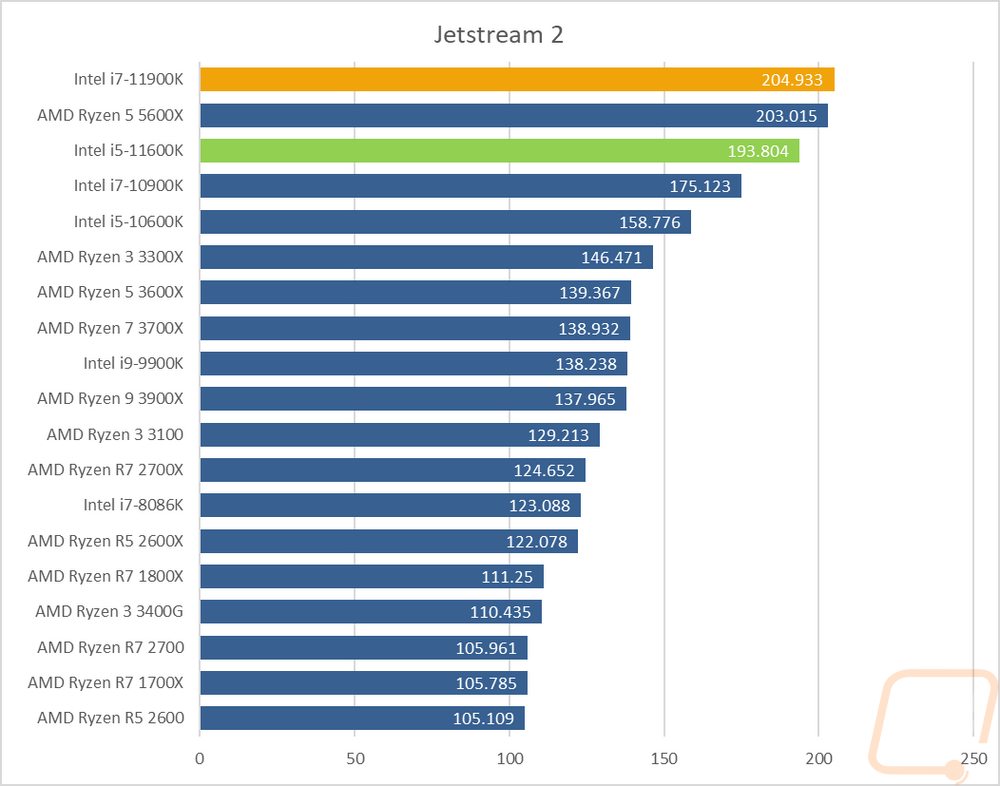
Jetstream 2 is a compilation benchmark which takes a long list of HTML5 and Java in-browser tests and runs them all three times and puts together an overall score. I love this benchmark because lets be honest, most people are using their browser more than any other game or program. Jetstream gives some interesting results sometimes though. It does tend to favor higher IPC which you can see with the 11900K at the top and the 5600X and 10600K behind that.
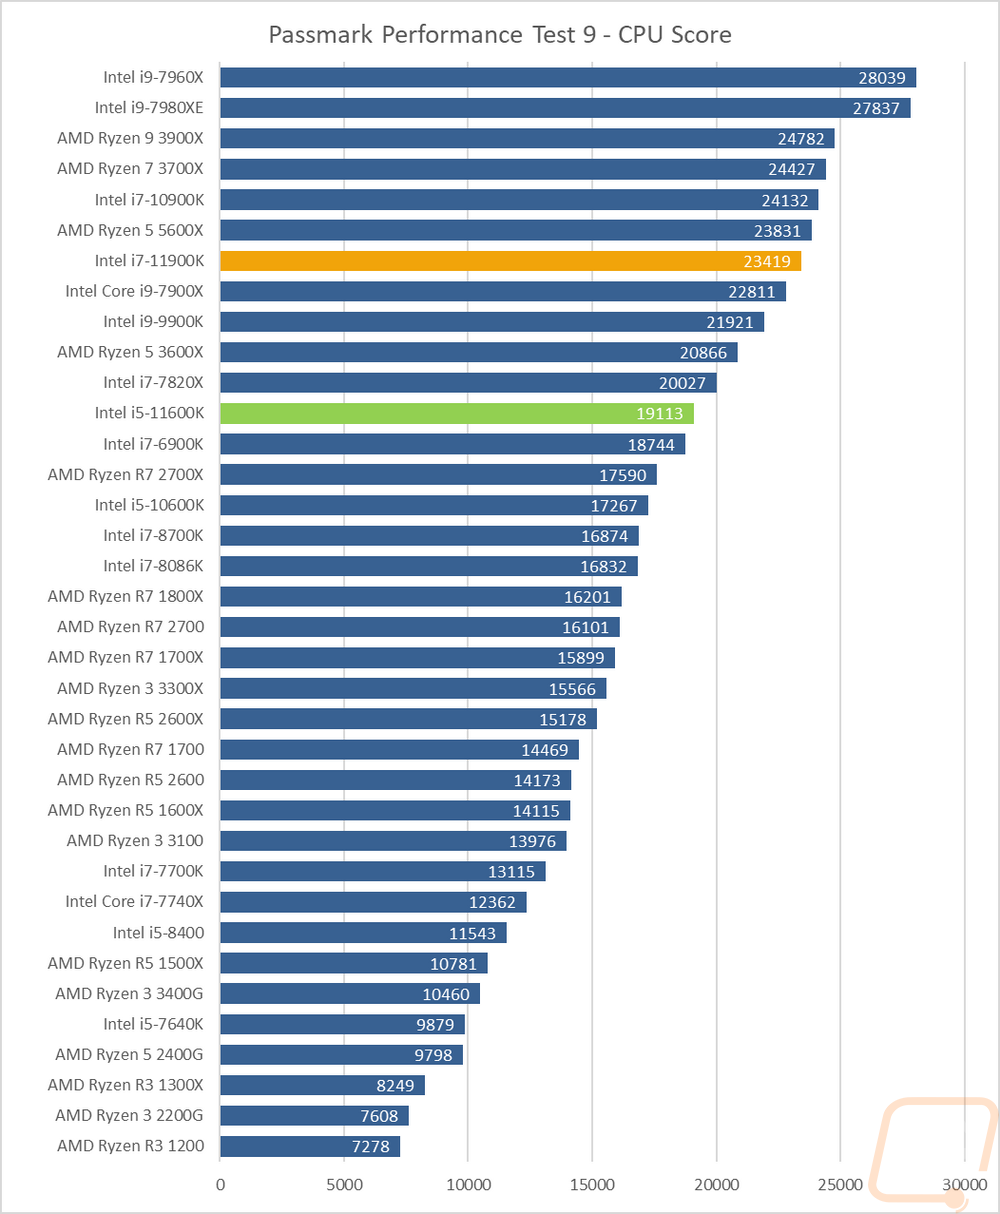
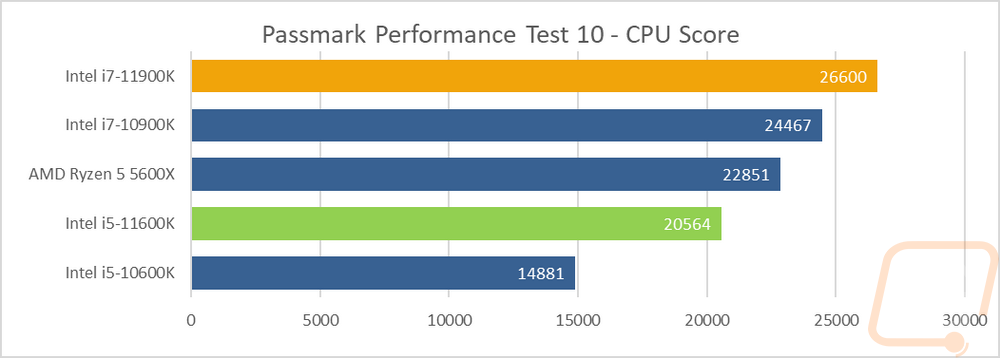
In Passmark performance test, I ran the full CPU benchmark to get a score. I did this using the older 9.0 and the newer 10.0 tests. It isn’t a big surprise however that these like higher core counts with the 10+ core CPUs up top but the 5600X did really well here and is out ahead of the 11900K and the 11600K in Passmark 9. In 10 it favors IPC more with the 11900K out ahead of the 10900K.
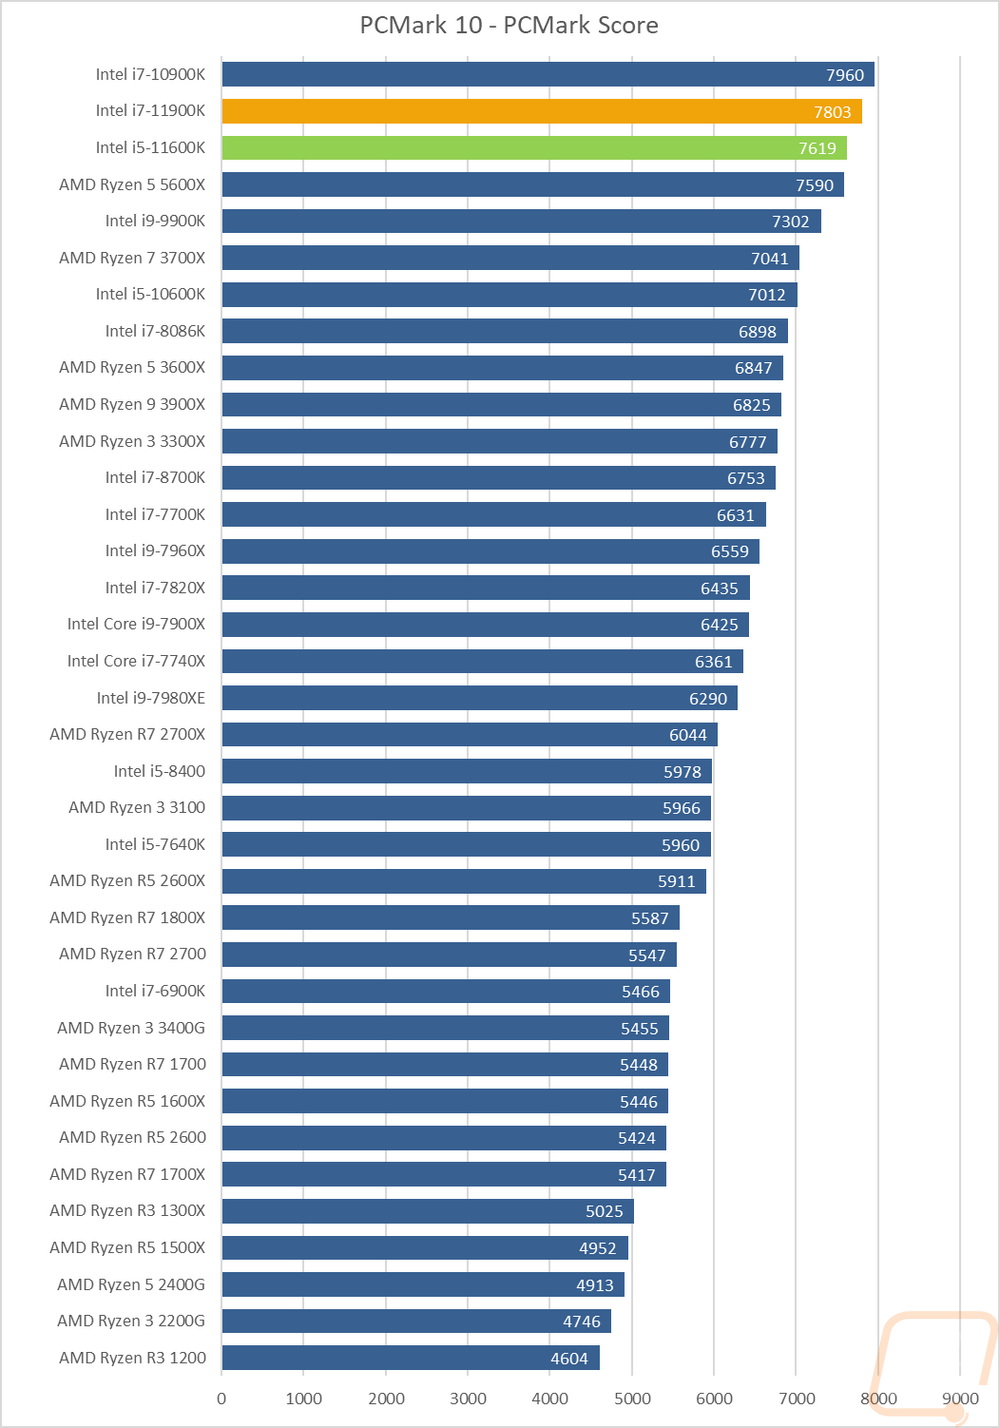
PCMark 10 is a great test because it tests things like video calls, browser performance, excel, and word performance to give an idea of real-world performance. It tends to like higher clock speeds and that is clear when you see the top CPUs but I was surprised that the 11900K came in behind the 10900K here.
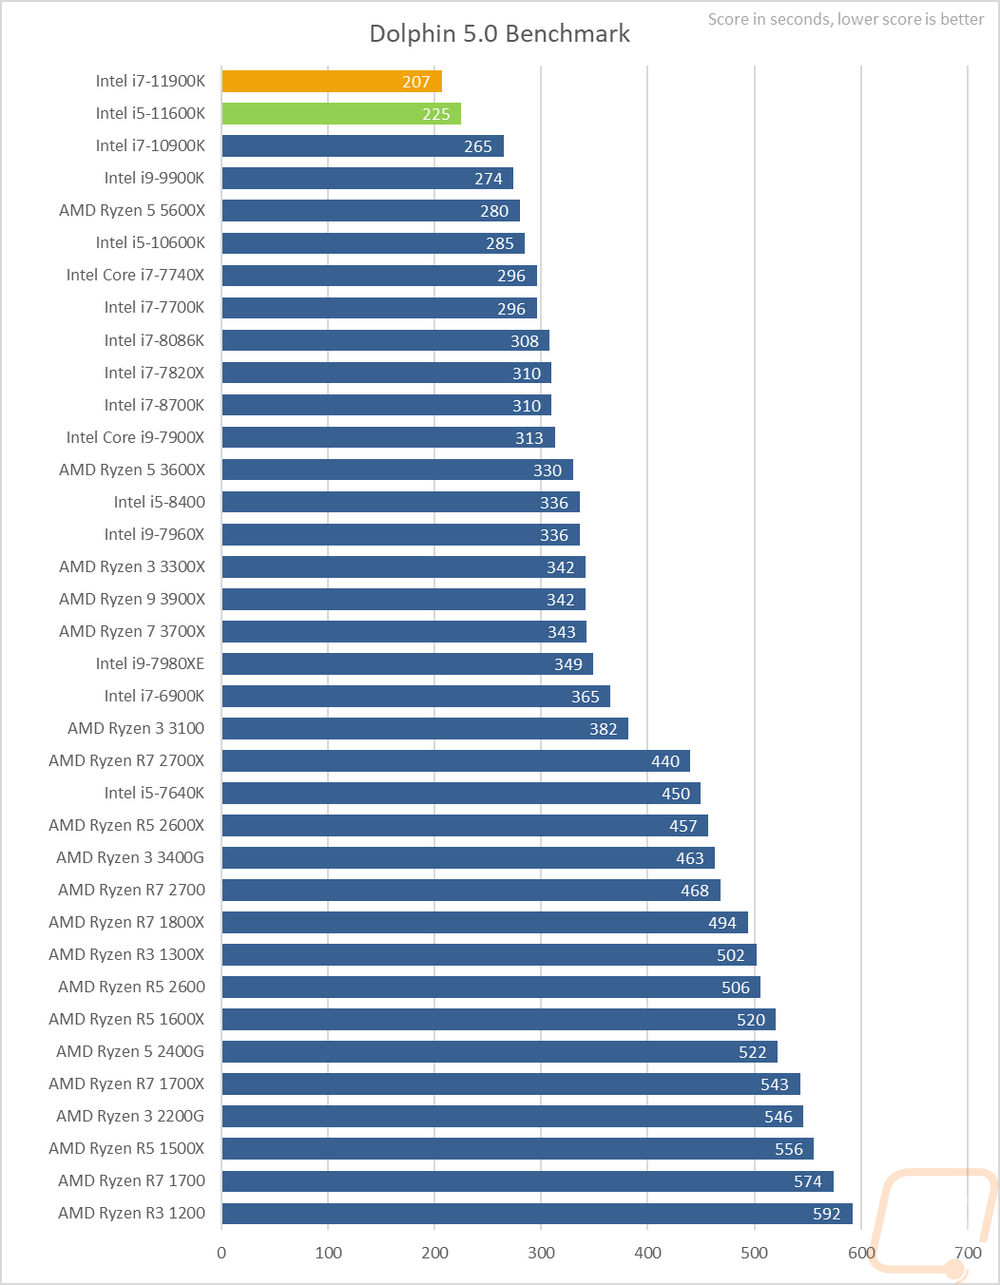
Dolphin 5.0 is a Wii emulator and like most emulators, it doesn’t care about high core counts at all. In fact, it only runs two in total. Clock speeds are king here, in addition to Dolphin favoring Intel in general. The 11900K and the 11600K top the chart here with a big gap between them and even the 10900K.
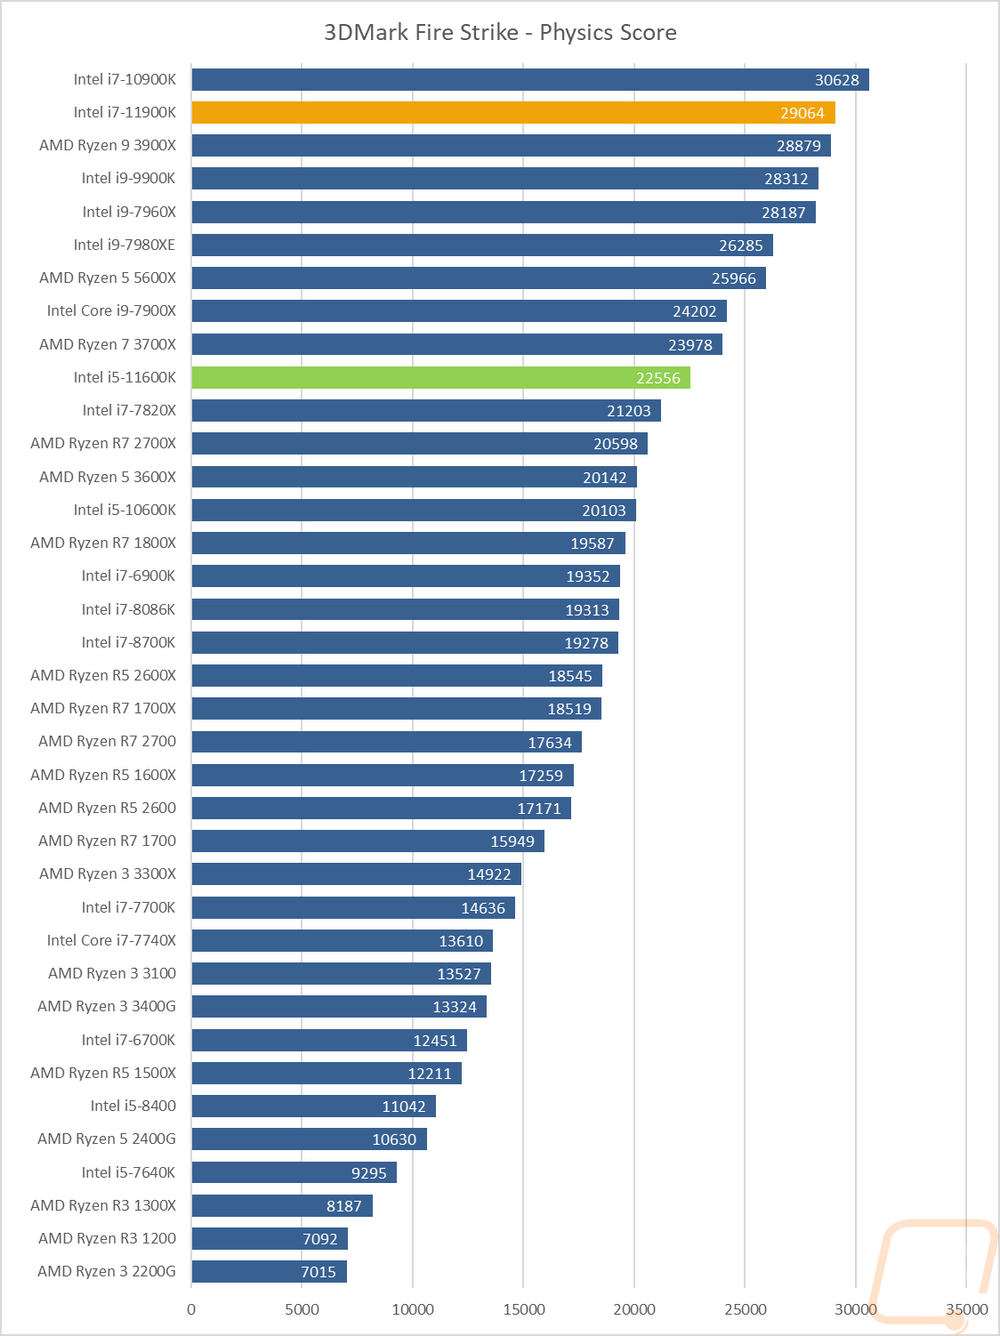
Before diving into game testing I wanted to check out synthetic performance using 3DMark Fire Strike, focusing specifically on the Physics Score which is CPU dependent. The 10900K still tops this chart with its combination of cores and clock speed. The 11900K is behind that but is surprisingly close to the 3900X which uses its four extra cores to make up some ground here.
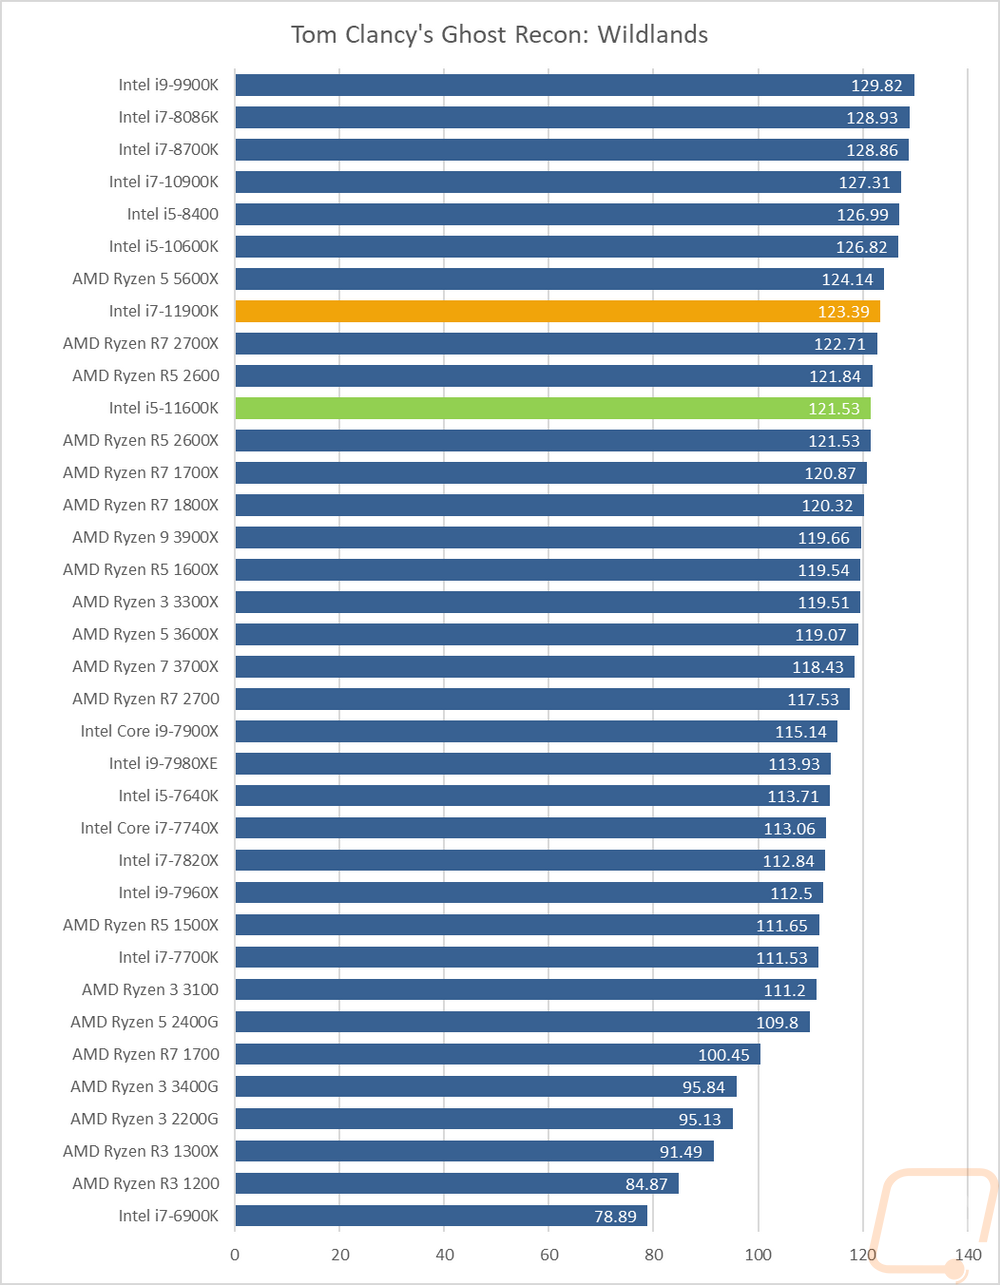
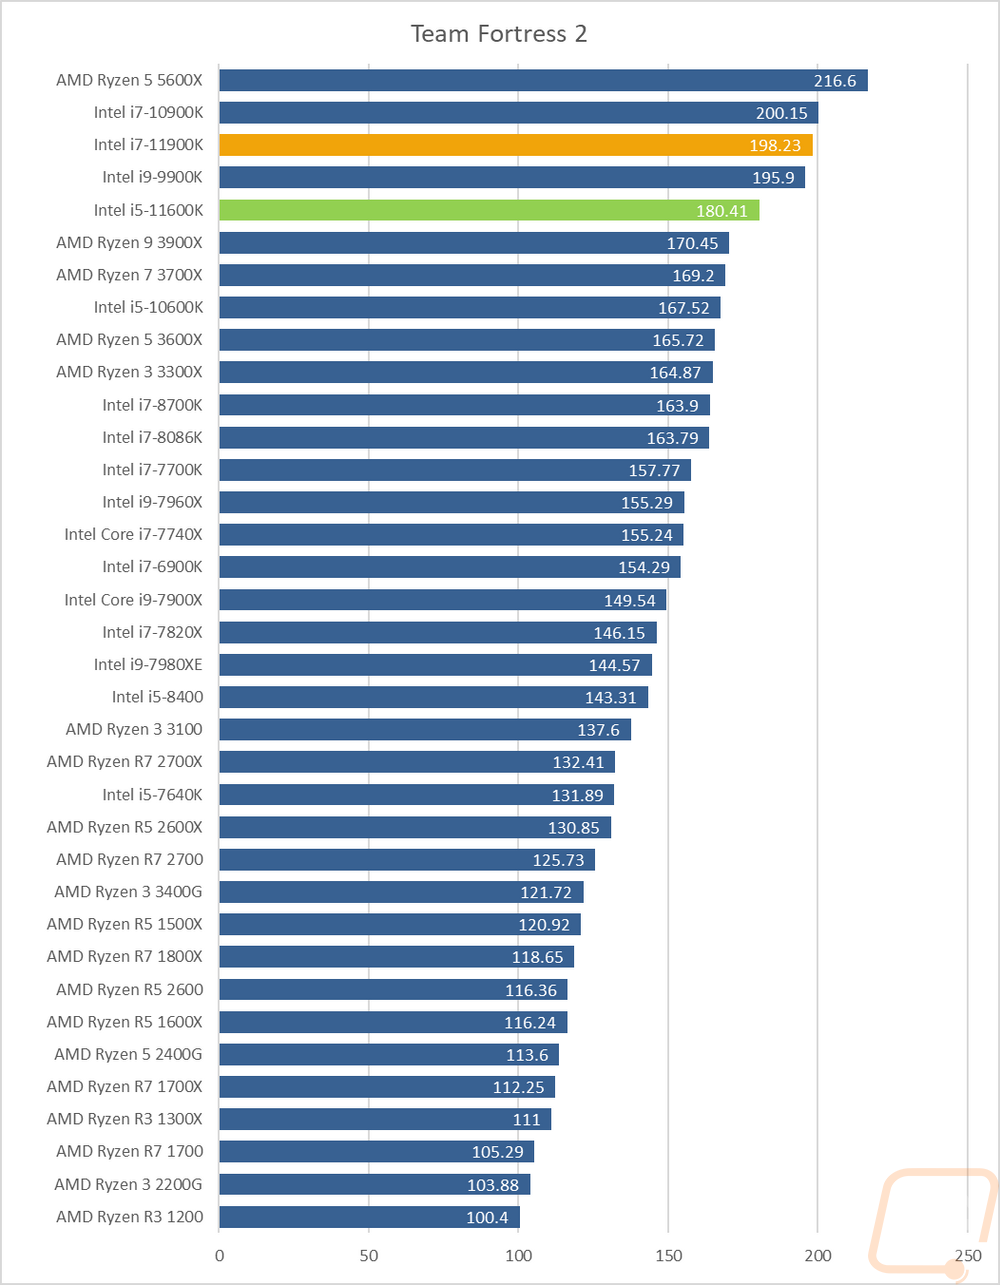
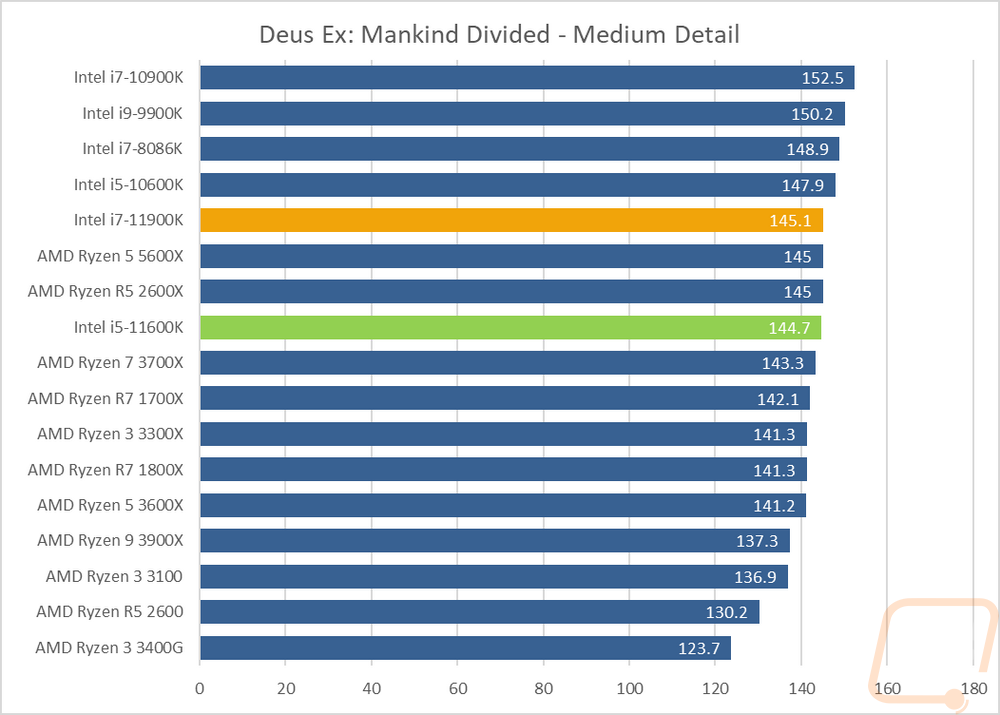
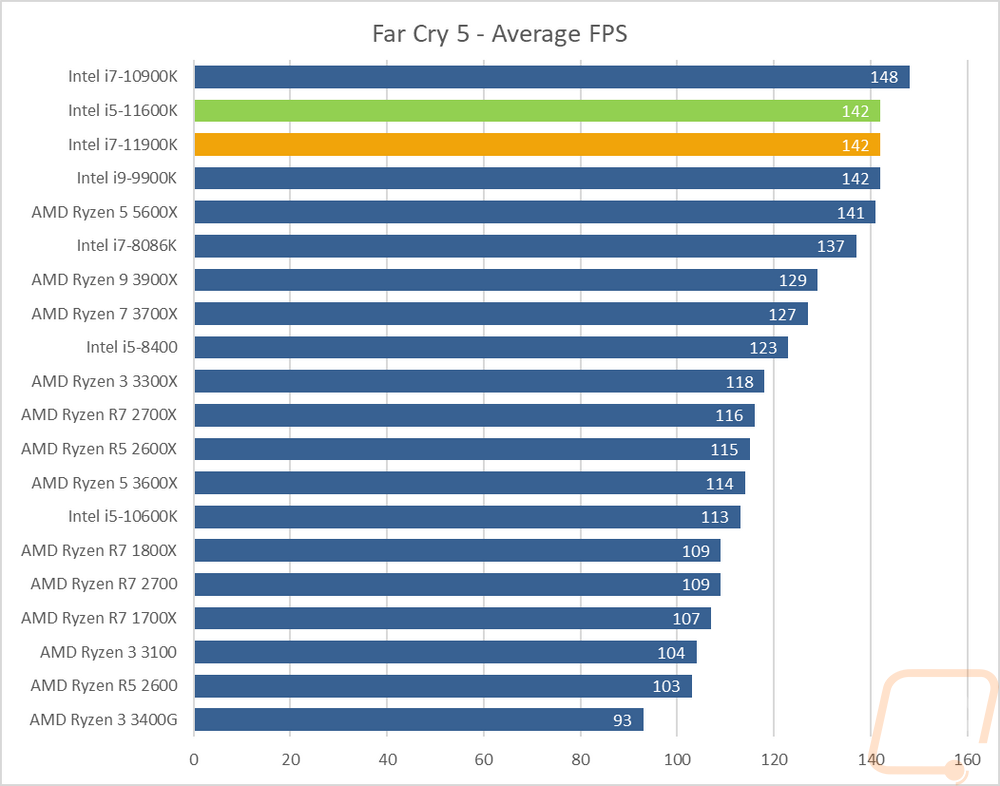
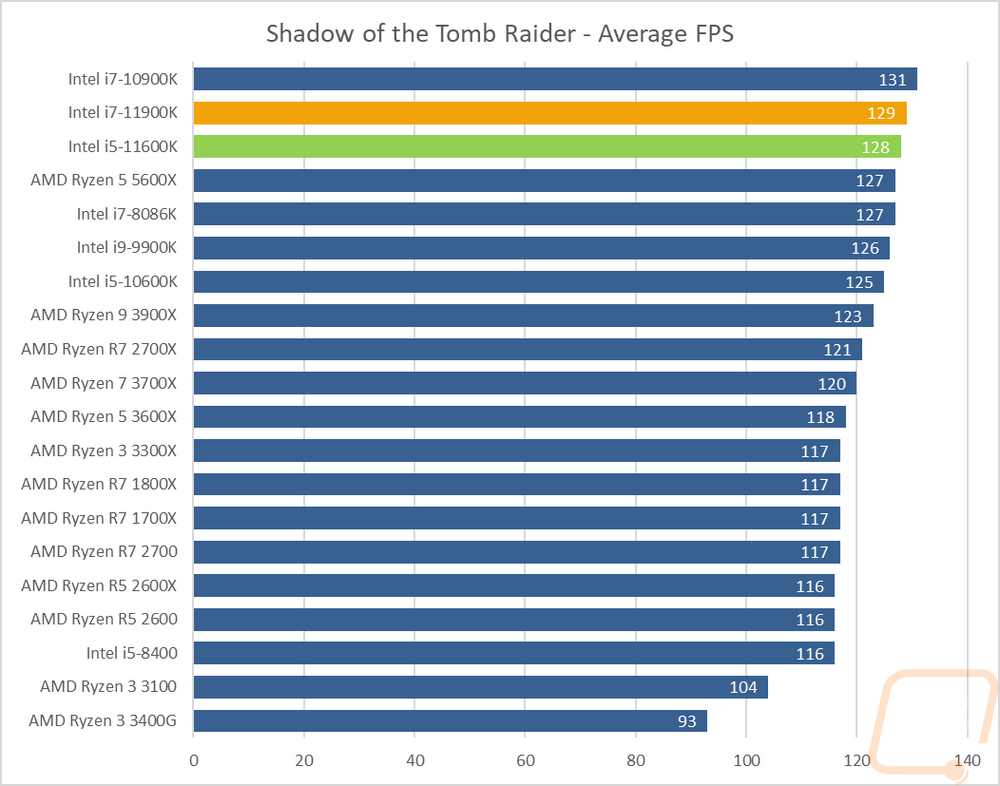
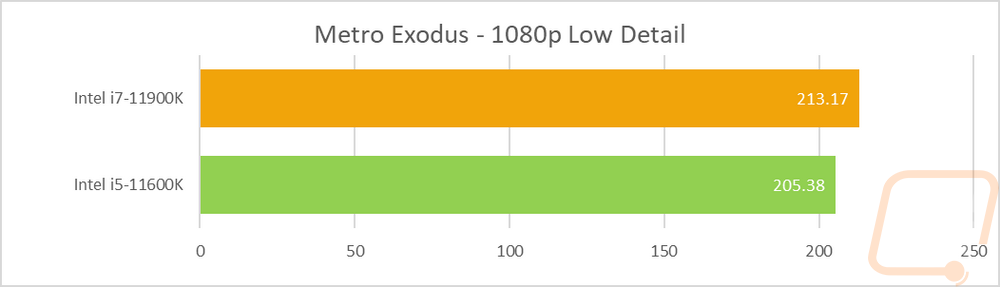
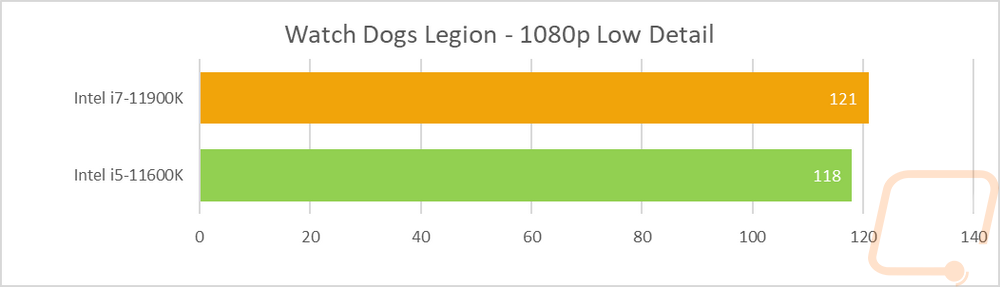
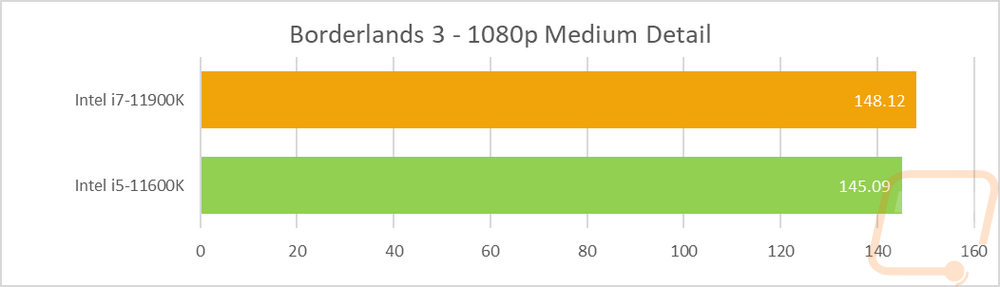
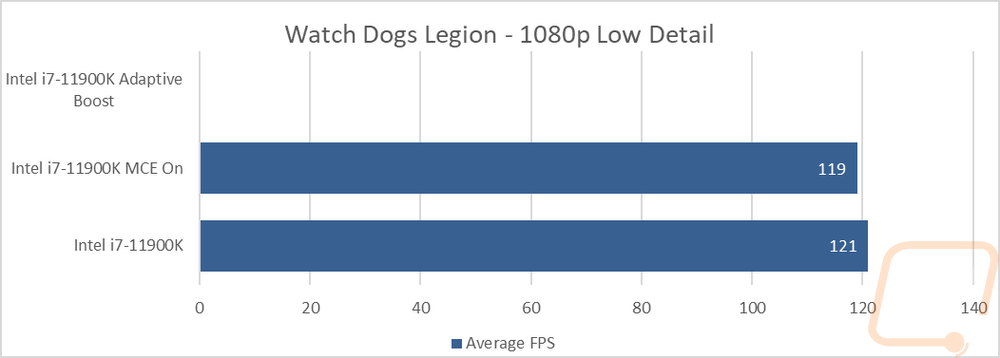
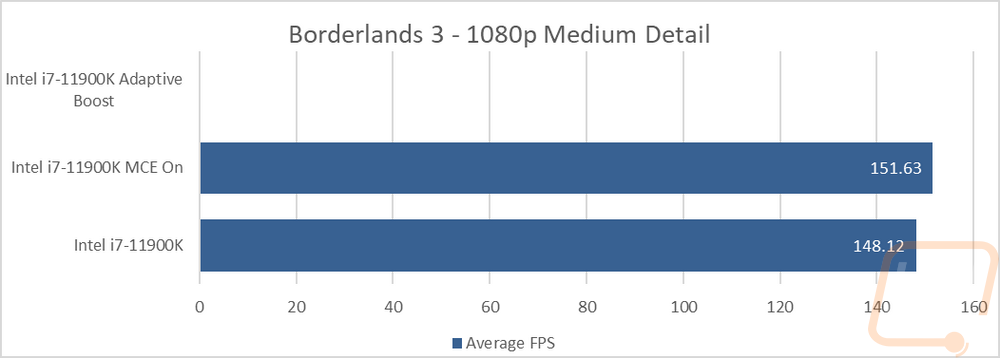
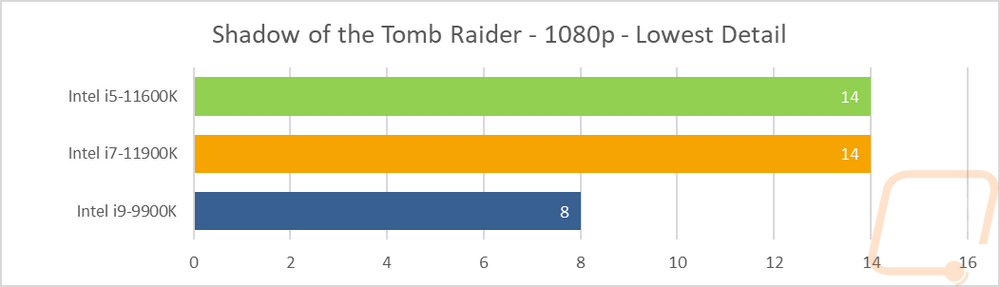
For in-game performance testing on the i9-119000K and the i5-11600K, I ran them through a variety of new and old games. TF2 for example is a very old game at this point that is very CPU-dependent. Ryzen has made big improvements here with the 5600X out ahead. Then behind that the 10900K and 11900K are right with each other and the 9900K then the 11600K. The other games tested were mostly consistent in having the 10900K still out ahead which is interesting. Then behind that the 11900K and the 11600K were right together, showing that the core count or price difference isn’t all that important when it comes to gaming. Down at the end, I also added in a few newer games running at lower detail settings to mix things up as well for future comparisons and to show that even when paired with a now old GPU (1080Ti) that newer games with a solid CPU can still get you high refresh capable performance.
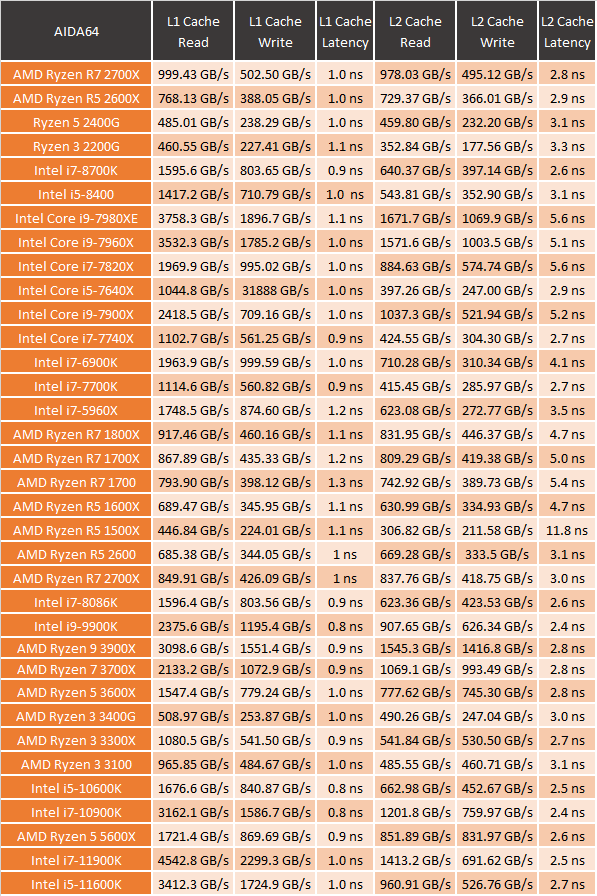
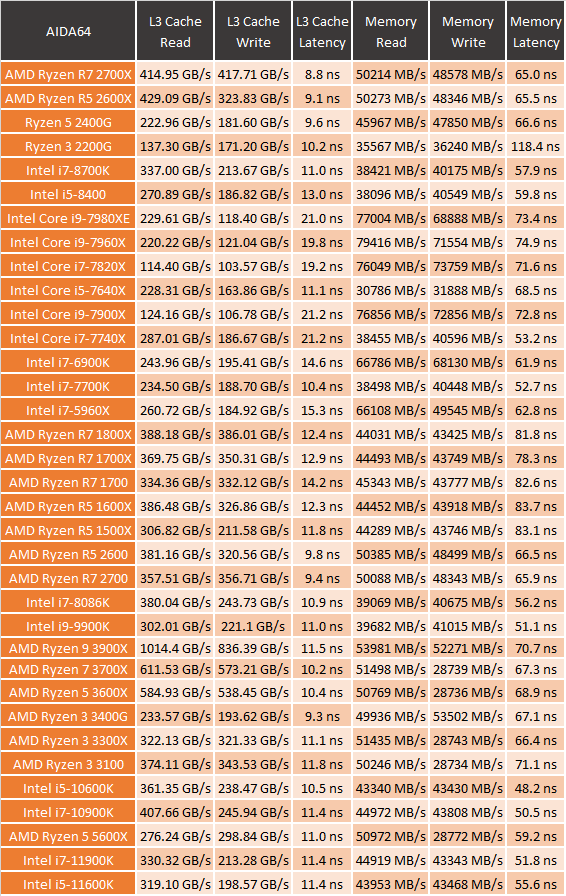
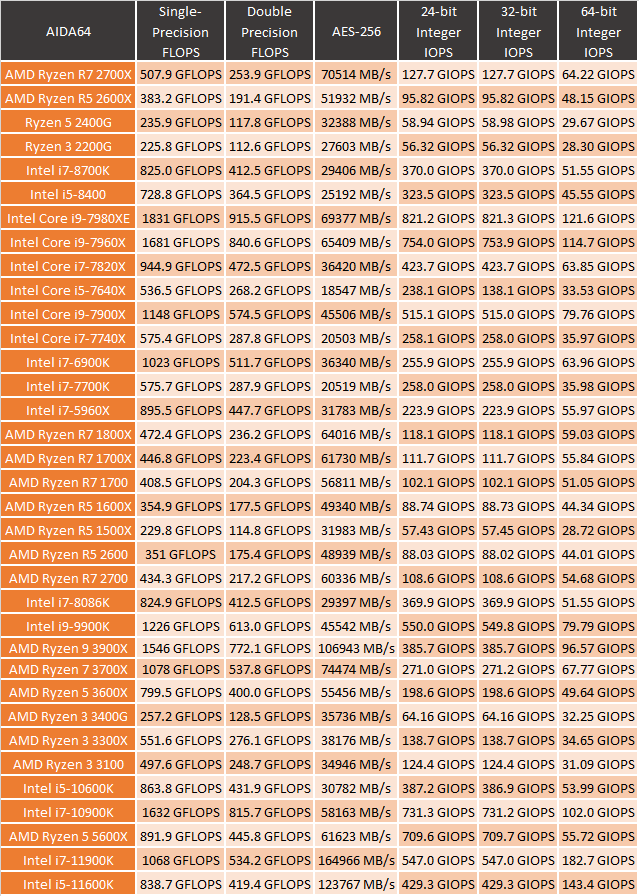
I did also run the whole series of tests in AIDA64 which let us take a look at aspects like memory speeds, latency, and cache performance. There are so many results though I am unable to graph them all and keep them readable. The 11900K does have a big jump in the L1 cache over the 10900K and smaller but still significant improvements with the L2 but L3 was slower for both the 11900K and 11600K. Memory performance was similar from the 10th gen core CPUs to the 11th gen but lower than what the latest Ryzen CPU is getting, at least on the memory reads. Single precision flops are down from the 10900K to the 11900K as well, which are partially from the lower core count. Same for the Integer IOPS as well.
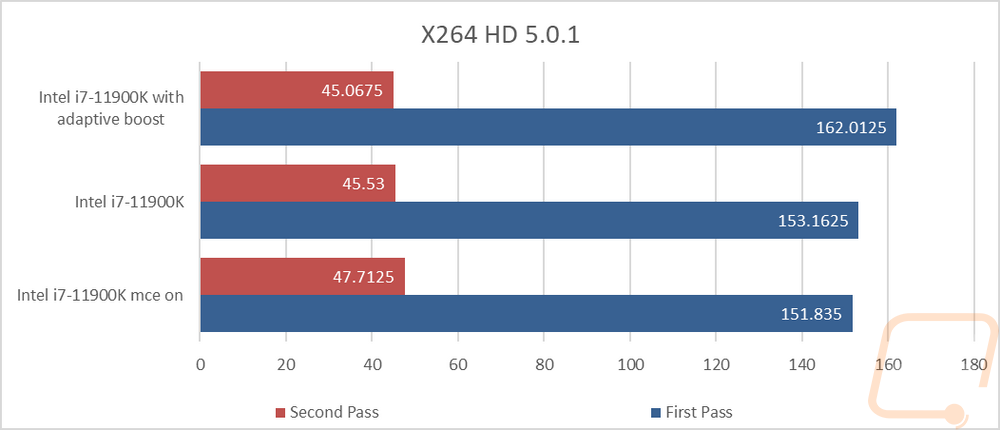
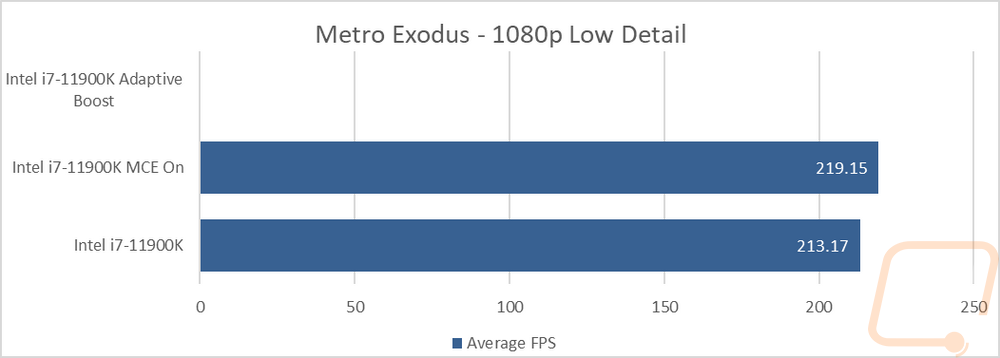
Okay just to get a better look at the performance differences that turning MCE on can show I did some additional testing beyond our normal test suite. I also mixed in Intel’s adaptive boost as well when running with MCE turned off. I did end up running into issues with adaptive boost causing clock watchdog blue screens which sometimes points to overclocking or memory issues. I tested again with other memory but still had the same errors. I suspect that having adaptive boost on with MCE turned on might help with having higher voltage settings on our CPU but ran out of time to get back and test that. So any of the results below with a blank result were because of a blue screen in testing.
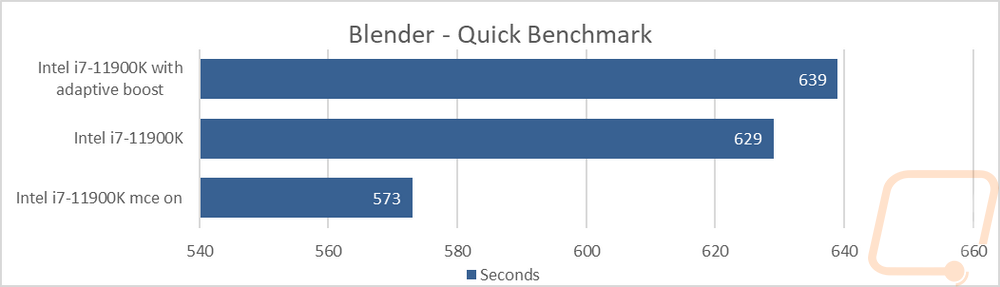
The results were all very interesting though. In the first test for example adaptive boost gave the best performance in the first pass but the lowest of the three in the second pass. MCE on that same test was the opposite. In blender, MCE made a HUGE performance difference where adaptive boost ended up hurting performance. The adaptive boost blue screens were interesting with Cinebench because the issue wasn’t a problem at all in R15 or R20 but was an instant issue when testing in R23.
Onboard VGA Performance
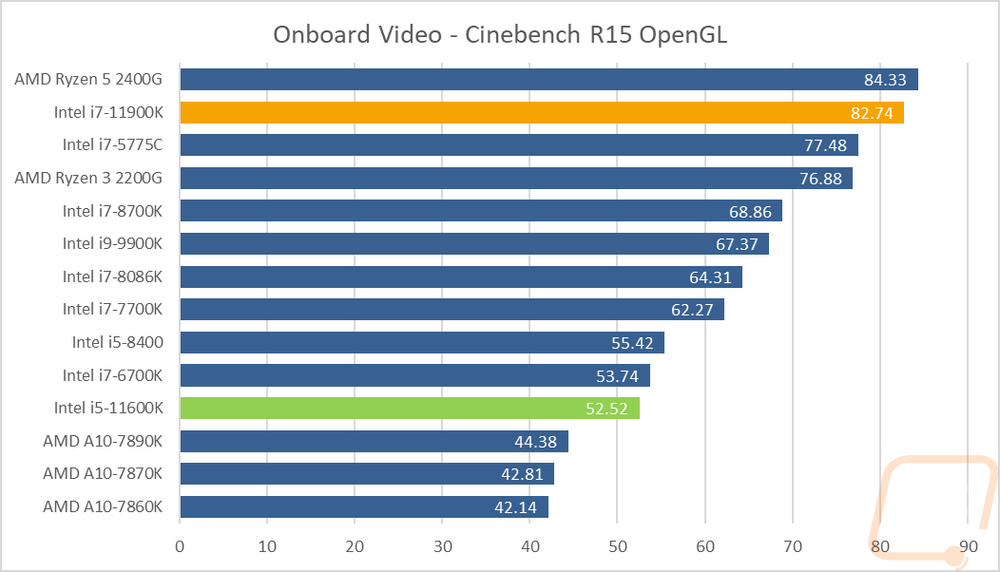
Well, it's been a while with Intel sticking with basically the same integrated graphics with their CPUs so seeing the 11th Gen CPUs get a GPU upgrade was a little bit of a surprise. Intel has been working towards dedicated graphics, but I didn’t think we would see any changes on the integrated front unless the manufacturing process shrunk or if Intel increased the CPU size. Neither of those happened but they now have Iris Xe UHD 750 Graphics. The Xe 750 integrated GPU was used on the notebook side so it isn’t completely new but let's take a look at the performance.
My first test was using the older Cinebench R15 which has an OpenGL test. These results are the FPS at which the video is rendered and I was most curious how the new graphics would compare to even the older 2400G from AMD which has been better than Intel’s older 630 graphics for a long time now. The 11900K did well here but did still come in behind the dated 2400G. The 11600K however really fell behind here and I saw this same result multiple times.
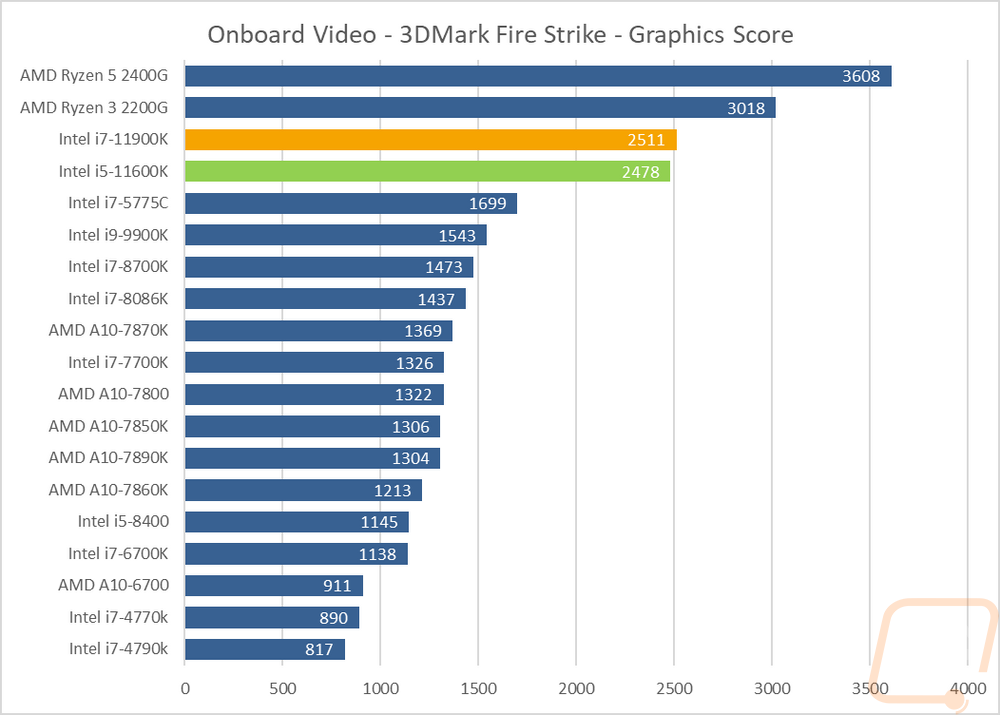
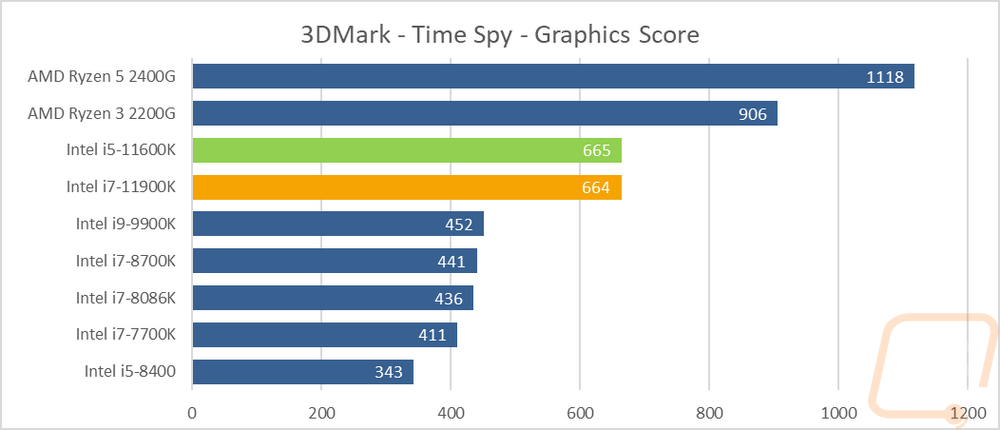
Next, I defaulted to the always consistent 3DMark with both the older Fire Strike benchmark and the newer Time Spy which is DX12. Both I only used the graphics score, not the total score to take the CPU performance out of the equation as much as possible. In both, you can see a clean line between the older Intel CPUs and the two 11th Gen CPUs with the Xe 750 graphics but both of the older Ryzen CPUs were still out ahead which have Vega 11 graphics.
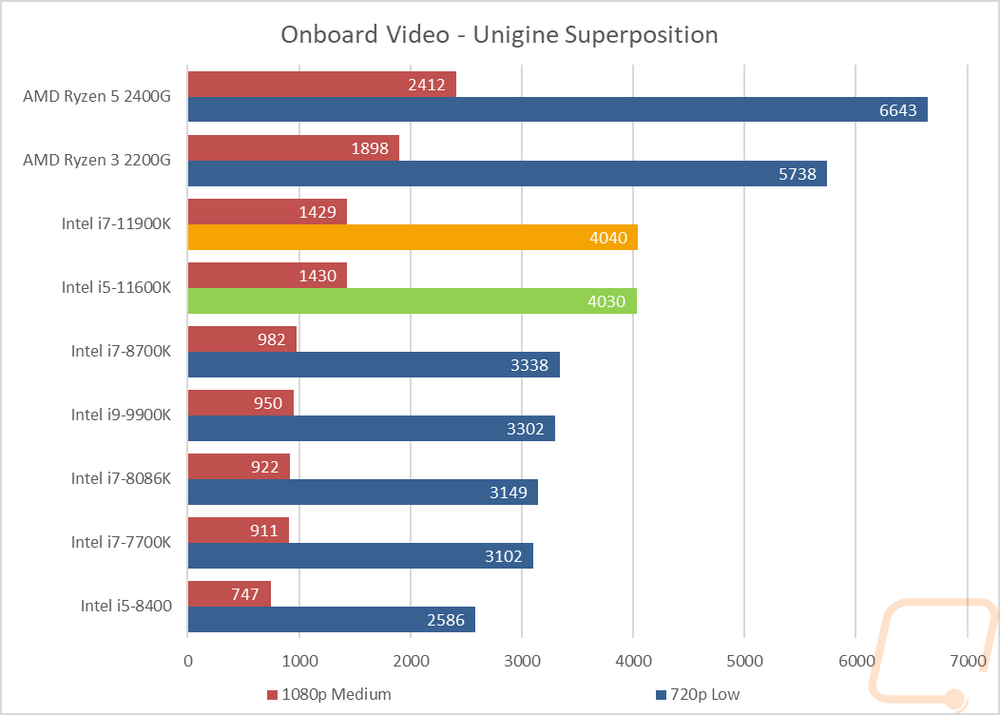
In Unigine Superposition I ran the 1080p medium detail and 720p low detail tests and the results were consistent with the 11900K and 11600K both coming in right with each other out ahead of the older Intel CPUs but behind the two AMD CPUs.
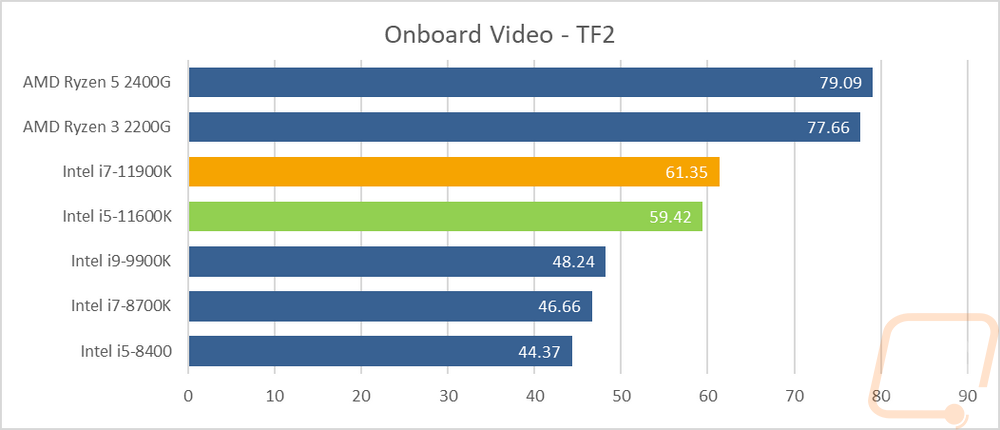
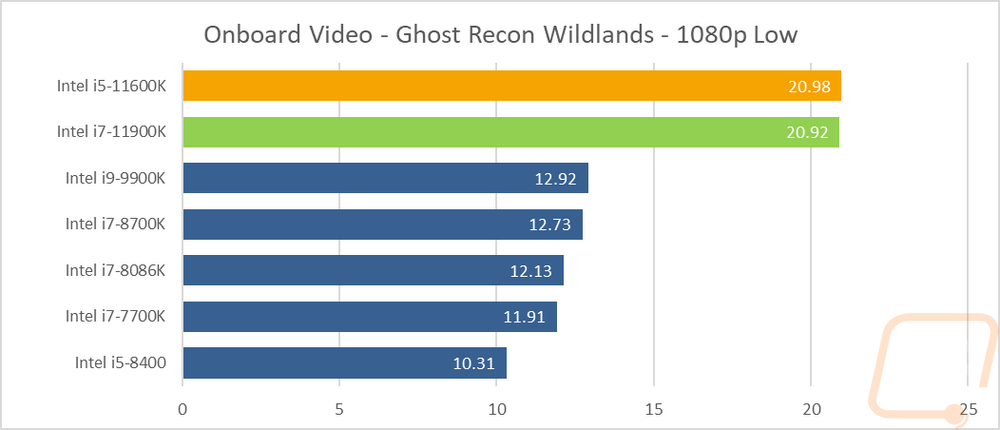
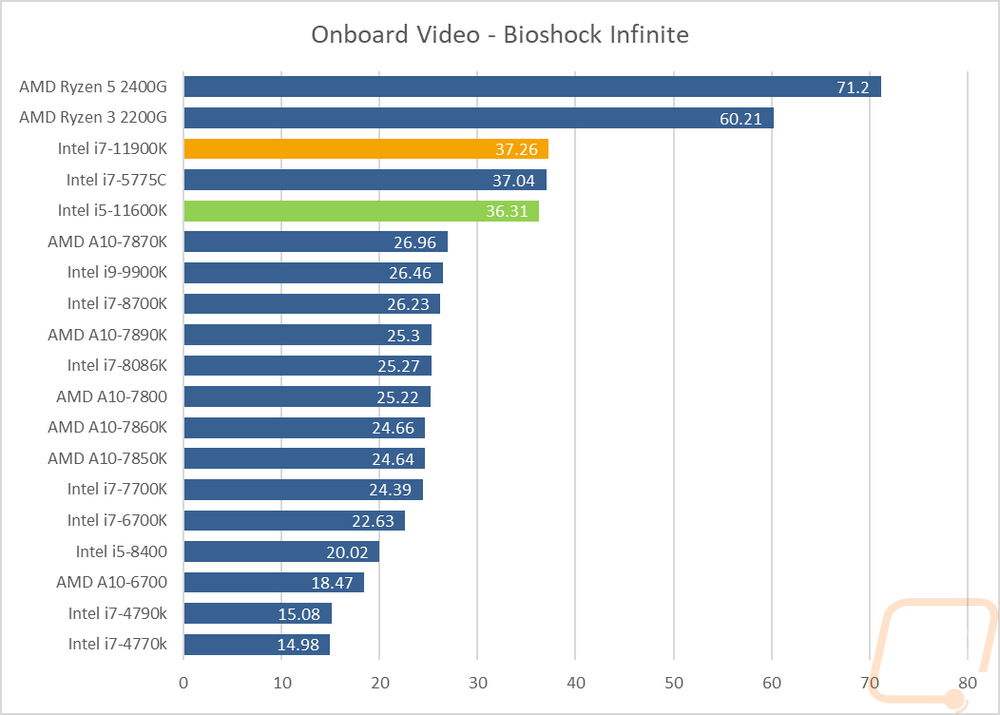
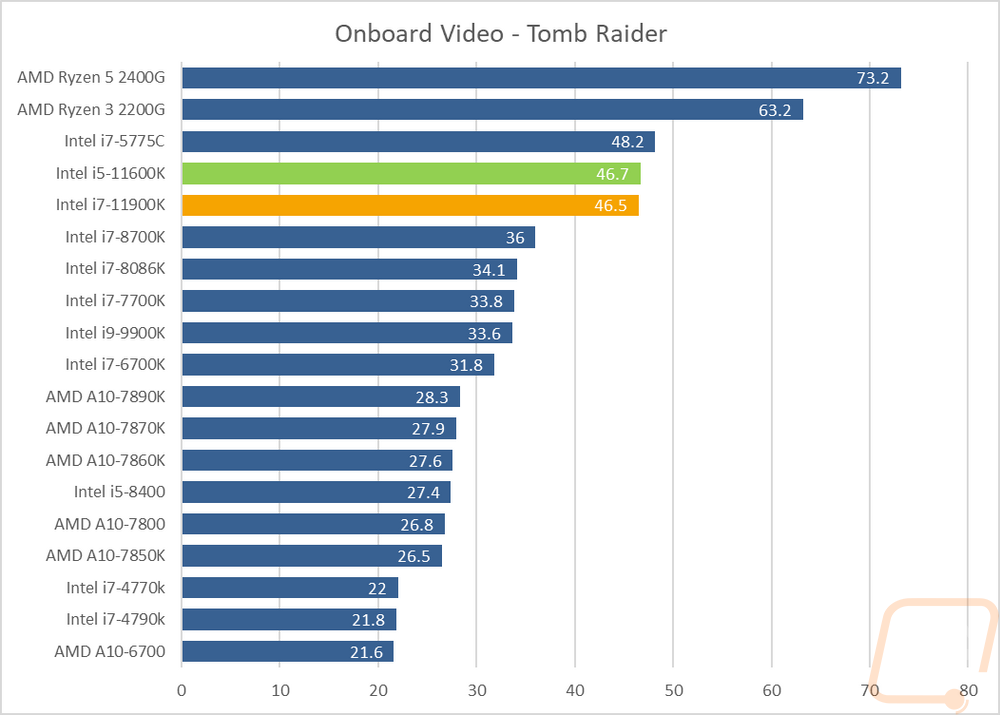
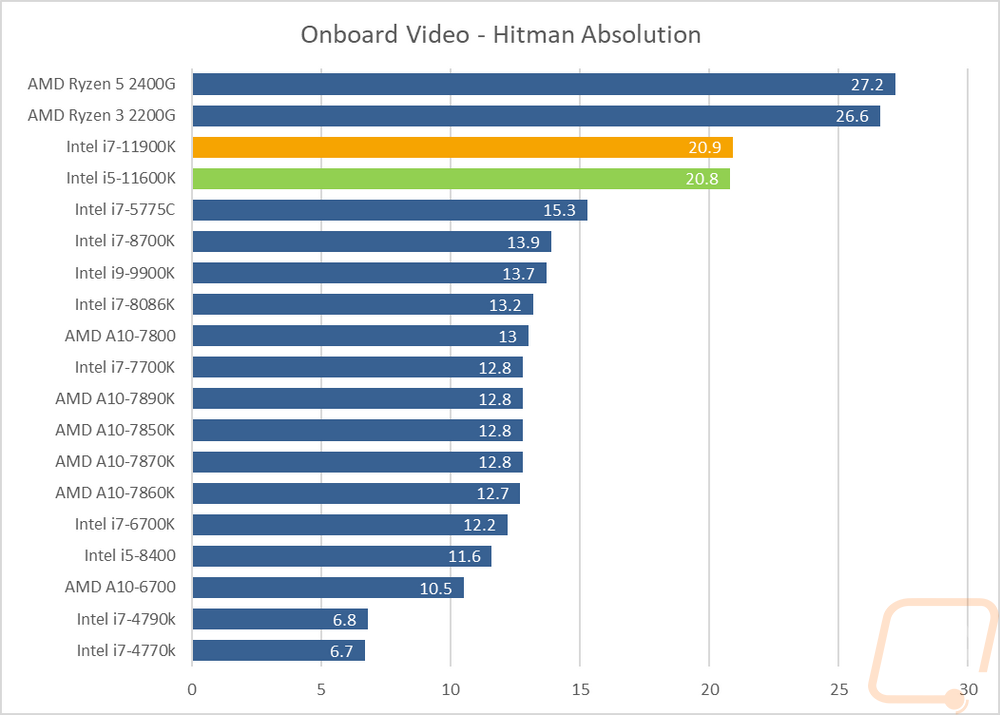
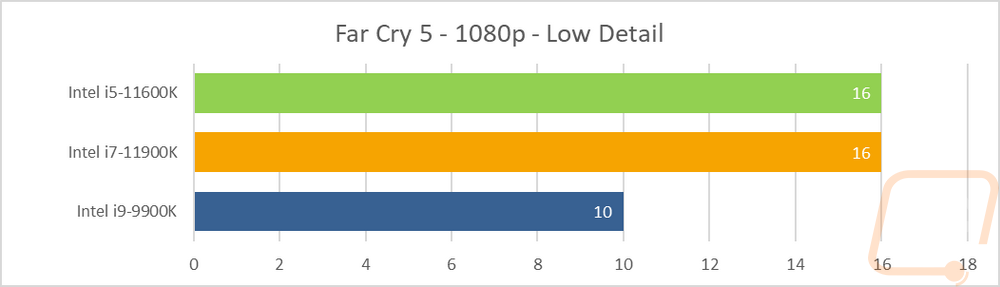
Then from there on, I jumped into game tests. Some of our tests are older games but I did also add in a few newer games as well to get an idea of newer games when tested at 1080p and low or medium settings. I was happy to see that Intel is finally in the 60+ FPS range for games like TF2 which also translates to reaching smooth playability with a lot of the “esport” titles. The higher-end games from a few years ago are playable but the newer games are rough still down in the 15 FPS range. Like in the synthetic results AMD is still out ahead here but it is good to see that Intel has made improvements over what had been used for the last 5/6 generations.
Power Usage and Temperatures
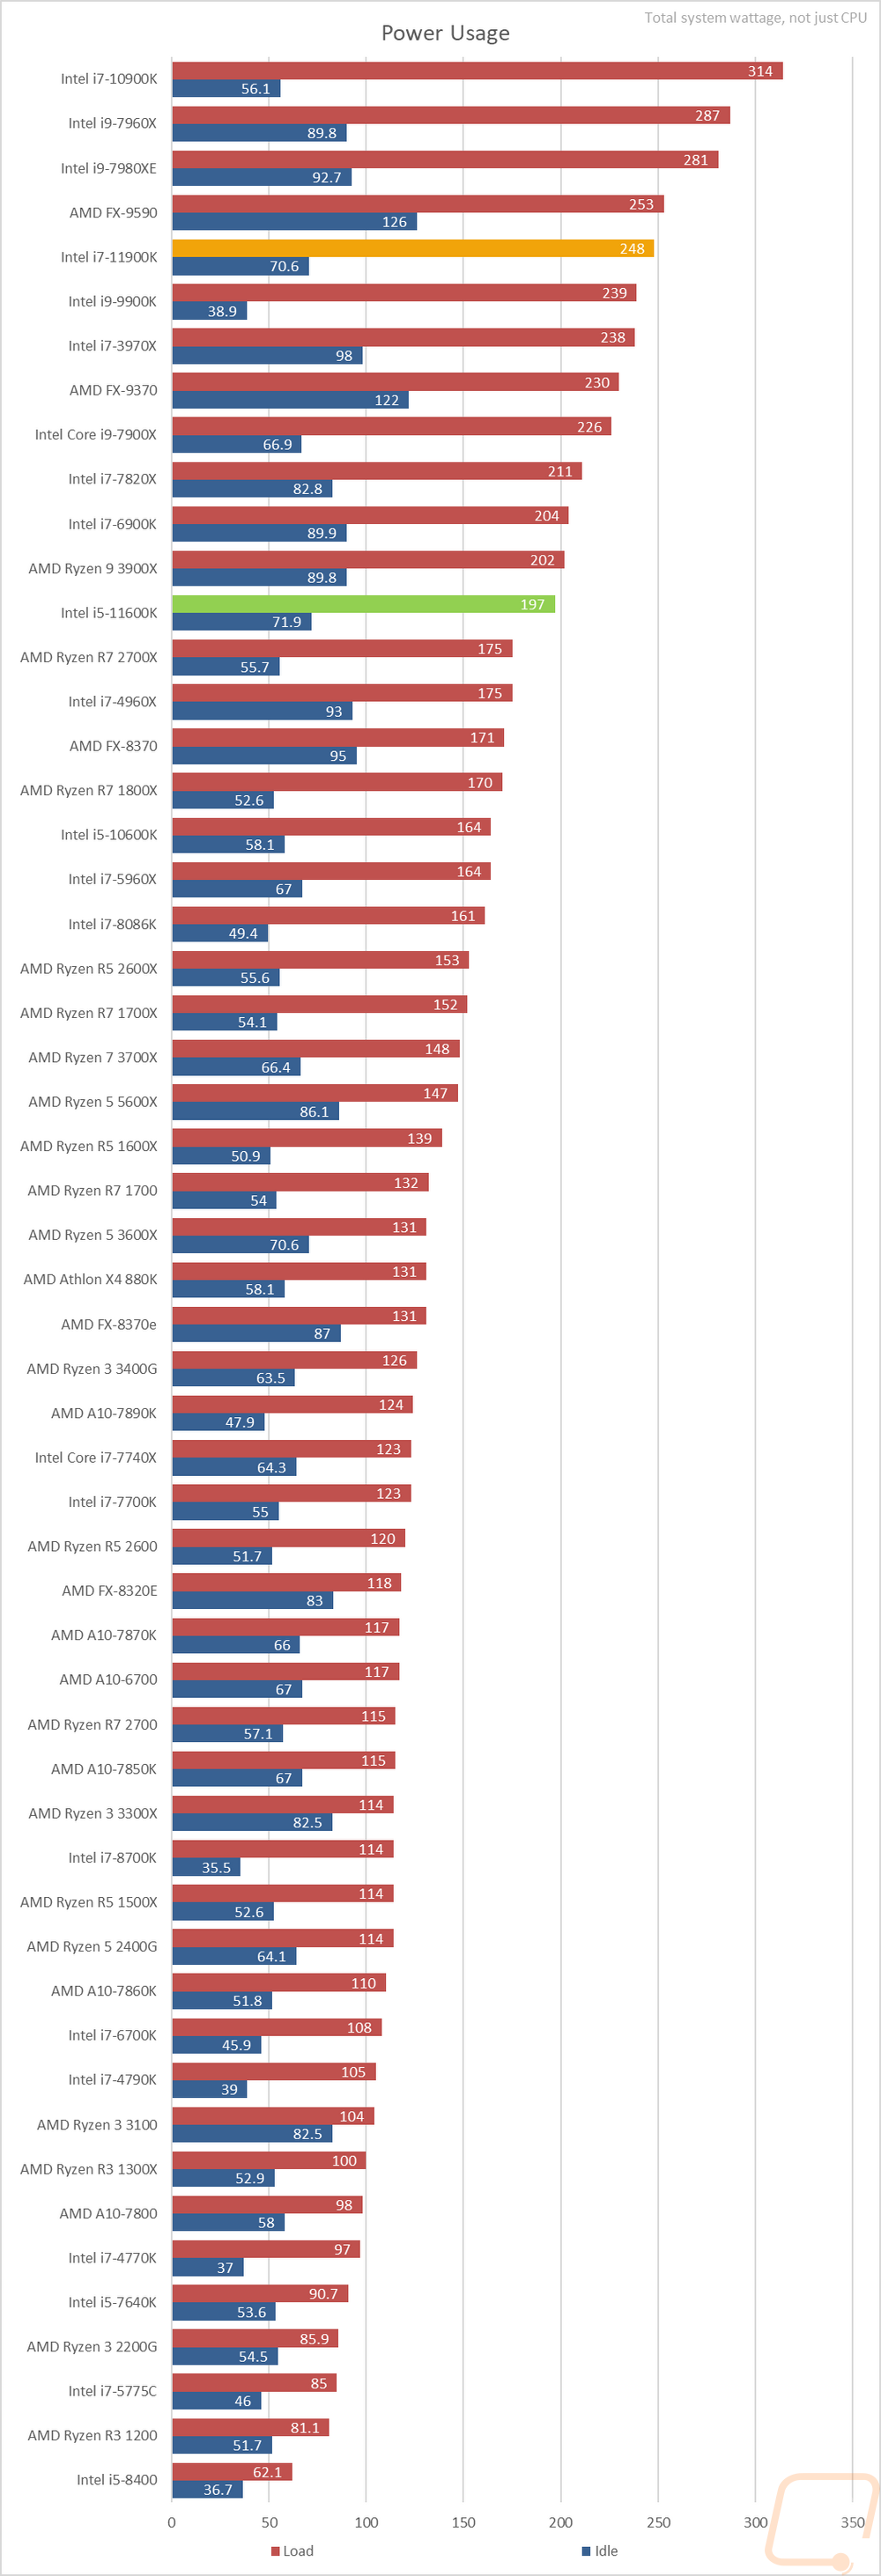
So part of everything still being on the 14nm process means that Intel isn’t able to take advantage of the power and cooling benefits that smaller build processes like 7nm that Ryzen is on currently offer. This was an issue with the 10th gen processors so we know even going in that it is a concern this time around as well. It is also why the 11900K is capped at the 8 cores. So for testing power, I took a look at the overall power our test system pulled in using a kill-a-watt. I tested idle, load using wPrime, and then load using AIDA64’s FPU stress test which is very demanding. The 11900K and 11600K both were close on their idle wattage which was at 70.9 and 71.9 watts respectively. The 11900K when under the wPrime load had our system pulling 248 watts which was high, but lower than our 10900K did. Then the 11600K was lower even though they have the same thermal wattage cap at 197 watts.
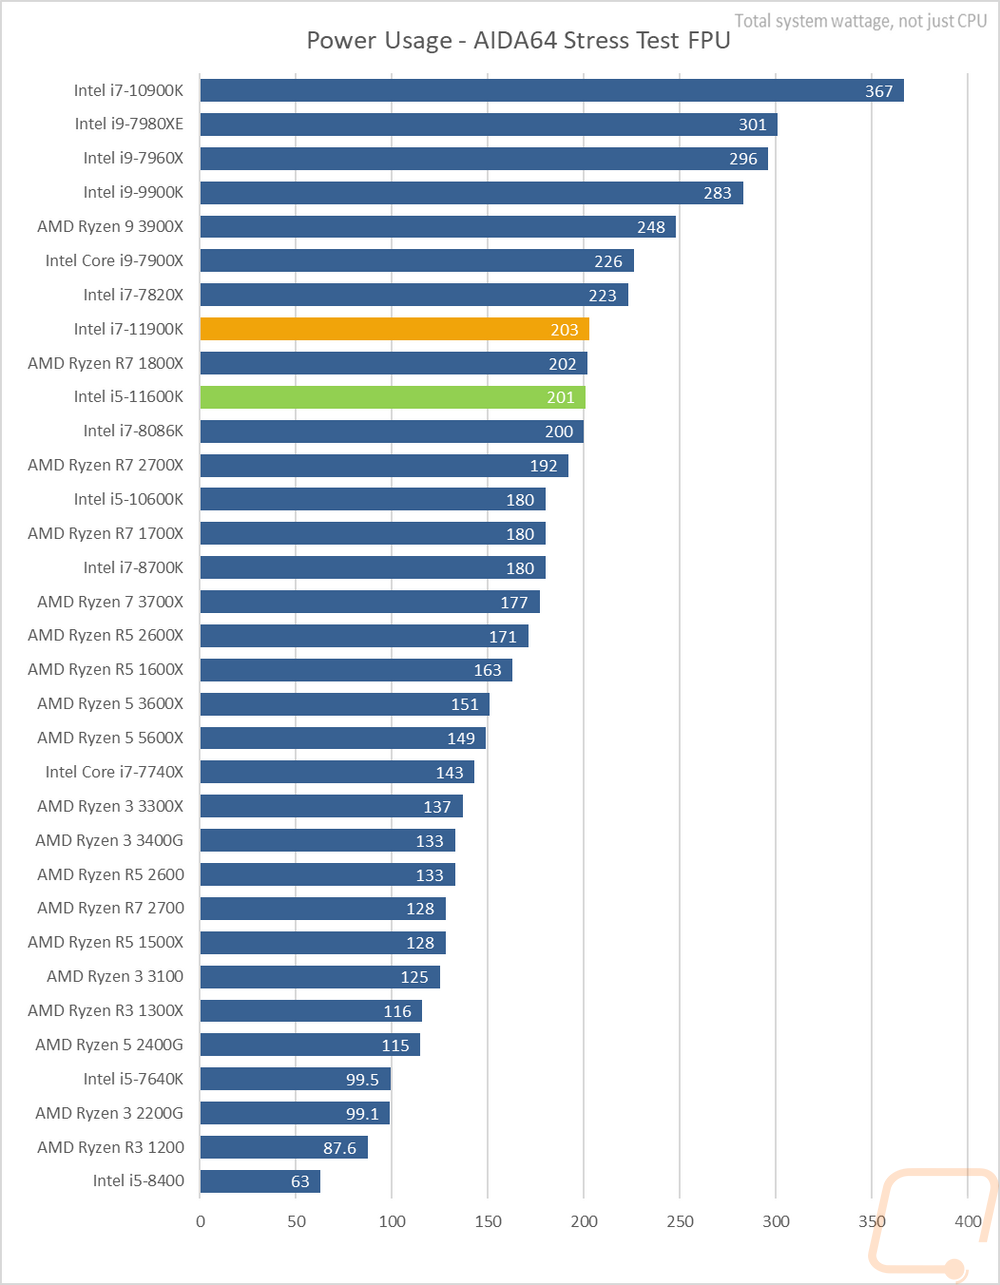
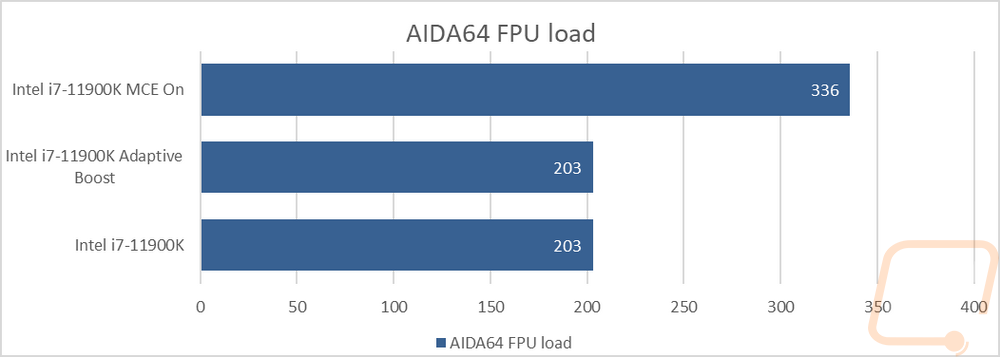
The AIDA64 FPU Stress Test is extra demanding on CPUs and here both of the 11th gen CPUs came in at about the same wattage at 203 and 201 watts. Keep in mind this and the results above were both with MCE turned off, I did test MCE on which I will go over in a second.
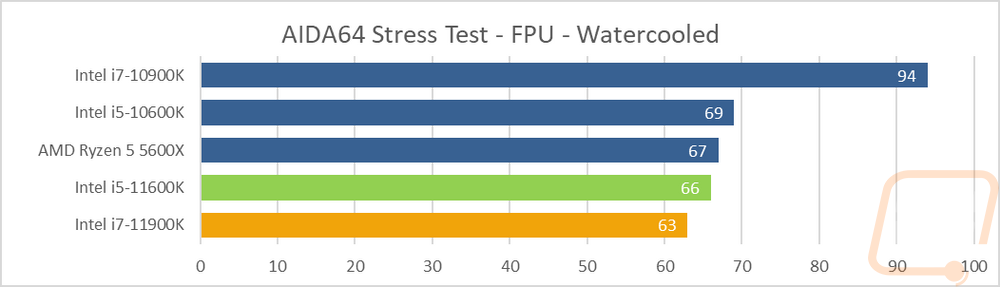
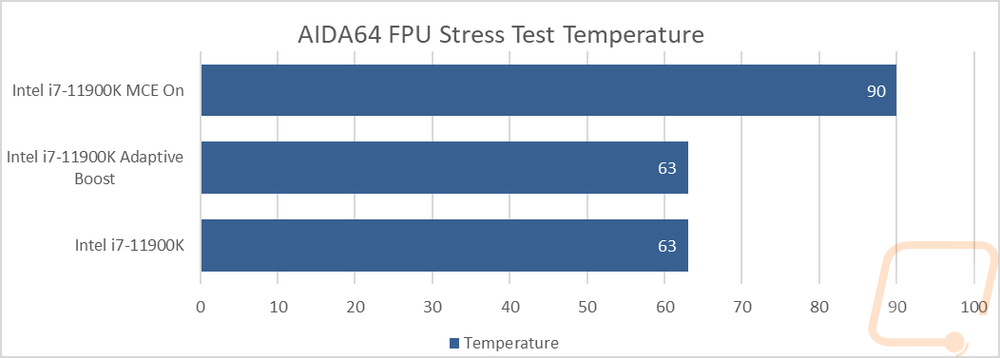
While doing the AIDA64 FPU Stress Test I also took a look at thermals. Unlike in the past where I would test using a standard tower air cooler. I have moved over to the H100i dual 120mm fan AIO due to the heat being put out by these new CPUs being just too much for what used to be an “average” air cooler. Here I was surprised to see the 11900K run a little cooler than the 11600K, but both were still pushing the limits of where I would want my water cooled PC to be running and this was with MCE turned on keeping things very tight.
Turning MCE on really changed things when I started looking at the numbers. Like for wattage pulled. The 11900K went from 203 watts which it also pulled when I did the same AIDA64 workload with adaptive boost. This was after the initial surge of wattage that the CPUs use with the single/dual-core turbo boost which pushed the wattage pulled up to 260 for the first 30 seconds. After that things leveled off. With MCE on however that leveled off wattage was 336 watts.
When it comes to thermals, you can see how much of a difference MCE made a difference as well with it going from 63 up to 90c, and frankly, even that was with the CPU starting to throttle down.
Overall and Final Verdict
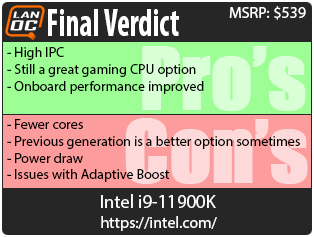
Intel’s new 11th generation of their Core series of desktop CPUs has been an interesting one. Like with the 10th gen CPUs, the issues with dropping their manufacturing process down to a smaller node has caused this generation to once again be left at 14nm. To compensate for that Intel had to make a few hard decisions, the biggest of which was deciding that the flagship CPU would be limited to an 8 core when last generation's top-end CPU was a 10 core. The decision helped them drop in an upgraded integrated GPU with the new Xe 750 iGPU. But the main thing is that it allows a little more headroom when pushing the thermal limits of the CPUs with the multitude of boosts and options that help edge out the most performance out of a CPU automatically. The i9-11900K gets the same clock speeds as last year but they were able to make IPC improvements that helped a lot in most of our single-core or single thread tests. This means that even with fewer cores compared to the i9-10900K this is still a fast gaming CPU. But I did notice that at least in our tests the 10900K was still a little faster in games. The new onboard graphics saw a big jump in performance as well which given just how hard it is to find ANY video card might become very important for some people. But AMD's APUs are still faster on that front. I don’t think Intel will be able to completely catch up there until they have more room on the die.
Even with the lower core count, due to the crazy clock speeds, the i9-11900K still pushes the limits on power draw when compared to the competition and heat as well. Although I will say as long as you have an AIO and aren’t running with MCE turned on it isn’t too bad. But with MCE things get really wild. Our 11900K also had issues when running Adaptive Boost which I don’t know if they are specific to our sample or related to the limitations of doing most of our tests with MCE turned off. Overall the 11900K is a solid performing CPU, but it makes the decision between it and the 10900K a tough one given that 10900K is still faster in a lot of situations due to its higher core count and similar clock speeds.
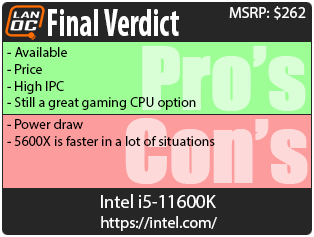
The i5-11600K that I also tested ends up looking a lot more promising in a lot of ways due to it not having the compromises that the 11900K has. The 11600K is a clear improvement over last year's i5-10600K. But it does struggle to keep up with AMD's 5600X in a lot of situations as well. It has the same great IPC performance as the i9-11900K and with that gaming performance is great as well. But the biggest thing that the 11600K has going on is that at least as of writing this you can still find it after the initial launch where getting just about anything from AMD has been impossible.
So the current market has been crazy for a while now, especially on the GPU side of things. But those same availability issues have made it into the CPU market as well causing a lot of CPUs to be hard to come by. Especially for Intel’s competition AMD which also has to share its production making chips for both the PS5 and new Xbox. The availability issues has made things interesting, especially with a lot of people looking at upgrading and building new PCs during the pandemic. So seeing the i5-11600K selling shockingly close to the Intel suggested price of $262 with it being $269 at Newegg. The i9-11900K on the other hand quickly went up to $613 from $539 and isn’t in stock as of right now. The i9-11900K getting priced up over the 5900X with its 12 cores would be controversial if not for the current availability issues. But right now the DIY PC market is a bit like the wild west. Performance is crazy, but finding or affording what you find is tough. Hopefully, things calm down and we
Live Pricing: HERE
Live Pricing: HERE


