CPU Performance
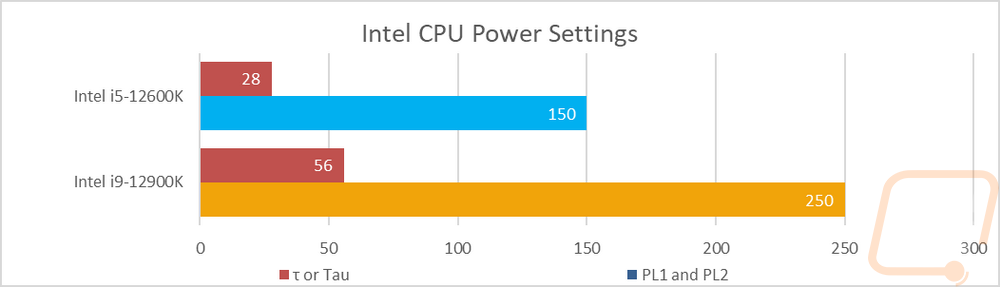
Before jumping into testing, I want to talk a little about our test setup. Specifically, the wattage settings for the i9-12900K and the i5-12600K because like MCE in the past CPU wattage limits make a difference in the overall performance, especially later when we get into thermal and power usage figures. For our testing, I went with Intel’s testing guidelines which recommend that the PL1 and PL2 settings which are short and long-term CPU wattage settings if you are using an MSI board are set to 250 for the 12900K and 150 for the 12600K. They also suggested a Tau of 56 for the 12900K and 28 for the 12600K. I did some initial testing using two different motherboards, one from MSI and another from Asus, and both boards by default had their power limits set to basically infinite (4000+ watts) and the Tau was at default of 56 on both. Not all boards will do this, by MSI did say that all of their gaming boards are set up to do that. Basically what this does is it largely ignores the power limits and lets the thermal limit be the limiting factor. This was okay in some tests and in others (especially thermal and power testing) things really ramped up and had the CPU running at 100c and thermal throttling back 10-15%. Just to give an idea of this, the 12900K when left unchecked with a normal AIO cooler was using 320 watts and that was with it throttling back. With even better cooling who knows what it would have pulled. I’m old school and I think I would prefer the BIOS to default to the lower wattage and let you uncap things, but MCE in the past was set up this way as well. Also for those curious Tau is the number of seconds the CPU will run at PL1 before changing to PL2. So you can set the PL1 to a higher number to handle small spikes then take the limit down to prevent long-term damage. The settings below though should get you solid performance and most importantly I want to make sure everyone knows where we were set when testing so you can compare your numbers if you would like.
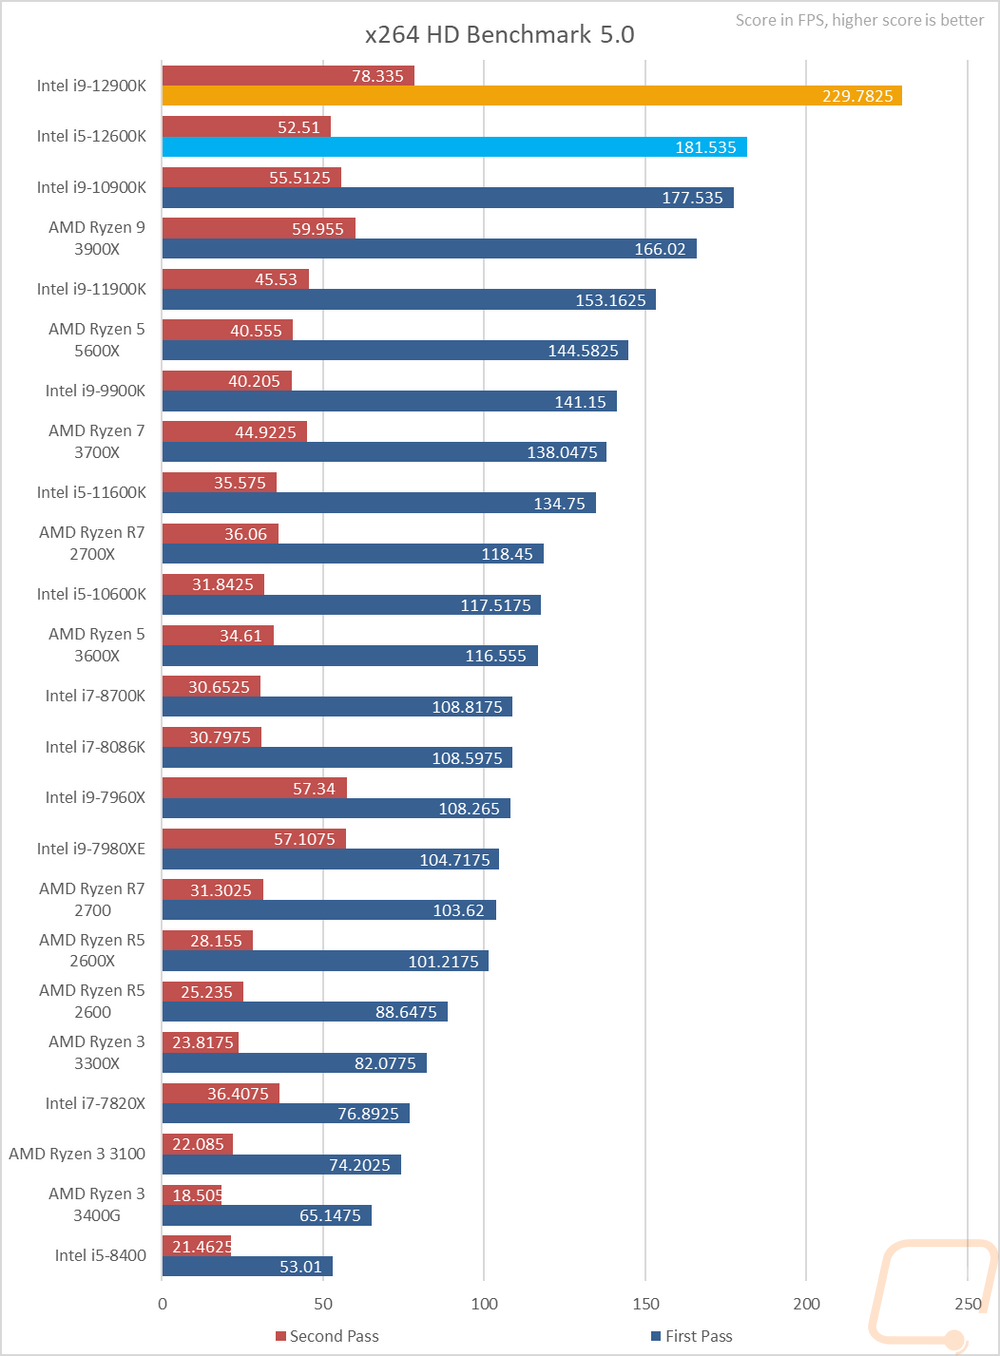
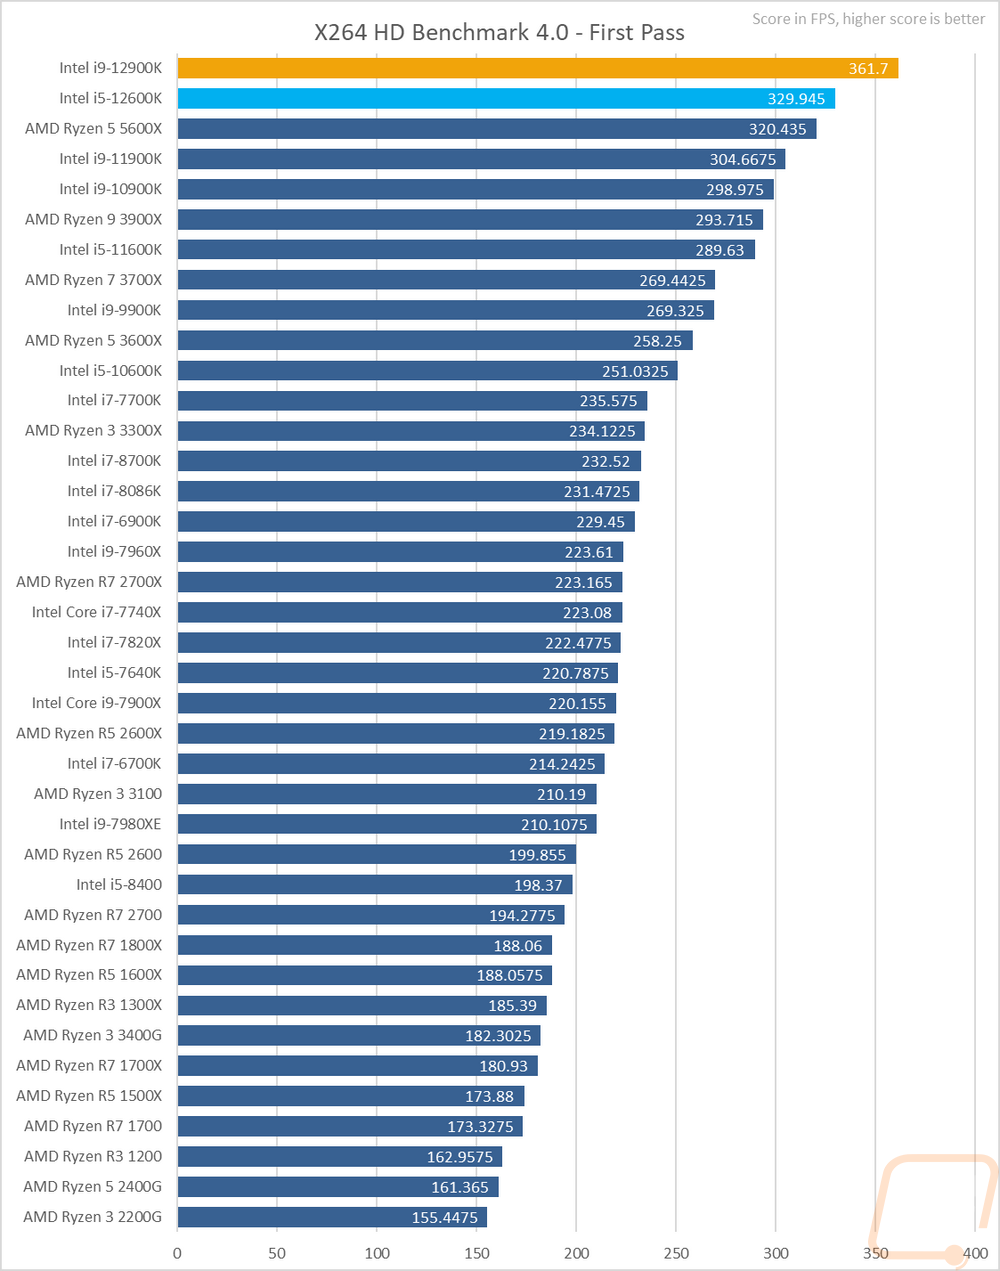
So for my first tests, I take a look at encoding performance using X264 HD with its older 4.0 and newer 5.0 versions. This is an area in which Intel has always done well but the last few generations of Ryzen have made huge steps forward. In the 5.0 test, the 12900K just completely ran away from the previous generations of Intel CPUs. The 12600K was up near the top in the first pass results as well but didn’t do as well in the shorter second pass. In the older 4.0 test, the 12900K and 12600K are both at the top of the chart once again, but this time around the 12900K is a little less ahead compared to the newer 5.0 test.
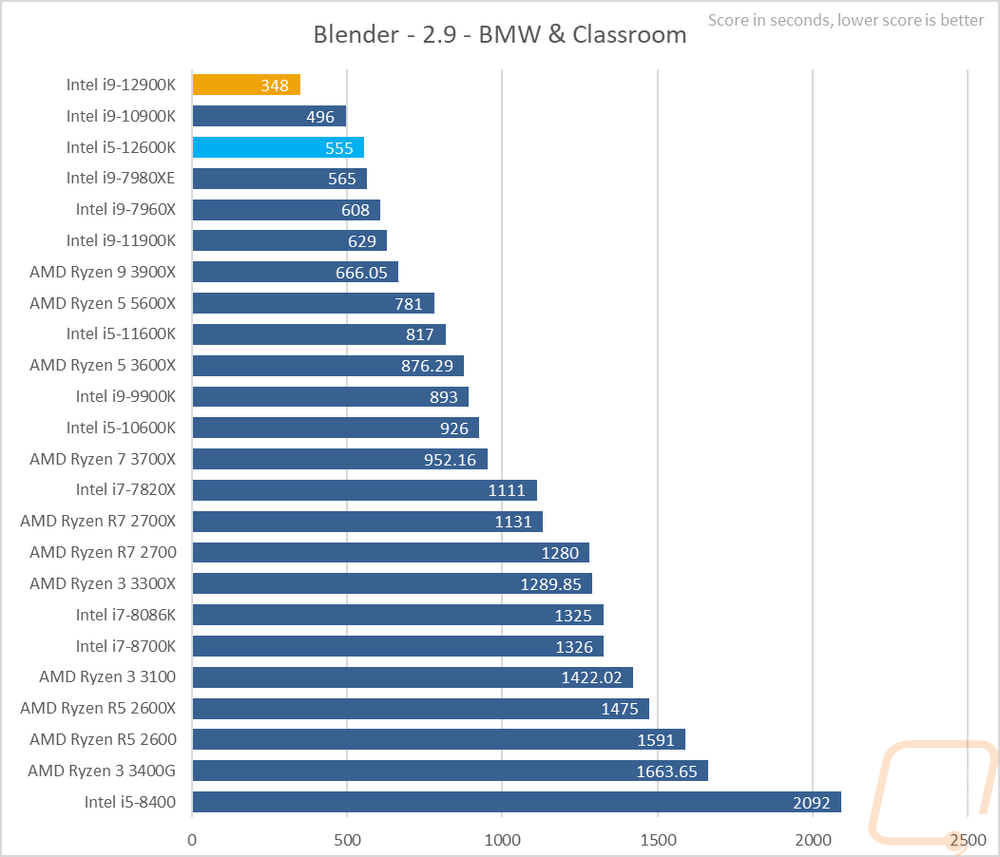
3D modeling is always popular and the open-source program blender is one of the best ways to get into it. I’ve run their standard benchmark on the quick benchmark setting. This test just times running through two files being rendered (BMW and Classroom). Lower scores are better here and once again the 12900K did well here, a LOT better than I was expecting honestly with it taking a full two and a half minutes less to run the two renders than the 10900K did but the higher thread count, even with some being e-cores helps here. The same goes for the 12600K with its 6+4 combination of p and e cores, it is still up near the top and much faster than last year's 8 core 11900K.
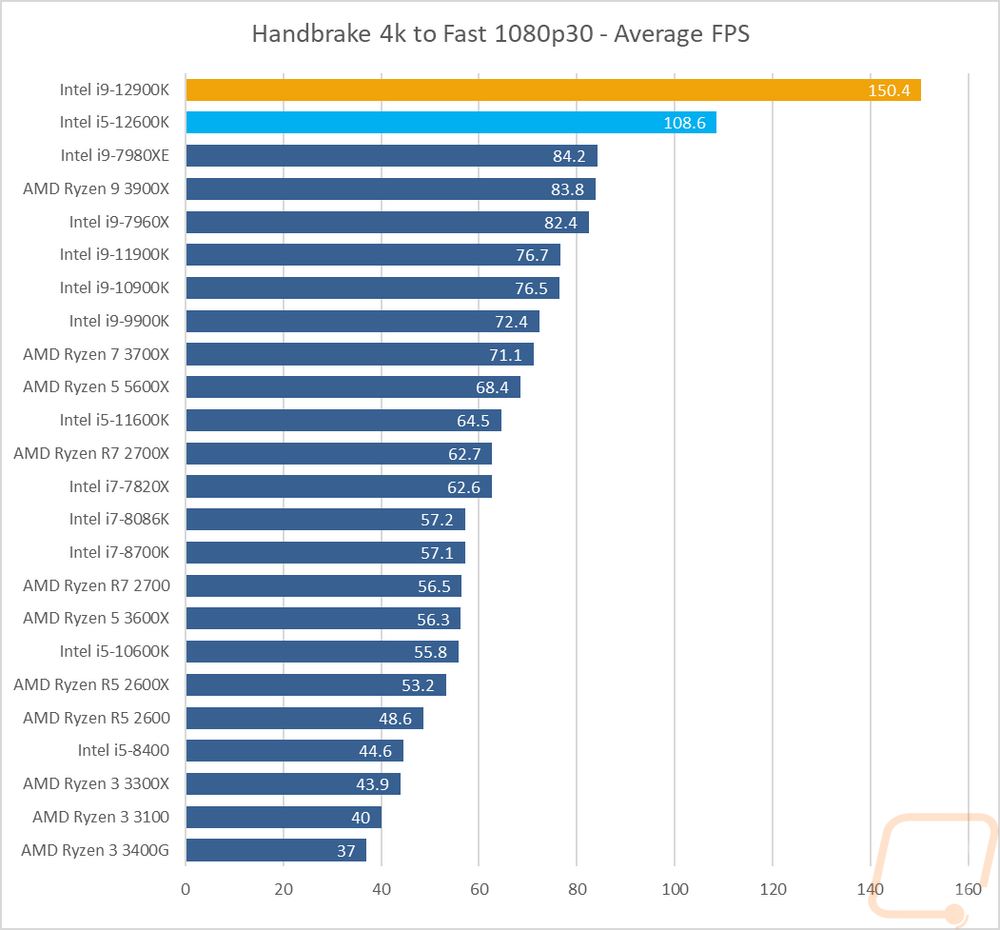
Continuing with the video encoding theme I also have handbrake which is a which is an open-source transcoder. For this test I am taking a 4k video down to 1080p 30 FPS, the results are the average FPS of that task. The higher core count CPUs in the past have dominated, even when they are older like the 18 core 7980XE, but the 12th gen CPUs did really well here with both sitting at the top with big margins.
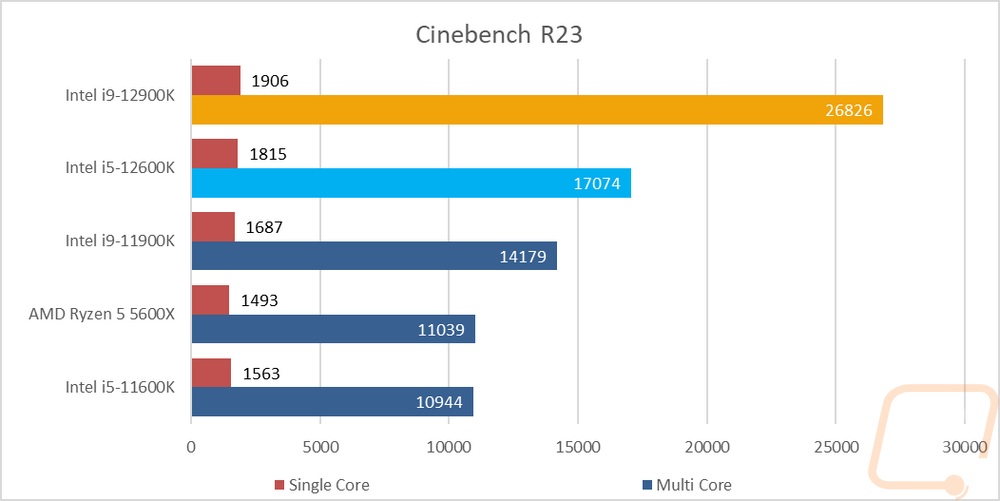
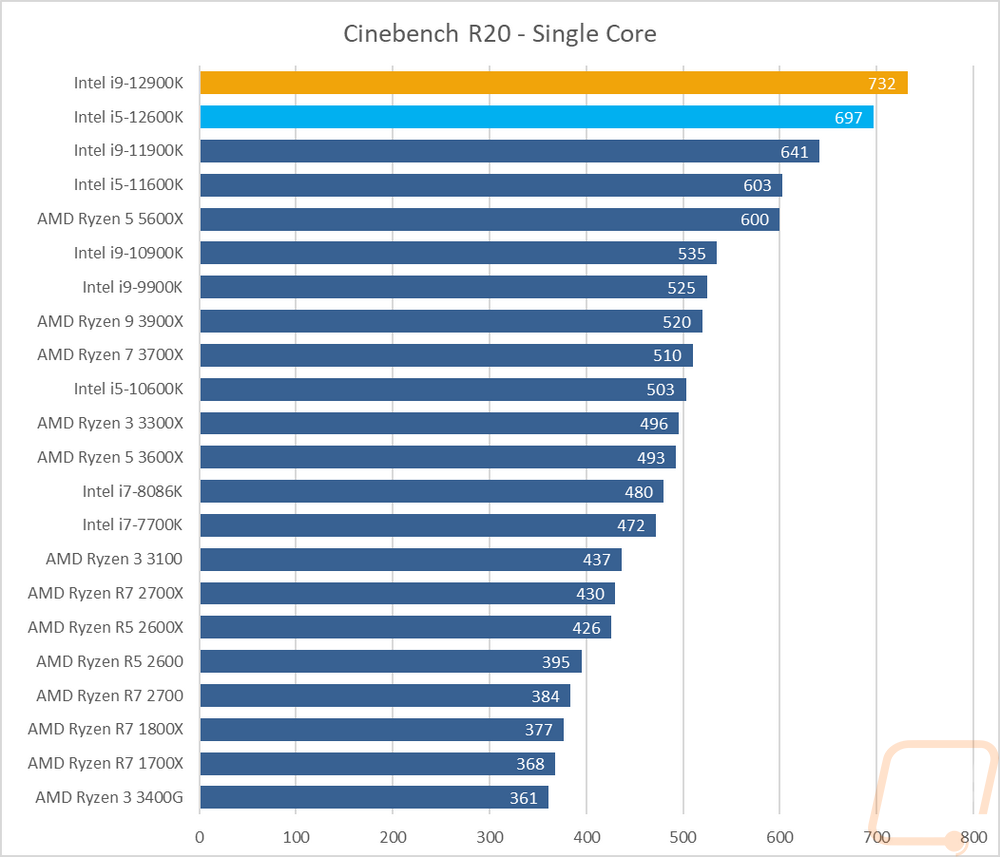
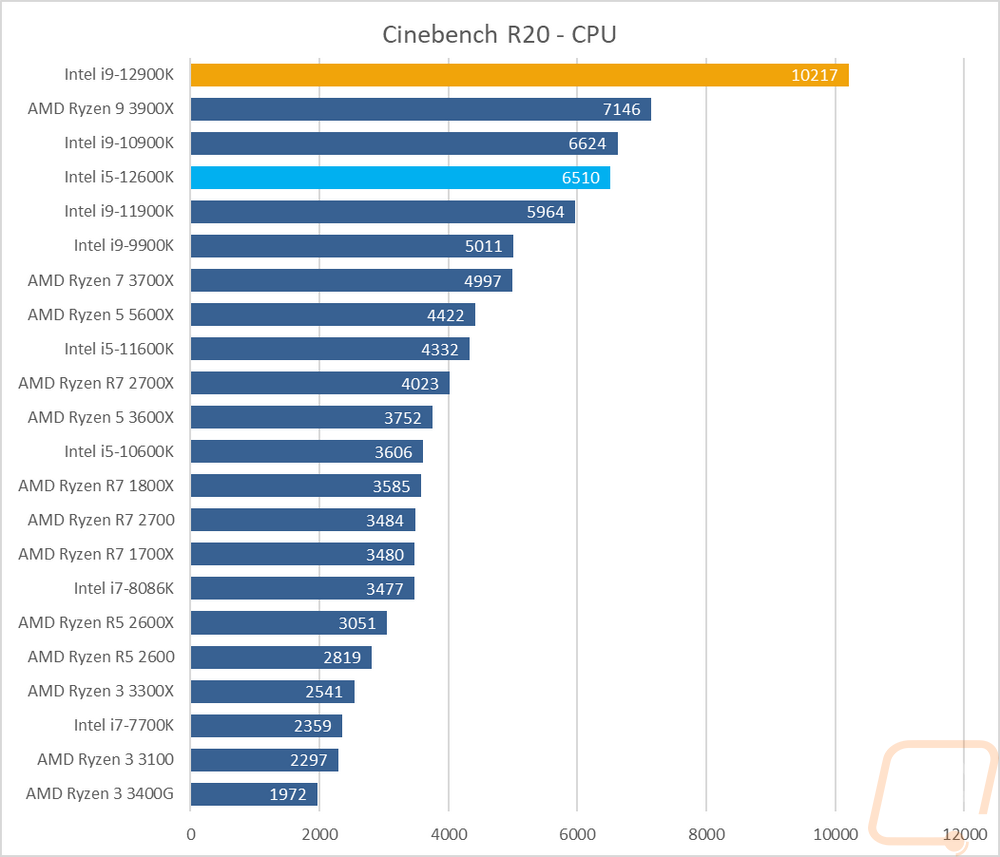
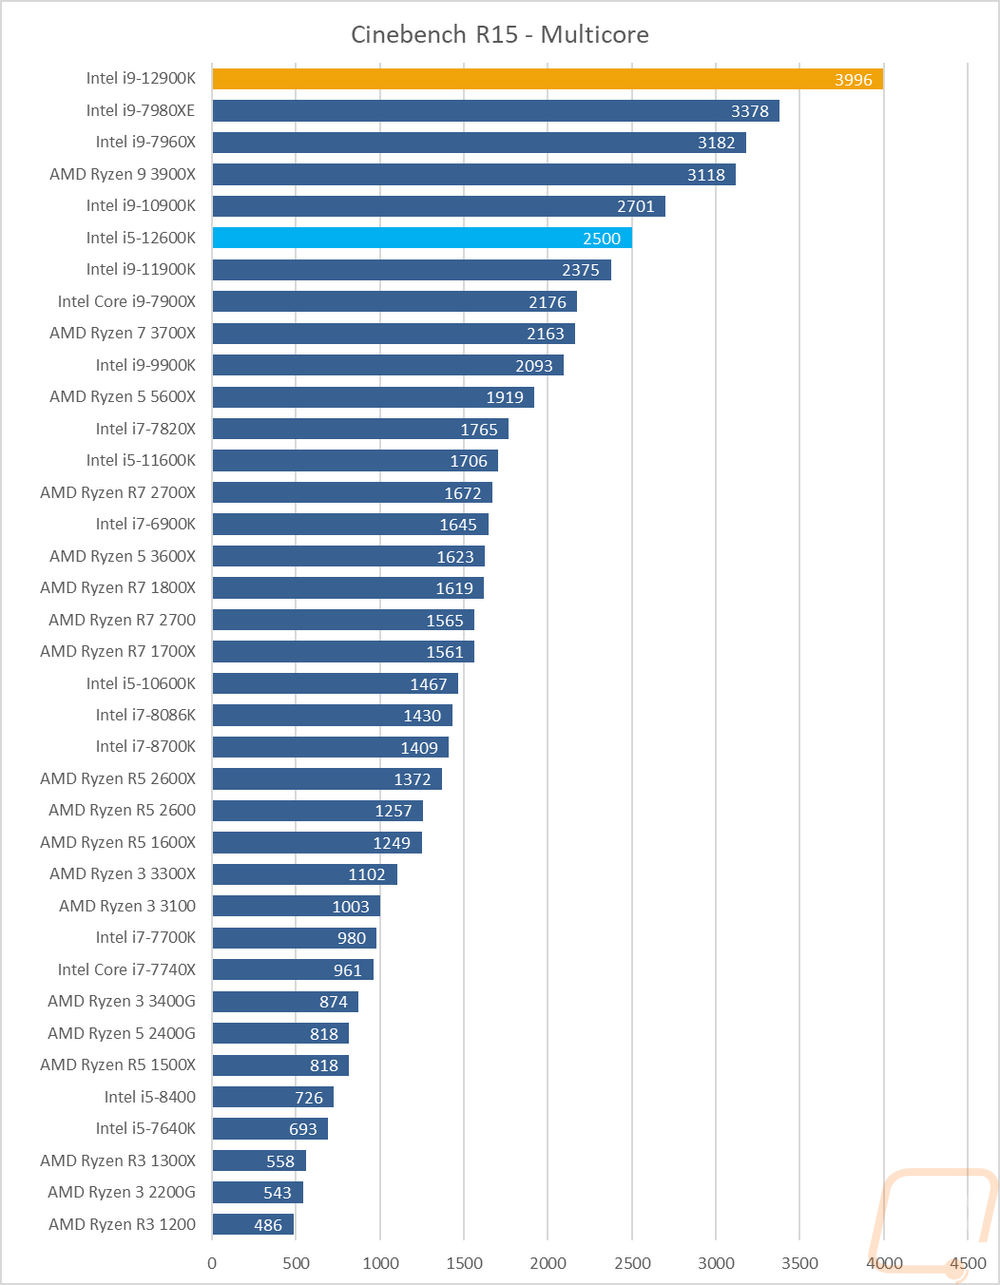
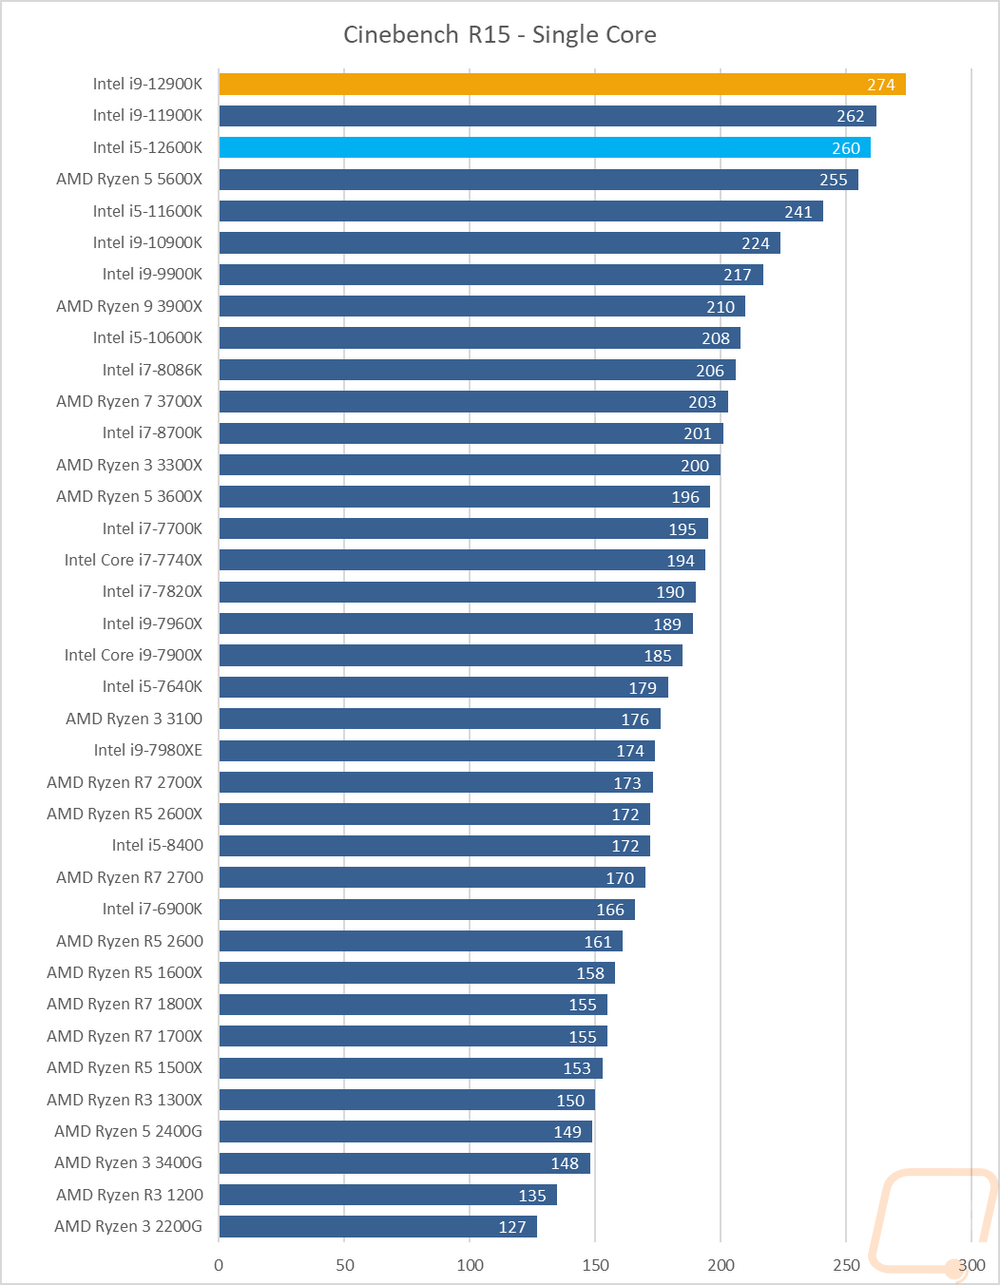
For the always popular Cinebench, I ran the older R15 test which better fits a 4 core CPU, and the new R20 for high core count CPUs as well as the latest R23 as well. In R23 there aren’t any surprises, the 12900K is a monster and even with 8 p cores and 8 e-cores, it is way out ahead of the previous 11900K. More impressive to me though were the single-core numbers where the 5.2GHz boost clocks and the new architecture have a 1906 single-core score on the 12900K and 1815 even on the 12600K. The same is repeated with R20 and R15 as well with the 12900K single-core speeds sitting at the top in each test and the 12600K being up there as well only with the 11900K edging out the 12600K slightly on the older R15 test. But in the multi-core tests the 8+8 12900K was still in its own world compared to past Intel CPUs (though to be fair I haven’t had a 5900X or 5950X to add into the mix here which would both be up in that range).
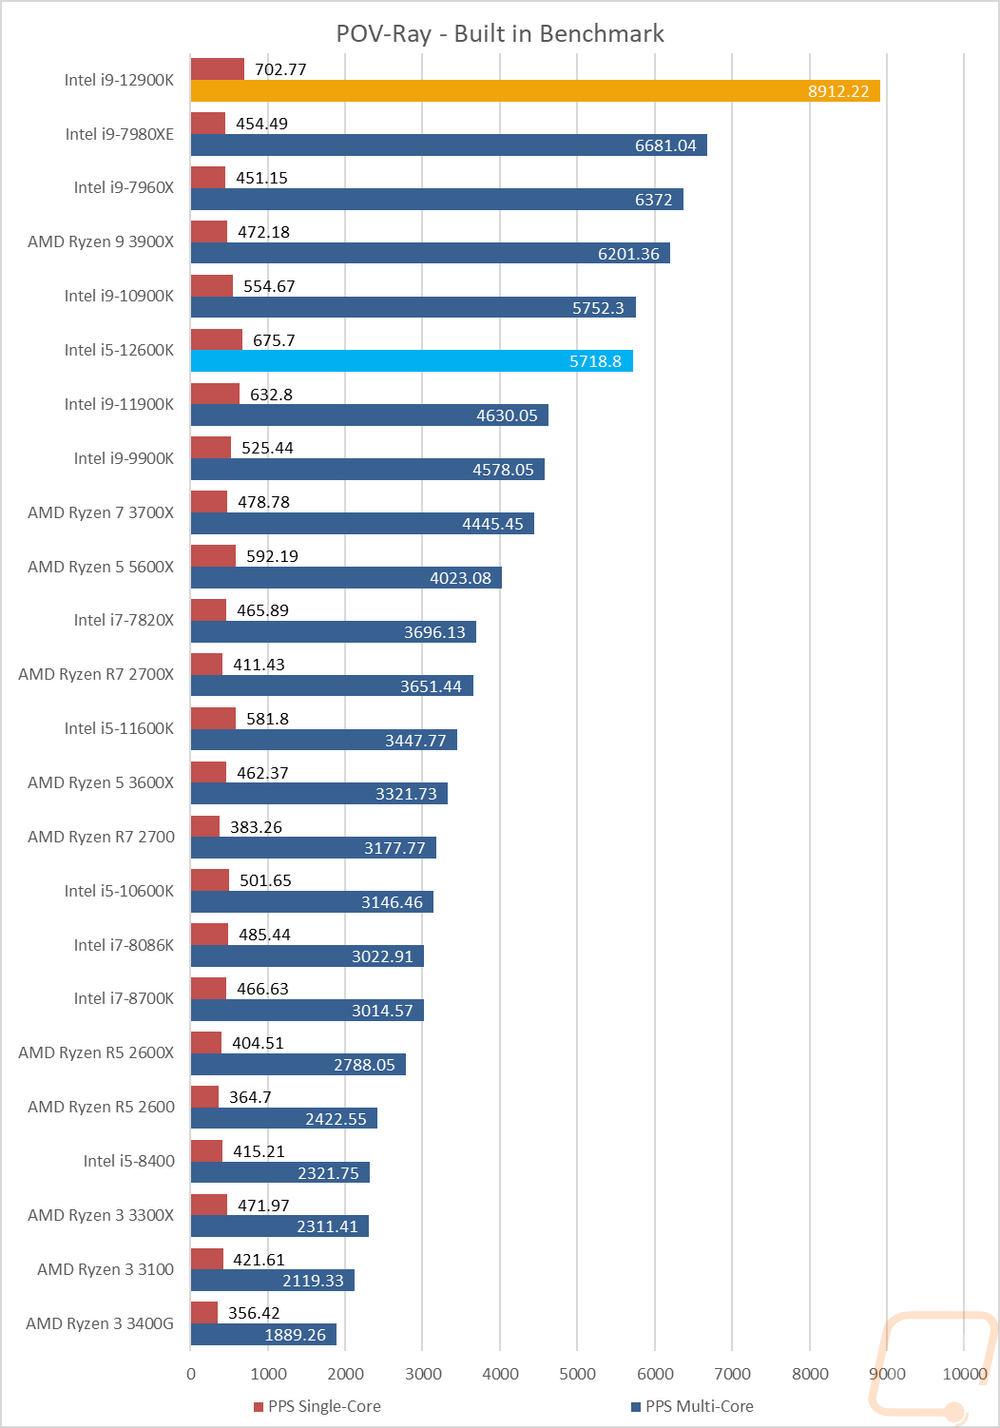
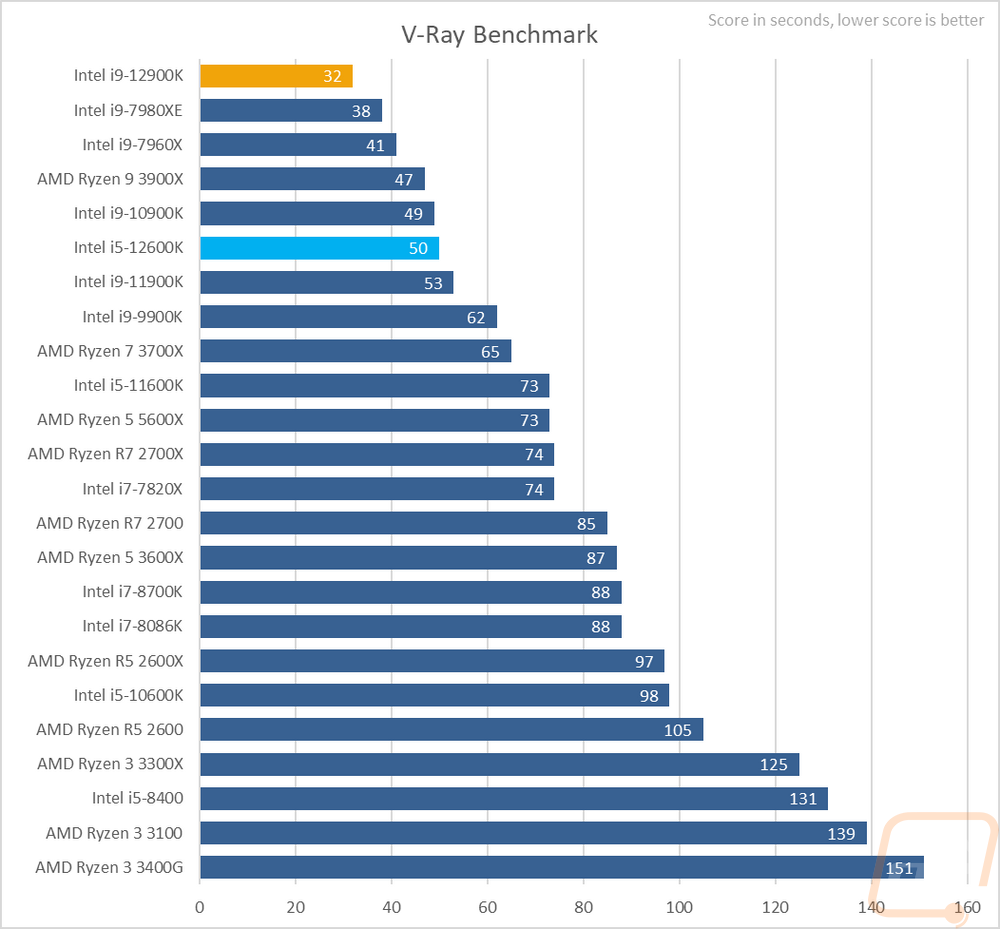
Ray tracing is picking up on the GPU side of things, but when it comes to rendering photos and sometimes videos it has been a thing for a while. I’ve run two benchmarks that check out the performance and in POV-Ray the higher core count CPUs still rule all in the multi-core test but this time with the 8 p-cores and 8 e-cores the 12900K was able to run with them and with its much higher IPC it tops the chart. You can really see the single-core performance in the single-core tests which have the 12900K 150 points ahead of the 10900K and 70 ahead of the 11900K. Even the 12600K tops the 11900K in both single and multi-core tests. In V-Ray, the results are the number of seconds the test took and the 12900K ripped through the benchmark in just 32 seconds. The 12600K on the other hand was close to last year's 11900K but faster by 3 seconds, not bad for an i5!
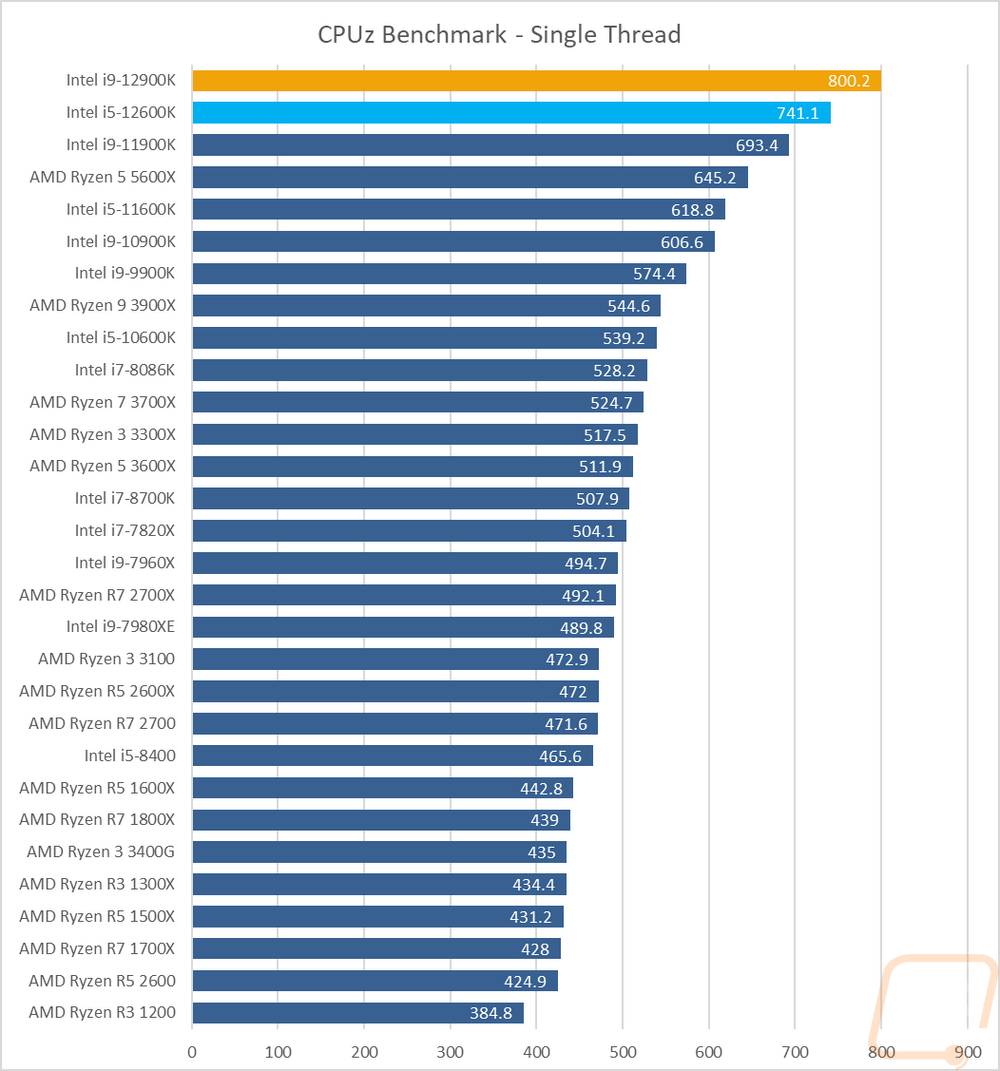
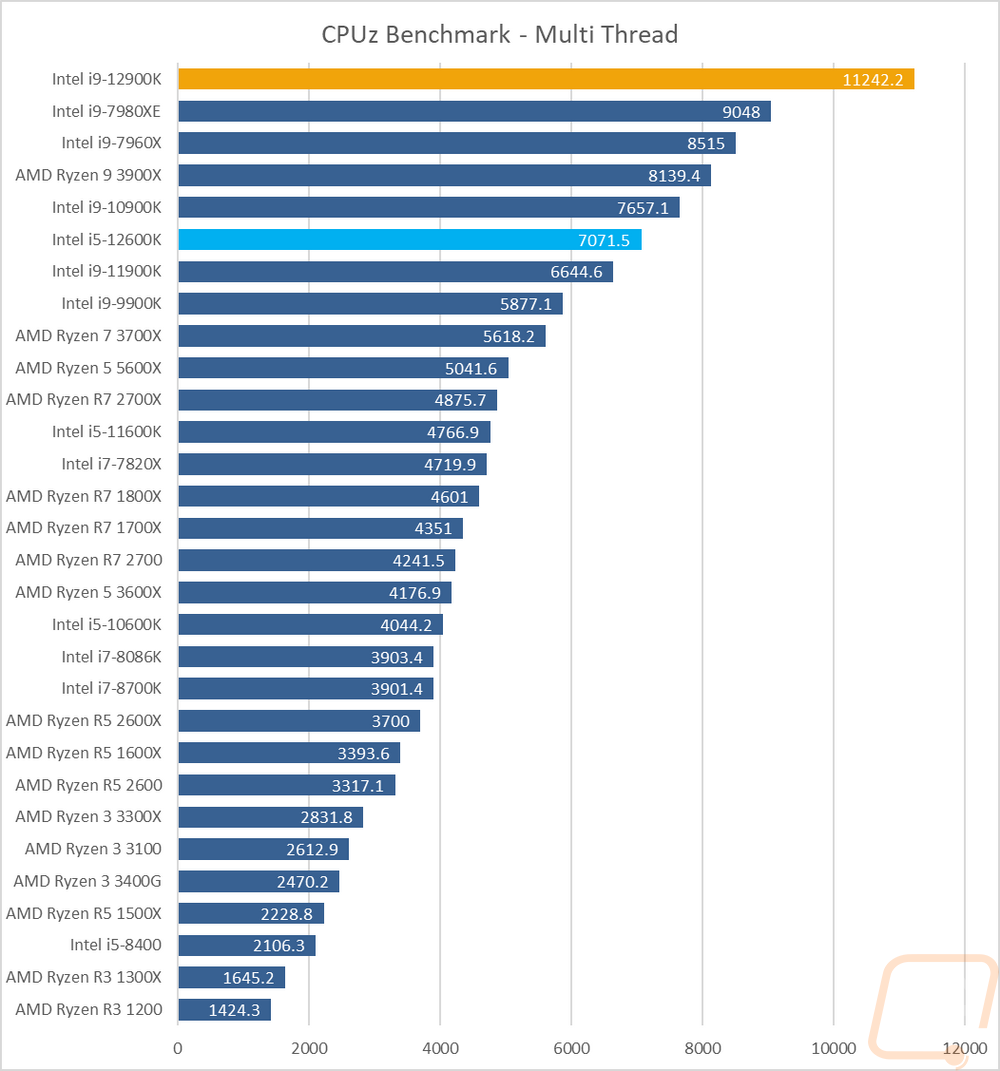
Most people use CPUz to check out a few clock speeds, your BIOS version, and other information. But they do have a benchmark slipped in as well at the back and I like it because it does split up performance between multi-core and single-core. With the single-core result, there weren’t any surprises, both 12th gen CPU was at the top and by a big margin even compared to the 11900K. Win the muti-thread test the 12900K was way out ahead but a few older high core count CPUs are sitting between the 12600K and being at the top, though it did well sitting right in between the 11900K and 10900K.
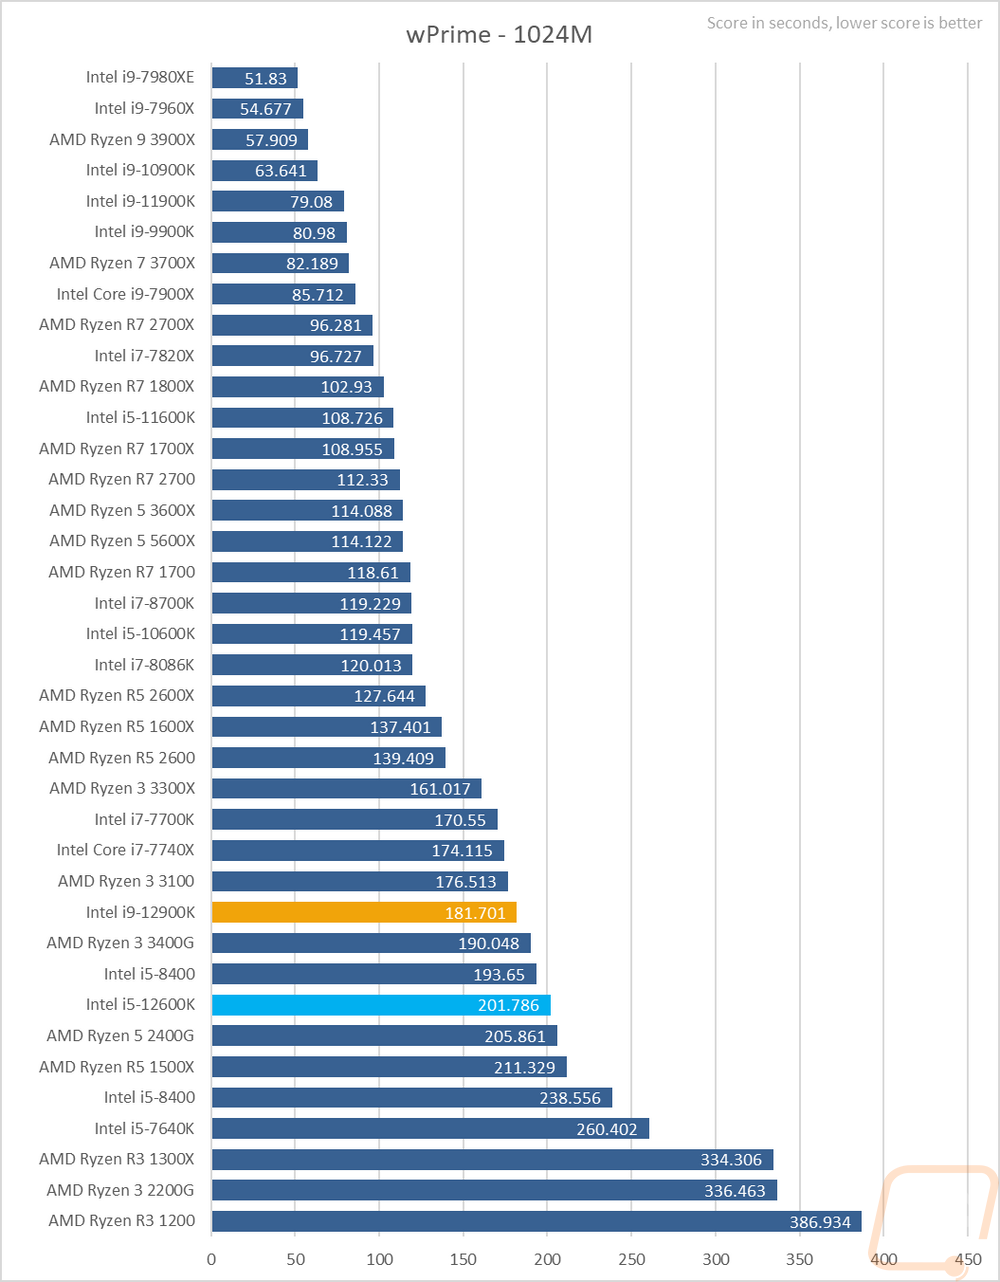
Going back to the basics I tested with wPrime which is an old overclocking favorite that takes a look at the time it takes to calculate prime out to 1024 million. Core count is still king here, but clock speed does help which is why overclockers have used this one to compare overclocks for years. Honestly, this is the first benchmark that the e-cores hurt the overall performance of both processers and I suspect that in the future this is an area where the Intel Thread Director could be updated to help with this. Both CPUs took forever to complete the tests when you would expect them to be up in the same range at the 11900K. Turning e-cores off make a big difference here. The 12900K was in the high 80-second range when I ran wPrime with them off, taking off 90+ seconds or half the time.
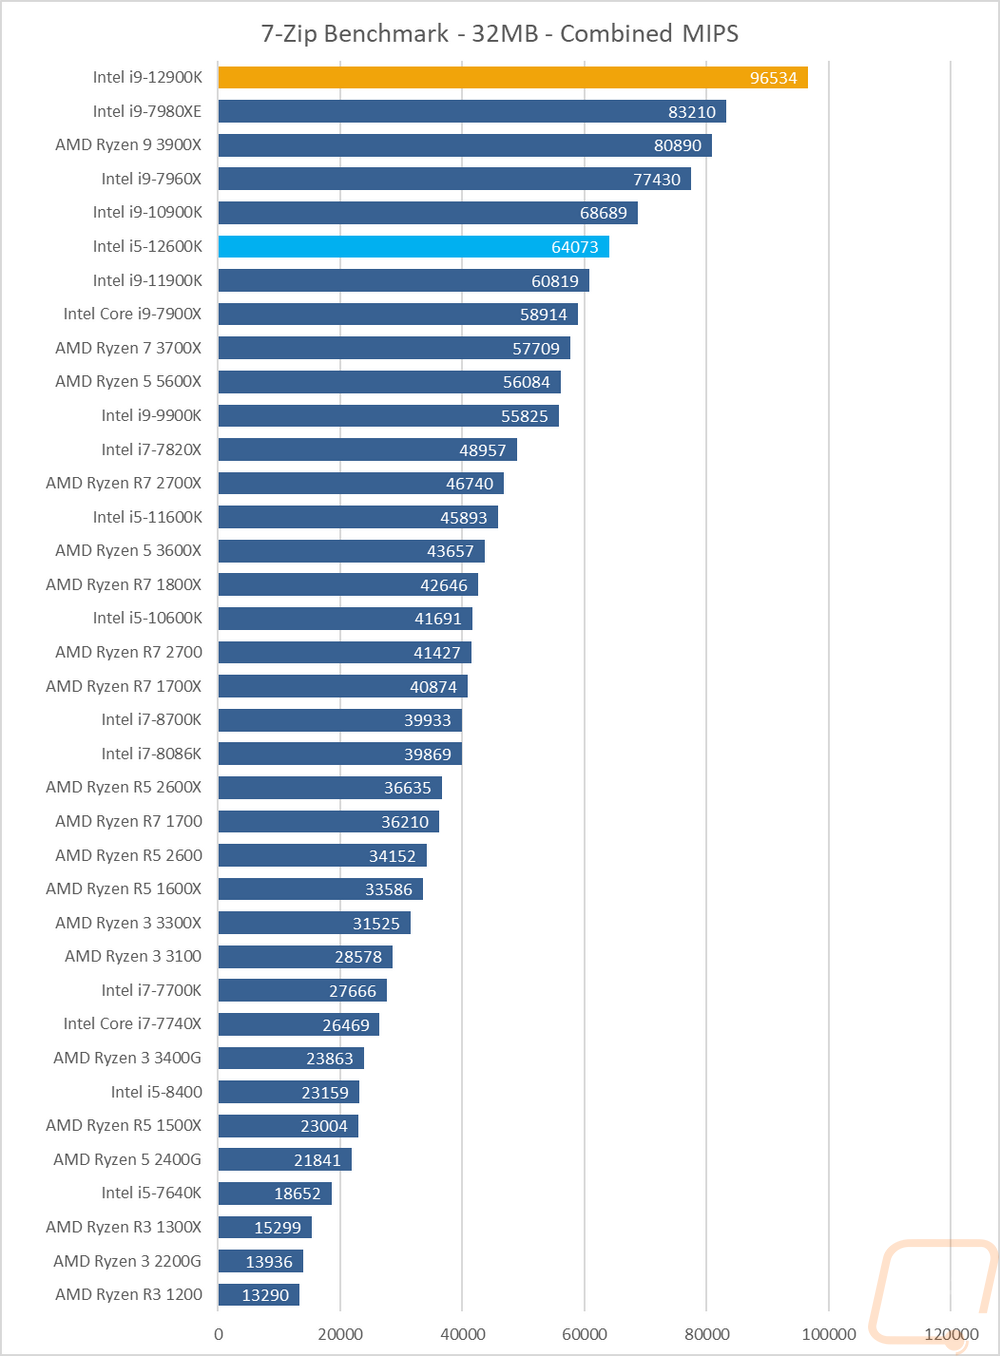
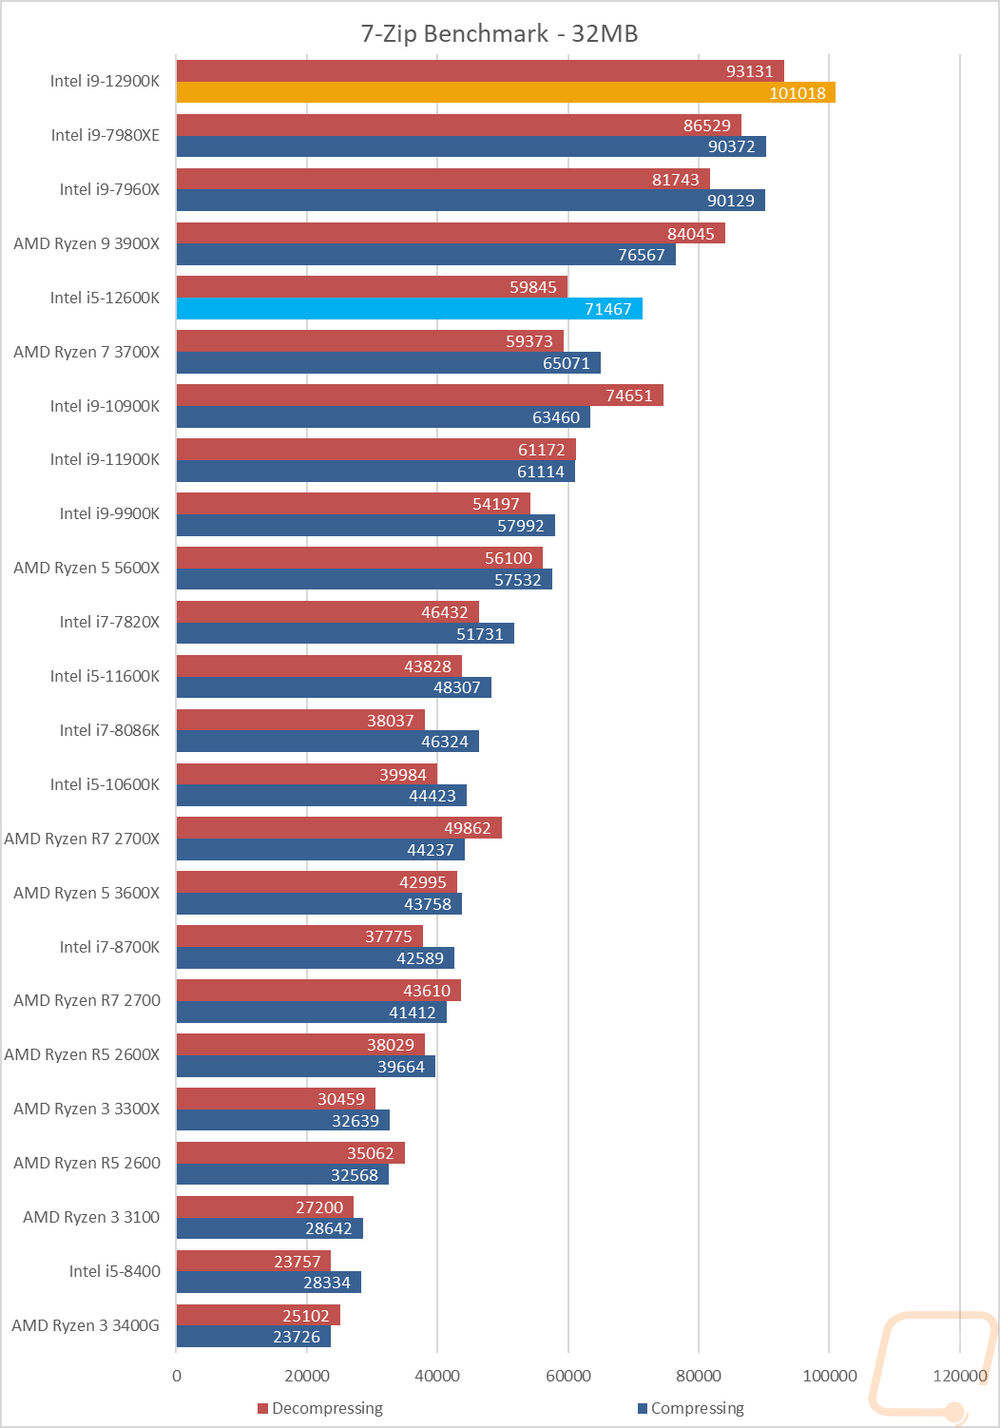
7 Zip is another open-source program, this time for compressing and decompressing all of your files. Here I have run the benchmark and we have three results. The combined MIPS is a combination of compressing and decompressing performance. Then I have it broken down between the two. This workload likes extra cores which can be seen with the Core-X CPUs, 10900K, and high core count Ryzen CPUs up at the top and the extra 8 e-cores of the 12900K help push it to the top of the combined chart with the 12600K sitting back behind the 10 core 10900K. In the compressing and decompressing results I was surprised that he 12600K struggled a little more with decompressing than the others, you can see the same issue on the 12900K only a little less as well but beyond that both performed right around the same as in the combined result.
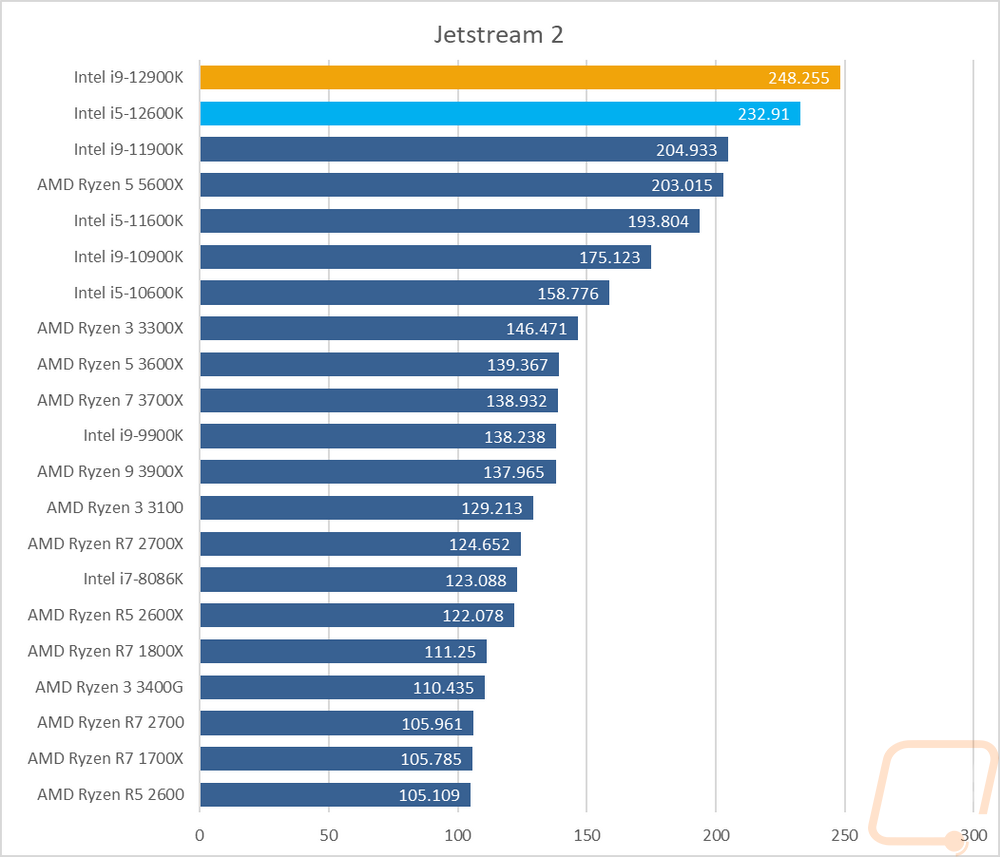
Jetstream 2 is a compilation benchmark which takes a long list of HTML5 and Java in-browser tests and runs them all three times and puts together an overall score. I love this benchmark because let's be honest, most people are using their browser more than any other game or program. Jetstream gives some interesting results sometimes though. It does tend to favor higher IPC which is why both 12th gen CPUs are at the top even over the 11900K which was at the top previously.
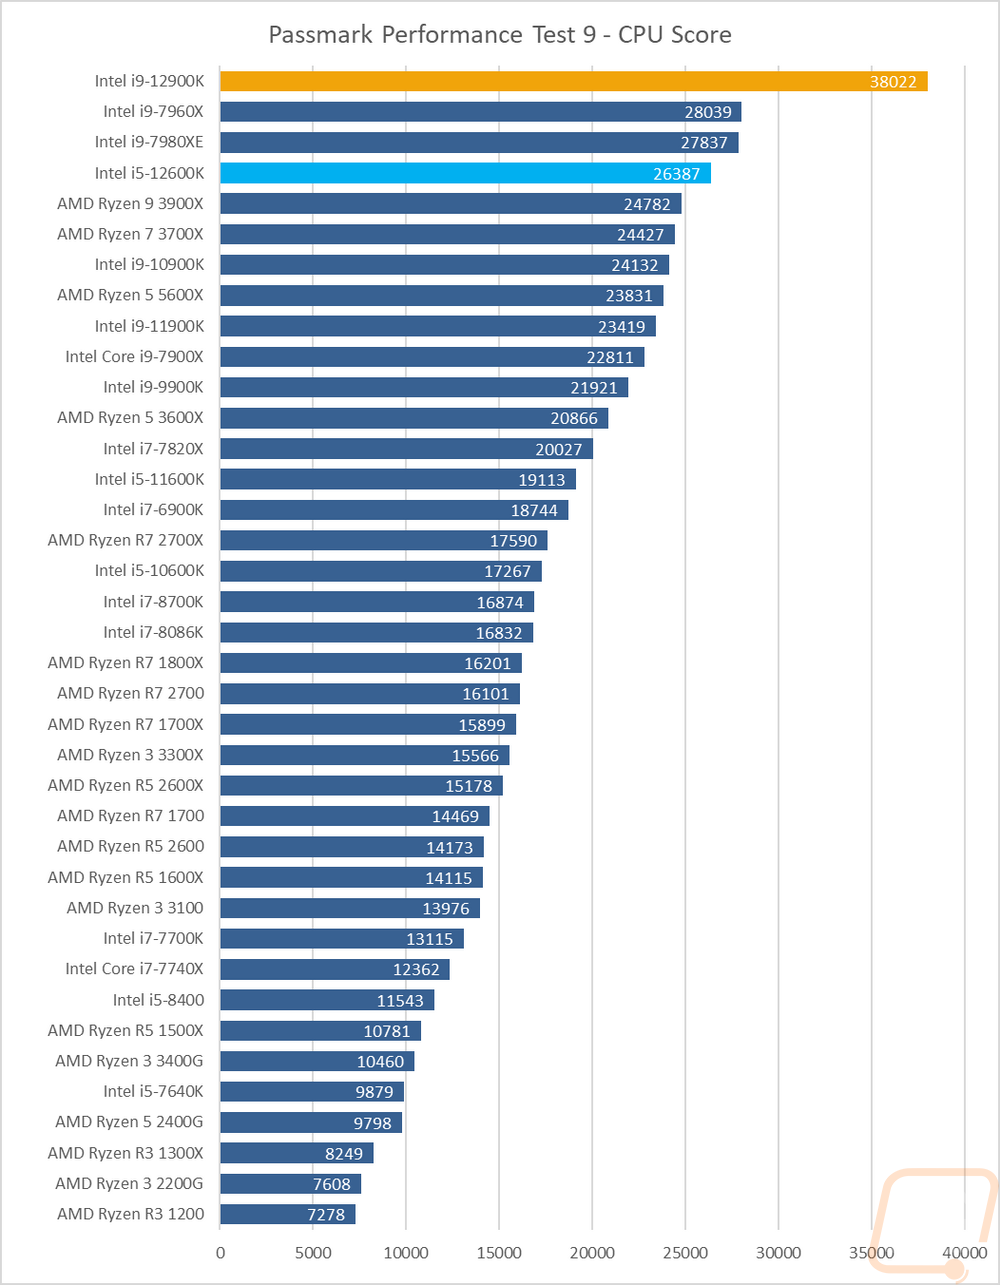
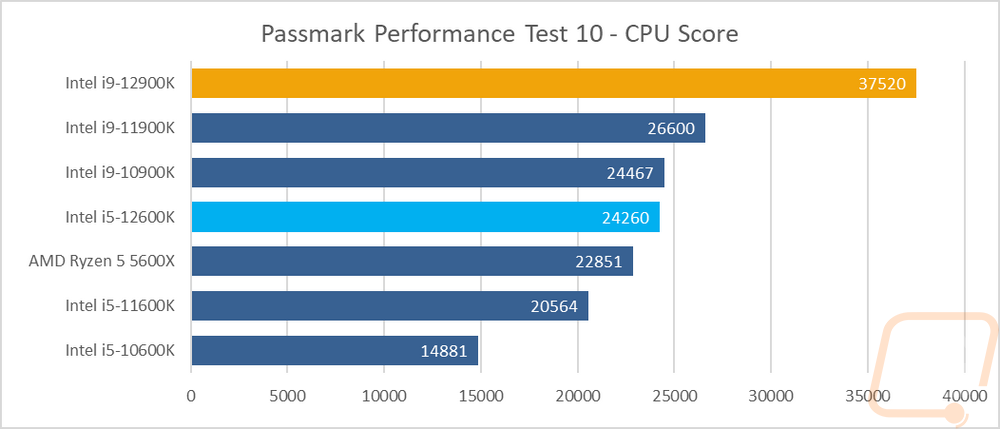
In the Passmark performance test, I ran the full CPU benchmark to get a score. I did this using the older 9.0 and the newer 10.0 tests. These tests typically favor high core count CPUs but IPC does make a difference as well and the combination of the two has the 12900K out comically ahead of the other results. The 12600K did well as well though with it out ahead in version 9.0 of the two previous generation flagships but in 10.0 it is closer to where it should be with the 11900K and 10900K ahead of it, but only by a small amount.
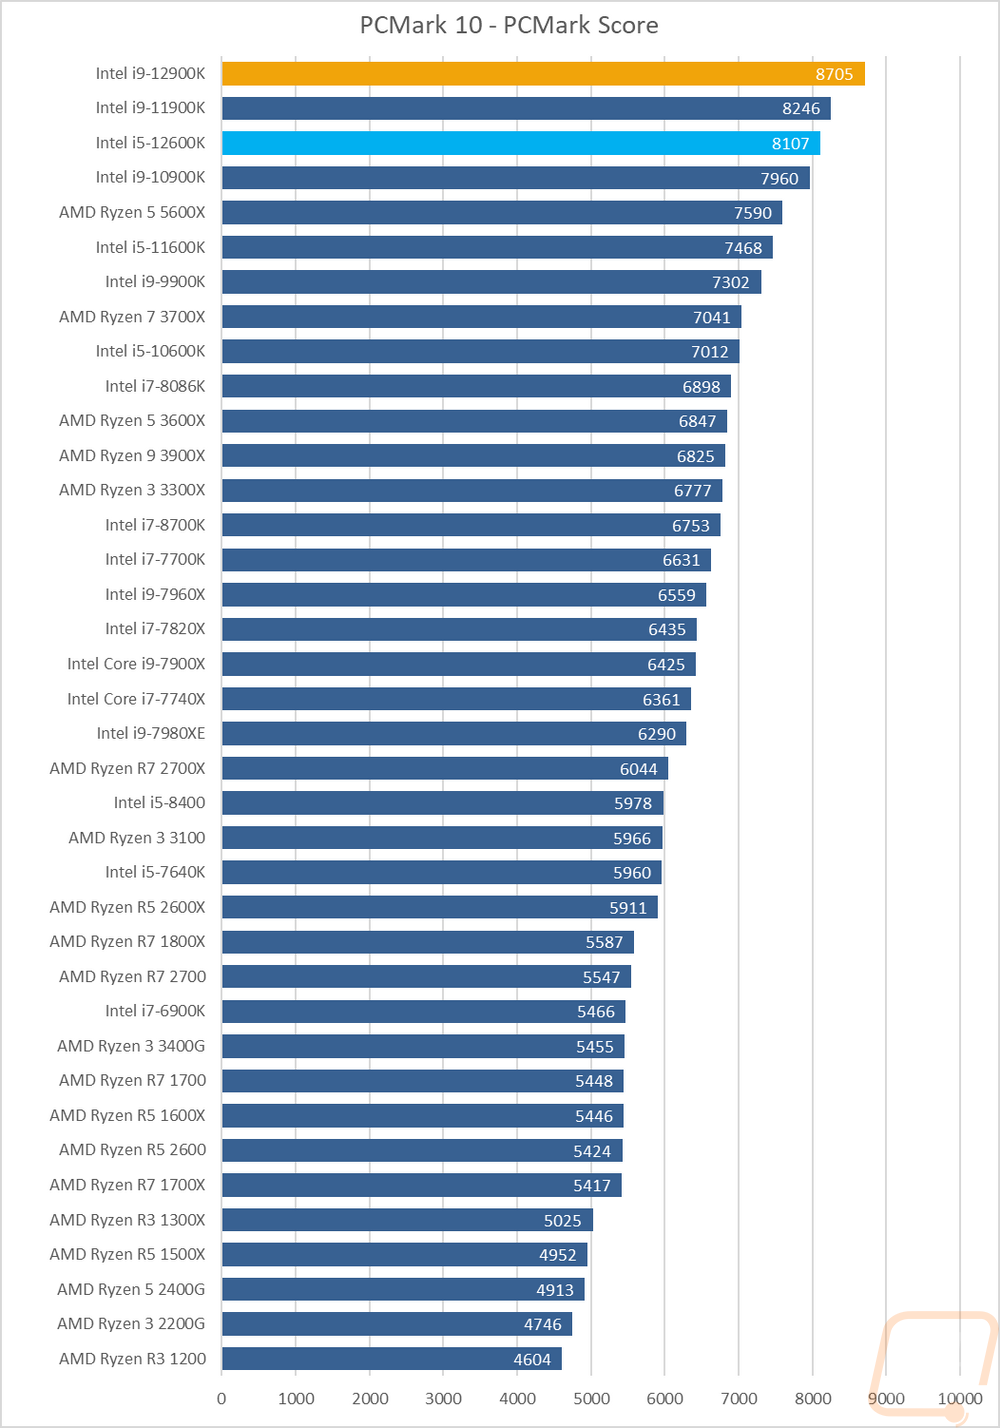
PCMark 10 is a great test because it tests things like video calls, browser performance, excel, and word performance to give an idea of real-world performance. It tends to like higher clock speeds and with the top four CPUs being 4.9 GHz or higher boost clock CPUs it shows. Both the 12900K and 12600K are up near the top but the big thing here is the gap that the 12900K put on the 11900K in this test.
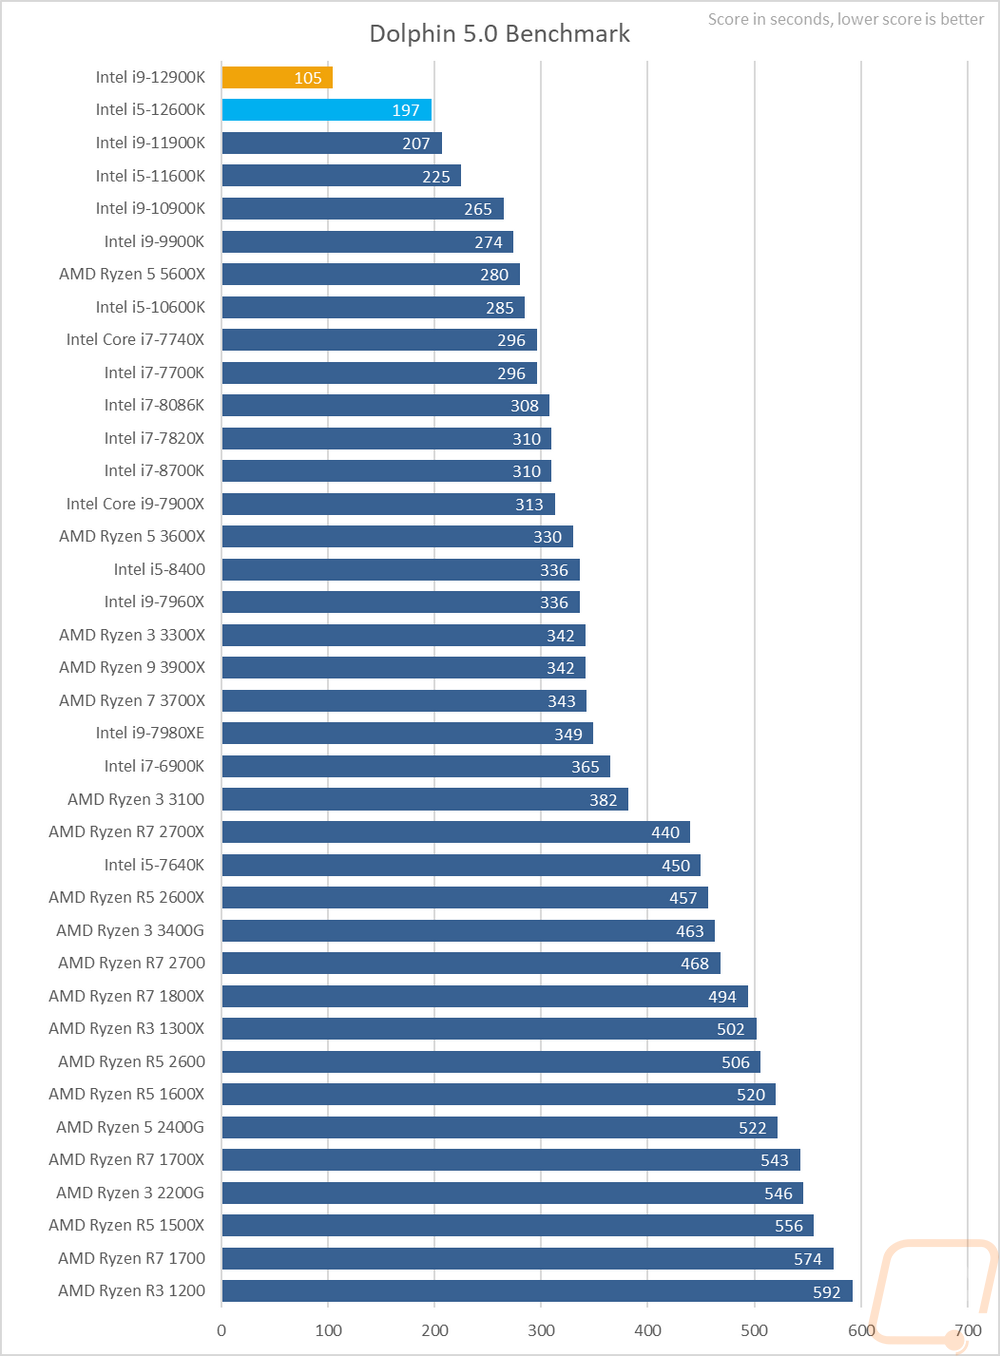
Dolphin 5.0 is a Wii emulator and like most emulators, it doesn’t care about high core counts at all. In fact, it only runs two in total. Clock speeds and IPC are important here, in addition to Dolphin favoring Intel in general. But I wasn’t expecting the 12900K to do so well in this timed test. It took half as much time as even the 12600K.
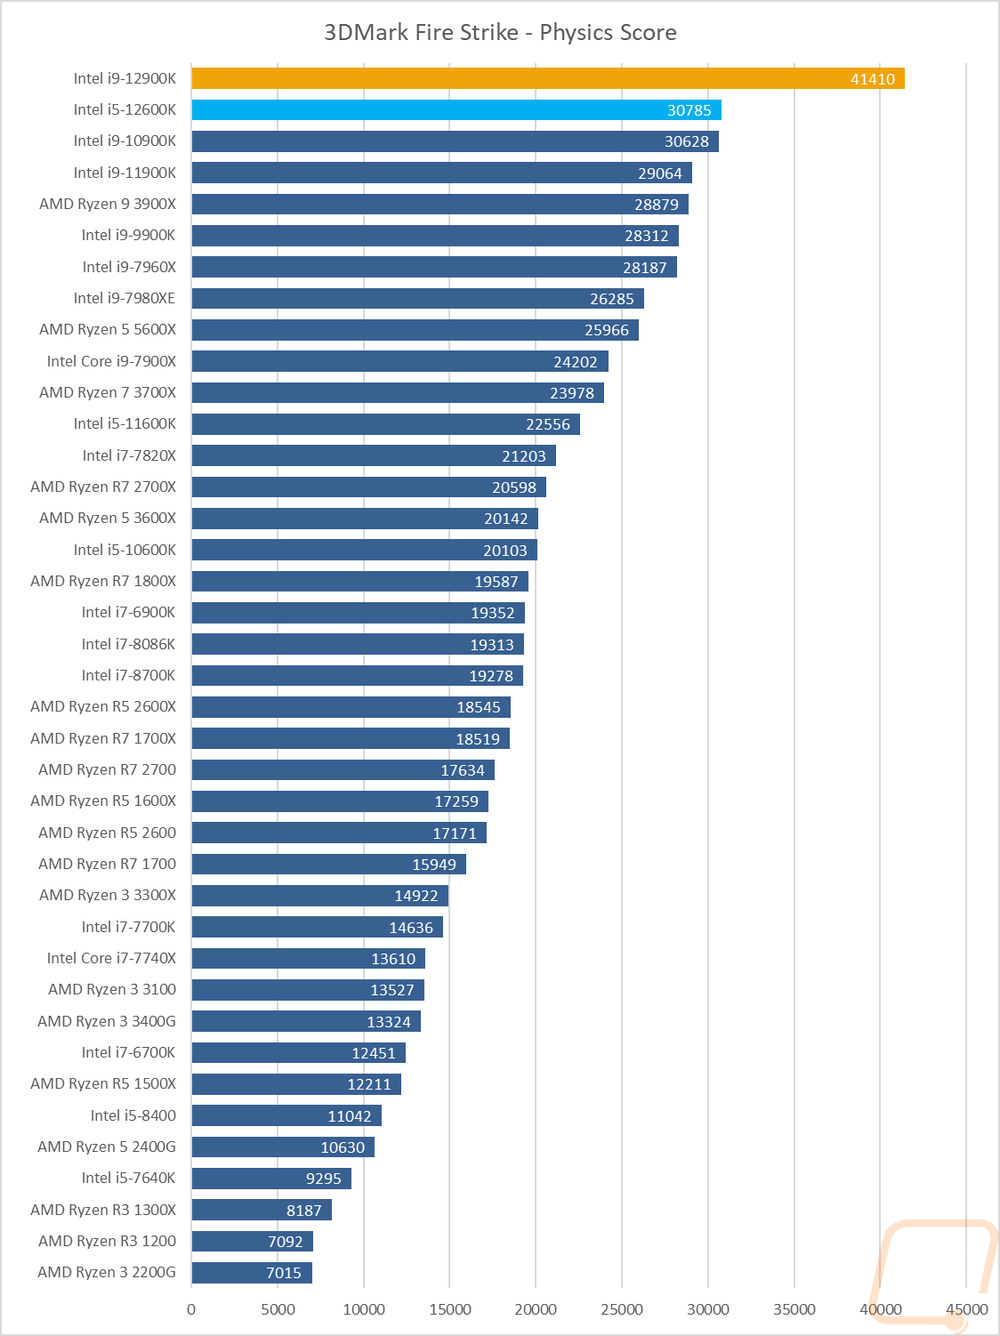
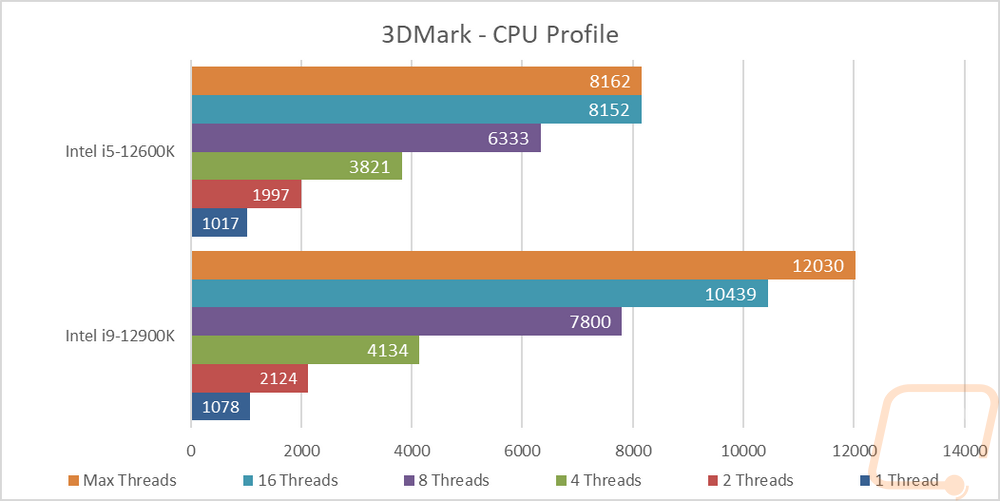
Before diving into game testing I wanted to check out synthetic performance using 3DMark. I tested with the older DX11 Fire Strike test as well as the newer DX12 Time Spy. I also added the new 3DMark CPU Profile benchmark into the mix as well that does a good job of showing the full range of thread counts that you might see being used in games as well as a max threads option that does everything above 16 threads. The 12600K has 20 threads in total with its 6 p-cores and 4 e-cores so there wasn’t much of a difference once it went above 16 threads but even at 16 threads the 10900K did much better. You can see where the 12900K has two additional p-cores not to mention 4 more e-cores. The time spy results had the two 12th gen processors at the top with even the 12600K above the 11900K which is impressive in itself. But look at the Fire Strike result with the 12900K off in its own category.

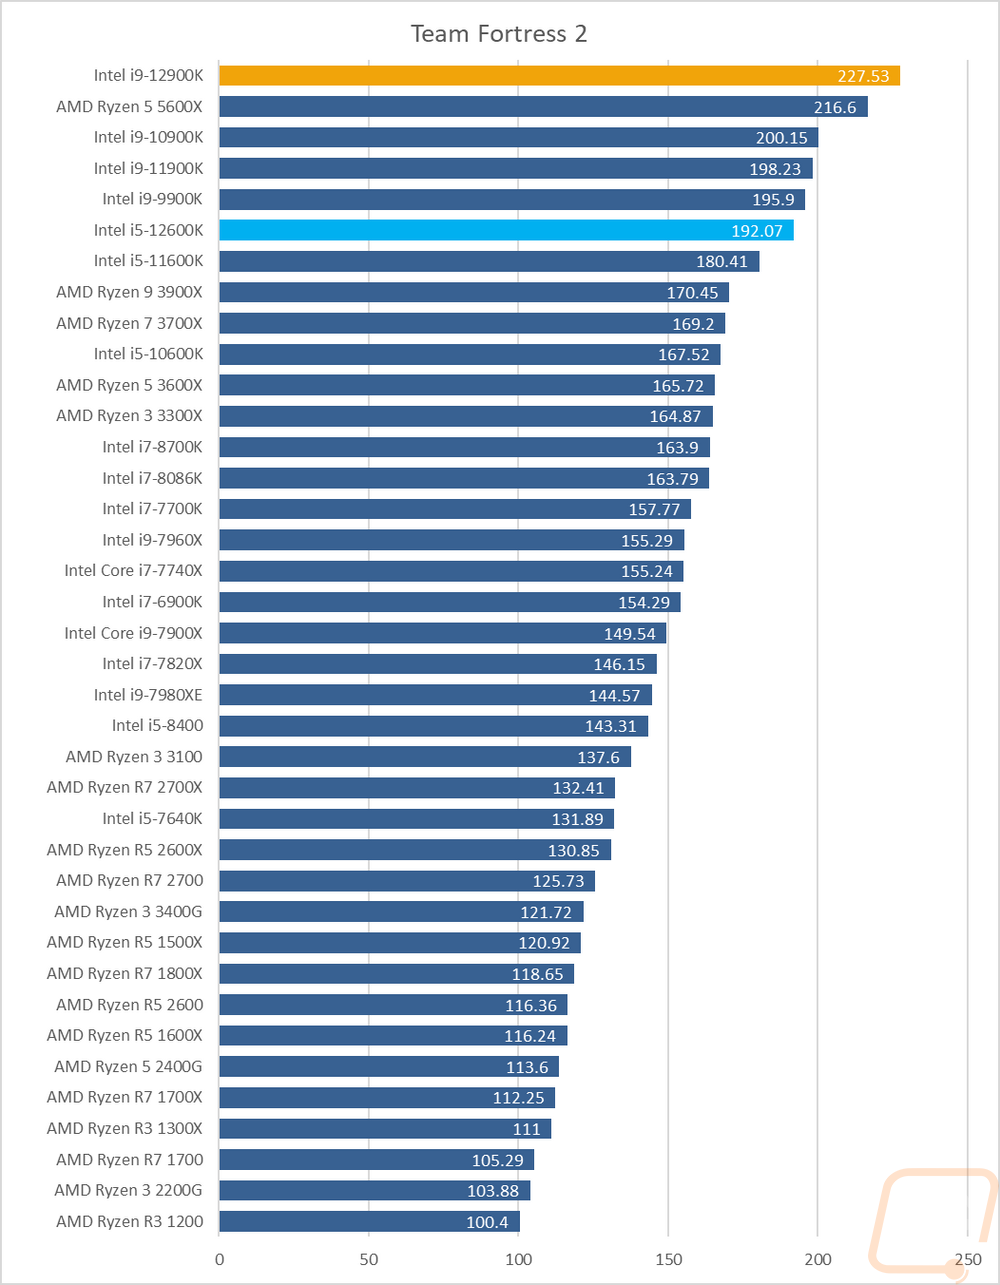
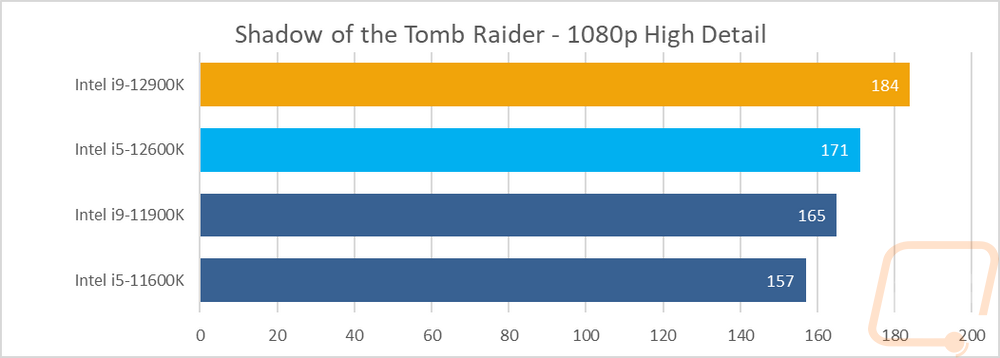
For in-game performance testing on the i9-129000K and the i5-12600K, I ran them through a variety of new and old games. TF2 for example is a very old game at this point but is also extremely CPU dependent which makes it a good option to check out for older source based games. The 12900K is, of course, up at the top of the chart with it ahead of the 5600X by 11 FPS but the 12600K didn’t do too bad here as well sitting just behind all of the 5GHz former flagships from Intel.
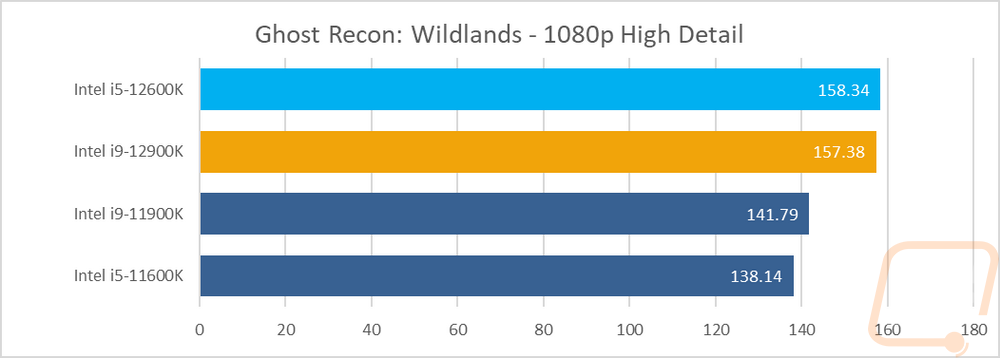
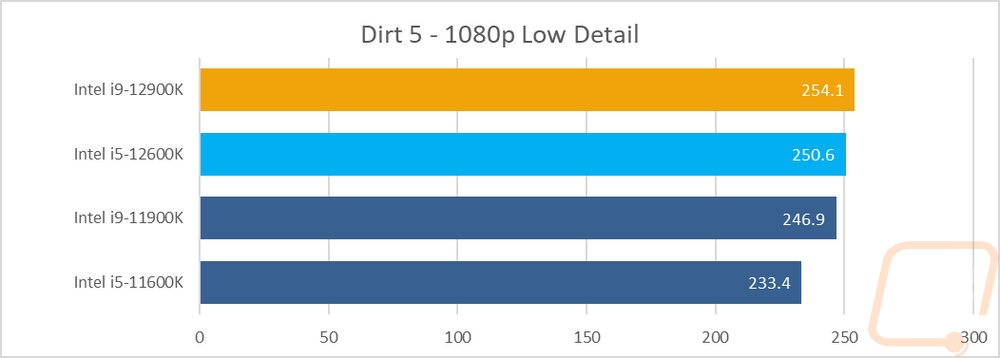
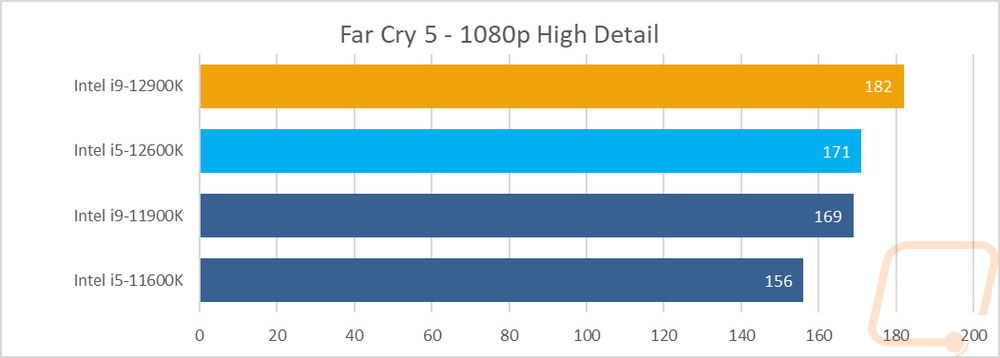
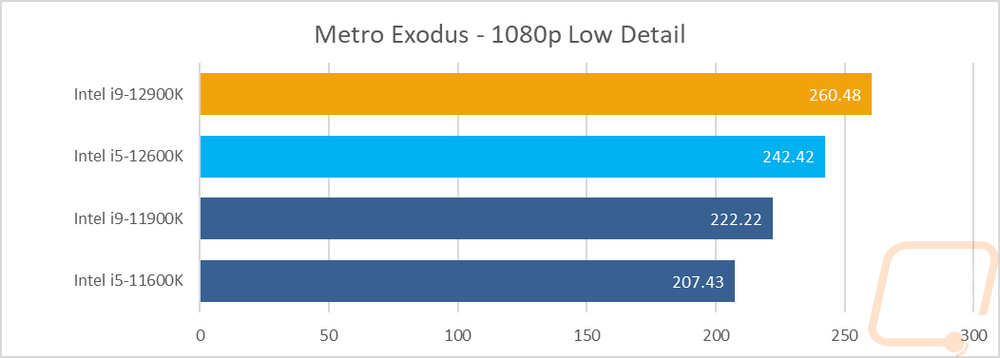
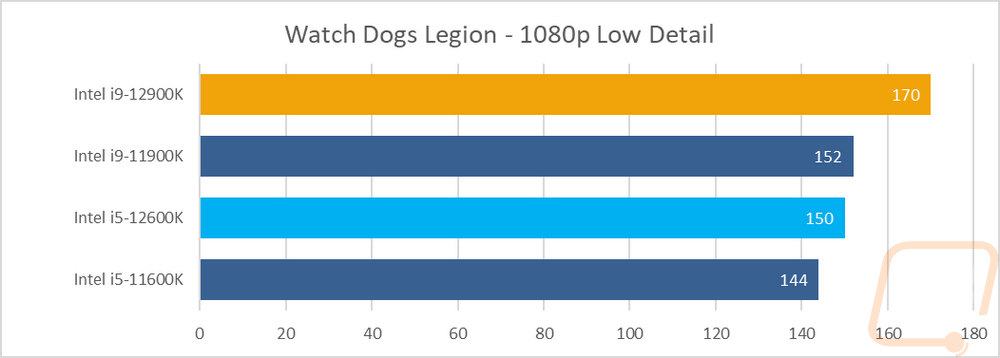
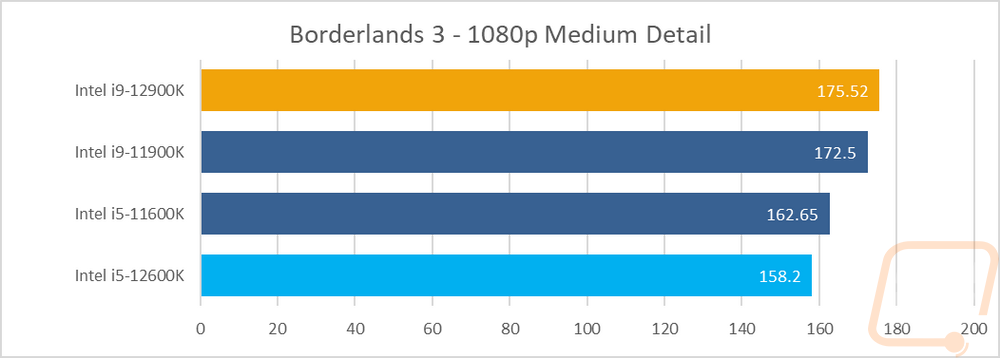
For the rest of the games tested I had a mix of a few year old games and newer games at a few different detail levels. I averaged out all of the 12th generation and 11th generation results to get a look at how much of a jump in performance Intel has seen in the past year. The i9-12900K was of course at the top of the four, but what surprised me was that the i5-12600K came in 3 FPS over last year's i9-11900K. and 14 FPS over the i5-11600K.
|
|
I9-12900K |
I5-12600K |
I9-11900K |
I5-11600K |
|
Average FPS |
201.3763 |
186.7038 |
183.455 |
172.3788 |
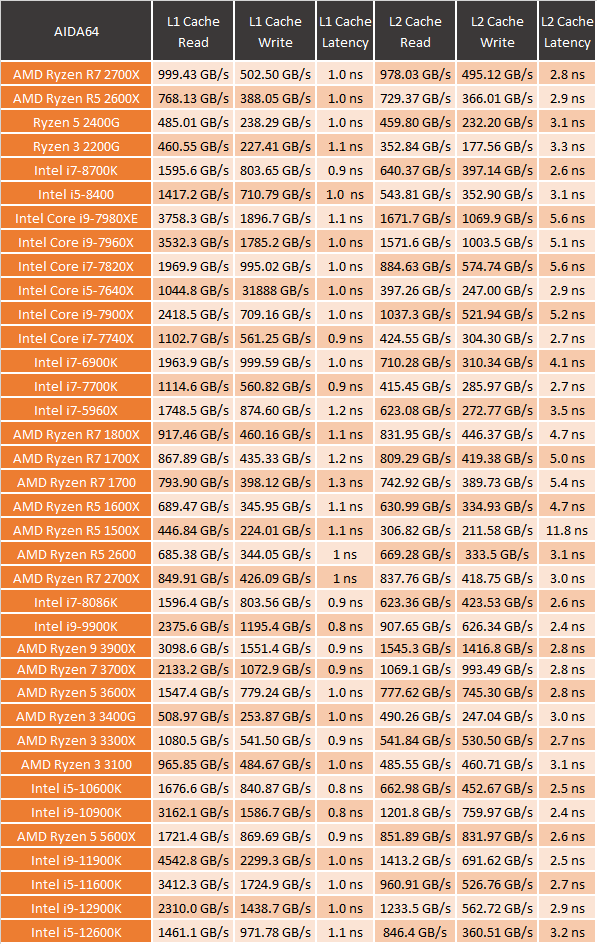
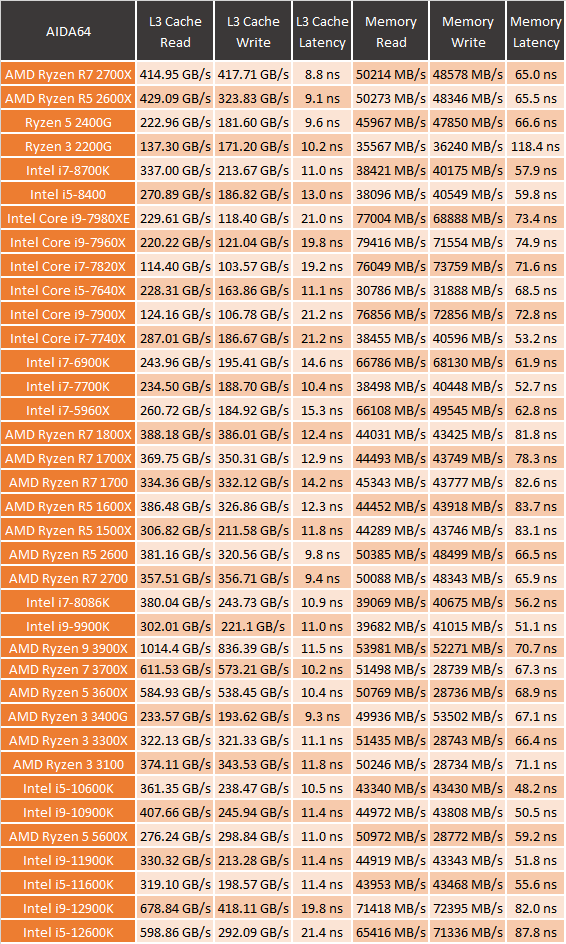
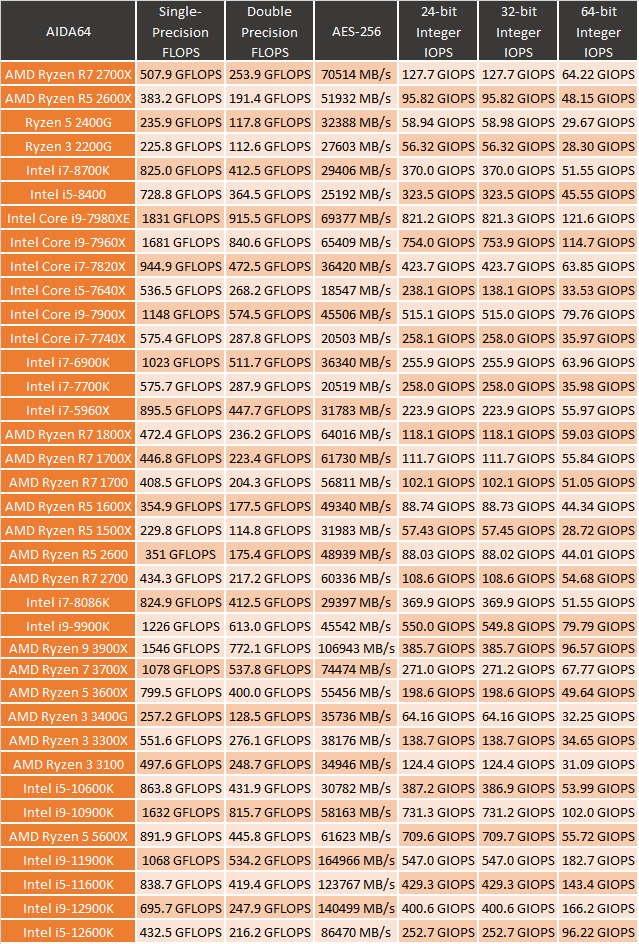
I did also run both CPUs through a few tests using AIDA64, specifically, I wanted to check out cache performance, memory performance, and how the CPUs handle single and double precision and different integers. I will say though that AIDA64 does have a warning that their software may not be taking full advantage of the new hybrid CPU design so we may have to come back to these in the future and retest.
For the memory tests, the new DDR5 puts out impressive numbers. Especially once you compare them with CPUs from the last few years. We did see similar performance with the Core-X line, but that was when running quad-channel memory. DDR5 is running at those speeds in just dual-channel! Memory latency is up though from 51.8ns on the 11900K to 82 ns on the 12900K but from our testing so far it looks like the huge jump in overall bandwidth makes up for the lower latency. As for cache performance, the L1 cache is down in read speed but L2 was similar to the 11900K and L3 is much faster but again with double the latency. Single and double precision FLOPS were both down to about half of what the 11th gen CPUs did as was AES-256. Same with all three Integer IOPS tests. I suspect these are the tests that may have issues with the Hybrid design, much like wPrime did.