Last month AMD launched a refresh of some of their CPU range and while I didn’t have the full range we did take a look at the Ryzen 5 4500 which was an interesting update on the Zen 2 lineup. Well AMD did send a few more of their refresh CPUs over for me to take a look at. We have the Ryzen 5 5600 and the Ryzen 7 5700X. The 5600 fills in a gap behind the 5600X that I previously took a look at and the 5700X slots in between the 5600X and the 5800X. So today I’m going to check out how both perform and see if they are worth considering if you are building a budget to mid-range CPU this upcoming summer.
Product Name: AMD Ryzen 5600 and 5700X
Review Sample Provided by: AMD
Written by: Wes Compton
Amazon Affiliate Link: AMD Ryzen 5 5600 and Ryzen 7 5700X
|
Specifications |
Ryzen 5 5600 |
Ryzen 7 5700X |
|
Platform |
Desktop |
Desktop |
|
Architecture |
Zen 3 |
Zen 3 |
|
# of CPU Cores |
6 |
8 |
|
# of Threads |
12 |
16 |
|
Max. Boost Clock |
Up to 4.4GHz |
Up to 4.6GHz |
|
Base Clock |
3.5GHz |
3.4GHz |
|
Total L1 Cache |
384KB |
512KB |
|
Total L2 Cache |
3MB |
4MB |
|
Total L3 Cache |
32MB |
32MB |
|
Default TDP |
65W |
65W |
|
Processor Technology for CPU Cores |
TSMC 7nm FinFET |
TSMC 7nm FinFET |
|
Unlocked for Overclocking |
Yes |
Yes |
|
CPU Socket |
AM4 |
AM4 |
|
Socket Count |
1P |
1P |
|
Thermal Solution (PIB) |
AMD Wraith Stealth |
Not included |
|
Max. Operating Temperature (Tjmax) |
90°C |
90°C |
|
PCI Express® Version |
PCIe 4.0 |
PCIe 4.0 |
|
System Memory Type |
DDR4 |
DDR4 |
|
System Memory Specification |
Up to 3200MHz |
Up to 3200MHz |
|
Supported Chipsets |
X570 X470 X370 B550 B450 B350 A520 |
X570 X470 X370 B550 B450 B350 A520 |
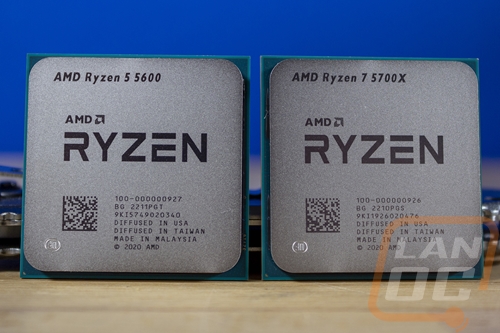
The Ryzen 7 5700X has the same 8 core 16 thread configuration that the 5800X has only it has a lower base clock with it running at 3.4 GHz vs 3.8 GHz on the 5800X. It also has a lower boost clock at 4.6 GHz vs 4.7 GHz. The base clock on the 5700X puts it below the 5600X for clock speed which runs at 3.7 GHz base and has the same 4.6 GHz boost clock. Then for the Ryzen 5 5600, it has a 6-core 12-thread combination just like the 5600X and the 5500 below it in the lineup. Its base clock is 3.5 GHz which is higher than the 5700X as well but its boost clock is 4.4 GHz which is lower so that may make for a few interesting results in the tests. Both have the same 65-watt TDP and the 5600 comes with the Wraith Stealth cooler whereas the 5700X doesn’t come with a cooler at all. Both are Zen 3 based which means PCIe 4.0 support and the same chipsets supported which I have included in the specifications above.

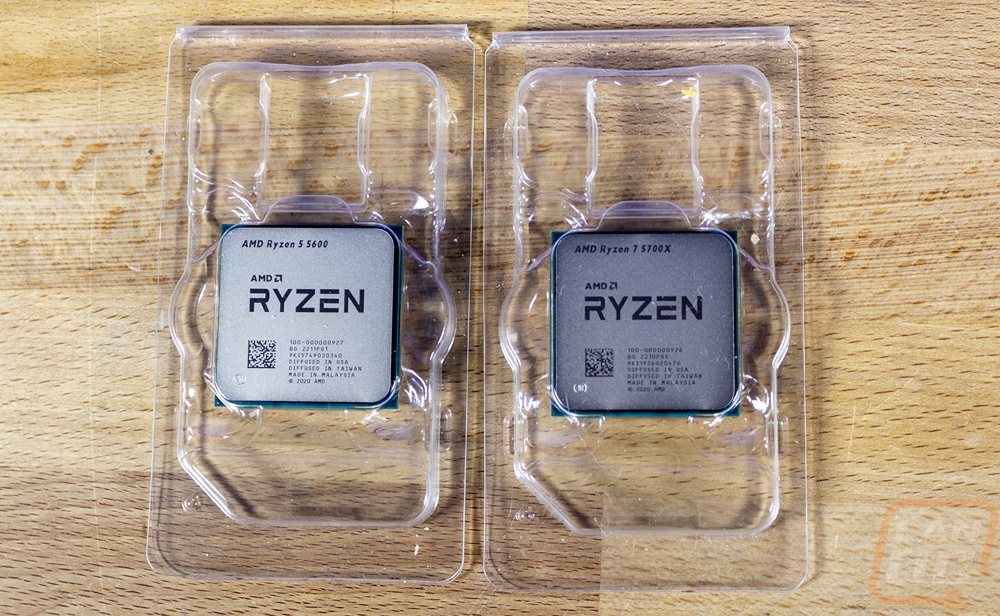
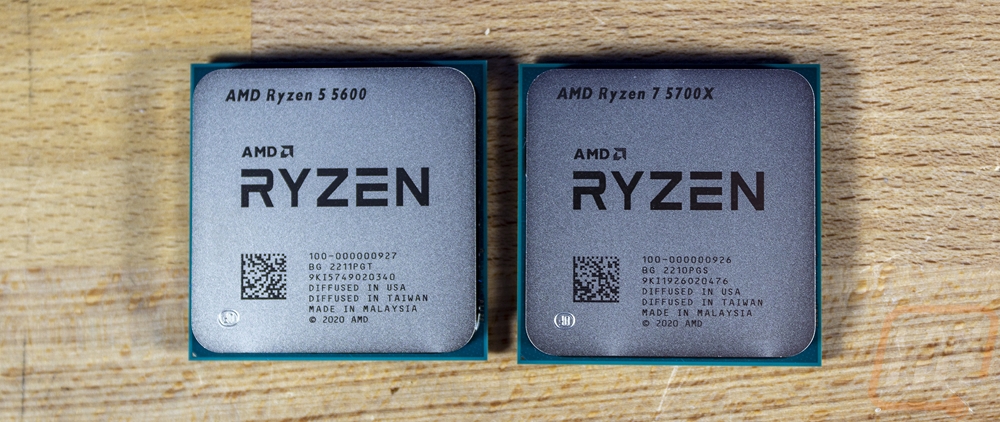
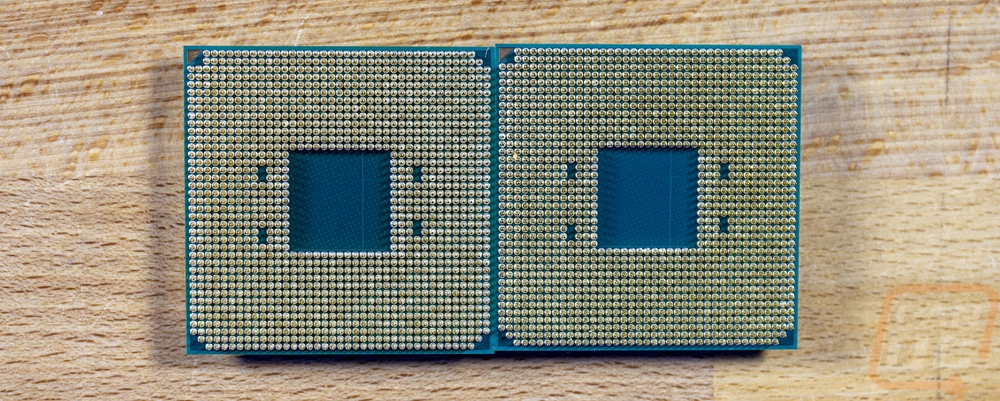
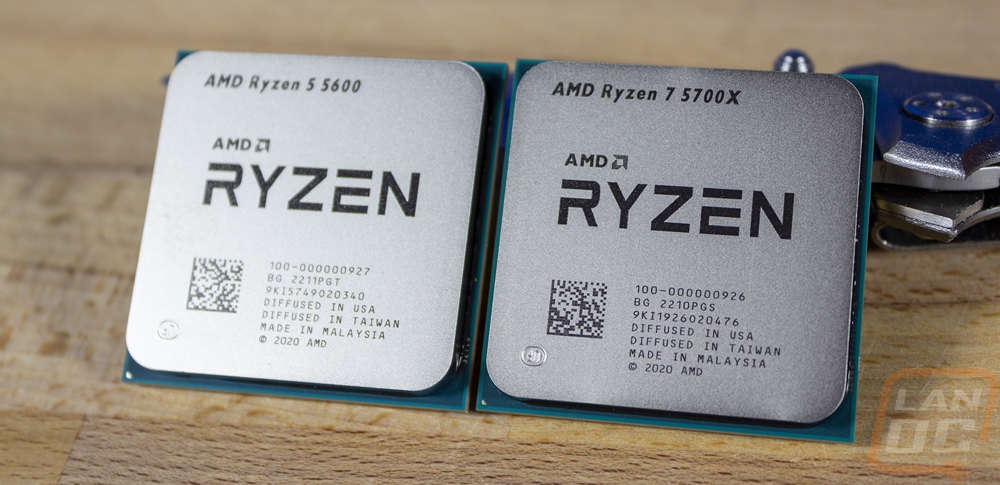
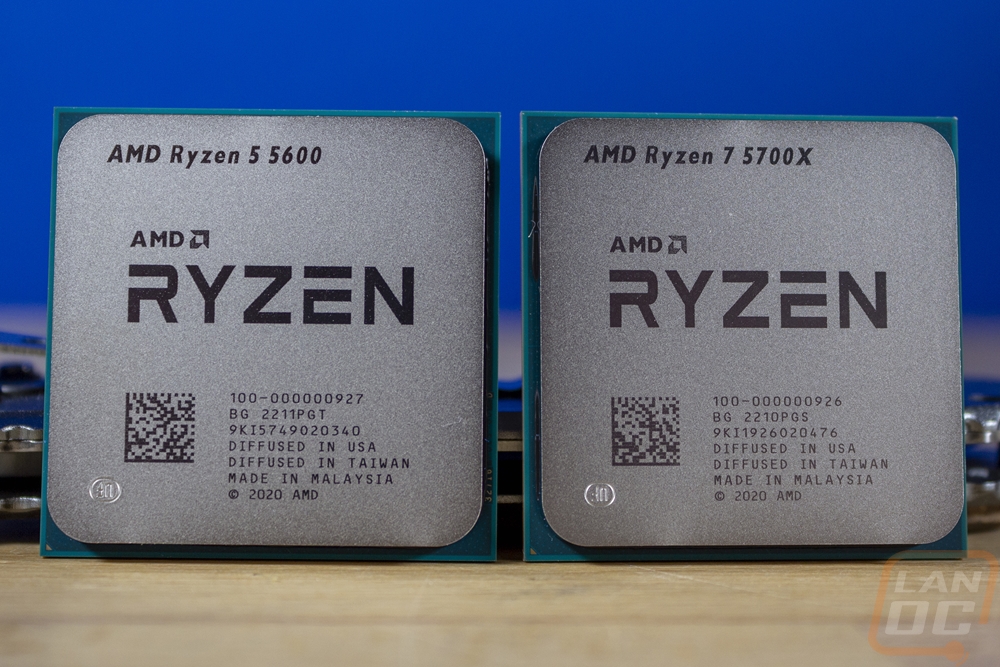
AMD just sent over the CPUs themselves so we don’t have packaging pictures or the cooler to go with the 5600 but here is a look at both CPUs.
Test Rig and Procedures
Test System
Motherboard: ASUS ROG Crosshair VIII Hero WiFi – Live Pricing
Cooling: Corsair iCUE H100i ELITE LCD Liquid CPU Cooler - Live Pricing
Noctua NT-H1 Thermal Paste - Live Pricing
Memory: G.Skill Trident Z Royal 3600MHz 16-16-16-36 – Live Pricing
Storage: Corsair MP600 2TB– Live Pricing
Video Card: Nvidia RTX 3070 FE - Live Pricing
Power Supply: Corsair AX1200 - Live Pricing
Case: Primochill Wetbench - Live Pricing
OS: Windows 10 Pro 64-bit - Live Pricing
|
CPU Testing Procedures |
|
|
Team Fortress 2 |
|
|
Tom Clancy's Ghost Recon: Wildlands |
Built-in Benchmark, 1080p, High detail setting |
|
Dirt 5 |
Built-in benchmark, running at 1080p on all three resolution settings, V-Sync is turned off, dynamic resolution is turned off, and on the low detail setting |
|
Far Cry 5 |
1080p with High Detail setting using built-in benchmark |
|
Shadow of the Tomb Raider |
Built in benchmark, gtx 1080Ti, 1080p, high detail setting |
|
Metro Exodus |
Default benchmark low setting |
|
Watch Dogs Legion |
1080p, dx12, medium detail |
|
Borderlands 3 |
Built-in benchmark. fullscreen, 1080p, medium quality, dx11 |
|
Dolphin 5.0 Benchmark |
|
|
3DMark |
Fire Strike - Physics Score – Performance benchmark, Time Spy - CPU Score, and CPU Profile test |
|
7-Zip |
Built-in benchmark set to 32MB, run 4 or more passes. Combined MIPS, Compressing, and Decompressing scores all used. Just the Current result, not the resulting |
|
Jetstream |
|
|
wPrime |
1024M |
|
X264 HD Benchmark |
Both version 4.0 and 5.0.1. Pass 1 and Pass 2 are run on 5.0.1 and just pass one on 4.0 |
|
Cinebench R15 |
CPU and CPU (Single Core results) |
|
Cinebench R20 |
CPU and CPU (Single Core results) |
|
Cinebench R23 |
CPU and CPU (Single Core results) |
|
CPUz |
CPUz's built in benchmark, both single and multi-core scores |
|
Passmark 9 |
CPU Mark Score |
|
Passmark 10 |
CPU Mark Score |
|
PCMark 10 |
Normal test ran, not the express or extended |
|
Procyon |
Office productivity benchmark is done with the current Microsoft Office 365, Photo Editing Benchmark is done with Adobe Photoshop and Lightroom Classic. Video Editing Benchmark uses Adobe Premiere Pro. All adobe products are running on the latest version at the time of testing |
|
V-Ray |
CPU Benchmark time used as the score |
|
POV-Ray |
Using built-in benchmark. Settings are all set to the "Standard Benchmark Switches" listed on http://www.povray.org/download/benchmark.php |
|
Handbrake |
Tested using 2d 4k 60 FPS version, resized using the Fast 1080p30 preset, average FPS used. Here is the file download location http://bbb3d.renderfarming.net/download.html |
|
Blender |
Using new official benchmark using 3.1.0 |
|
AIDA64 |
Memory, Cache, and FLOPS testing done with built-in GPGPU and Memory benchmarks |
|
Temps |
Aida64 FPU stability test to load and to record temperature readings |
|
Power Usage |
Idle and load testing using a Kill-A-Watt and wPrime to put the CPU under load and again with the AIDA64 FPU CPU workload |
CPU Performance
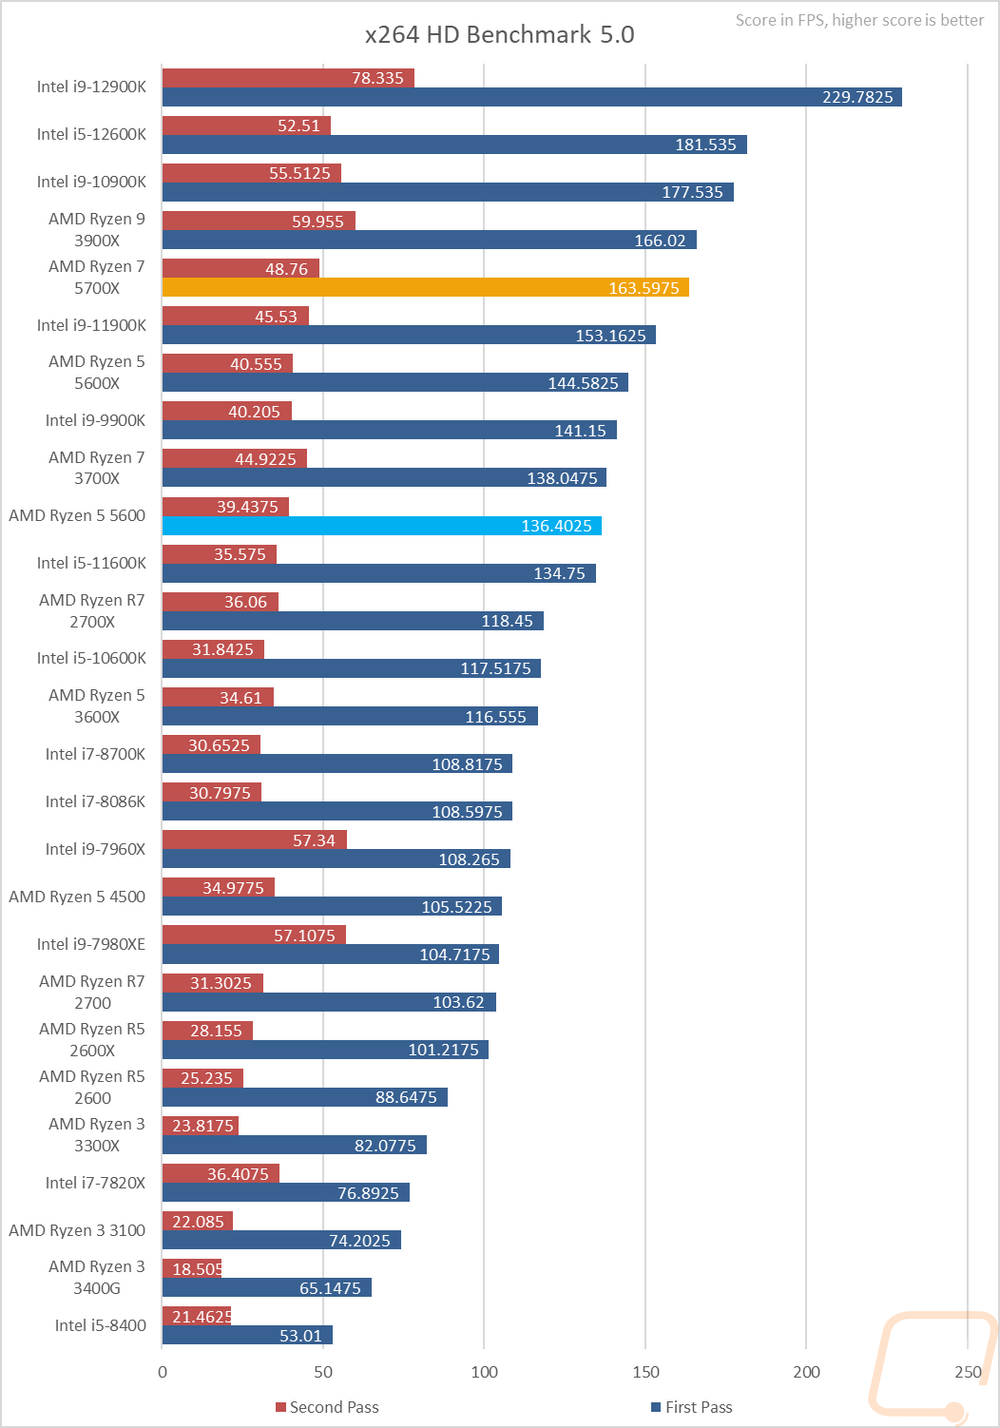
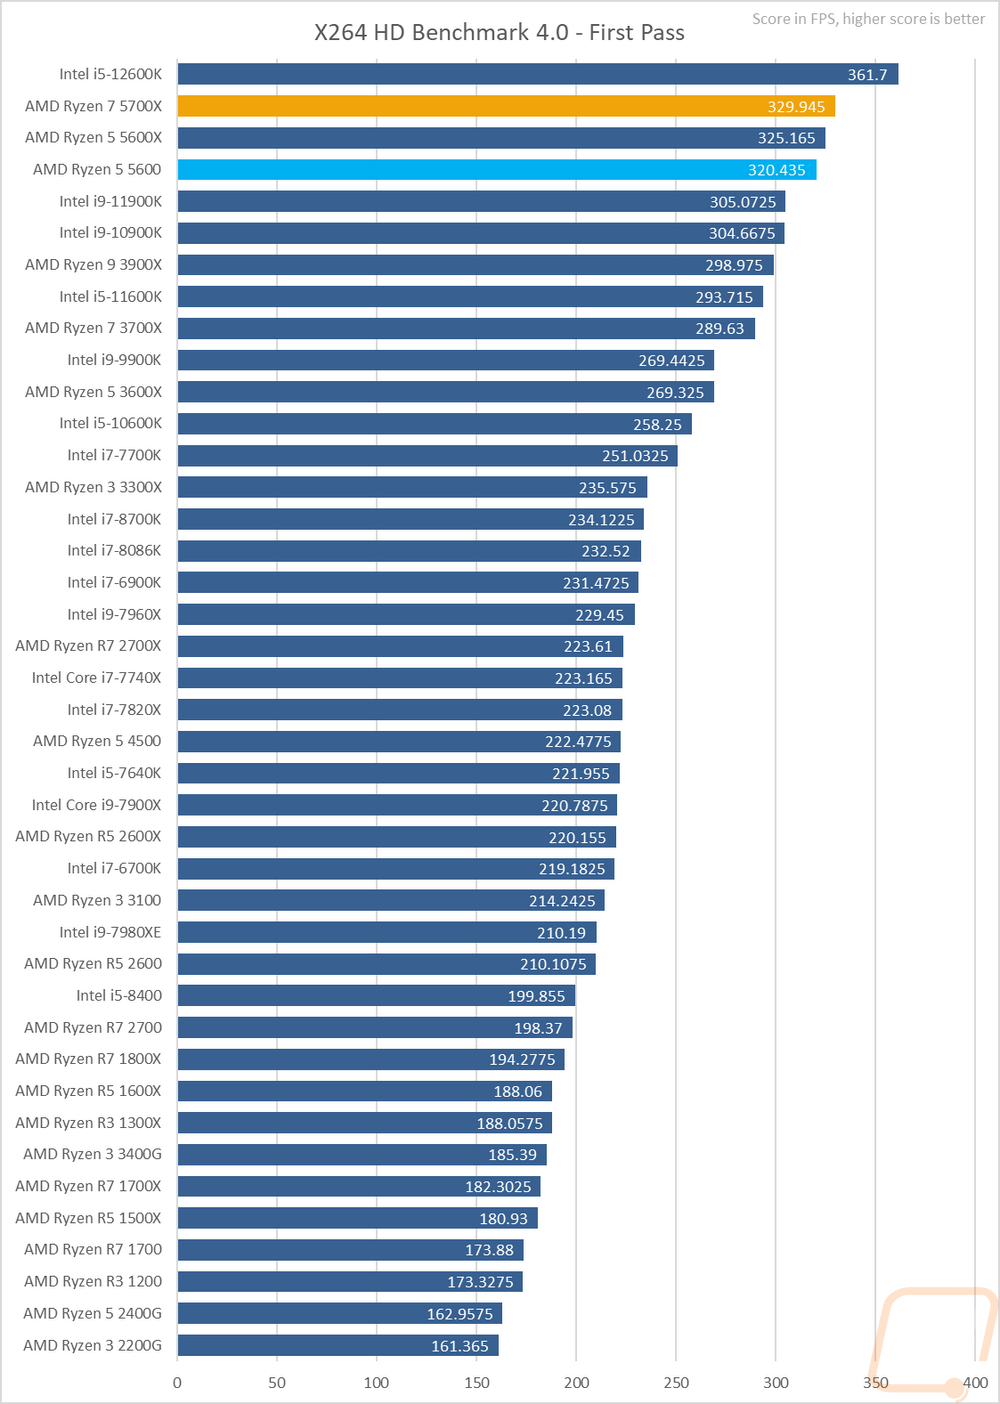
To start testing off I went with a few encoding benchmarks. We have the older X264 HD benchmarks 4.0 and 5.0 which give us an average FPS of the rendering speed of each CPU. The 5700X did well here with its 8 cores and the improved IPC of Zen 3 coming in with just the older higher core count 3900X above it for AMD CPUs tests. This was faster than last gen’s 11900K but behind the higher core count 10900K and both the 12900K and 12600K. The 5600 was down a little lower and running right with the Ryzen 7 3700X and just ahead of the 11600K. In the older 4.0 version, both CPUs did even better with the 5700X only being beat by the 12600K. The 5600X was just behind the 5700X then the 5600 was right behind that.
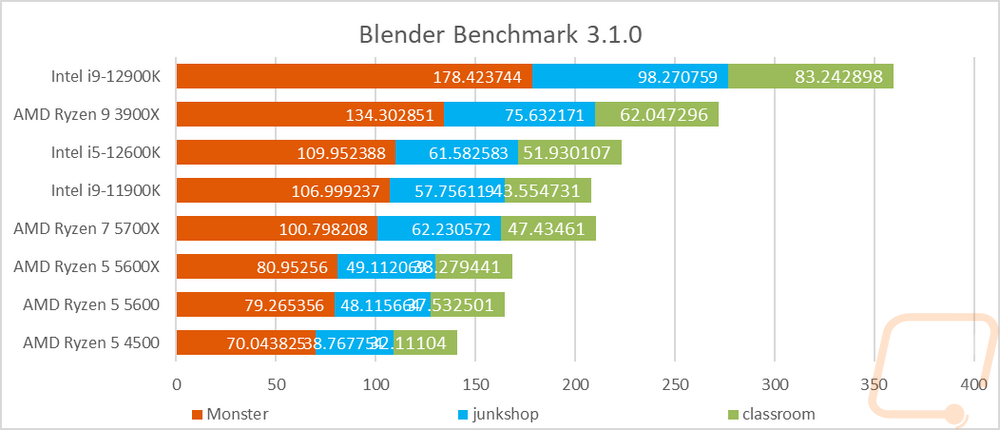
Our next benchmark was still focused on rendering but this time 3D rendering in the always popular Blender. This benchmark was recently updated so our result list is smaller here. I have all three tests stacked together so we can see an overall of them altogether. Blender loves the higher core counts so the older 3900X did well here. The 5700X outperformed the 11900K when all of the results were combined but was slower in the monster test that the graph is sorted in. The 6 core CPUs then have a big step down and the 5600 isn’t far behind the 5600X.
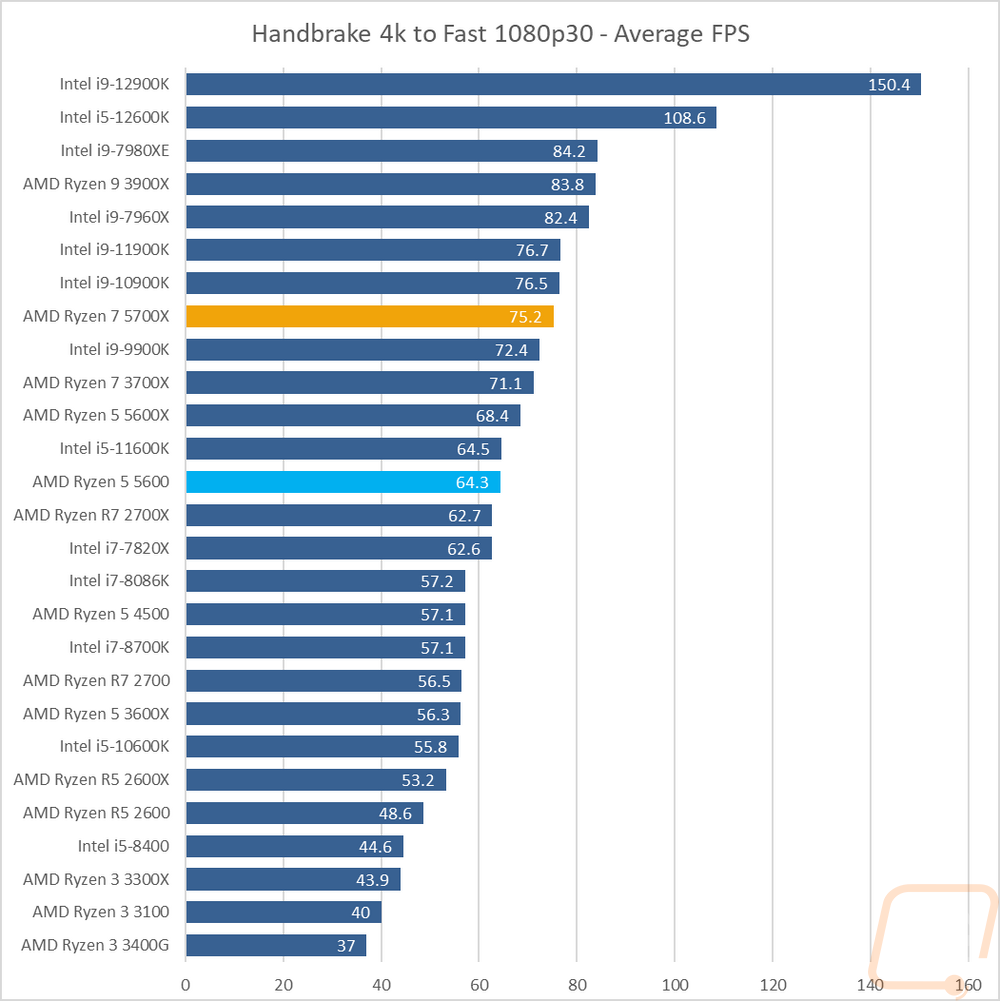
Continuing with the video encoding theme I also have handbrake which is an open-source transcoder. For this test I am taking a 4k video down to 1080p 30 FPS, the results are the average FPS of that task. The 5700X came in just behind the 10900K which shows how AMDs current mid-range is running right with Intel's flagships from a few years ago. The 5600 is right with last year's 11600K as well but I was surprised how much the clock speed difference between the 5600X and the 5600 made a difference here with it at 68.4 FPS vs 64.3 on the 5600.
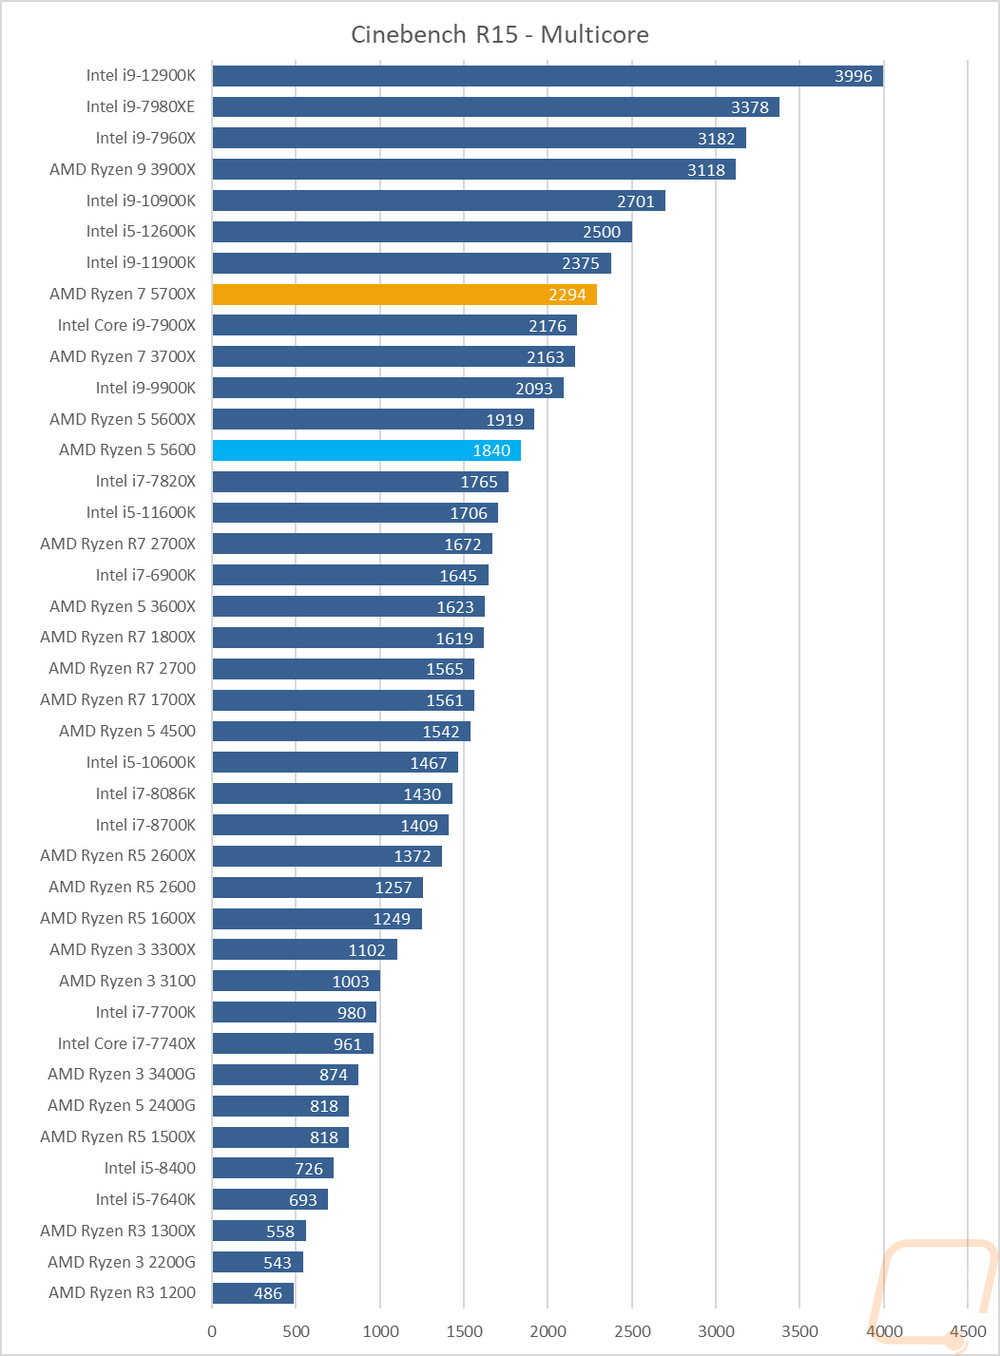
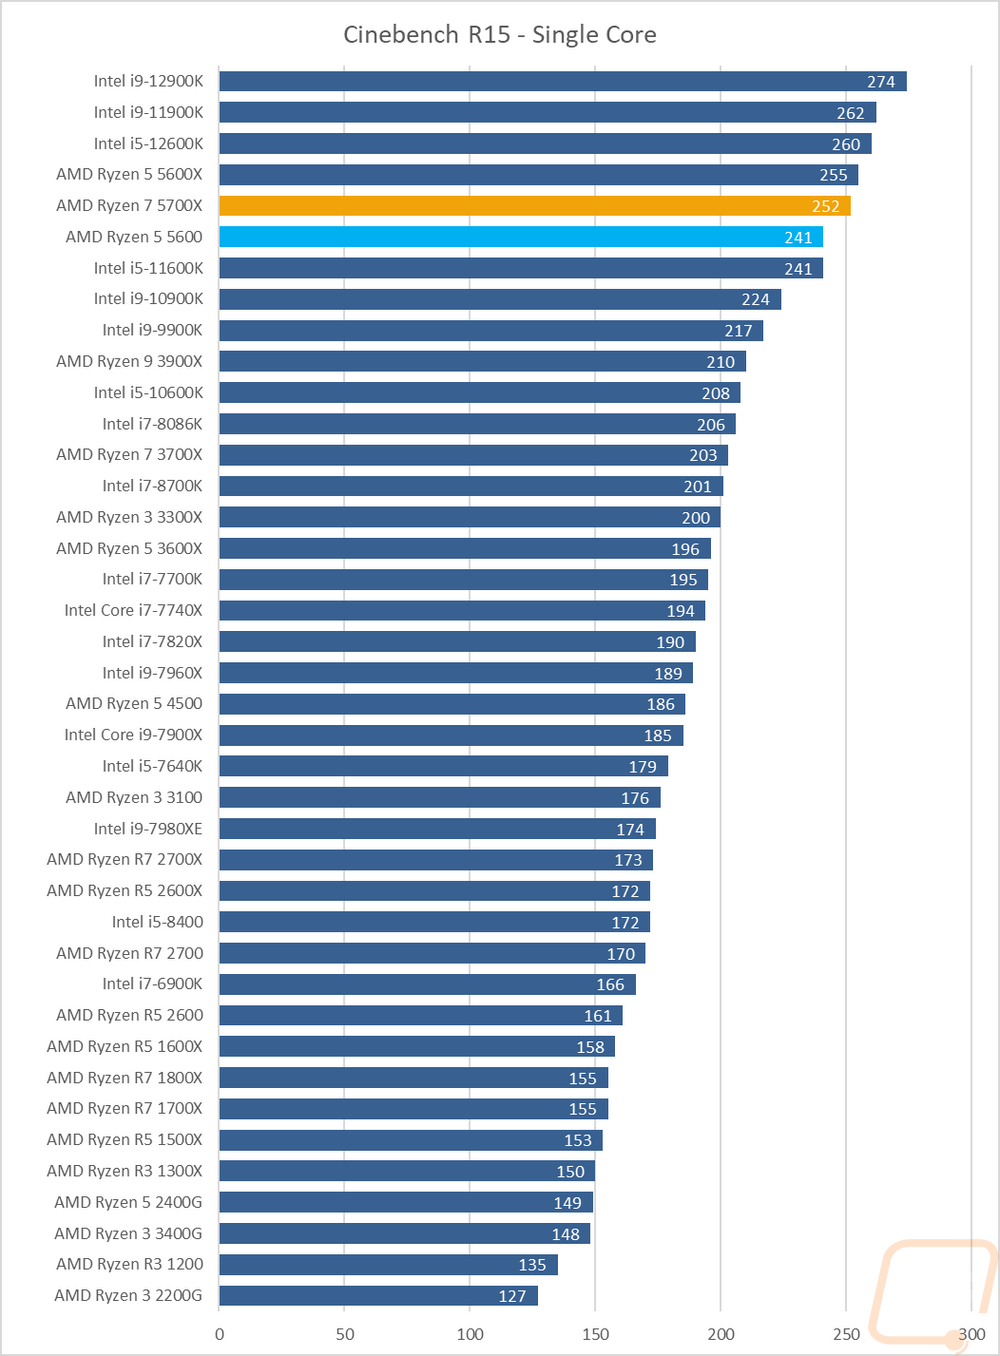
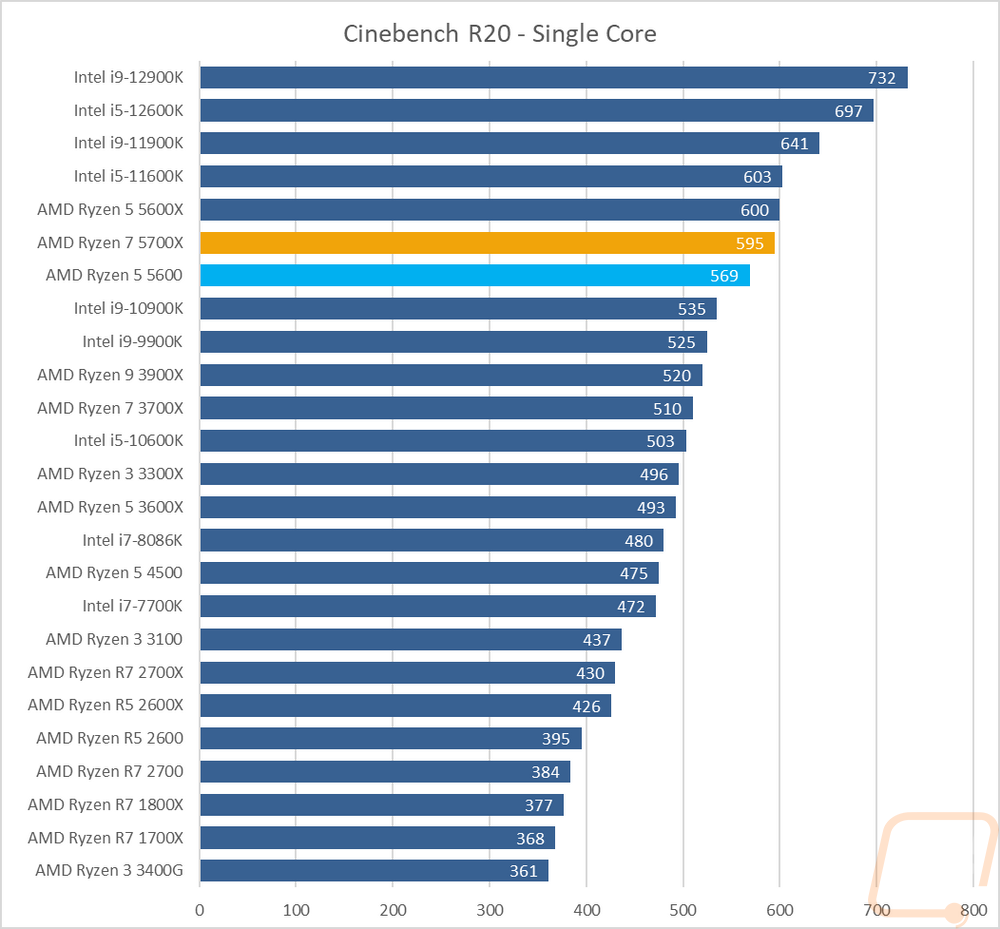
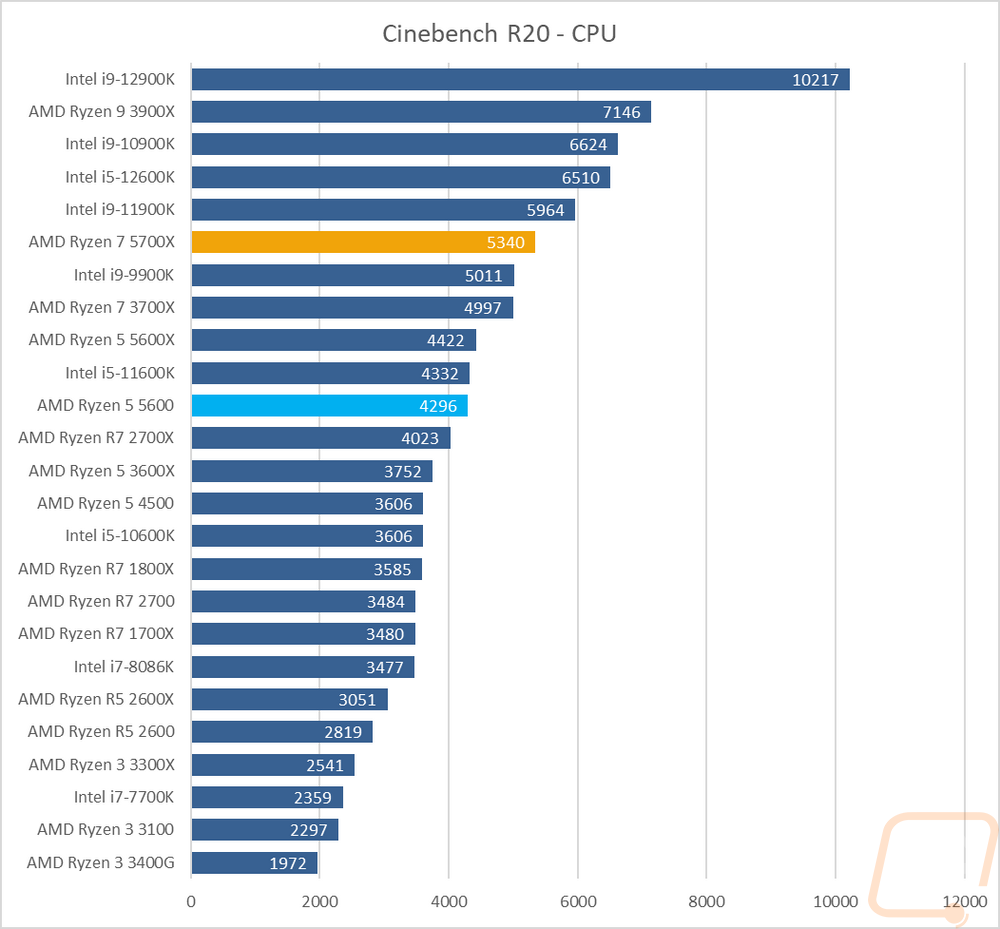
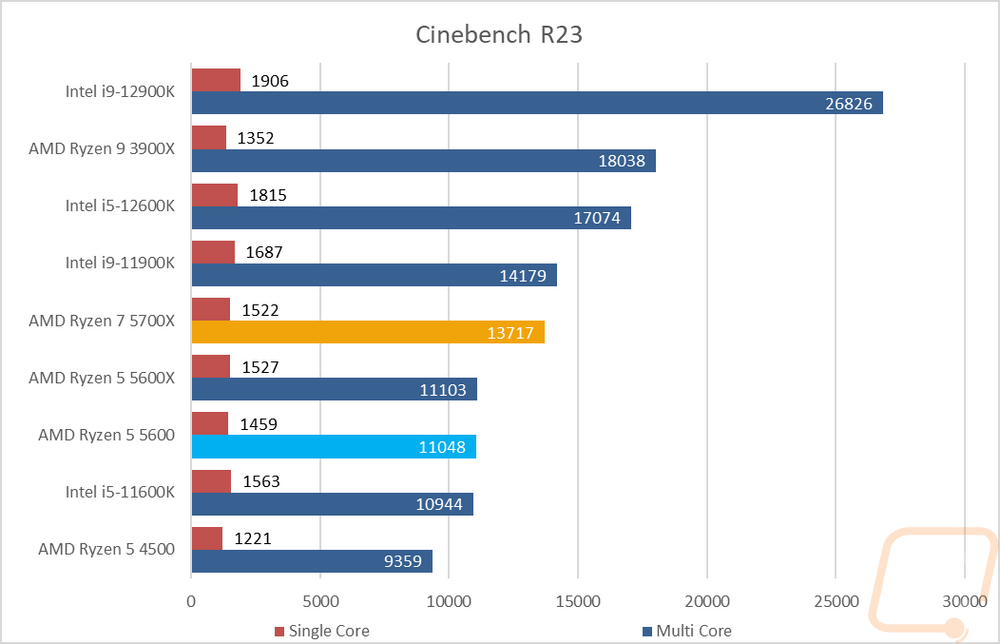
For the always popular Cinebench, I ran the three most recent versions. These are once again rendering and the latest R23 test is the most relevant for current applications but I love being able to see how everything compares in some of the older tests as well. In R15 the 5700X came in behind the 11900K for the multi-core test and the 5600 is behind the 5600X but ahead of the 11600K. For the R15 single-core test, the 5600X jumps out ahead of both the 5700X and the 5600 due to their lower clock speeds. The 5600 is right with the 11600K here. In R20 for the multi-core test, there is a big gap between the 5700X and the 11900K with it running closer to the older 9900K. The core count difference between the 5600X and the 5700X makes a big difference here and the gap between the 5600X and the 5600X is small with the 11600K sitting right between them. For the R20 single-core test, all three are bunched back up together again. The 5600X is once again out ahead with the 5700X just behind it. Then there is a small gap then the 5600 which is out ahead of the 10900K by a good margin. Then finally with the newer R23 test, the 5700X is way out ahead of the 6 core CPUs in the multi-core test and 500 points behind the 11900K. The 5600X and 5600 are almost the same in that test. Then for the single-core test, the 5600X is fastest, then the 5700X, and then the 5600.
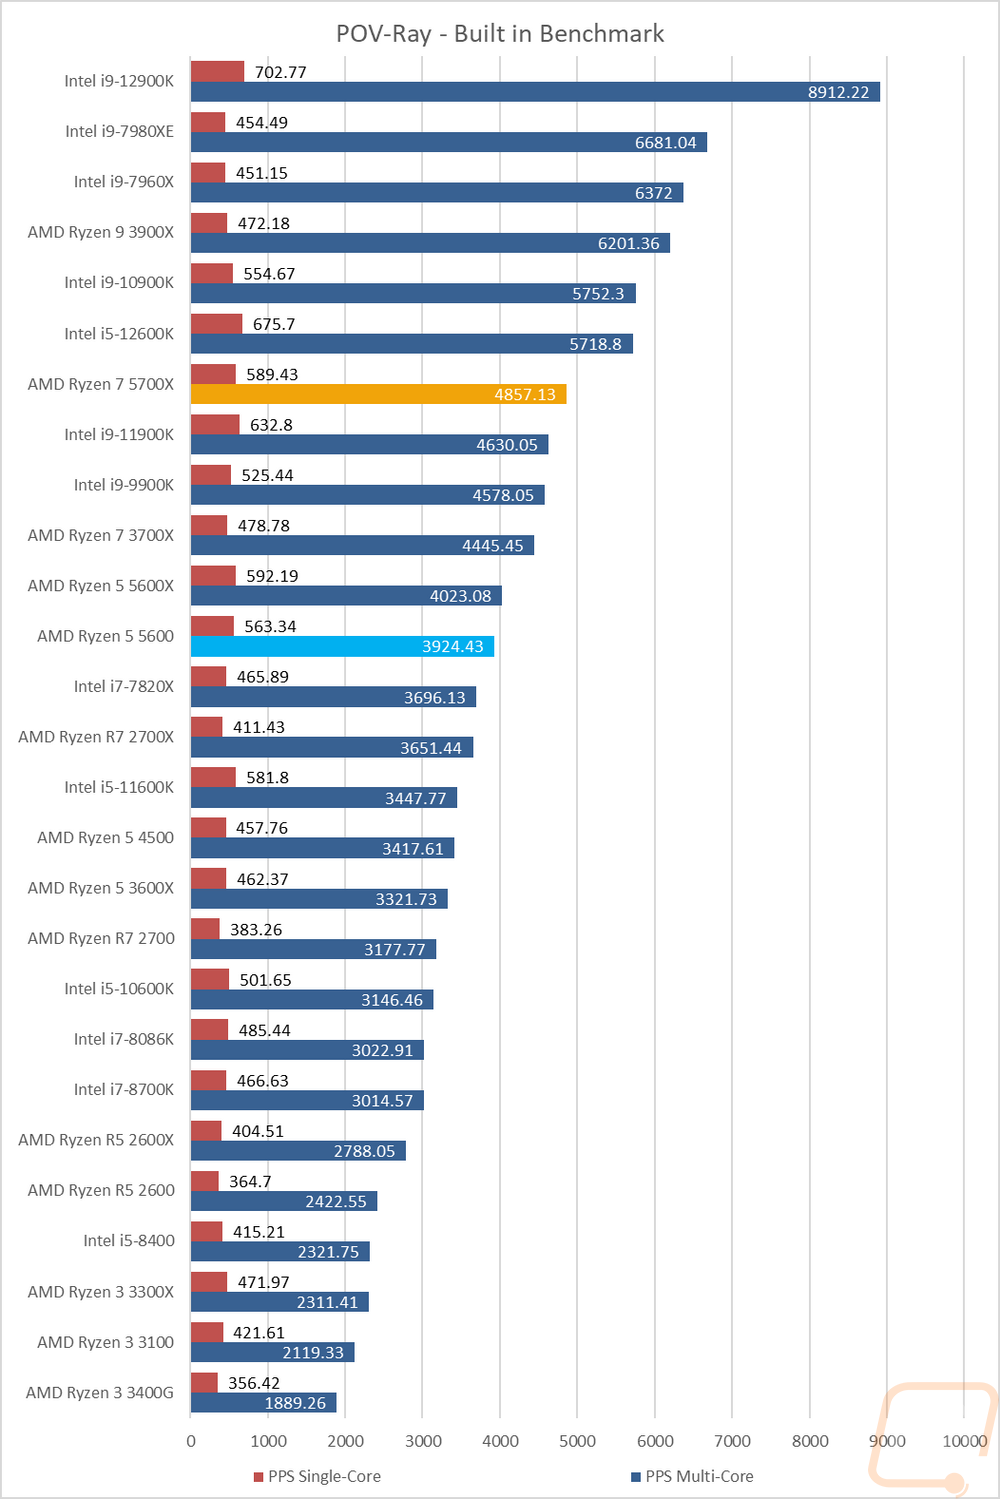
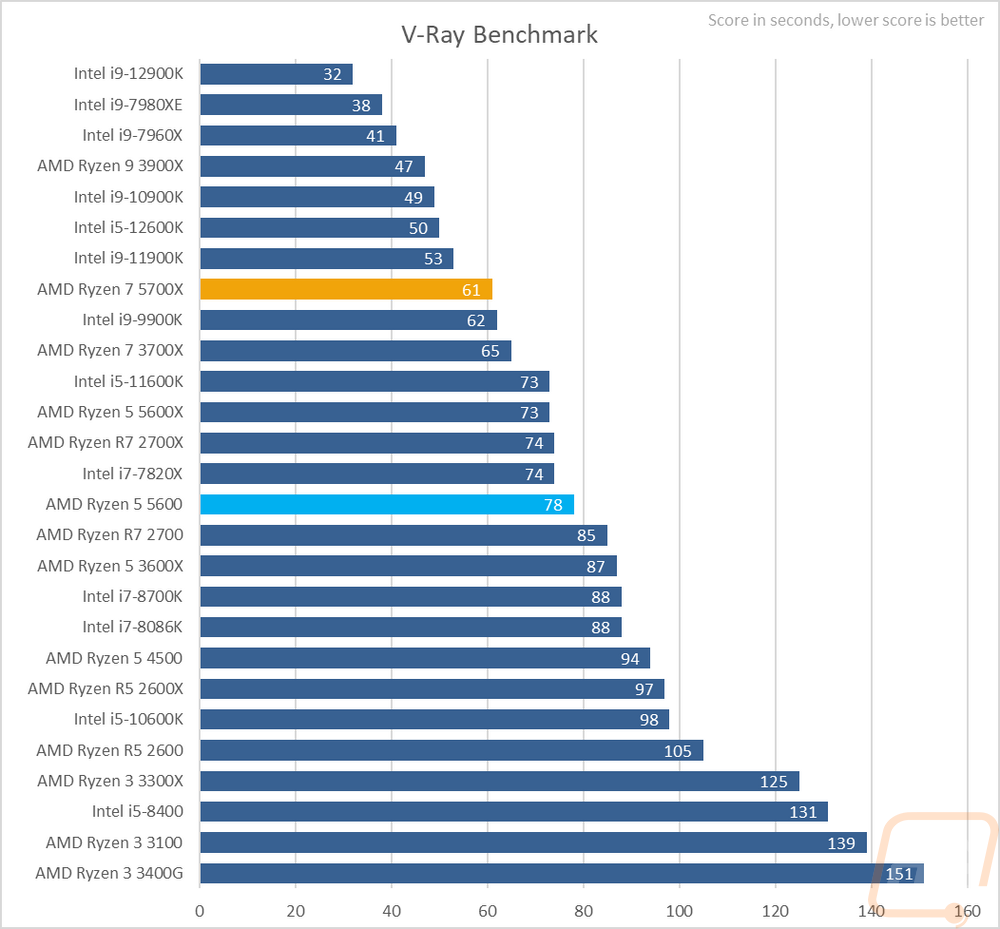
Next up we have ray tracing focused rendering benchmarks. Here I tested the CPUs in POV-Ray and V-Ray. POV-Ray was also tested with a single core and across all of the cores. The 5700X jumps out past the 5600X and 5600 in the multi-core test here with the 5600X and 5600 close together. The newer 12900K is the next highest beyond the 5700X and there is a big gap there. For the single-core test, the 5600X once again jumps back out ahead of the 5700X. In V-Ray, this is a timed test so the lower the score the better it is. The 5700X took 61 seconds, the 5600X 73, and the 5600 78. This test likes the older high core count CPUs with a big performance gap between those (including the 12900K) and the 5700X, taking almost half the time.
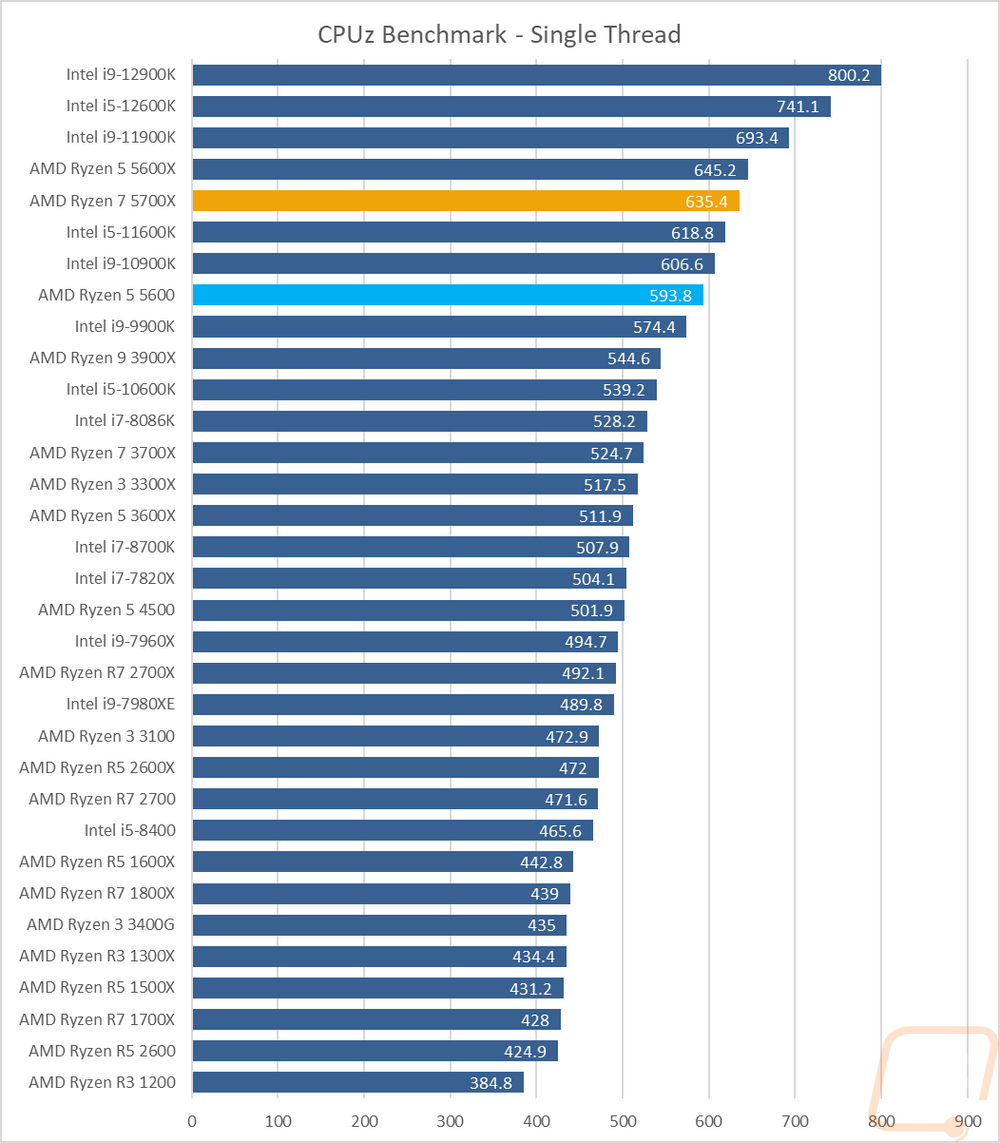
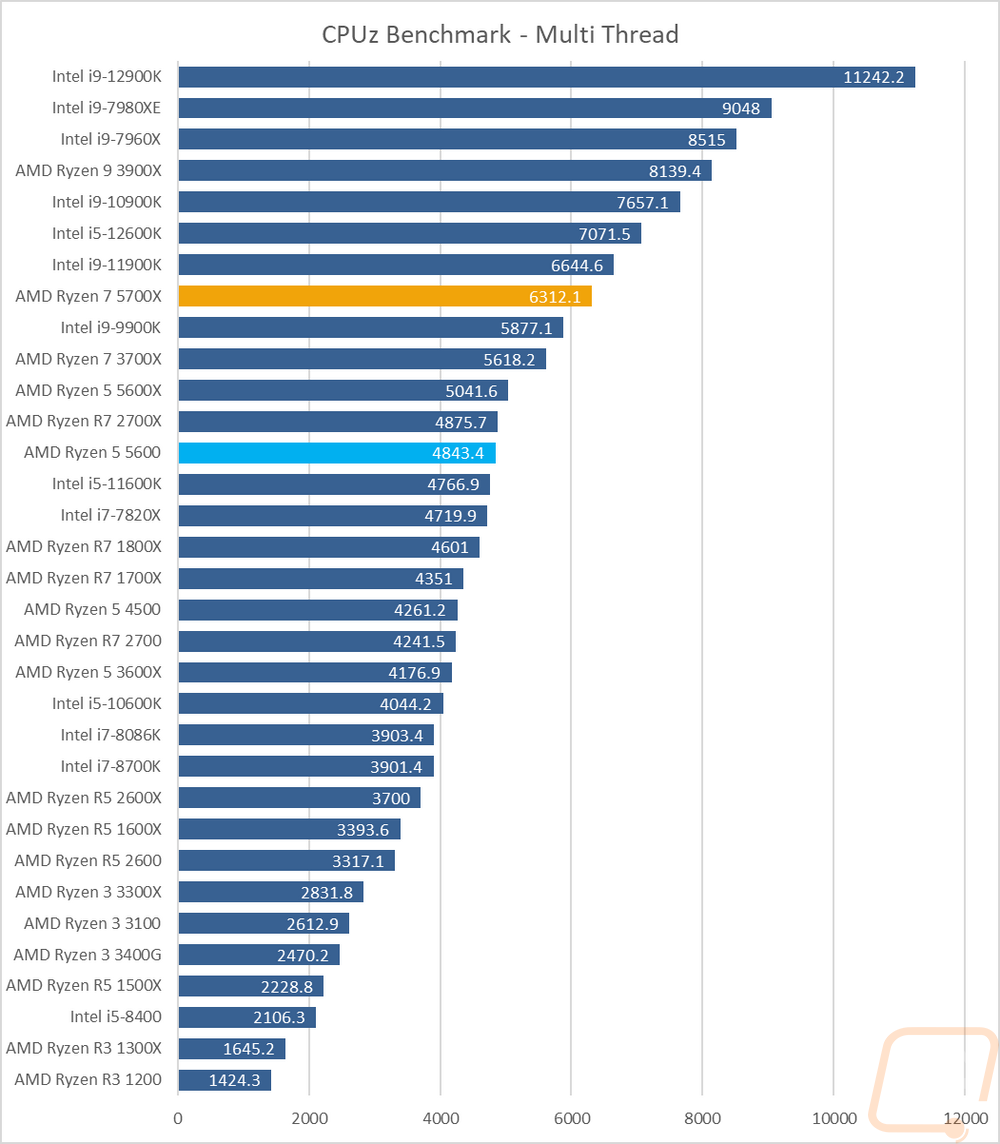
I also tested using the CPUz’s built-in benchmark which does run on a single thread and with all threads. For the single thread test, the 5600X is out ahead of the 5700X with Intel’s 11900K and both 12th gen CPUs out ahead of that. The 5600 is then below the 5700X as well as the 11600K and the 10900K. The multi-thread test has most of those higher core count Intel CPUs moving up the chart slightly with the 5700X behind the 11900K. The 6 core 5600X has a big gap between it and the 5700X here and it is 200 points ahead of the 5600 which is just ahead of the 11600K.
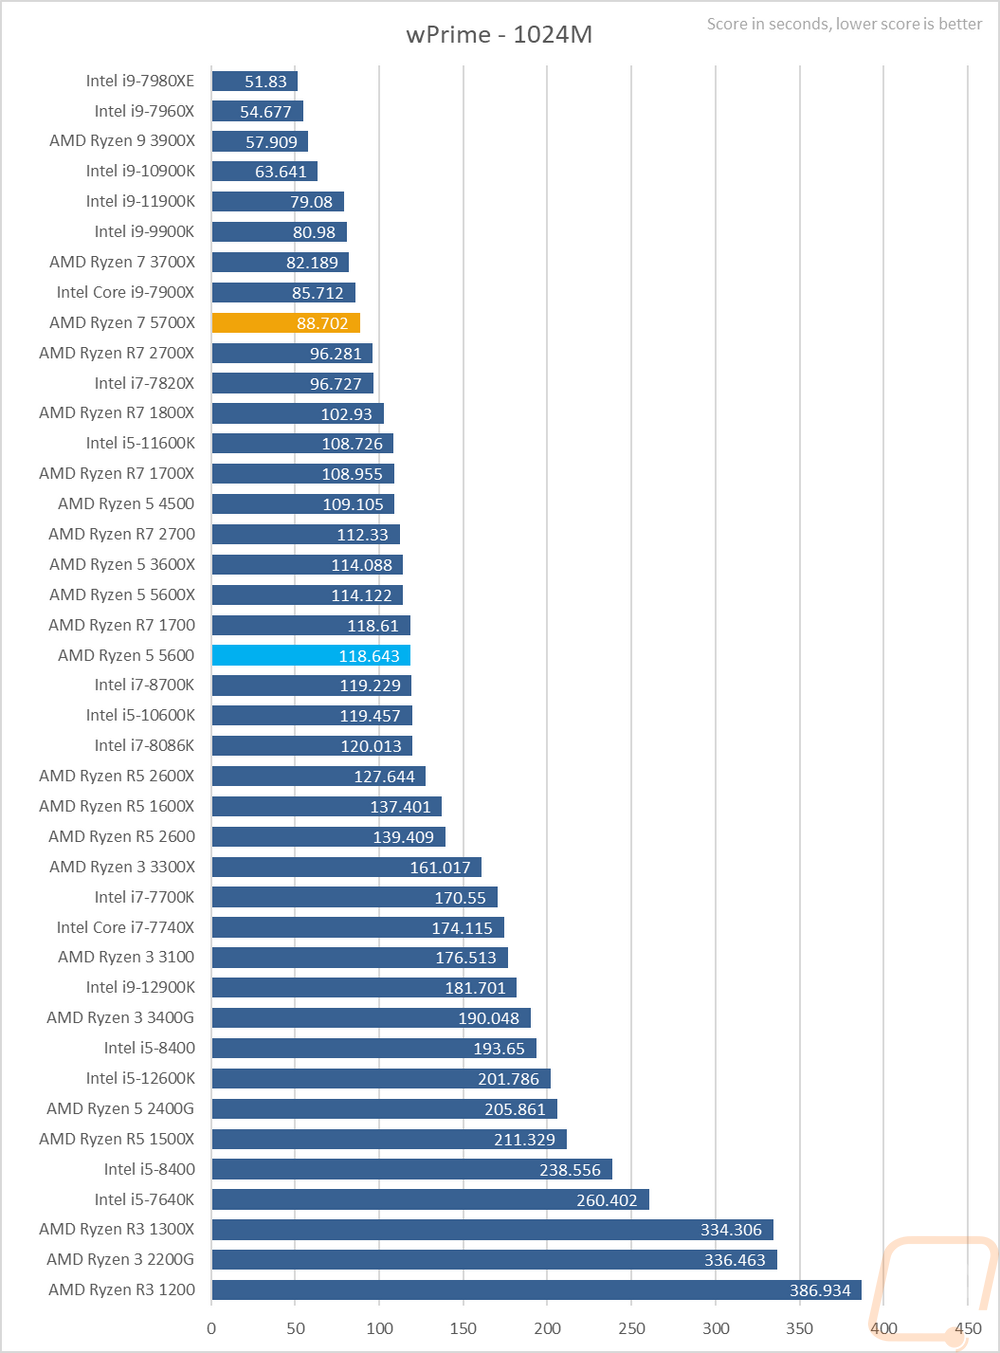
Next, we have wPrime which is a classic overclocking benchmark that calculates pi out to 1024 million digits and is timed. This is a multi-thread heavy test which has the 5700X up in the top ¼ of the chart where the 6 core 5600 is down at the halfway point. The higher clock speed of the 5600X helped it a little over the 5600 but they aren’t too far apart.
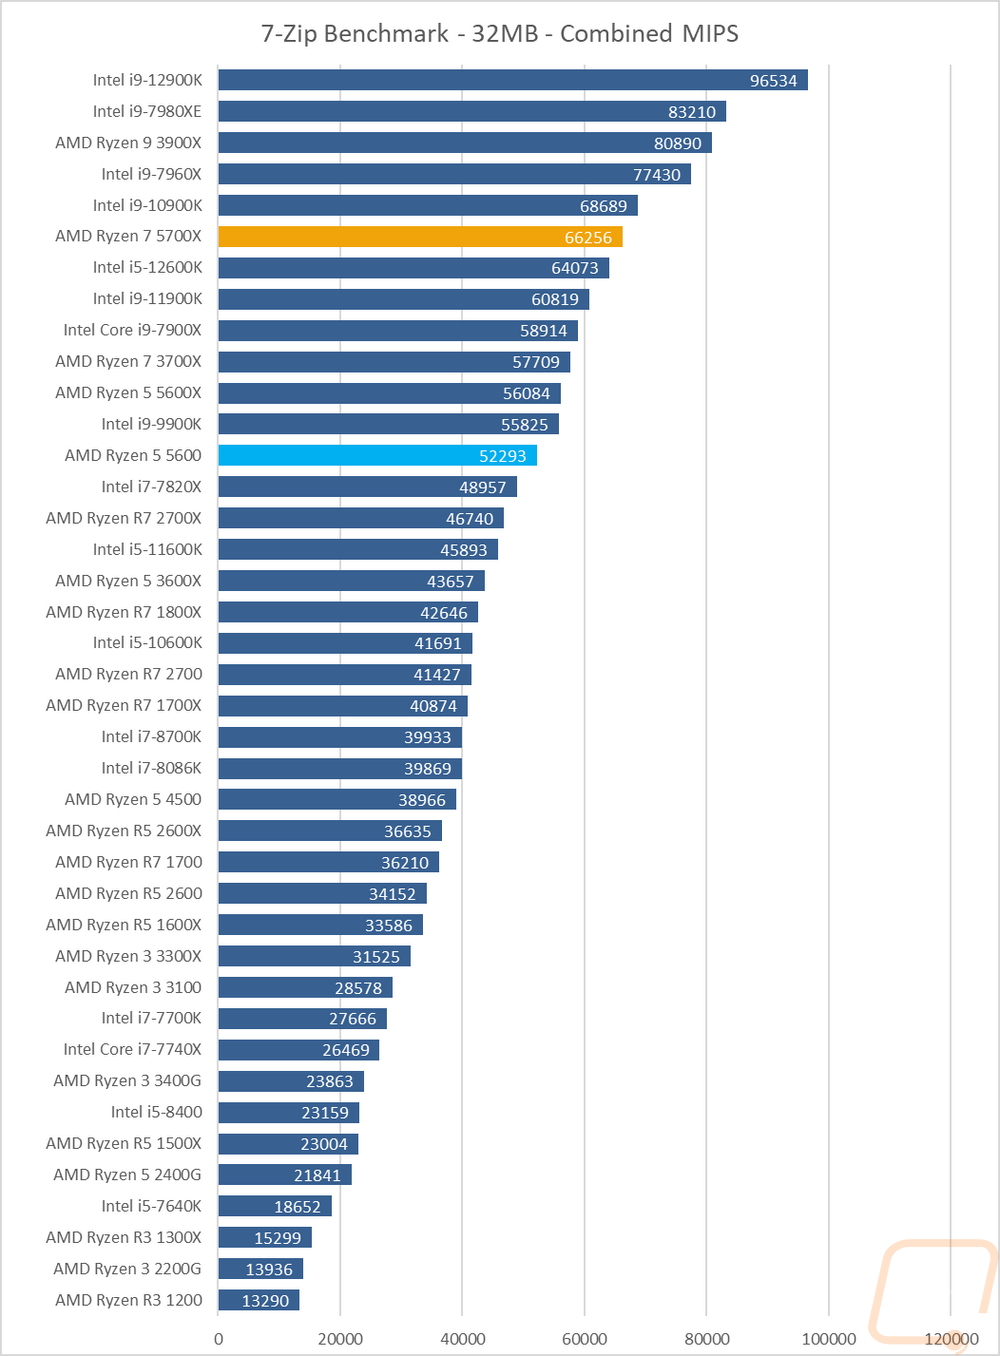
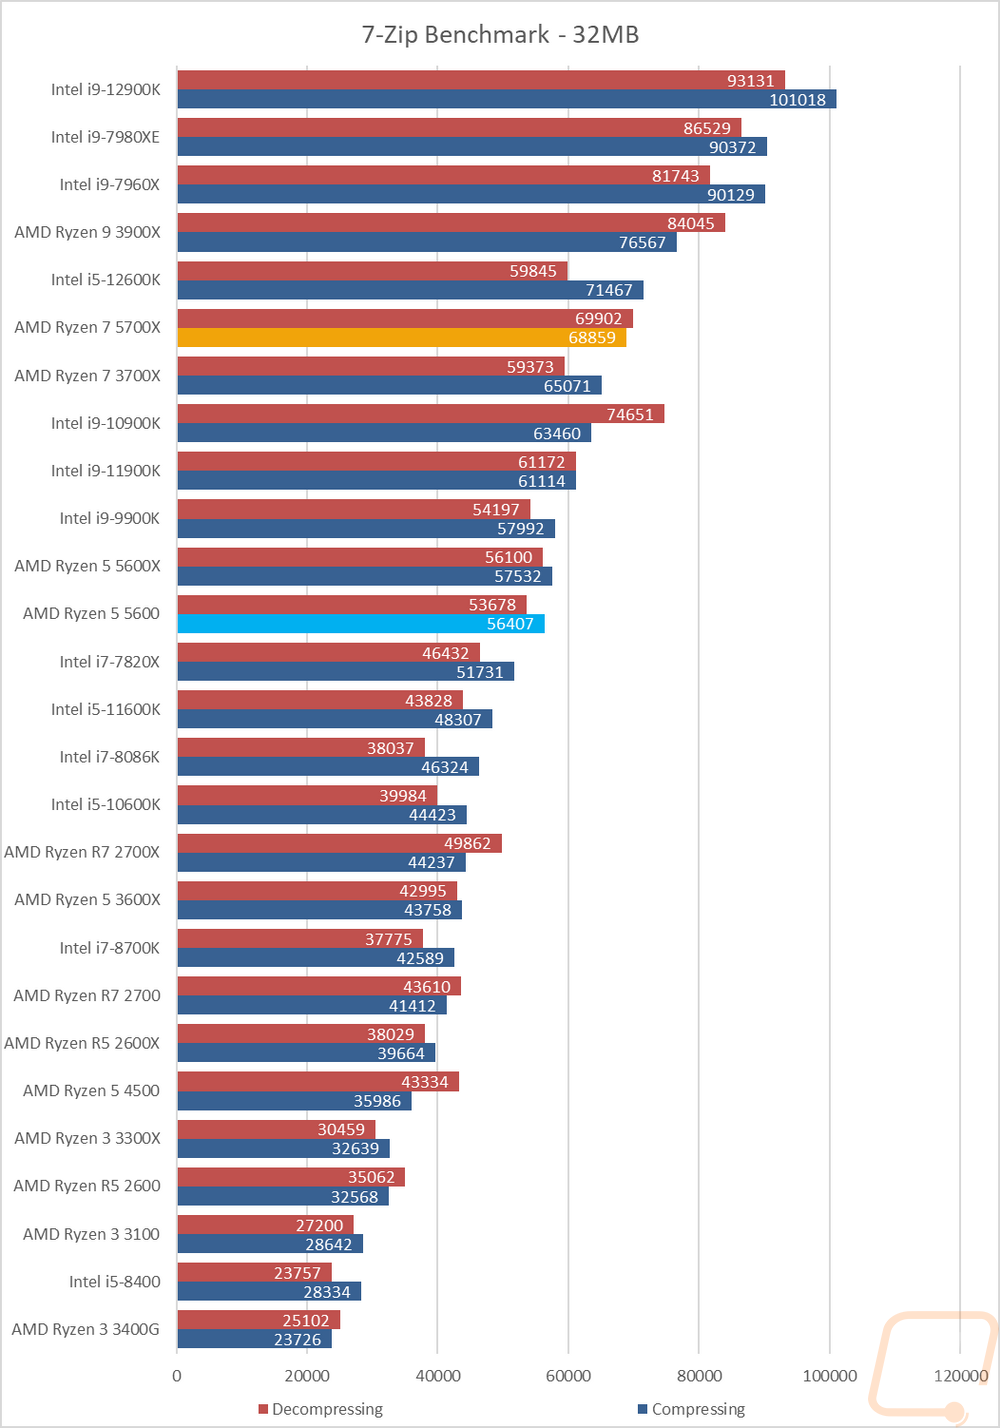
7 Zip is another open-source program, this time for compressing and decompressing all of your files. Here I have run the benchmark and we have three results. The combined MIPS is a combination of compressing and decompressing performance. Then I have it broken down between the two. This workload likes extra cores which can be seen with the CPUs that are up at the top being some of the older high core count CPUs that I have tested in the past. The 5700X didn’t do too bad though with it running behind the 10900K and ahead of the 11900K and 12600K in the combined MIPS test. The 5600 was down farther running behind the 9900K and the 5600X was just ahead of the 9900K. In the compressing and decompressing benchmarks the results were similar, but the 9900K came in ahead of the 5600X and 5600 here.
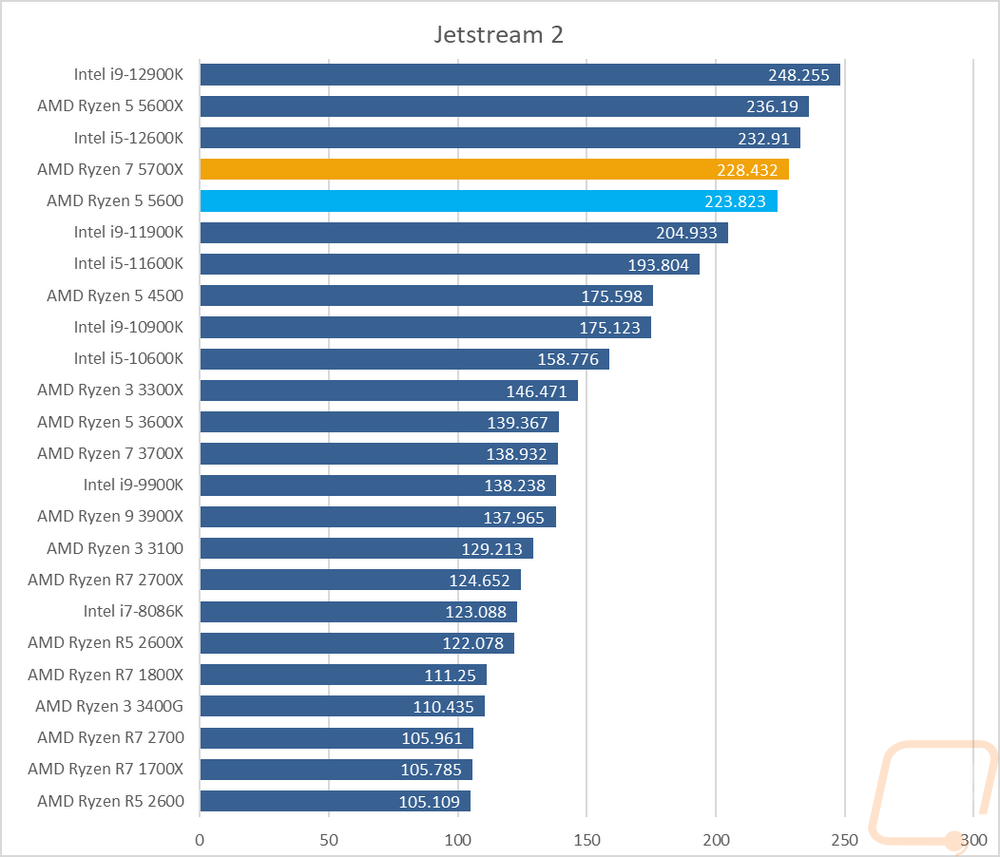
Jetstream 2 is a compilation benchmark that takes a long list of HTML5 and Java in-browser tests and runs them all three times and puts together an overall score. I love this benchmark because lets be honest, most people are using their browser more than any other game or program. Jetstream gives some interesting results sometimes though but it tends to prefer high IPC or single-core performance and there are some situations where it prefers lower core count CPUs. This is why the 5600X does so well here with just the new 12900K out in front of it. The 5700X and the 5600 still did well though with just the 12600K out in front of them.
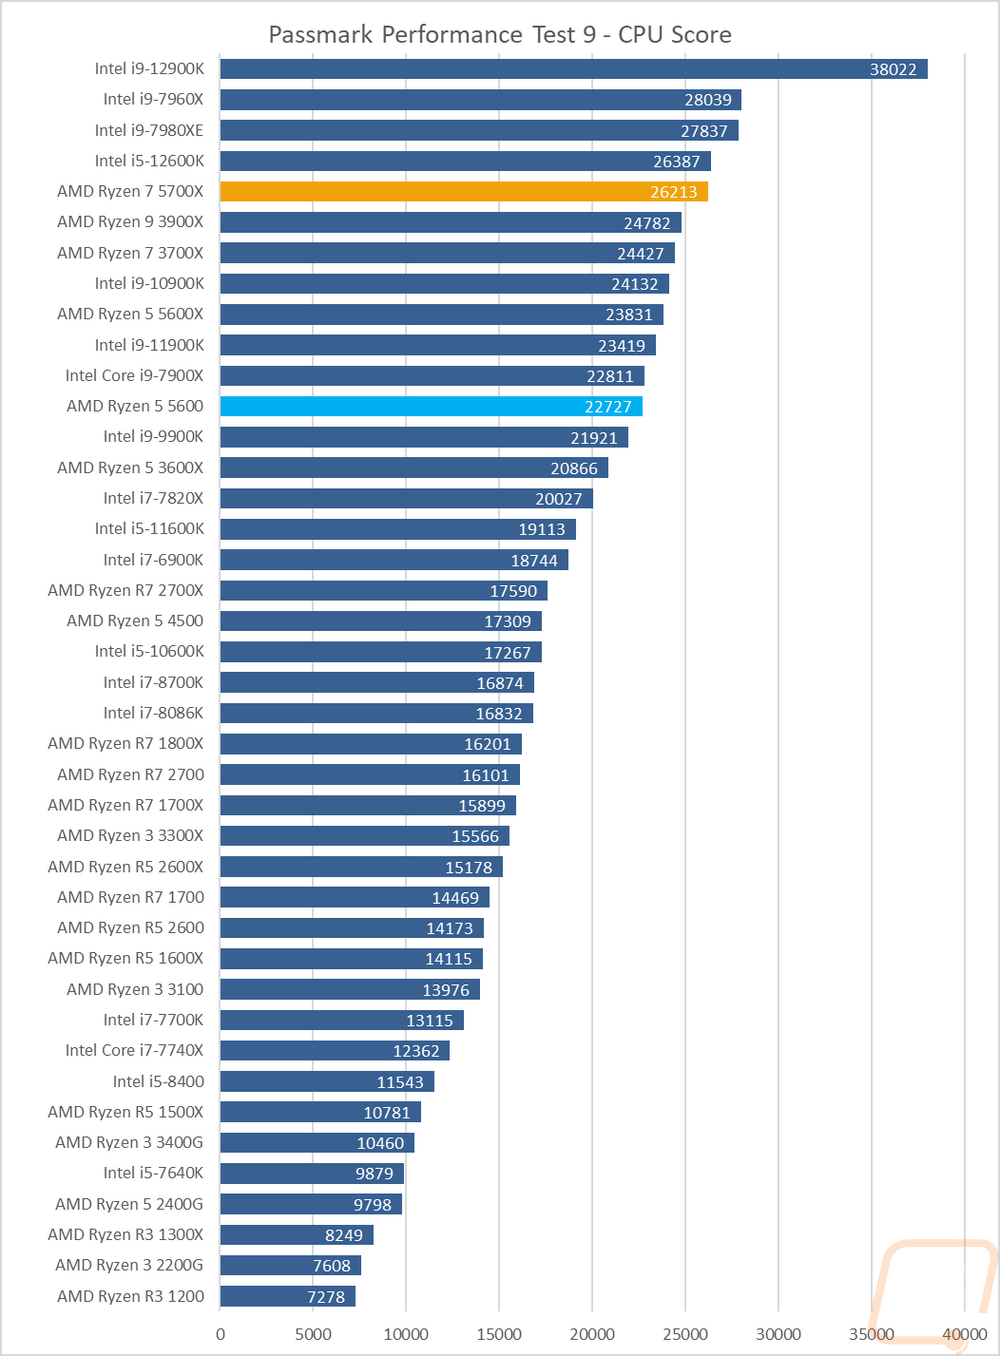
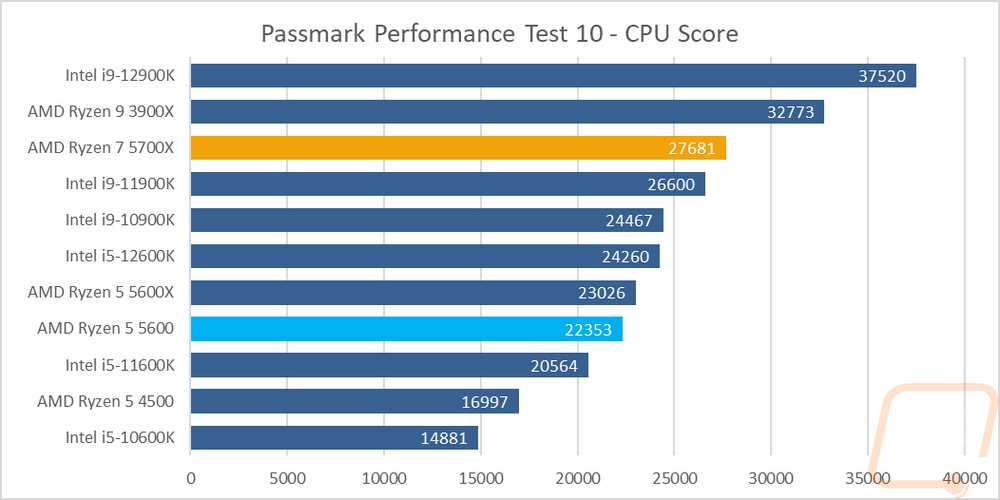
For Passmark Performance Test I took a look at both the older version 9 and the newer version 10. On both, I only look at the overall CPU score which takes a few different synthetic benchmarks and combines the results to put together an overall score. In version 9 we have more of the older CPUs in our results and the 5700X with its 8 cores outperformed the older 12 core 3900X which is impressive. The 5600X has a decent lead on the 5600 here with the 11900K behind it and the 5600 running ahead of the 9900K. In Passmark Performance Test 10 the 3900X jumped out ahead of the 5700X again but the 5700X does outperform the 11900K and the 10900K. The 5600X is ahead of the 5600 but they are still relatively close together.
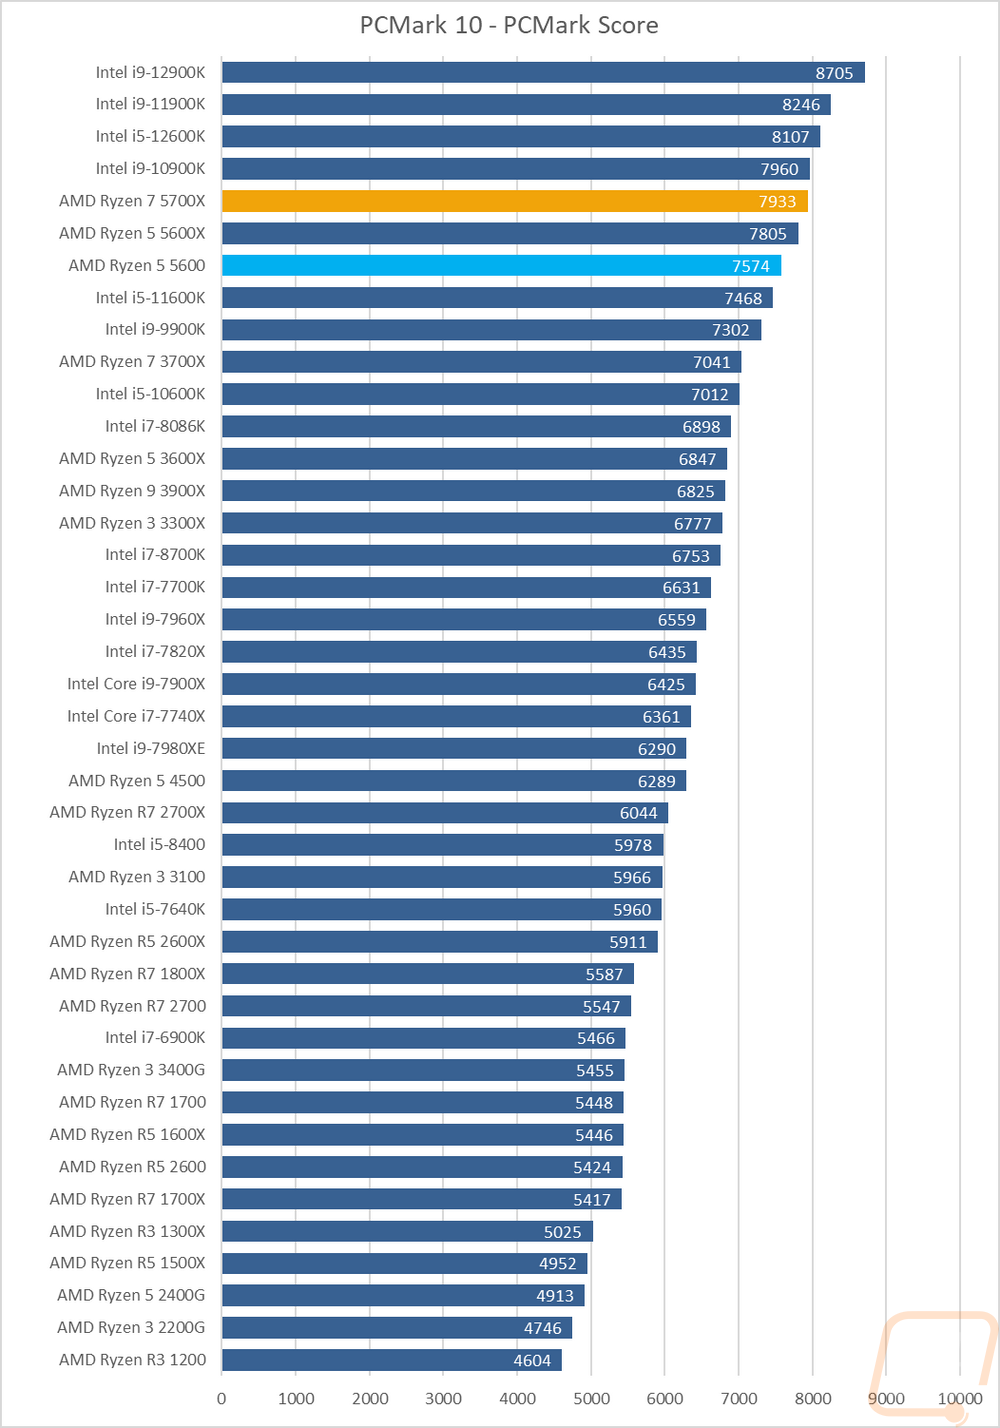
PCMark 10 is a great test because it tests things like video calls, browser performance, excel, and word performance to give an idea of real-world performance. It tends to like higher clock speeds which you can see all of the 5 GHz CPUs up at the top. The 5700X sits behind all of Intels 5GHz CPUs with it, the 5600X and the 5600 being the next three CPUs.
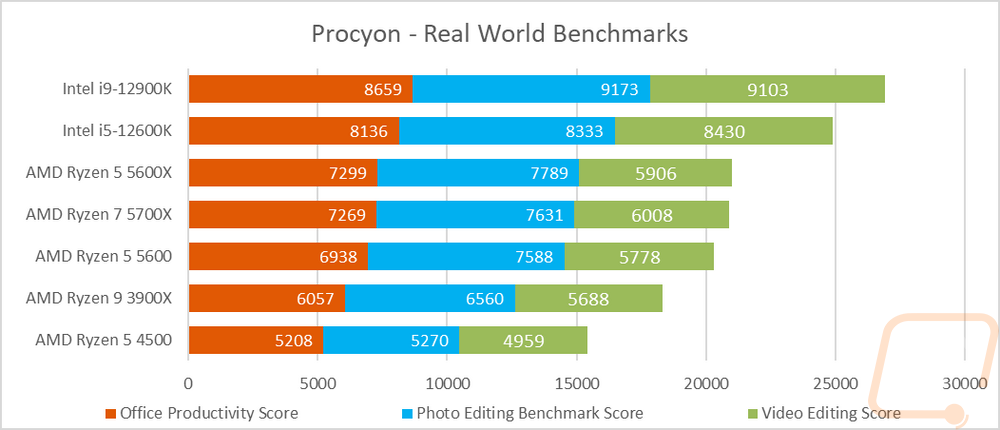
We recently added even more real-world testing with the UL Procyon Benchmarks which are as real-world as they can get using the actual programs that you would use in each test. There are three overall benchmarks, first is the Office Productivity Benchmark which uses Microsoft Office 365 to test actual performance in word, excel, PowerPoint, and outlook. The second benchmark is the Photo Editing Benchmark which is run using the latest version of Photoshop as well as Lightroom Classic to look at photo editing performance. Then the last test is the Video Editing Benchmark which uses the latest version of Adobe Premiere Pro to test video editing performance. I have all three scores stacked together to get an overall look at the performance. Both of Intel’s new 12th Gen CPUs are at the top here but in an interesting turn the higher clock speed of the Ryzen 5600X put it out ahead of the 5700X and the 5600 with it just barely edging out the 5700X even with two fewer cores which goes to show you that sometimes even in situations that you would think that more cores might help that clock speed can sometimes still be king. With the 12 core 3900X gapped by the 5600, this just shows that even more.
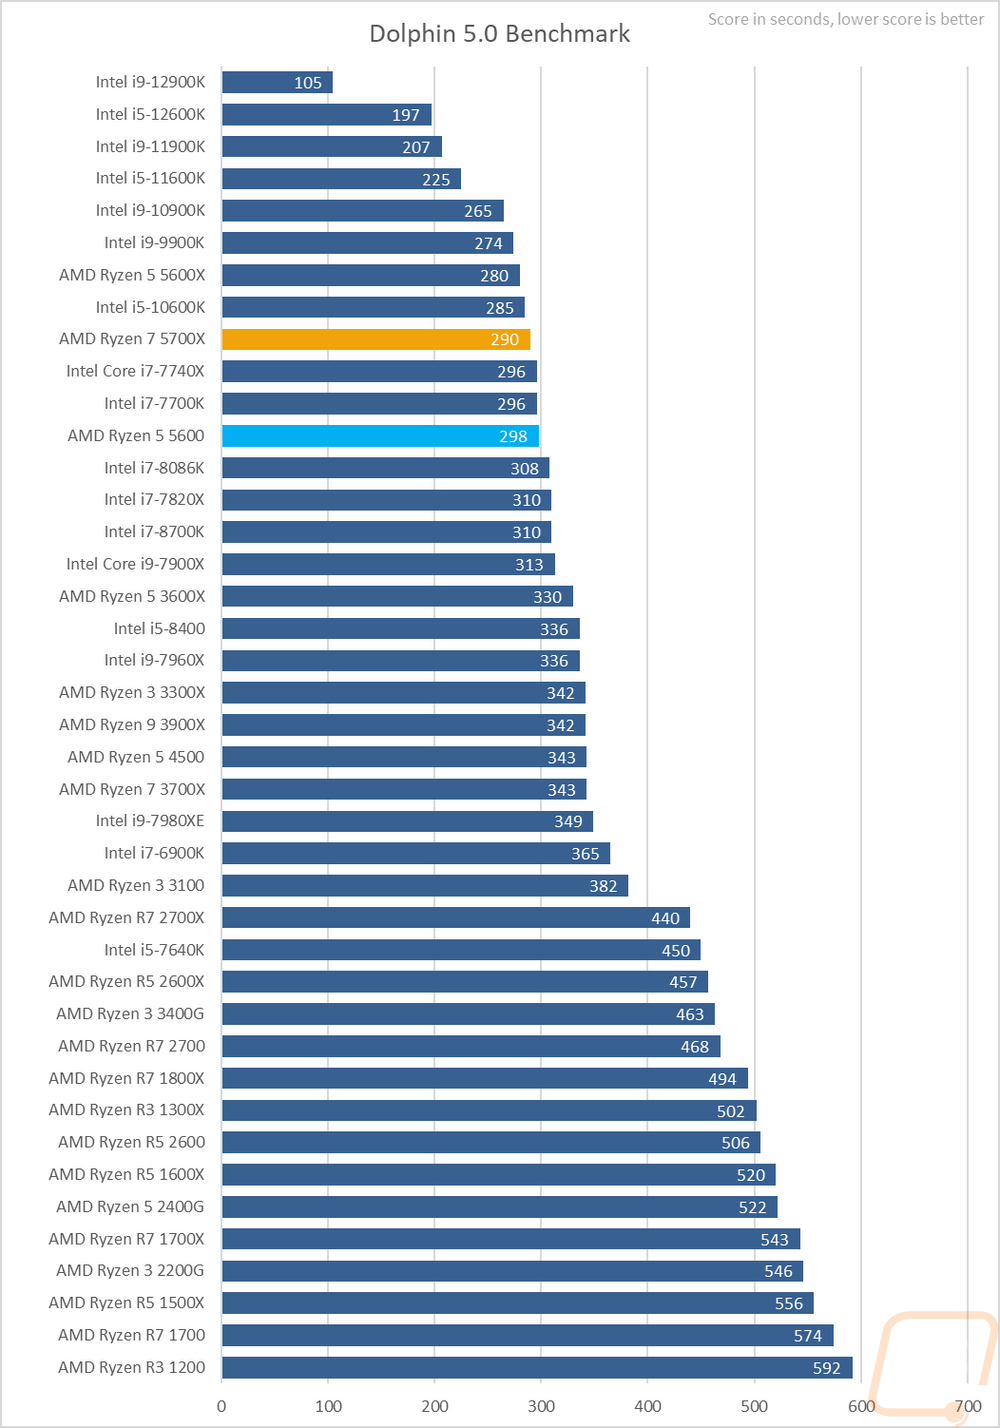
Moving the focus over towards gaming my next test is using Dolphin 5.0 Benchmark. Dolphin 5.0 is a Wii emulator and like most emulators, it doesn’t care about high core counts at all. In fact, it only runs two in total. Clock speeds are king here, in addition to Dolphin favoring Intel in general. AMD has improved a lot here with the Zen 3 CPUs which can be seen with the 5600X running high up with the 5GHz Intel CPUs. The 5700X took 10 seconds longer to complete the same benchmark and the 5600 was 18 seconds behind the 5600X.
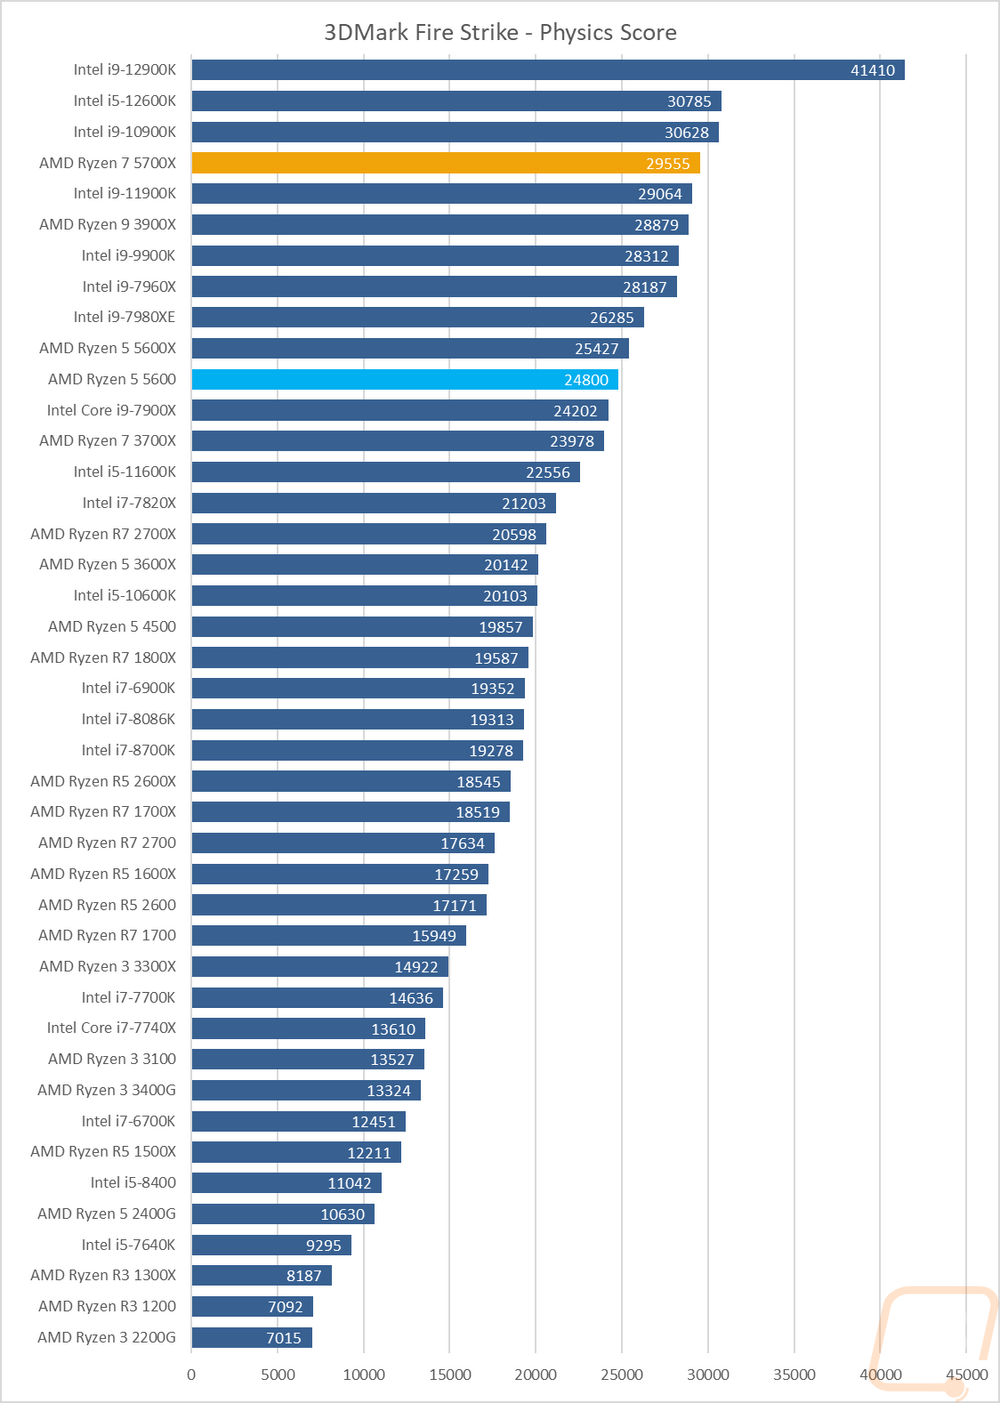
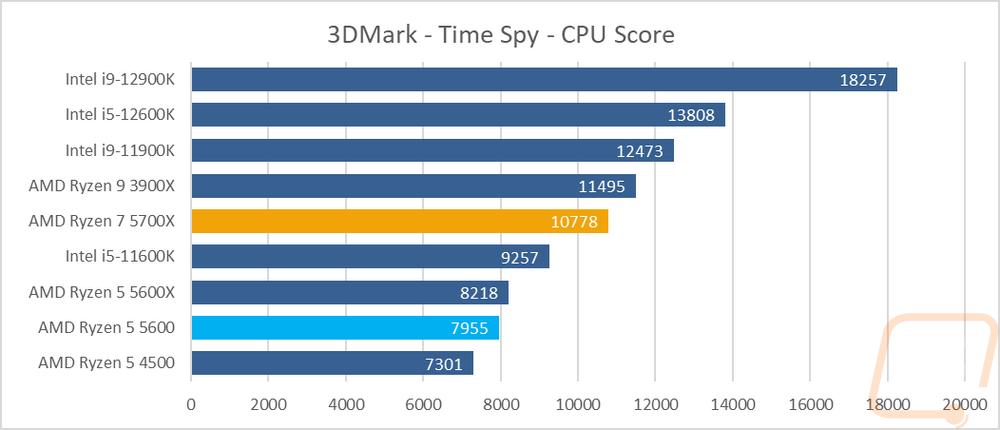
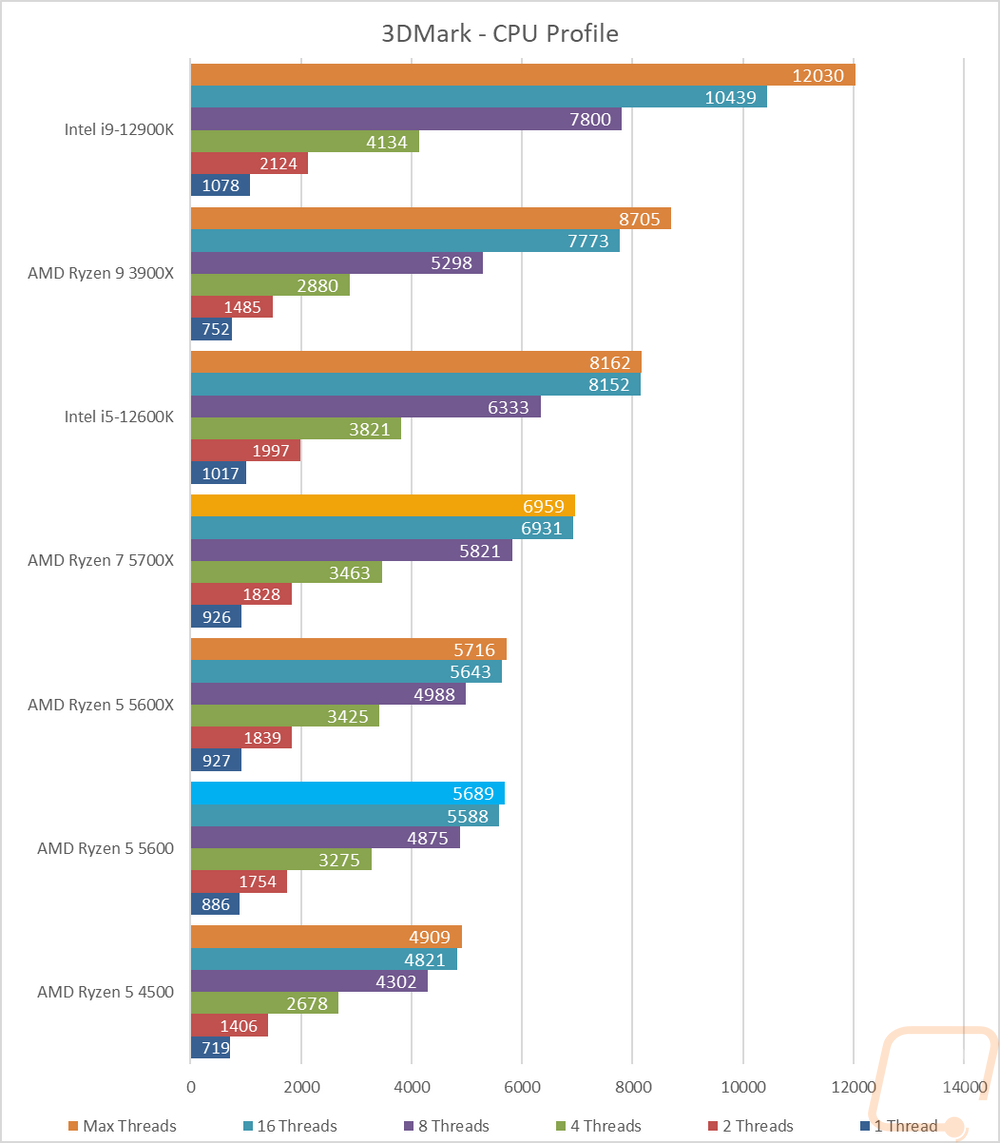
 Before diving into game testing I wanted to check out synthetic performance using 3DMark. I tested with the older DX11 Fire Strike test as well as the newer DX12 Time Spy. I also added the new 3DMark CPU Profile benchmark into the mix as well that does a good job of showing the full range of thread counts that you might see being used in games as well as a max threads option that does everything above 16 threads. In the Fire Strike test, the 5700X came in behind the 10900K and the two 12th Gen Intel CPUs, edging out the 11900K slightly. The 5600 was behind the 5600X by 598 points sitting in the middle of some of the older Core-X CPUs. For the Time Spy test, the 5700X came in behind the older 12 core 3900X but was way ahead of the 11600K. The 560 on the other hand sits between the 5600X and the Zen 2 4500. In the last test, the CPU profile test you can see a clear line in the 8, 16, and max thread tests where the 5600 and 5600X fall off. Both of those CPUs were close together in all of the tests and the 5700X was in line with them for the 1, 2, and 4 thread tests but its extra cores helped it pull ahead after that.
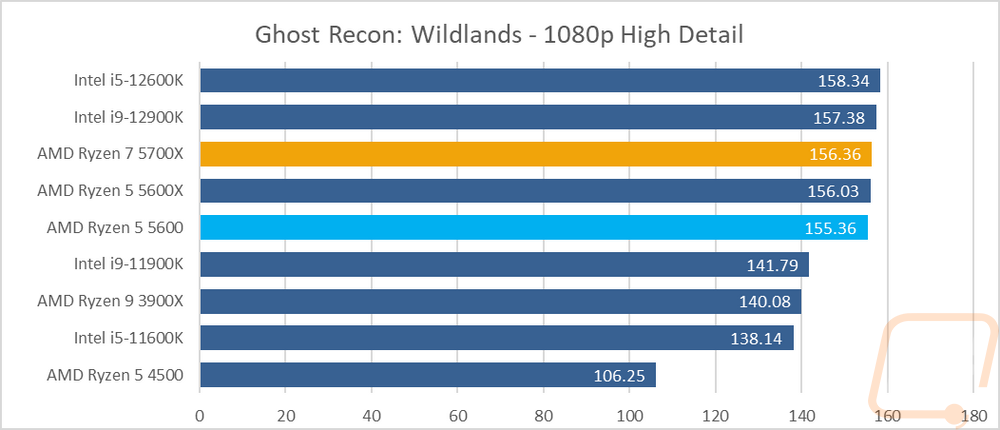
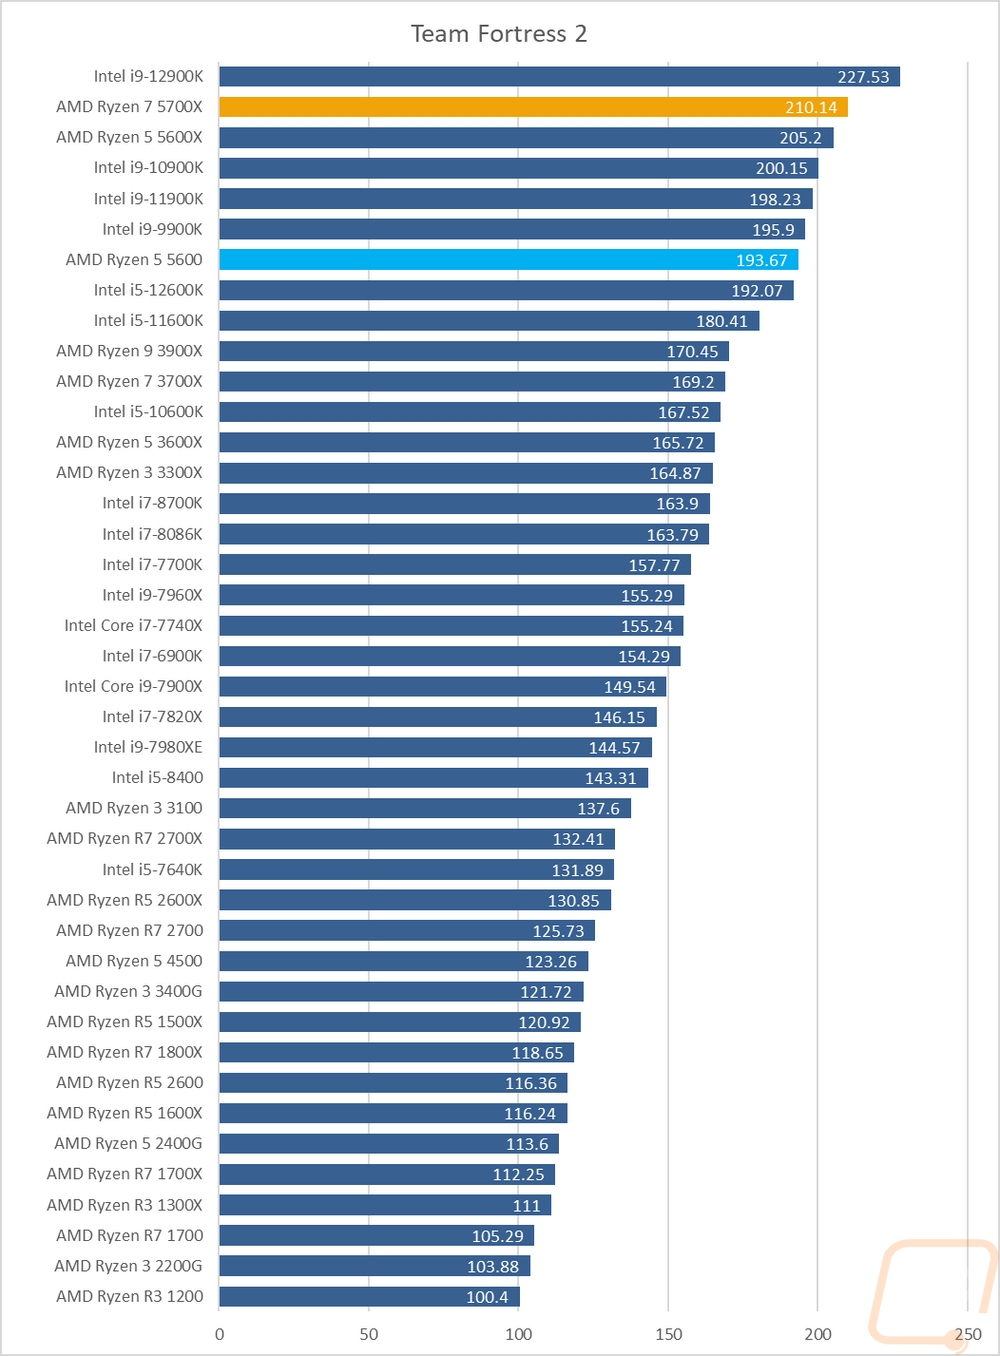
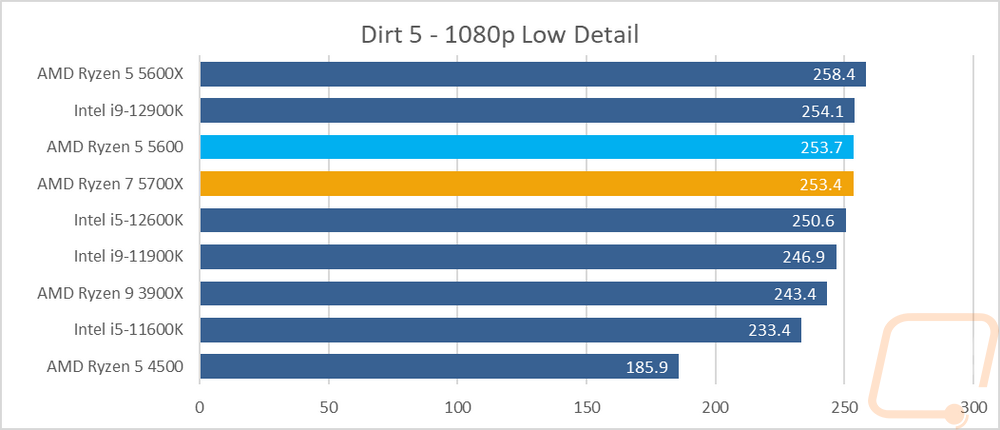
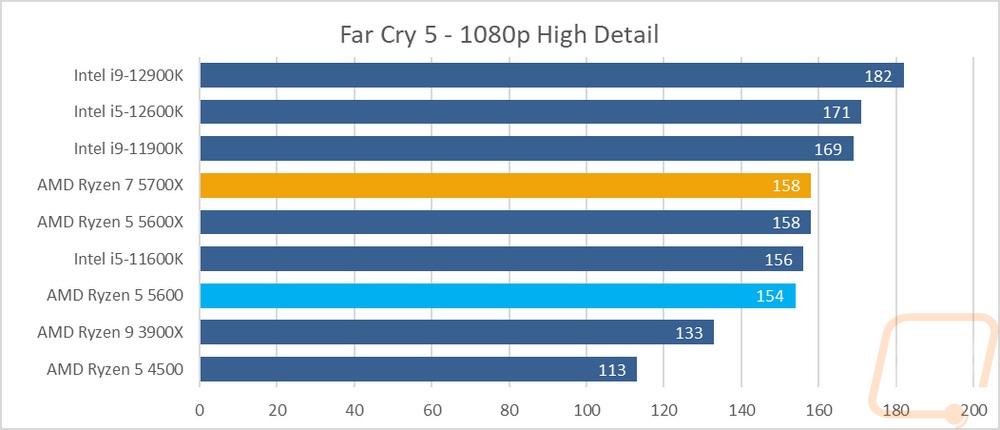
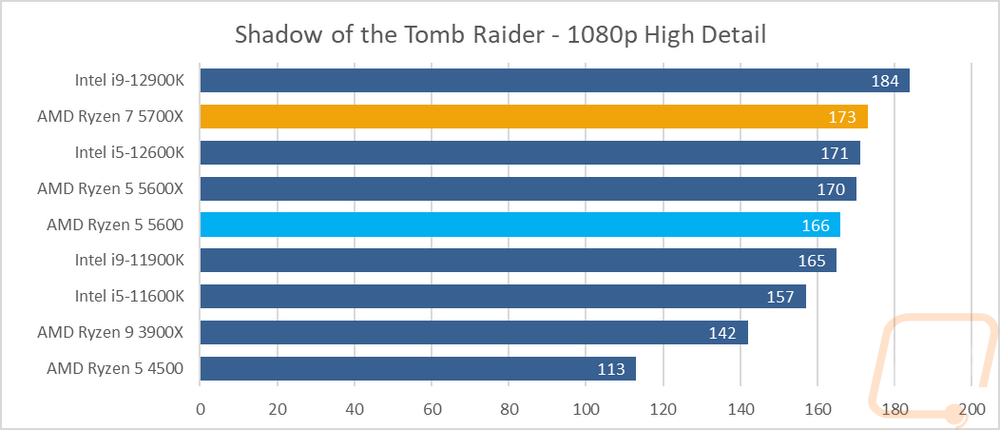
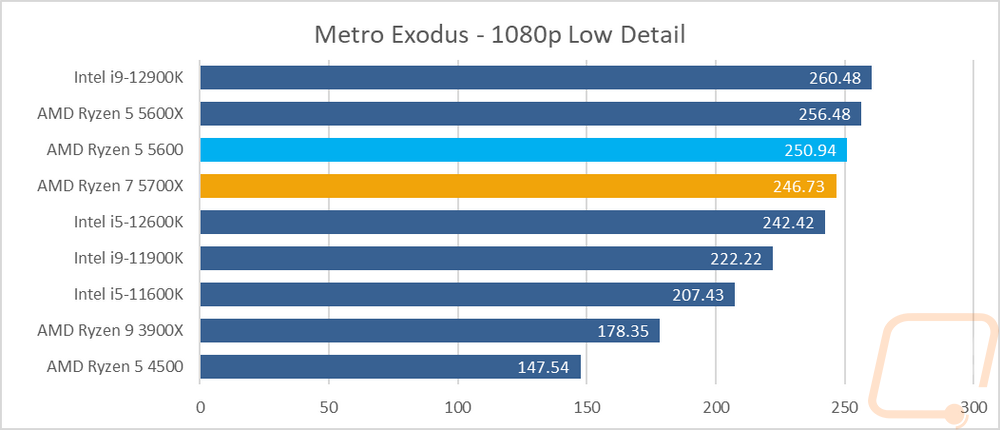
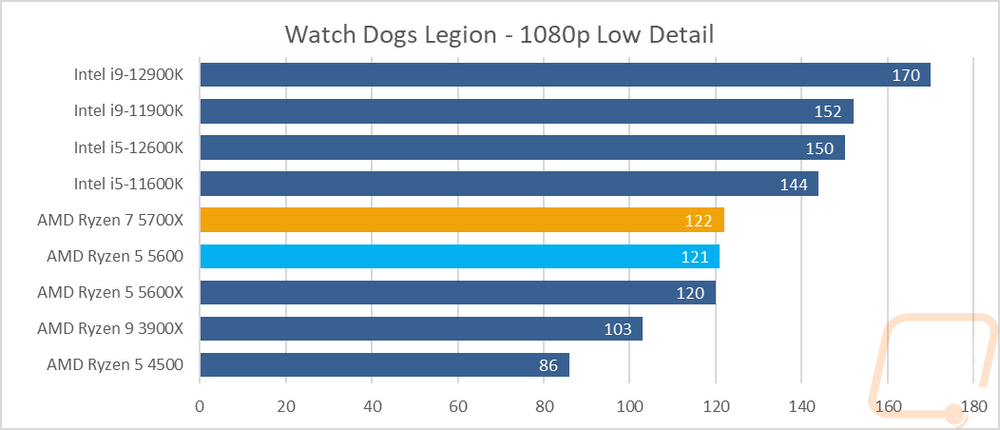
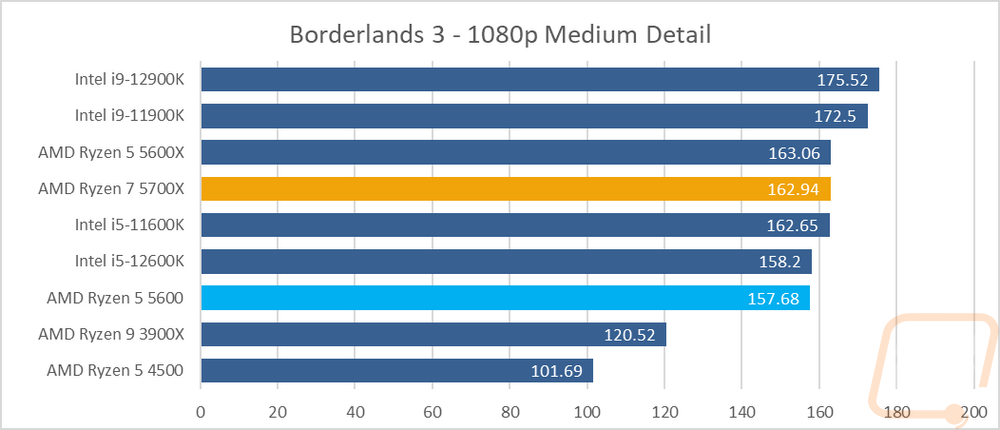
For in-game performance testing, I ran them through a variety of new and old games. TF2 for example is a very old game at this point but is also extremely CPU dependent which makes it a good option to check out for older source-based games. Game results for both the 5700X and the 5600 show a noticeable difference when compared with the older Zen 1 and Zen 2 CPUs, which is the same as what I saw in my original 5600X review. Where things get interesting however is how the relation between core count and clock speeds mix. The 5700X stays ahead in some tests due to its extra cores but in games like Dirt 5, Metro Exodus, and Borderlands 3 the 5600X come in ahead of the 5700X.
I did also run both CPUs through a few tests using AIDA64, specifically, I wanted to check out cache performance, memory performance, and how the CPUs handle single and double precision and different integers. The 5700X did well in the L1 cache tests with its additional cache over the 5600 and the 5600X. For the memory performance, the two Zen 3 CPUs did well but do show a noticeable difference between their read and write performance with the reads being significantly faster.
|
AIDA64 |
L1 Cache Read |
L1 Cache Write |
L1 Cache Latency |
L2 Cache Read |
L2 Cache Write |
L2 Cache Latency |
|
AMD Ryzen R7 2700X |
999.43 GB/s |
502.50 GB/s |
1.0 ns |
978.03 GB/s |
495.12 GB/s |
2.8 ns |
|
AMD Ryzen R5 2600X |
768.13 GB/s |
388.05 GB/s |
1.0 ns |
729.37 GB/s |
366.01 GB/s |
2.9 ns |
|
Ryzen 5 2400G |
485.01 GB/s |
238.29 GB/s |
1.0 ns |
459.80 GB/s |
232.20 GB/s |
3.1 ns |
|
Ryzen 3 2200G |
460.55 GB/s |
227.41 GB/s |
1.1 ns |
352.84 GB/s |
177.56 GB/s |
3.3 ns |
|
Intel i7-8700K |
1595.6 GB/s |
803.65 GB/s |
0.9 ns |
640.37 GB/s |
397.14 GB/s |
2.6 ns |
|
Intel i5-8400 |
1417.2 GB/s |
710.79 GB/s |
1.0 ns |
543.81 GB/s |
352.90 GB/s |
3.1 ns |
|
Intel Core i9-7980XE |
3758.3 GB/s |
1896.7 GB/s |
1.1 ns |
1671.7 GB/s |
1069.9 GB/s |
5.6 ns |
|
Intel Core i9-7960X |
3532.3 GB/s |
1785.2 GB/s |
1.0 ns |
1571.6 GB/s |
1003.5 GB/s |
5.1 ns |
|
Intel Core i7-7820X |
1969.9 GB/s |
995.02 GB/s |
1.0 ns |
884.63 GB/s |
574.74 GB/s |
5.6 ns |
|
Intel Core i5-7640X |
1044.8 GB/s |
31888 GB/s |
1.0 ns |
397.26 GB/s |
247.00 GB/s |
2.9 ns |
|
Intel Core i9-7900X |
2418.5 GB/s |
709.16 GB/s |
1.0 ns |
1037.3 GB/s |
521.94 GB/s |
5.2 ns |
|
Intel Core i7-7740X |
1102.7 GB/s |
561.25 GB/s |
0.9 ns |
424.55 GB/s |
304.30 GB/s |
2.7 ns |
|
Intel i7-6900K |
1963.9 GB/s |
999.59 GB/s |
1.0 ns |
710.28 GB/s |
310.34 GB/s |
4.1 ns |
|
Intel i7-7700K |
1114.6 GB/s |
560.82 GB/s |
0.9 ns |
415.45 GB/s |
285.97 GB/s |
2.7 ns |
|
Intel i7-5960X |
1748.5 GB/s |
874.60 GB/s |
1.2 ns |
623.08 GB/s |
272.77 GB/s |
3.5 ns |
|
AMD Ryzen R7 1800X |
917.46 GB/s |
460.16 GB/s |
1.1 ns |
831.95 GB/s |
446.37 GB/s |
4.7 ns |
|
AMD Ryzen R7 1700X |
867.89 GB/s |
435.33 GB/s |
1.2 ns |
809.29 GB/s |
419.38 GB/s |
5.0 ns |
|
AMD Ryzen R7 1700 |
793.90 GB/s |
398.12 GB/s |
1.3 ns |
742.92 GB/s |
389.73 GB/s |
5.4 ns |
|
AMD Ryzen R5 1600X |
689.47 GB/s |
345.95 GB/s |
1.1 ns |
630.99 GB/s |
334.93 GB/s |
4.7 ns |
|
AMD Ryzen R5 1500X |
446.84 GB/s |
224.01 GB/s |
1.1 ns |
306.82 GB/s |
211.58 GB/s |
11.8 ns |
|
AMD Ryzen R5 2600 |
685.38 GB/s |
344.05 GB/s |
1 ns |
669.28 GB/s |
333.5 GB/s |
3.1 ns |
|
AMD Ryzen R7 2700X |
849.91 GB/s |
426.09 GB/s |
1 ns |
837.76 GB/s |
418.75 GB/s |
3.0 ns |
|
Intel i7-8086K |
1596.4 GB/s |
803.56 GB/s |
0.9 ns |
623.36 GB/s |
423.53 GB/s |
2.6 ns |
|
Intel i9-9900K |
2375.6 GB/s |
1195.4 GB/s |
0.8 ns |
907.65 GB/s |
626.34 GB/s |
2.4 ns |
|
AMD Ryzen 9 3900X |
3098.6 GB/s |
1551.4 GB/s |
0.9 ns |
1545.3 GB/s |
1416.8 GB/s |
2.8 ns |
|
AMD Ryzen 7 3700X |
2133.2 GB/s |
1072.9 GB/s |
0.9 ns |
1069.1 GB/s |
993.49 GB/s |
2.8 ns |
|
AMD Ryzen 5 3600X |
1547.4 GB/s |
779.24 GB/s |
1.0 ns |
777.62 GB/s |
745.30 GB/s |
2.8 ns |
|
AMD Ryzen 3 3400G |
508.97 GB/s |
253.87 GB/s |
1.0 ns |
490.26 GB/s |
247.04 GB/s |
3.0 ns |
|
AMD Ryzen 3 3300X |
1080.5 GB/s |
541.50 GB/s |
0.9 ns |
541.84 GB/s |
530.50 GB/s |
2.7 ns |
|
AMD Ryzen 3 3100 |
965.85 GB/s |
484.67 GB/s |
1.0 ns |
485.55 GB/s |
460.71 GB/s |
3.1 ns |
|
Intel i5-10600K |
1676.6 GB/s |
840.87 GB/s |
0.8 ns |
662.98 GB/s |
452.67 GB/s |
2.5 ns |
|
Intel i9-10900K |
3162.1 GB/s |
1586.7 GB/s |
0.8 ns |
1201.8 GB/s |
759.97 GB/s |
2.4 ns |
|
AMD Ryzen 5 5600X |
1721.4 GB/s |
869.69 GB/s |
0.9 ns |
851.89 GB/s |
831.97 GB/s |
2.6 ns |
|
Intel i9-11900K |
4542.8 GB/s |
2299.3 GB/s |
1.0 ns |
1413.2 GB/s |
691.62 GB/s |
2.5 ns |
|
Intel i5-11600K |
3412.3 GB/s |
1724.9 GB/s |
1.0 ns |
960.91 GB/s |
526.76 GB/s |
2.7 ns |
|
Intel i9-12900K |
2310.0 GB/s |
1438.7 GB/s |
1.0 ns |
1233.5 GB/s |
562.72 GB/s |
2.9 ns |
|
Intel i5-12600K |
1461.1 GB/s |
971.78 GB/s |
1.1 ns |
846.4 GB/s |
360.51 GB/s |
3.2 ns |
|
AMD Ryzen 5 4500 |
1561.9 GB/s |
784.1 GB/s |
1.0 ns |
785.34 GB/s |
751.61 GB/s |
2.9 ns |
|
AMD Ryzen 5 5600 |
1646.6 GB/s |
831.24 GB/s |
0.9 ns |
832.43 GB/s |
767.22 GB/s |
2.7 ns |
|
AMD Ryzen 7 5700X |
2267.8 GB/s |
1157.8 GB/s |
0.9 ns |
1147.6 GB/s |
1026.1 GB/s |
2.6 ns |
|
AIDA64 |
L3 Cache Read |
L3 Cache Write |
L3 Cache Latency |
Memory Read |
Memory Write |
Memory Latency |
|
AMD Ryzen R7 2700X |
414.95 GB/s |
417.71 GB/s |
8.8 ns |
50214 MB/s |
48578 MB/s |
65.0 ns |
|
AMD Ryzen R5 2600X |
429.09 GB/s |
323.83 GB/s |
9.1 ns |
50273 MB/s |
48346 MB/s |
65.5 ns |
|
Ryzen 5 2400G |
222.96 GB/s |
181.60 GB/s |
9.6 ns |
45967 MB/s |
47850 MB/s |
66.6 ns |
|
Ryzen 3 2200G |
137.30 GB/s |
171.20 GB/s |
10.2 ns |
35567 MB/s |
36240 MB/s |
118.4 ns |
|
Intel i7-8700K |
337.00 GB/s |
213.67 GB/s |
11.0 ns |
38421 MB/s |
40175 MB/s |
57.9 ns |
|
Intel i5-8400 |
270.89 GB/s |
186.82 GB/s |
13.0 ns |
38096 MB/s |
40549 MB/s |
59.8 ns |
|
Intel Core i9-7980XE |
229.61 GB/s |
118.40 GB/s |
21.0 ns |
77004 MB/s |
68888 MB/s |
73.4 ns |
|
Intel Core i9-7960X |
220.22 GB/s |
121.04 GB/s |
19.8 ns |
79416 MB/s |
71554 MB/s |
74.9 ns |
|
Intel Core i7-7820X |
114.40 GB/s |
103.57 GB/s |
19.2 ns |
76049 MB/s |
73759 MB/s |
71.6 ns |
|
Intel Core i5-7640X |
228.31 GB/s |
163.86 GB/s |
11.1 ns |
30786 MB/s |
31888 MB/s |
68.5 ns |
|
Intel Core i9-7900X |
124.16 GB/s |
106.78 GB/s |
21.2 ns |
76856 MB/s |
72856 MB/s |
72.8 ns |
|
Intel Core i7-7740X |
287.01 GB/s |
186.67 GB/s |
21.2 ns |
38455 MB/s |
40596 MB/s |
53.2 ns |
|
Intel i7-6900K |
243.96 GB/s |
195.41 GB/s |
14.6 ns |
66786 MB/s |
68130 MB/s |
61.9 ns |
|
Intel i7-7700K |
234.50 GB/s |
188.70 GB/s |
10.4 ns |
38498 MB/s |
40448 MB/s |
52.7 ns |
|
Intel i7-5960X |
260.72 GB/s |
184.92 GB/s |
15.3 ns |
66108 MB/s |
49545 MB/s |
62.8 ns |
|
AMD Ryzen R7 1800X |
388.18 GB/s |
386.01 GB/s |
12.4 ns |
44031 MB/s |
43425 MB/s |
81.8 ns |
|
AMD Ryzen R7 1700X |
369.75 GB/s |
350.31 GB/s |
12.9 ns |
44493 MB/s |
43749 MB/s |
78.3 ns |
|
AMD Ryzen R7 1700 |
334.36 GB/s |
332.12 GB/s |
14.2 ns |
45343 MB/s |
43777 MB/s |
82.6 ns |
|
AMD Ryzen R5 1600X |
386.48 GB/s |
326.86 GB/s |
12.3 ns |
44452 MB/s |
43918 MB/s |
83.7 ns |
|
AMD Ryzen R5 1500X |
306.82 GB/s |
211.58 GB/s |
11.8 ns |
44289 MB/s |
43746 MB/s |
83.1 ns |
|
AMD Ryzen R5 2600 |
381.16 GB/s |
320.56 GB/s |
9.8 ns |
50385 MB/s |
48499 MB/s |
66.5 ns |
|
AMD Ryzen R7 2700 |
357.51 GB/s |
356.71 GB/s |
9.4 ns |
50088 MB/s |
48343 MB/s |
65.9 ns |
|
Intel i7-8086K |
380.04 GB/s |
243.73 GB/s |
10.9 ns |
39069 MB/s |
40675 MB/s |
56.2 ns |
|
Intel i9-9900K |
302.01 GB/s |
221.1 GB/s |
11.0 ns |
39682 MB/s |
41015 MB/s |
51.1 ns |
|
AMD Ryzen 9 3900X |
1014.4 GB/s |
836.39 GB/s |
11.5 ns |
53981 MB/s |
52271 MB/s |
70.7 ns |
|
AMD Ryzen 7 3700X |
611.53 GB/s |
573.21 GB/s |
10.2 ns |
51498 MB/s |
28739 MB/s |
67.3 ns |
|
AMD Ryzen 5 3600X |
584.93 GB/s |
538.45 GB/s |
10.4 ns |
50769 MB/s |
28736 MB/s |
68.9 ns |
|
AMD Ryzen 3 3400G |
233.57 GB/s |
193.62 GB/s |
9.3 ns |
49936 MB/s |
53502 MB/s |
67.1 ns |
|
AMD Ryzen 3 3300X |
322.13 GB/s |
321.33 GB/s |
11.1 ns |
51435 MB/s |
28743 MB/s |
66.4 ns |
|
AMD Ryzen 3 3100 |
374.11 GB/s |
343.53 GB/s |
11.8 ns |
50246 MB/s |
28734 MB/s |
71.1 ns |
|
Intel i5-10600K |
361.35 GB/s |
238.47 GB/s |
10.5 ns |
43340 MB/s |
43430 MB/s |
48.2 ns |
|
Intel i9-10900K |
407.66 GB/s |
245.94 GB/s |
11.4 ns |
44972 MB/s |
43808 MB/s |
50.5 ns |
|
AMD Ryzen 5 5600X |
276.24 GB/s |
298.84 GB/s |
11.0 ns |
50972 MB/s |
28772 MB/s |
59.2 ns |
|
Intel i9-11900K |
330.32 GB/s |
213.28 GB/s |
11.4 ns |
44919 MB/s |
43343 MB/s |
51.8 ns |
|
Intel i5-11600K |
319.10 GB/s |
198.57 GB/s |
11.4 ns |
43953 MB/s |
43468 MB/s |
55.6 ns |
|
Intel i9-12900K |
678.84 GB/s |
418.11 GB/s |
19.8 ns |
71418 MB/s |
72395 MB/s |
82.0 ns |
|
Intel i5-12600K |
598.86 GB/s |
292.09 GB/s |
21.4 ns |
65416 MB/s |
71336 MB/s |
87.8 ns |
|
AMD Ryzen 5 4500 |
350.05 GB/s |
571.19 GB/s |
10.5 ns |
52683 MB/s |
53191 MB/s |
82.8 ns |
|
AMD Ryzen 5 5600 |
445.8 GB/s |
437.73 GB/s |
11.9 ns |
48444 MB/s |
28753 MB/s |
70.9 ns |
|
AMD Ryzen 7 5700X |
501.53 GB/s |
526.11 GB/s |
11.5 ns |
47858 MB/s |
28760 MB/s |
68.2 ns |
|
AIDA64 |
Single-Precision FLOPS |
Double Precision FLOPS |
AES-256 |
24-bit Integer IOPS |
32-bit Integer IOPS |
64-bit Integer IOPS |
|
AMD Ryzen R7 2700X |
507.9 GFLOPS |
253.9 GFLOPS |
70514 MB/s |
127.7 GIOPS |
127.7 GIOPS |
64.22 GIOPS |
|
AMD Ryzen R5 2600X |
383.2 GFLOPS |
191.4 GFLOPS |
51932 MB/s |
95.82 GIOPS |
95.82 GIOPS |
48.15 GIOPS |
|
Ryzen 5 2400G |
235.9 GFLOPS |
117.8 GFLOPS |
32388 MB/s |
58.94 GIOPS |
58.98 GIOPS |
29.67 GIOPS |
|
Ryzen 3 2200G |
225.8 GFLOPS |
112.6 GFLOPS |
27603 MB/s |
56.32 GIOPS |
56.32 GIOPS |
28.30 GIOPS |
|
Intel i7-8700K |
825.0 GFLOPS |
412.5 GFLOPS |
29406 MB/s |
370.0 GIOPS |
370.0 GIOPS |
51.55 GIOPS |
|
Intel i5-8400 |
728.8 GFLOPS |
364.5 GFLOPS |
25192 MB/s |
323.5 GIOPS |
323.5 GIOPS |
45.55 GIOPS |
|
Intel Core i9-7980XE |
1831 GFLOPS |
915.5 GFLOPS |
69377 MB/s |
821.2 GIOPS |
821.3 GIOPS |
121.6 GIOPS |
|
Intel Core i9-7960X |
1681 GFLOPS |
840.6 GFLOPS |
65409 MB/s |
754.0 GIOPS |
753.9 GIOPS |
114.7 GIOPS |
|
Intel Core i7-7820X |
944.9 GFLOPS |
472.5 GFLOPS |
36420 MB/s |
423.7 GIOPS |
423.7 GIOPS |
63.85 GIOPS |
|
Intel Core i5-7640X |
536.5 GFLOPS |
268.2 GFLOPS |
18547 MB/s |
238.1 GIOPS |
138.1 GIOPS |
33.53 GIOPS |
|
Intel Core i9-7900X |
1148 GFLOPS |
574.5 GFLOPS |
45506 MB/s |
515.1 GIOPS |
515.0 GIOPS |
79.76 GIOPS |
|
Intel Core i7-7740X |
575.4 GFLOPS |
287.8 GFLOPS |
20503 MB/s |
258.1 GIOPS |
258.0 GIOPS |
35.97 GIOPS |
|
Intel i7-6900K |
1023 GFLOPS |
511.7 GFLOPS |
36340 MB/s |
255.9 GIOPS |
255.9 GIOPS |
63.96 GIOPS |
|
Intel i7-7700K |
575.7 GFLOPS |
287.9 GFLOPS |
20519 MB/s |
258.0 GIOPS |
258.0 GIOPS |
35.98 GIOPS |
|
Intel i7-5960X |
895.5 GFLOPS |
447.7 GFLOPS |
31783 MB/s |
223.9 GIOPS |
223.9 GIOPS |
55.97 GIOPS |
|
AMD Ryzen R7 1800X |
472.4 GFLOPS |
236.2 GFLOPS |
64016 MB/s |
118.1 GIOPS |
118.1 GIOPS |
59.03 GIOPS |
|
AMD Ryzen R7 1700X |
446.8 GFLOPS |
223.4 GFLOPS |
61730 MB/s |
111.7 GIOPS |
111.7 GIOPS |
55.84 GIOPS |
|
AMD Ryzen R7 1700 |
408.5 GFLOPS |
204.3 GFLOPS |
56811 MB/s |
102.1 GIOPS |
102.1 GIOPS |
51.05 GIOPS |
|
AMD Ryzen R5 1600X |
354.9 GFLOPS |
177.5 GFLOPS |
49340 MB/s |
88.74 GIOPS |
88.73 GIOPS |
44.34 GIOPS |
|
AMD Ryzen R5 1500X |
229.8 GFLOPS |
114.8 GFLOPS |
31983 MB/s |
57.43 GIOPS |
57.45 GIOPS |
28.72 GIOPS |
|
AMD Ryzen R5 2600 |
351 GFLOPS |
175.4 GFLOPS |
48939 MB/s |
88.03 GIOPS |
88.02 GIOPS |
44.01 GIOPS |
|
AMD Ryzen R7 2700 |
434.3 GFLOPS |
217.2 GFLOPS |
60336 MB/s |
108.6 GIOPS |
108.6 GIOPS |
54.68 GIOPS |
|
Intel i7-8086K |
824.9 GFLOPS |
412.5 GFLOPS |
29397 MB/s |
369.9 GIOPS |
369.9 GIOPS |
51.55 GIOPS |
|
Intel i9-9900K |
1226 GFLOPS |
613.0 GFLOPS |
45542 MB/s |
550.0 GIOPS |
549.8 GIOPS |
79.79 GIOPS |
|
AMD Ryzen 9 3900X |
1546 GFLOPS |
772.1 GFLOPS |
106943 MB/s |
385.7 GIOPS |
385.7 GIOPS |
96.57 GIOPS |
|
AMD Ryzen 7 3700X |
1078 GFLOPS |
537.8 GFLOPS |
74474 MB/s |
271.0 GIOPS |
271.2 GIOPS |
67.77 GIOPS |
|
AMD Ryzen 5 3600X |
799.5 GFLOPS |
400.0 GFLOPS |
55456 MB/s |
198.6 GIOPS |
198.6 GIOPS |
49.64 GIOPS |
|
AMD Ryzen 3 3400G |
257.2 GFLOPS |
128.5 GFLOPS |
35736 MB/s |
64.16 GIOPS |
64.16 GIOPS |
32.25 GIOPS |
|
AMD Ryzen 3 3300X |
551.6 GFLOPS |
276.1 GFLOPS |
38176 MB/s |
138.7 GIOPS |
138.7 GIOPS |
34.65 GIOPS |
|
AMD Ryzen 3 3100 |
497.6 GFLOPS |
248.7 GFLOPS |
34946 MB/s |
124.4 GIOPS |
124.4 GIOPS |
31.09 GIOPS |
|
Intel i5-10600K |
863.8 GFLOPS |
431.9 GFLOPS |
30782 MB/s |
387.2 GIOPS |
386.9 GIOPS |
53.99 GIOPS |
|
Intel i9-10900K |
1632 GFLOPS |
815.7 GFLOPS |
58163 MB/s |
731.3 GIOPS |
731.2 GIOPS |
102.0 GIOPS |
|
AMD Ryzen 5 5600X |
891.9 GFLOPS |
445.8 GFLOPS |
61623 MB/s |
709.6 GIOPS |
709.7 GIOPS |
55.72 GIOPS |
|
Intel i9-11900K |
1068 GFLOPS |
534.2 GFLOPS |
164966 MB/s |
547.0 GIOPS |
547.0 GIOPS |
182.7 GIOPS |
|
Intel i5-11600K |
838.7 GFLOPS |
419.4 GFLOPS |
123767 MB/s |
429.3 GIOPS |
429.3 GIOPS |
143.4 GIOPS |
|
Intel i9-12900K |
695.7 GFLOPS |
247.9 GFLOPS |
140499 MB/s |
400.6 GIOPS |
400.6 GIOPS |
166.2 GIOPS |
|
Intel i5-12600K |
432.5 GFLOPS |
216.2 GFLOPS |
86470 MB/s |
252.7 GIOPS |
252.7 GIOPS |
96.22 GIOPS |
|
AMD Ryzen 5 4500 |
806 GFLOPS |
402.6 GFLOPS |
56578 MB/s |
201.5 GIOPS |
201.3 GIOPS |
50.35 GIOPS |
|
AMD Ryzen 5 5600 |
853.2 GFLOPS |
426.2 GFLOPS |
107839 MB/s |
675.8 GIOPS |
679.6 GIOPS |
53.38 GIOPS |
|
AMD Ryzen 7 5700X |
1158 GFLOPS |
577.9 GFLOPS |
137459 MB/s |
919.1 GIOPS |
912.9 GIOPS |
74.38 GIOPS |
Power Usage and Temperatures
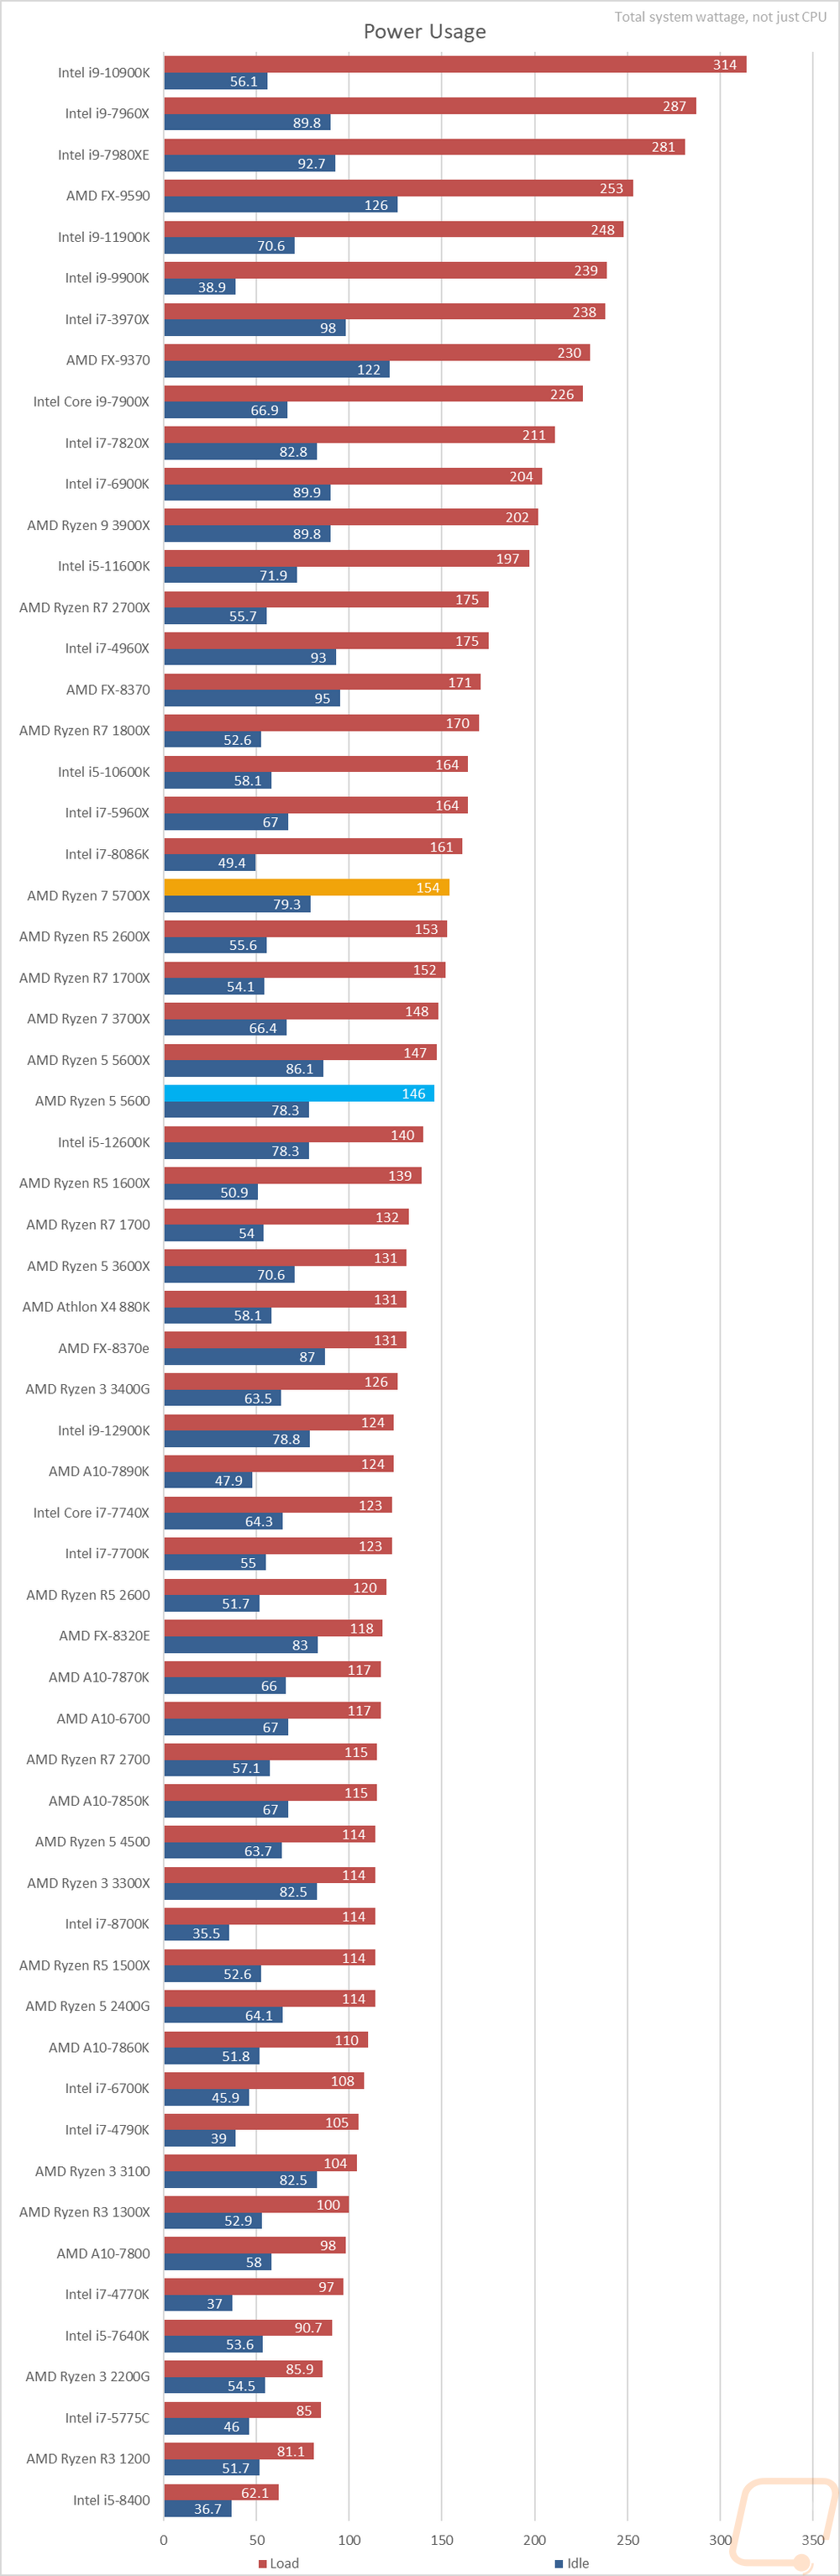
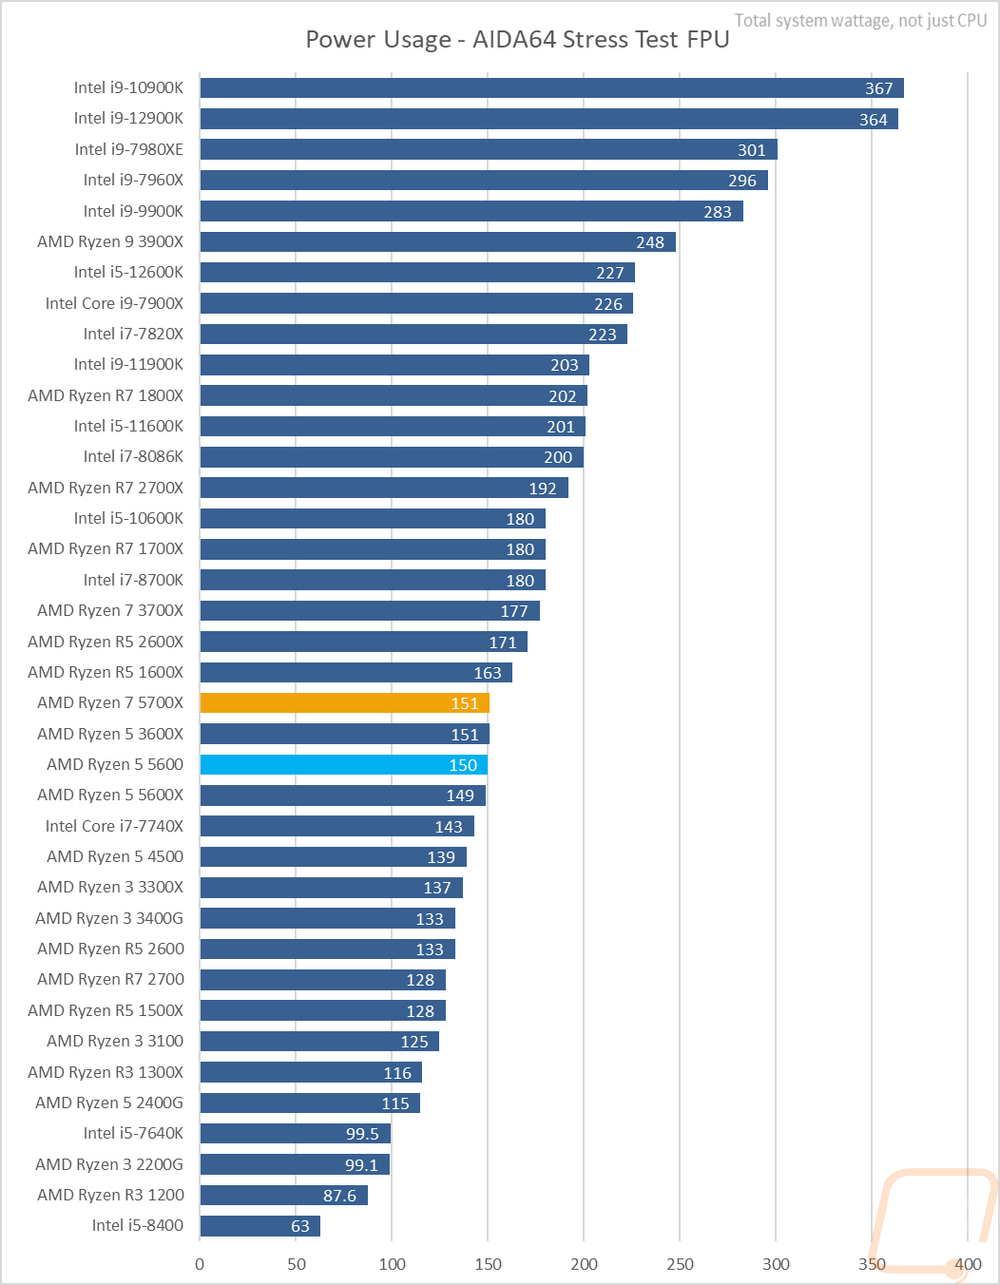
For power usage, I tested both CPUs for the overall power usage of our test system. I did this at idle and again while running wPrime for one load test then a third time using AIDA64’s Stress Test with the FPU workload for a third test. The system with the 5700X pulled 154 watts with wPrime and 79.3 at idle but with AIDA64 that dropped down slightly to 151 watts. This was right with the 5600X which was also at 151 watts with AIDA64 and the 3600 was right there as well. With wPrime, the 5600 and the 5600X came in a few watts lower than the 5700X but overall all three are in the same range which given the same target TDP it isn’t too big of a surprise.
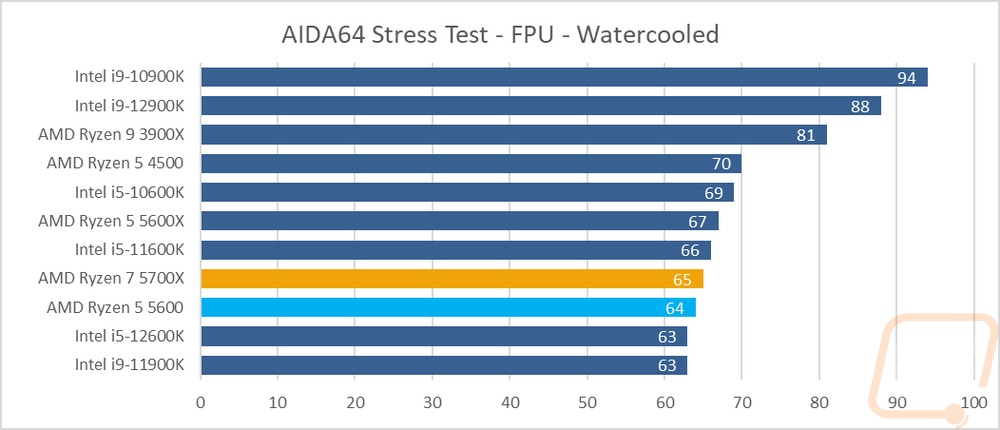
Last up for a look at thermals I ran the AIDA64 Stress Test with the FPU workload and kept an eye on CPU temps until they leveled off. The 5700X leveled off at a surprisingly good 65 watts with the 240mm AIO cooler. The 5600X was two degrees higher and the 5600 with its lower clock speed was down at 64 degrees.
Overall and Final Verdict
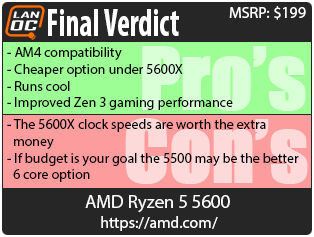
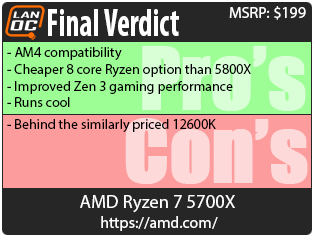
AMD's refreshed CPU offerings are an interesting mix of great options and “a little too late”. The Ryzen 5700X for example is a great way to get 8 core Zen 3 performance without having to spend the 5800X prices. For performance, like with all of the Zen 3 CPUs the gaming performance is a huge jump over past Ryzen CPUs, and in a lot of situations where core count is important the 5700X outperformed the always great 5600X even though it has better clock speeds. Both the 5700X and the 5600 benefits from the well established AM4 platform which means almost countless new and used motherboard options and cooling support isn’t going to be a question like with Intel’s new CPUs. Both the 5600 and the 5700X also did well for temperatures as well.
The 5700X’s biggest problem is that while its performance is really good, the 12600K is out now and selling for the same price and sometimes a little less and it performed even better almost across the board with its mix of 6 performance cores and 4 e cores. The 5700X would have been amazing last year but now its biggest benefit is that people with past Ryzen setups may be able to upgrade to it. The Ryzen 5 5600 also finds itself in an awkward situation where it is a great performing CPU. But for just a little more you can get the higher clocked 5600X or if you REALLY need a budget 6 core CPU the Ryzen 5500 can get you that at a lower price.
Speaking of pricing, the 5600 has an MSRP of $199 and the 5700X comes in at $299. The 5600X which for gaming is still the better option falls in between selling for $239 or as low as $218 at B&H right now. Overall I do think the 5600 and the 5700X both have their place in the mid-range CPU market, especially if you are already invested with a 370X/B350 or later AM4 chipset where both of these could be a great upgrade to a Zen 2 CPU.
Live Pricing: HERE
Live Pricing: HERE


