Performance
Okay so now to get serious, in all of the time I’ve had the NUC most of that time was in testing. As I mentioned earlier in a lot of ways this is a CPU review, GPU review, and Motherboard review all wrapped up together. So I didn’t have one specific test suite that I could fit it in. I ended up pulling tests from all three. The problem was I ended up doing so much testing that there was just no way to break all of the results up. I originally wanted to include full graphs comparing the Intel Core i7-8809G CPU to past CPUs tested and then comparing the Radeon RX Vega M GH Graphics to other GPUs. But it was just too much all in one place. So I have included all of my testing and I will reference back to some of our other testing for comparison from time to time. You can check out our last GPU reviews to compare some numbers as well as our last CPU reviews as well.
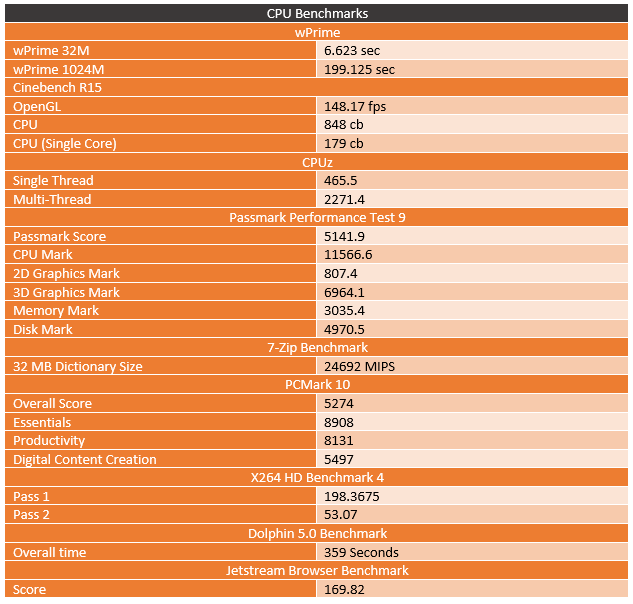
So my initial testing on our NUC8i7HVK was to look at the overall performance of that i7-8809G. wPrime was one of my first tests. The 199 second 1024M score puts the 8809G right in line with the i5-8400 from our past desktop testing. It did better in Cinebench though where it came in close to the 7740X for multi-core testing and was around the same as the 7640K for single core performance. Now our PCMark 10 results can’t really compare to our normal testing because it is done with a 1080Ti, but 5274 for an overall score without a true dedicated GPU isn’t too bad. X264 performance is actually right up there with the top Ryzen CPUs but about 20-30 FPS lower than the fastest Intel desktop CPUs.
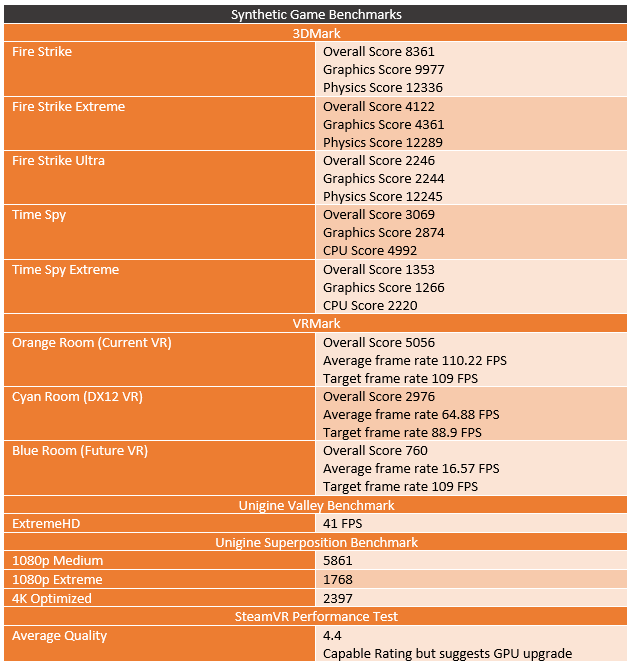
I also went through a lot of our normal synthetic gaming benchmarks. These results were split between being CPU and GPU specific so I put them in their own category. Most of the time with CPU testing I focus on the Physics or CPU score in things like 3DMark, then graphics scores for the GPU testing. The 12336 physics score in Fire Strike falls not far from the 14636 that the i7-7700K had. As for the Graphics scores, well 9977 wasn’t really on the charts for our most recent dedicated GPU tests but the RX470 score 11456 isn’t far off while when you compare that performance to previous onboard performance it is two to three times higher than the best onboard results. The most interesting tests to me here though were the VR related tests. I think the form factor of the Hades Canyon NUC is perfect for a quick to set up VR configuration that you can take with you. SO when I saw that it did come in over the 109 FPS target for the Vive in VRMarks Orange room I was excited. Now the SteamVR test did ground my expectations, it came in as VR capable but with a 4.4 out of 10, there is still room to improve in the future as well.
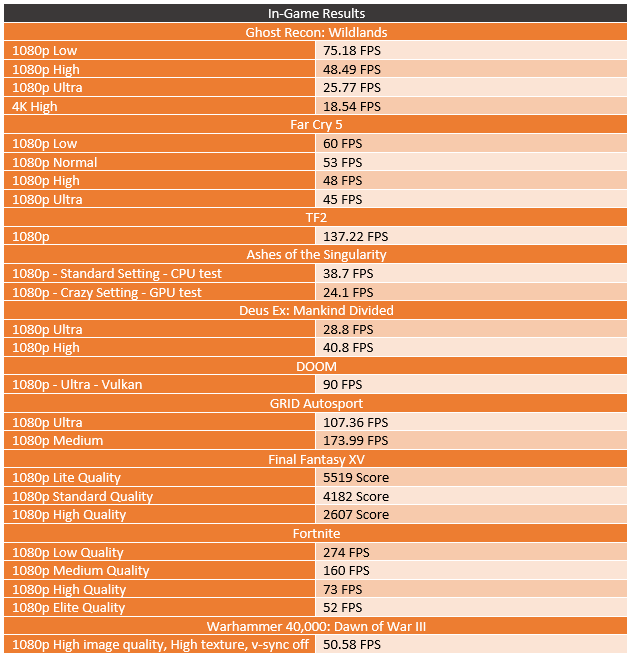
Then I finally got into the more realistic tests in our In-Game benchmarks. Here I picked through our GPU tests to get a wide range of tests. I also included a few from our normal Onboard GPU testing as well to be able to compare to those results. In Wildlands I was happy to see that the NUC could get up over 60 FPS even if it was on the low setting. I actually did a lot of testing of Wildlands last year and found that even the low settings were great looking. I did find that High was smooth but going up to Ultra at 1080p was not very good. More importantly, I learned quickly that there wasn’t much of a point doing our full GPU test suite where we test at 1440p and 4k, you can see how big of a hit was taken at 4k. Far Cry 5 as a new game performed really well as well. At low setting, you reach 60 FPS, but even turning things up were still playable in the 45-53 FPS range.
Now TF2 is actually one of our CPU tests, when paired up with the 1080Ti the fastest CPUs reach up to 162 FPS but this 137 FPS result was especially impressive because it was better than all of the Ryzen CPUs did with the 1080 Ti and the NUC did it with the Vega M GPU. For comparison, the new Raven Ridge CPUs peaked at 79 FPS using their onboard. Ashes of the Singularity I actually included both CPU and GPU focused tests. In the CPU focused test the 8809G came in at 38.7 FPS right with the R7 1700 and i5 8400. In the GPU focused test, the results were again just a touch behind the RX 470. In Deus Ex, the results came in about 10 FPS less than the RX 470 and it looks like you would need to drop things down lower to get into that 60 FPS sweet spot.
I loved how smooth DOOM was with it getting an impressive 90 FPS running at the Ultra setting using Vulkan. This of course still doesn’t land on our GPU charts, but for a mobile GPU, I’m really digging seeing such high FPS in a great looking game. GRID Autosport is another one of our normal onboard GPU tests. For comparison, the Ryzen 5 2400G pulled 78.63 FPS on medium and 37.94 on ultra in my review of the Raven Ridge CPUs and the NUC stomped those results with 173.99 FPS in medium and 107.36 FPS at ultra. The Final Fantasy XV results are a new addition and didn’t give us FPS averages but they do have charts for comparison online. In the Lite setting, for example, the NUC came in right with the GTX 770. Results were similar at standard and high settings, only with it edging up into the GTX 970 range at the high setting.
I also slipped in a few other new tests like the Dawn of War III benchmark where I saw 50.58 FPS at 1080p with high quality and textures. Then, of course, I couldn’t go without looking at Fortnite performance given its popularity. Well cranking setting up to Elite might not be ideal at 1080p with the 52 FPS average, but at High setting 73 FPS was great and if you need that ultra smooth Gameplay you can get 160 FPS at medium and 274 on low.
Like my motherboard reviews, I did also have to take a look at the network performance of the NUC8i7HVK. What I found on the wired NIC was a little on the lower side at 873 Mbps, I normally see in the mid 900’s. but wireless performance was on point with the 268 Mbps average, most people will even be happy with that alone.

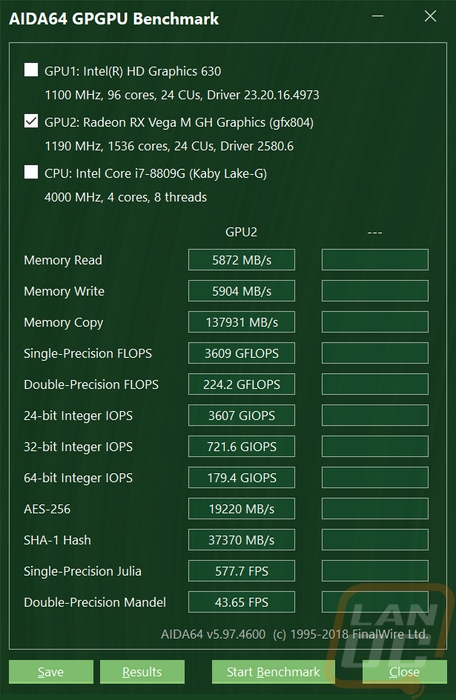
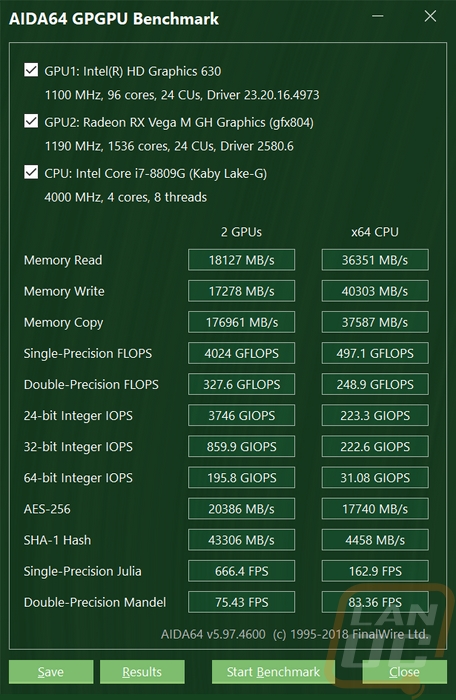
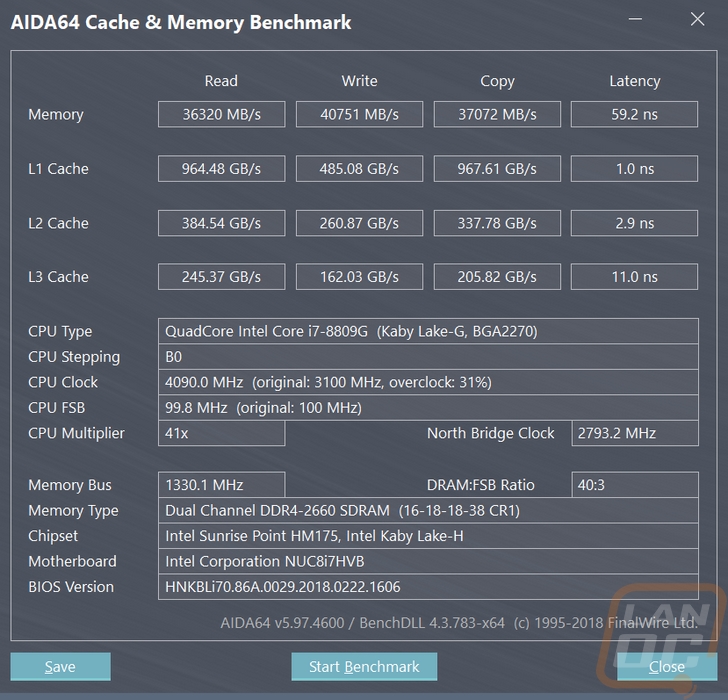
I also slipped in some AIDA64 testing. This is where we can actually get a direct comparison with the iGPU on the CPU compared to the Vega M GPU

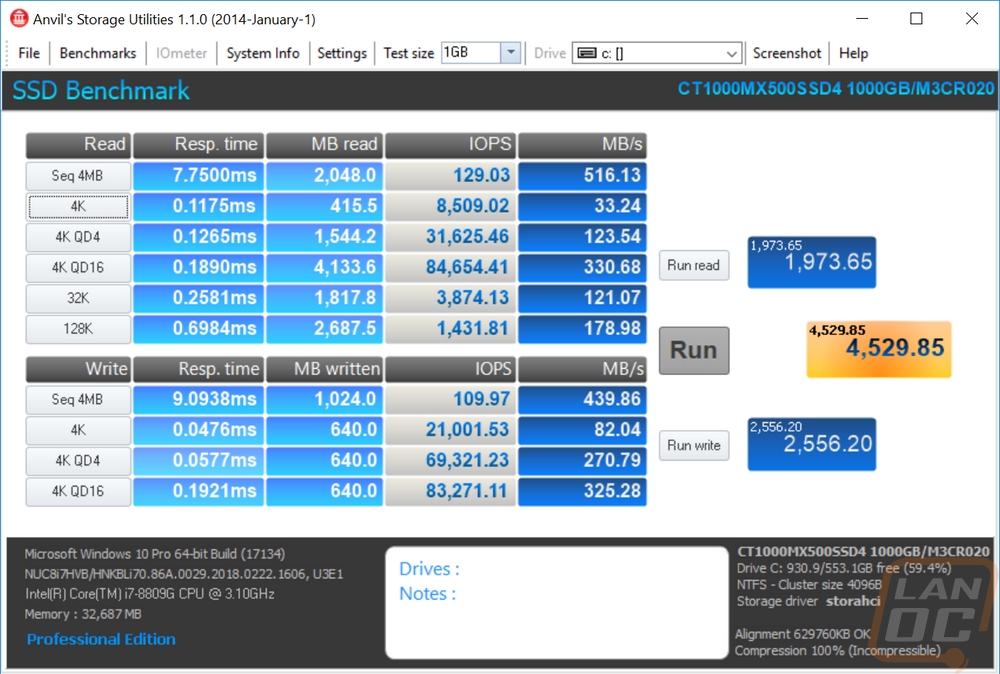
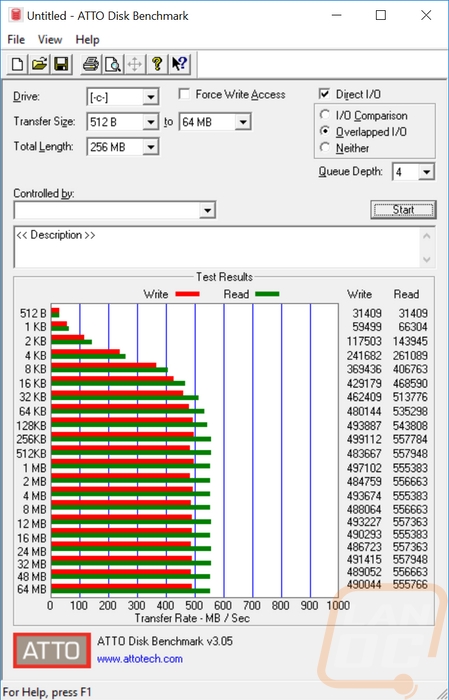
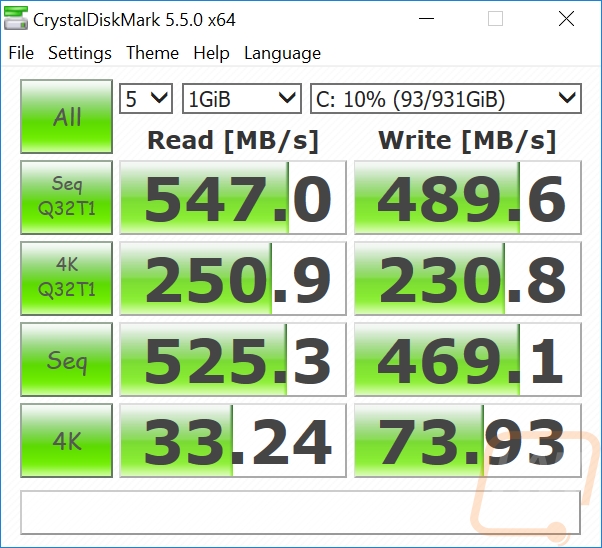
I also had to at least take a look at the performance of the Crucial MX500 M.2 drive that they sent over. The results were about what you would expect for a SATA based drive.