Performance
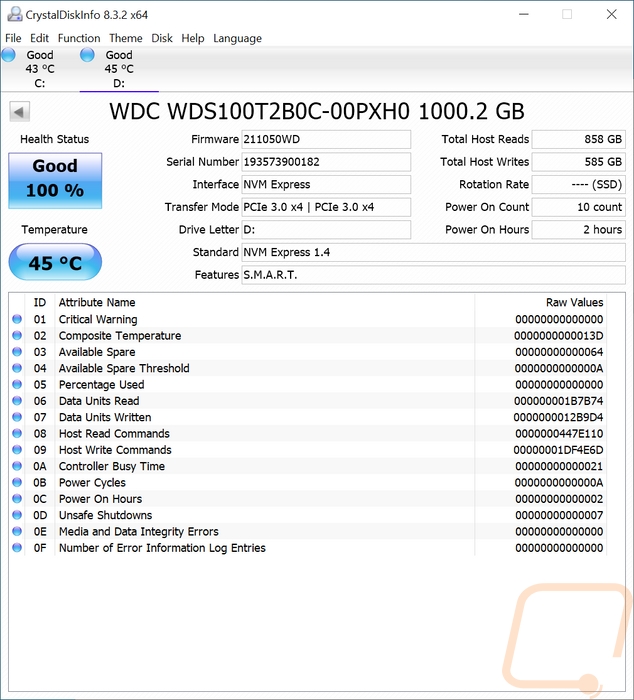
I always include a CrystalDiskInfo screenshot, for internal drives like this it doesn’t give us any big secrets. But there is one thing to note, the SN550’s big change from the SN500 is moving to an x4 bandwidth PCIe 3.0 configuration where the SN500 was an x2 drive. CDI also documents the firmware revision all of our testing was done on in case that changes in the future and you can see that this was done after my testing where I did a total of 858 GB of read and 585 on the writes.
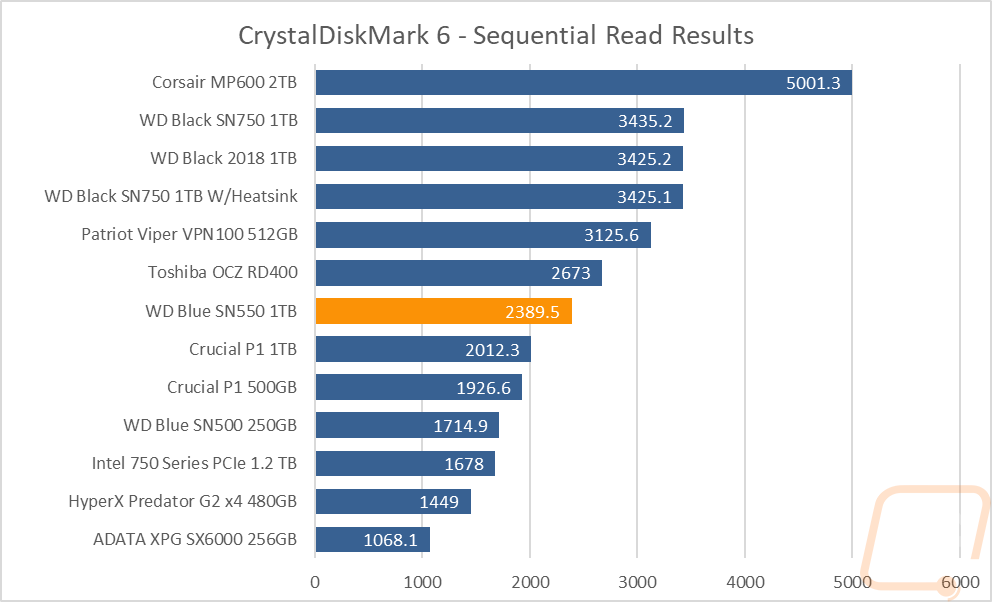
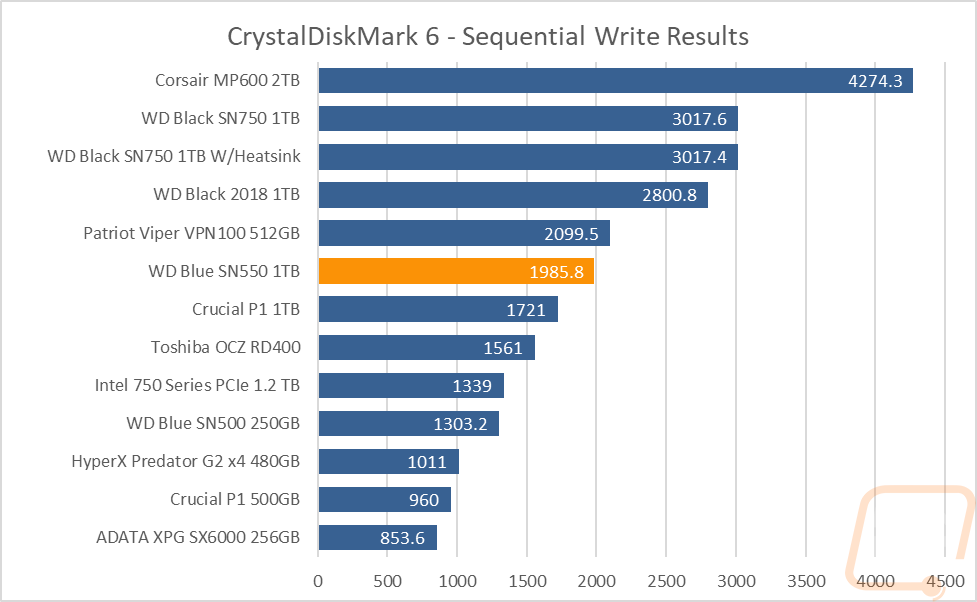
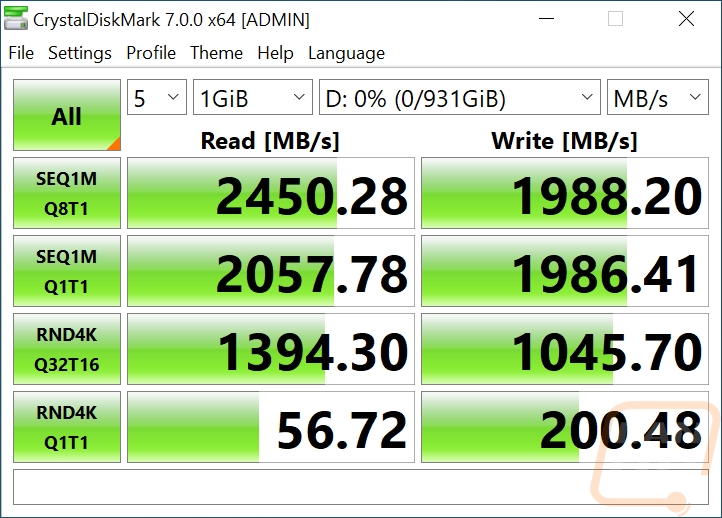
I started my testing off with CrystalDiskMark because it is the most popular test when it comes to pure sequential performance and that is what people love to talk about and marketers love putting on the box. I tested with CrystalDiskMark 6 for comparison with past tests but I also tested with the new CDM7 for future use as well and I have included those numbers. So the SN550’s box has up to 2400 MB/s listed on the front for read speed so I was curious if our drive came in that range and in CrystalDiskMark 6 it did with a read speed of 2389.5. This is a huge jump in performance over the older SN500 which was down at 1714.9. The high-end PCIe 3.0 drives still come in faster up in the mid 3k’s and the new PCIe 4.0 drive is even better up at 5000 MB/s. As for write performance, the SN550 did 1985.8 in CDM 6 which is again about half the speed of a PCIe 4.0 drive but still a big jump over the SN500. In the new CrystalDiskMark 7, the read speed result was a little higher, up over the 2400 MB/s advertised and write speed was better as well. The new CDM 7 changes all of its other tests as well testing sequential performance in half and random in the other half testing a single queue depth and single thread and for the one random test doing a 32 QD on 16 threads.
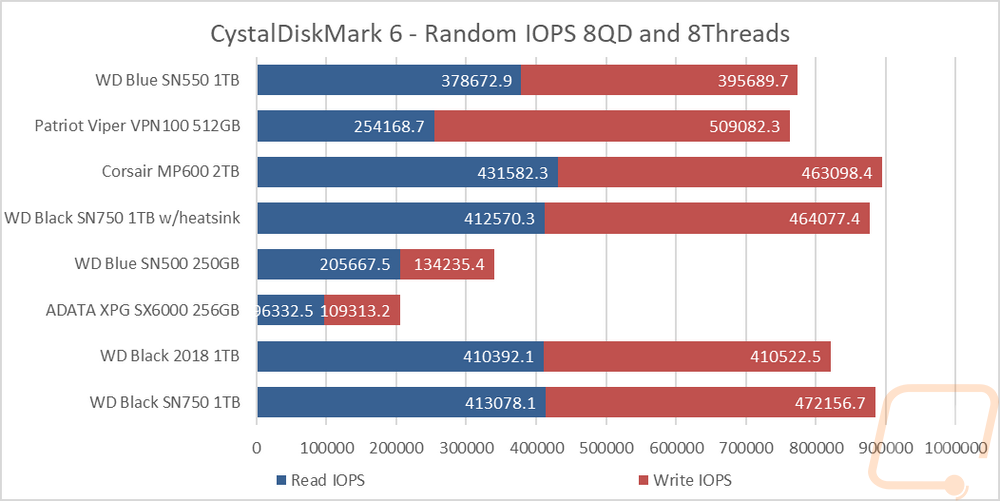
Also in CrystalDiskMark 6, I took a look at IOPS performance on both of the 8 queue depth and 8 thread results. I then stacked both read and write performance to get an overall look at the drive. The improvement over the SN500 is really staggering here, especially with the write IOPS and you can see that the Blue SN550 is edging close to the older original WD Black drive.
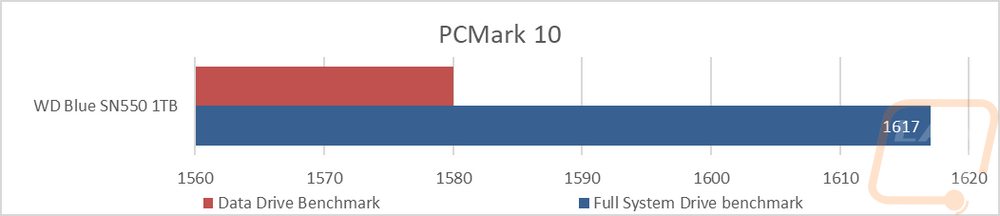
Now that PCMark 10 has added storage benchmarks I did include scores for the Data Drive and Full System Drive benchmarks. I don’t have any comparison numbers to go along with them just yet though.
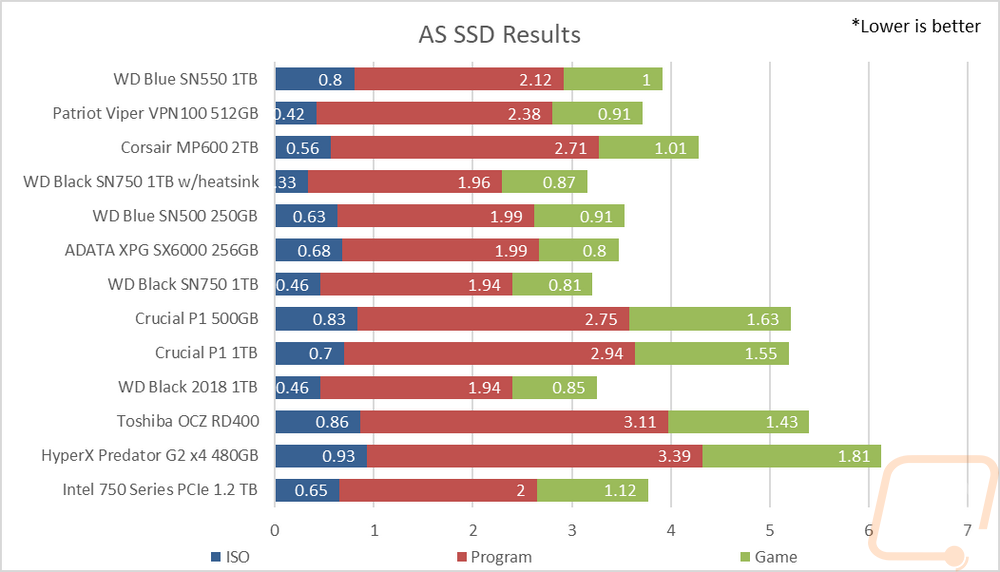
In AS SSD, rather than using the standard benchmark which is similar to CrystalDiskMark I went with the file copy benchmark. This copies different file types and times them. It does an ISO file copy, a standard program file, and game files. A lower score here is better and this is the first test where the SN550 didn’t do as well, namely in the ISO file but it was slower in all three tests compared to the older SN500.
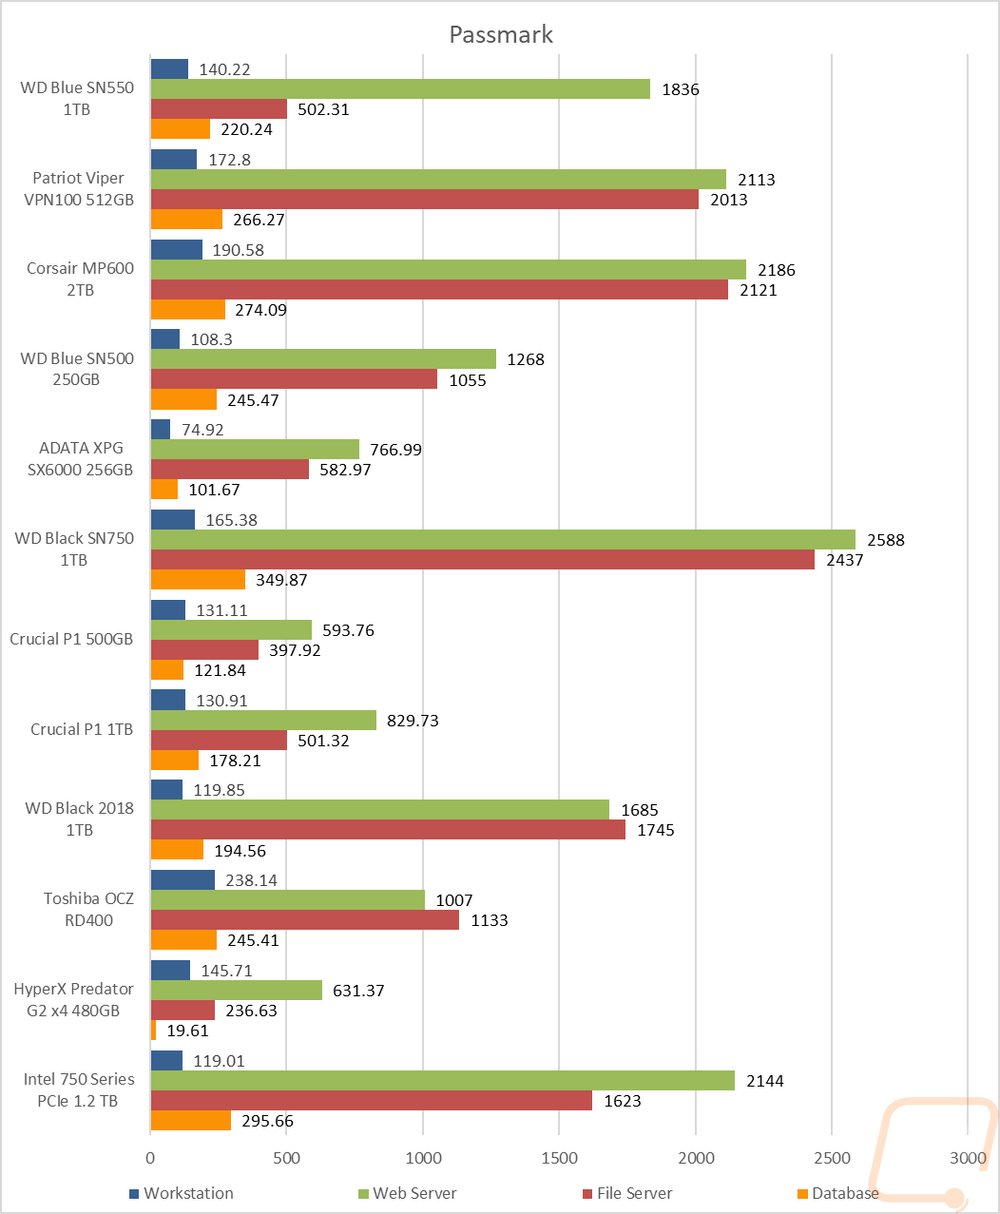
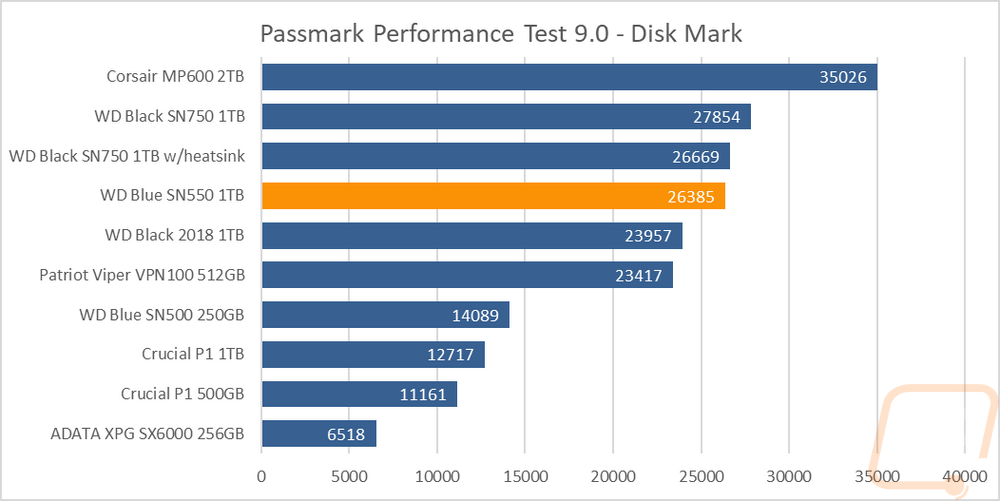
In Passmark’s Performance Test 9 I ran a few different tests. First I have their advanced disk benchmark where you can make custom tests. I ran all four of the included defaults to make replication easy and they all look at different business applications. The SN550 didn’t do to bad in the webserver test but did poorly in the file server benchmark, not even keeping up with the SN500 there. The workstation result which is the most like a normal use case was improved but then database performance went down compared to the SN500. The second round of Passmark testing was using the full disk benchmark to get a disk mark score. In this test the SN550 did really well, catching up with the SN750 nearly.
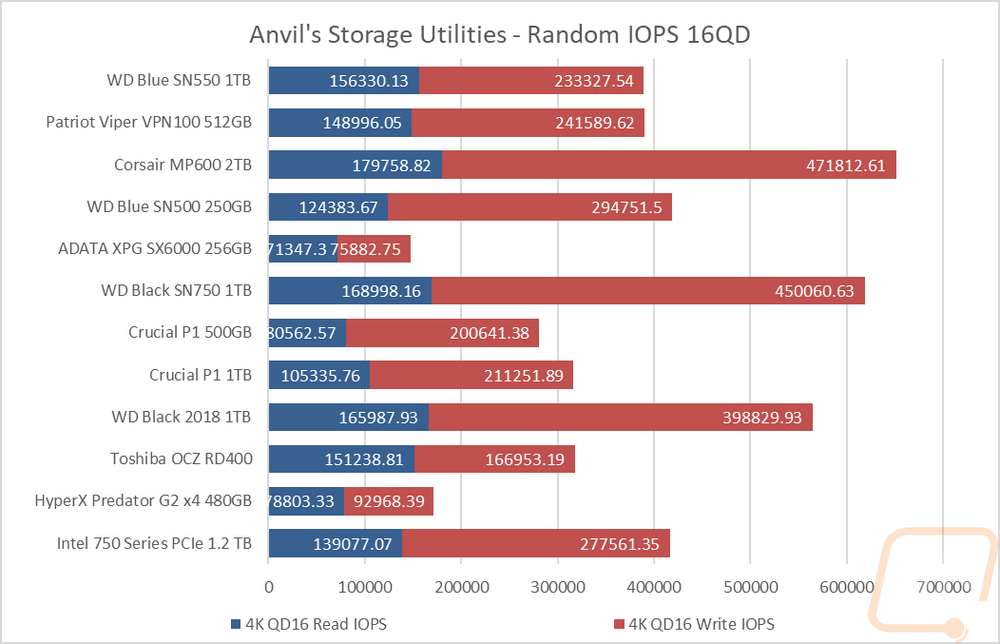
In Anvil’s Storage Utilities I focused just on IOPS at a queue depth of 16 on both reads and writes the WD Blue SN550 basically match the Viper VPN100. Comparing with the original WD Blue SN500 the write performance was improved but read performance dropped giving an overall drop. It is clear the new drive does really well at sequential tests but there are a few tests where high queue depth performance was sacrificed.
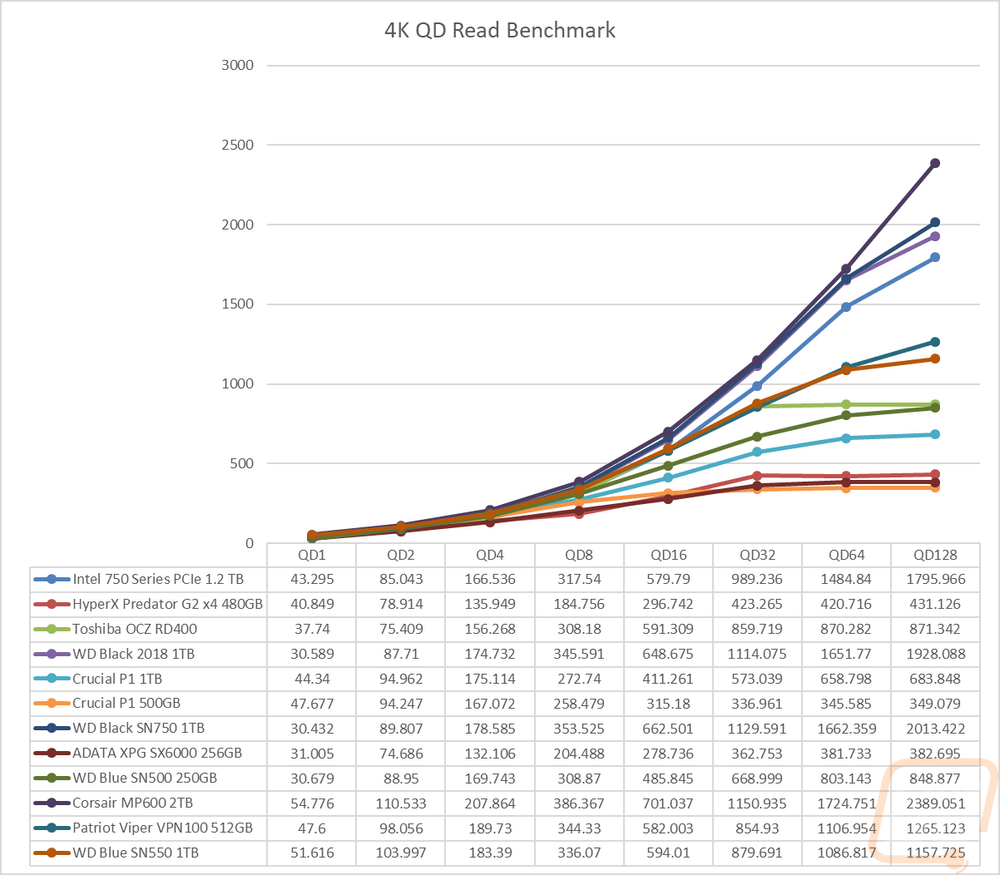
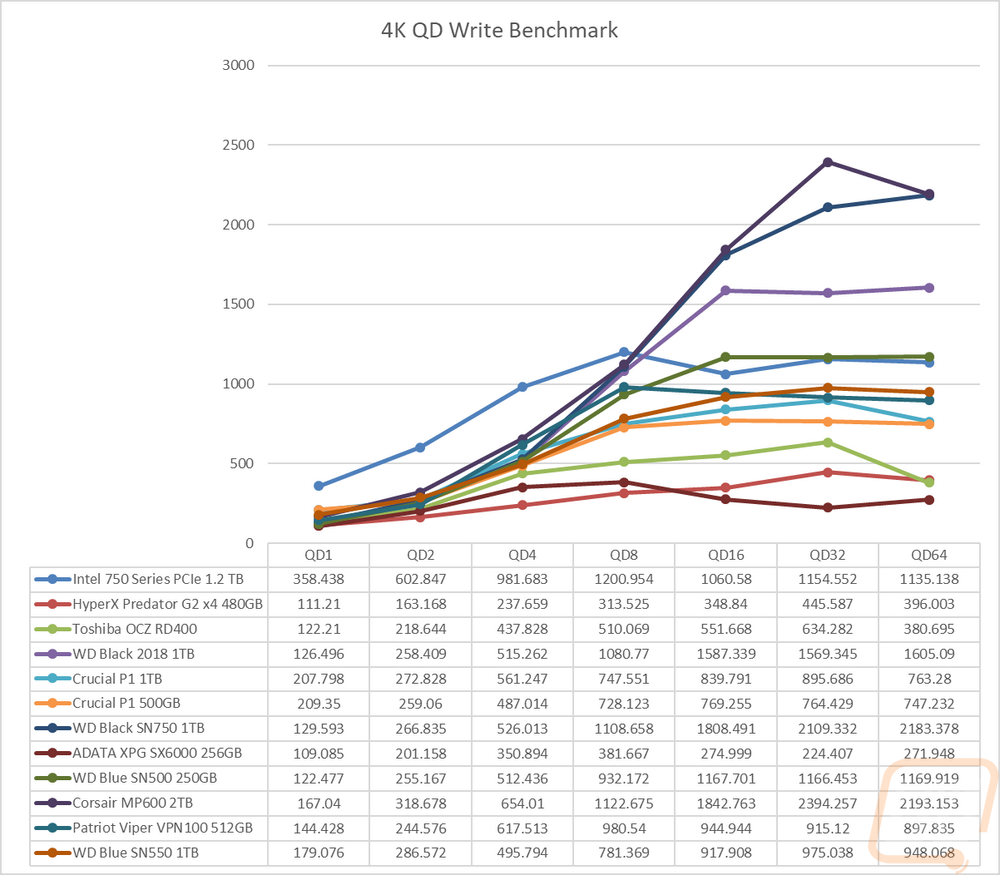
To check queue depth performance overall I manually ran 4k read and write tests at different queue depths to see if things would fall off, doubling the queue depth each test. The SN550 did really well with a queue depth of 1 in the read test and this kept it near the top of the pack up until QD8 where a few drives start to pull ahead. Overall it still does much better than the original SN500 even at a queue depth of 128 with it reaching 1157.725 MB/s vs 848.877 MB/s but the high-end drives pull out ahead at the highest queue depths, not having DRAM really hurts here. The write queue depth test was similar but on that test, the SN500 handled everything over a queue depth of 4 better.
While doing performance testing I did put the WD Blue SN550 under load using AIDA64’s stress test and let it run to heat things up. I was curious to see if once heated up moving the NAND away from the controller made a noticeable difference and you can see just how much cooler the drive is on the NAND side. In fact, there doesn’t seem to be any heat on that end of the drive being generated from the drive itself.