Performance
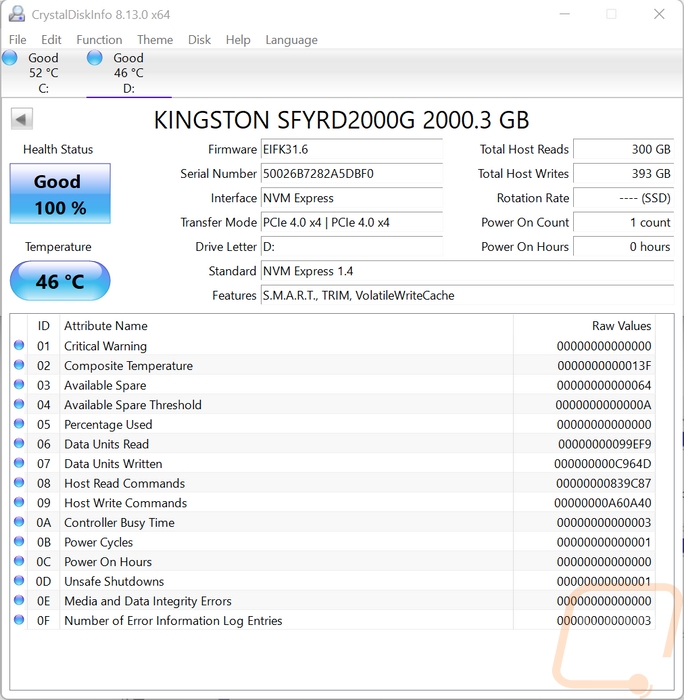
Before getting into my testing I did run CrystalDiskInfo to double check that the drive was connected at PCIe 4.0 x4 and it was. This also documents the firmware revision I am testing at as well for future reference.
Then my first round of tests were with Crystal Disk Mark 8. Here I am mostly interested in seeing the sequential read and write performance, but I did include the rest of the results. I have all of the PCIe 4.0 drives color-coded on this as orange and 3.0 drives in blue so they can be spotted and of course, the Fury Renegade I am taking a look at today is down at the bottom. The drive did well but did come in a little below the teased potential performance when testing on our new Z690 test bench running on Windows 11. The Renegade had a sequential read speed of 6592 MB/s and its write performance was much more impressive at 6899 MB/s. The read performance was right in line with the other E18 based drives that I tested but I was impressed that the write performance was WELL ahead of the other drives.
|
Crystal Disk Mark 8 - Read |
SEQ1M Q8T1 |
SEQ128K Q32T1 |
RND4K Q32T16 |
RND4K Q1T1 |
|
WD Blue SN550 1TB |
2444.53 |
2077.36 |
1075.88 |
57.88 |
|
Sabrent Rocket Q4 2TB |
4939.59 |
2871.47 |
1034.52 |
74.53 |
|
Corsair MP400 1TB |
3432.77 |
1889.56 |
713.28 |
61.42 |
|
Corsair Force MP600 2TB |
4828 |
1543.31 |
901.83 |
41.49 |
|
Sabrent Rocket 4.0 Plus 1TB |
6468.33 |
2712.53 |
455.24 |
54.68 |
|
Crucial P5 Plus 1TB |
6697.19 |
4358.63 |
1113.7 |
69.76 |
|
Kingston FURY Renegade 2TB |
6592.75 |
3093.11 |
1085.23 |
55.14 |
|
Crystal Disk Mark 8 - Write |
SEQ1M Q8T1 |
SEQ128K Q32T1 |
RND4K Q32T16 |
RND4K Q1T1 |
|
WD Blue SN550 1TB |
2007.63 |
2006.4 |
776.4 |
290.25 |
|
Sabrent Rocket Q4 2TB |
3633.71 |
2568.7 |
920.84 |
385.73 |
|
Corsair MP400 1TB |
2021.09 |
2017.63 |
1196.42 |
262.36 |
|
Corsair Force MP600 2TB |
992.38 |
982.78 |
996.22 |
276.26 |
|
Sabrent Rocket 4.0 Plus 1TB |
5241.89 |
5225.25 |
921.51 |
402.26 |
|
Crucial P5 Plus 1TB |
5025.83 |
4880.38 |
884.12 |
240.78 |
|
Kingston FURY Renegade 2TB |
6899.76 |
5831.06 |
1083.12 |
367.6 |
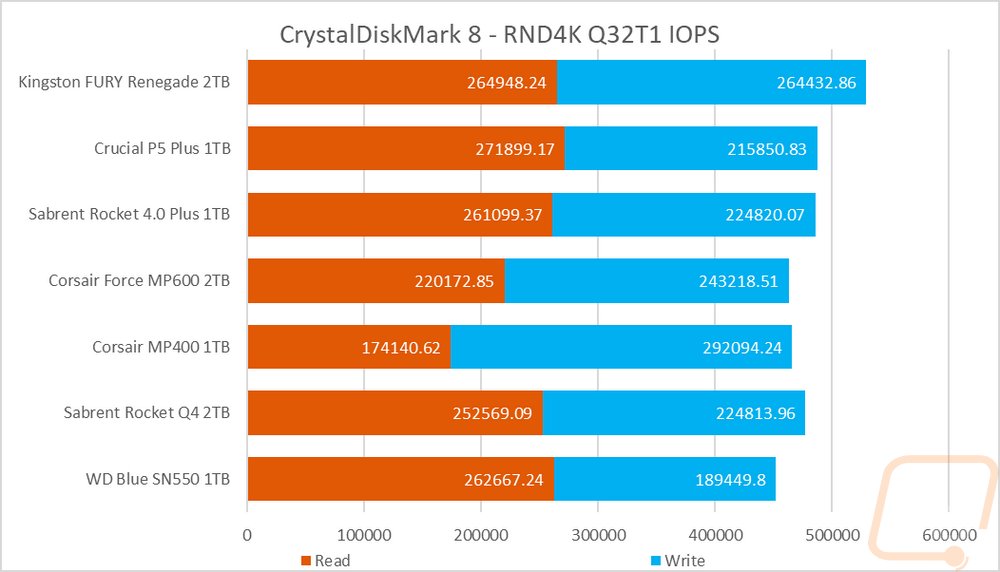
While testing in CrystalDiskMark 8 I did also check out the drive’s IOPS performance with the random 4k queue depth of 32 and 1 thread results. I stacked the read and write performance together here because I do believe that the overall drive performance is important, not just one result or the other. The Renegade came in a little behind the P5 Plus on the read side, just like in the standard CDM results but the write performance was the second highest of the drives tested. The combination of the two has the Fury Renegade out in front of the other drives.
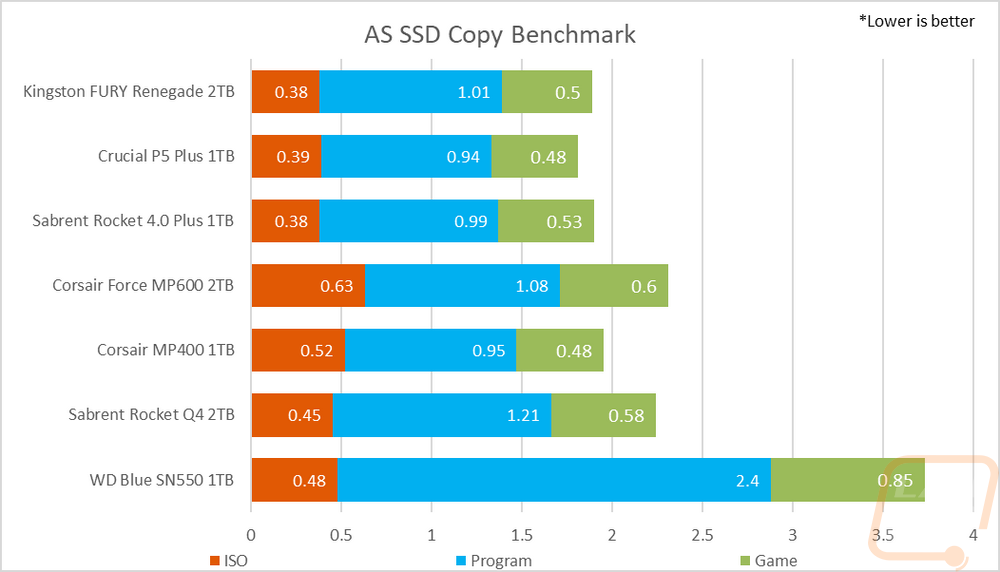
My next test was in AS SSD, but because the standard test in AS SSD is very similar to the CrystalDiskMark tests I prefer to check out one of its sub-tests, the copy benchmark. This moves three files, one that is an ISO, one that is a program, and then a game and times how long each takes. With these being timed, lower is better here. I have all three results stacked to see which drives are best overall. The Fury Renegade did well here but wasn’t the fastest of the PCIe 4.0 drives that I have tested. It was right in line with the ISO but a little slower on the program file putting it ahead of the Rocket 4.0 Plus but behind the Crucial P5 Plus.
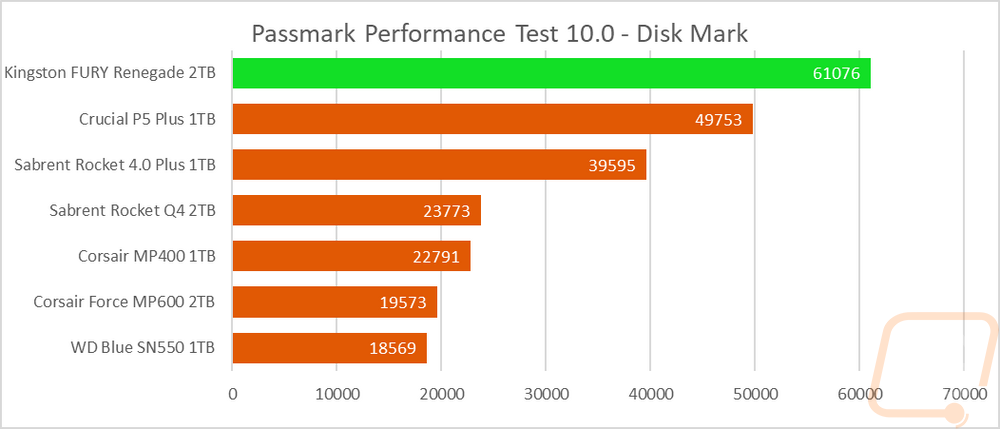
Next up with PassMark Performance Test 10 I ran their combined synthetic benchmark to get a look at their DiskMark rating. Here the Renegade topped the chart with the P5 plus and Rocket 4.0 Plus also out ahead of the crowd but the Renegade way out in front still.
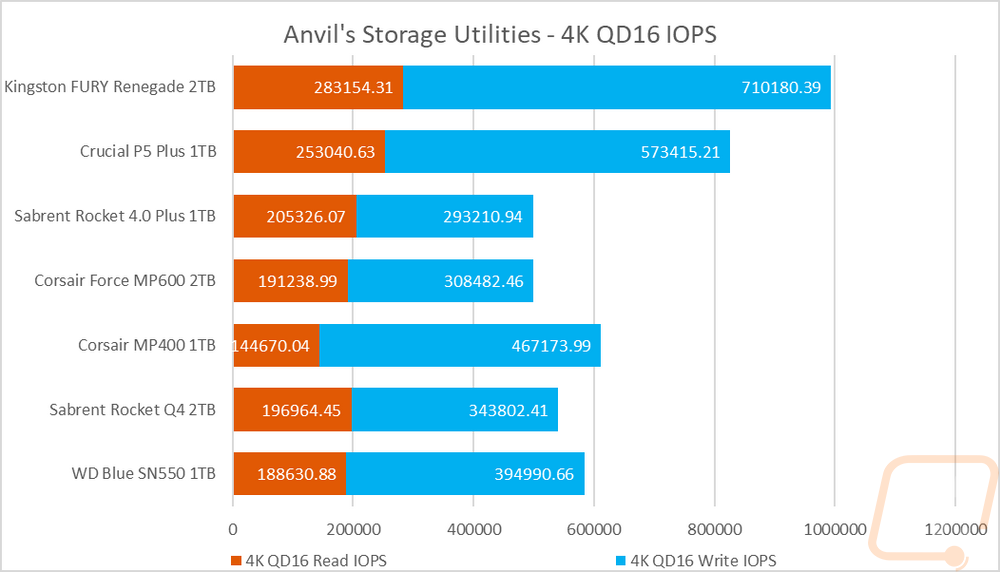
Next up I have another look at IOPS, this time though it is when testing with Anvil’s Storage Utilities. This time at 4k with a lower queue depth of 16. Here the Fury Renegade was the fastest tested in both the read and write tests. The read IOPS were 283154 which were 30K higher than the P5 Plus. But on the write IOPS, the renegade really stepped things up with 710180 IOPS.
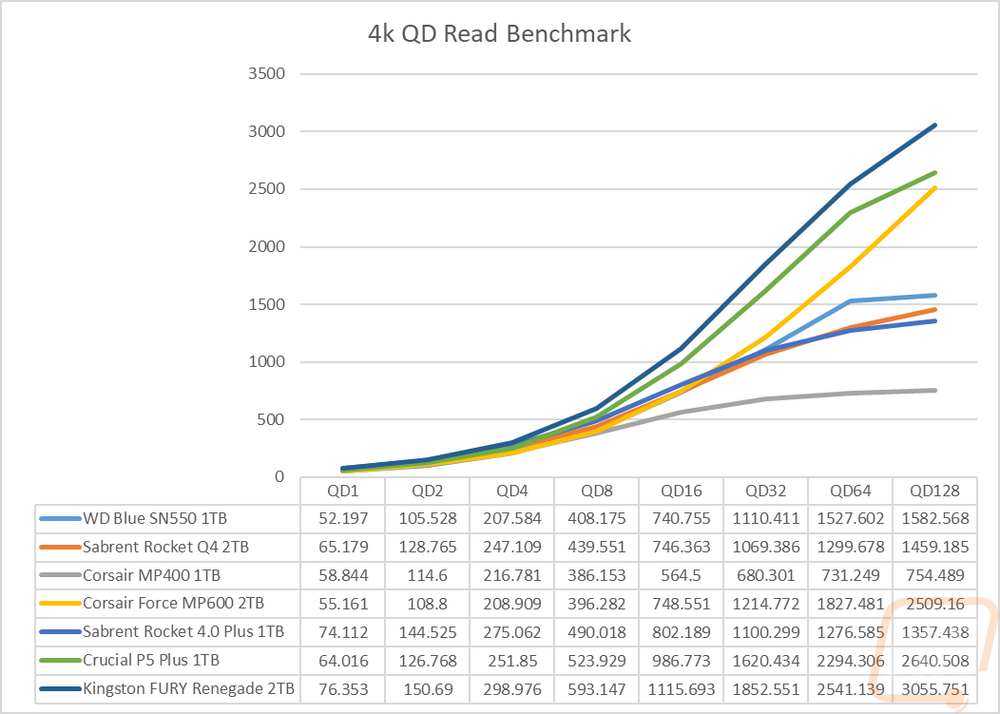
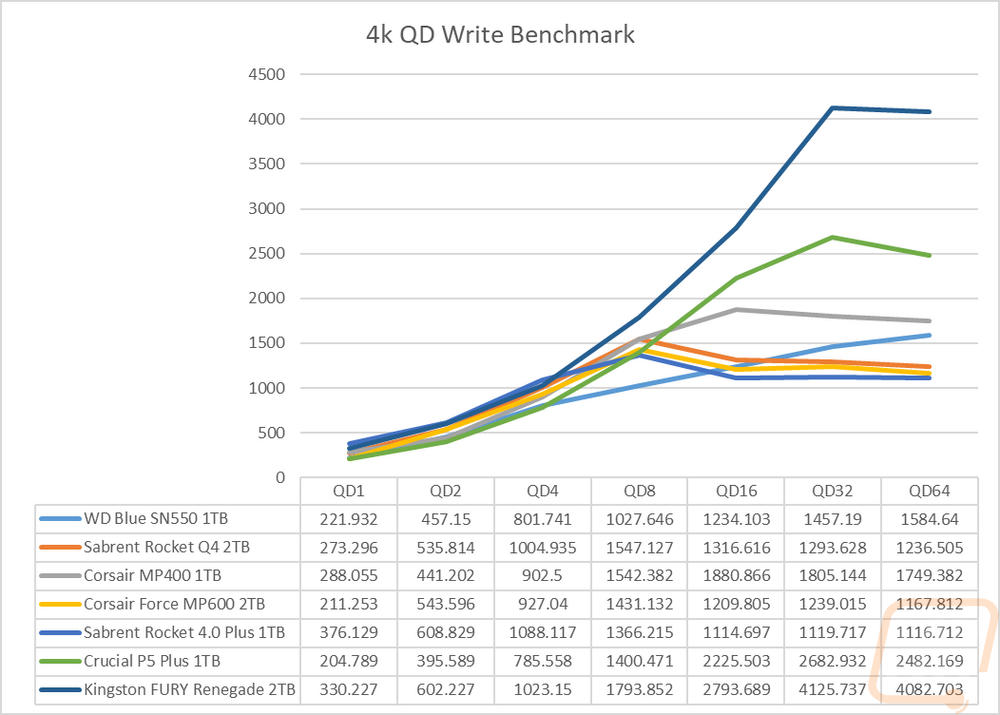
Sticking with Anvil’s Storage Utilities I did a few more tests. Here I wanted to check out how the drive would react to different queue depths so with the file size set to 4K I ran tests ramping up double each time starting at 1 and up to 128 for reads and 64 for writes. This lets us see if the controller gets overloaded. For the read queue depth tests the Renegade did well, being slightly faster at the lower end and ramping up consistently up to a queue depth of 16 then still improving but at a slower rate the rest of the way. The Renegade didn’t drop or level off however like a lot of the other drives. For the write tests, it ramped up doubling each time up until the 32 queue depth test and dropped slightly at a queue depth of 64 but as you can see the Renegade was so far ahead of the competition that they never got close.
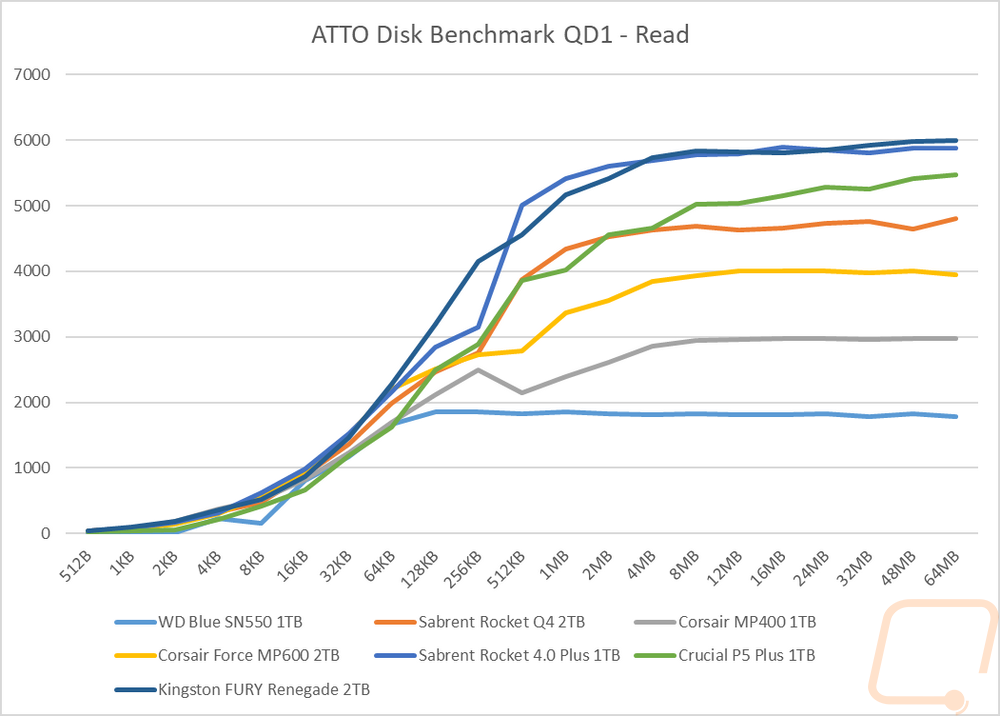
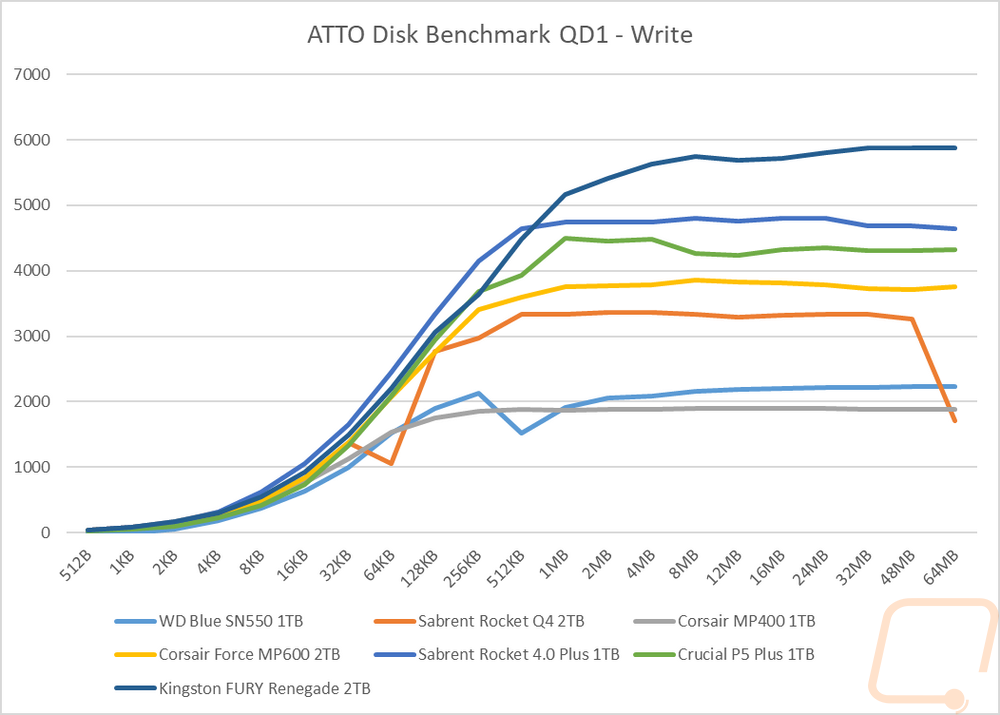
This next test is new in our test suite. I used ATTO Benchmark set to a queue depth of just 1 but ramped up the file size slowly to see how it would affect performance. Up until just before the halfway point at 256KB for the read tests the Renegade stayed out in front of the other drives but the Rocket 4.0 Plus did jump up ahead of it at 512KB and then they ran together from 4MB on. Up in the 6000 MB/s range. For the write results, it was the other way around. The Renegade was a little behind up until the mid way point where it jumps out in front of all of the other drives and is over 1000 MB/s faster than anything else from 1MB on up with the write results also being near 6000 MB/s.
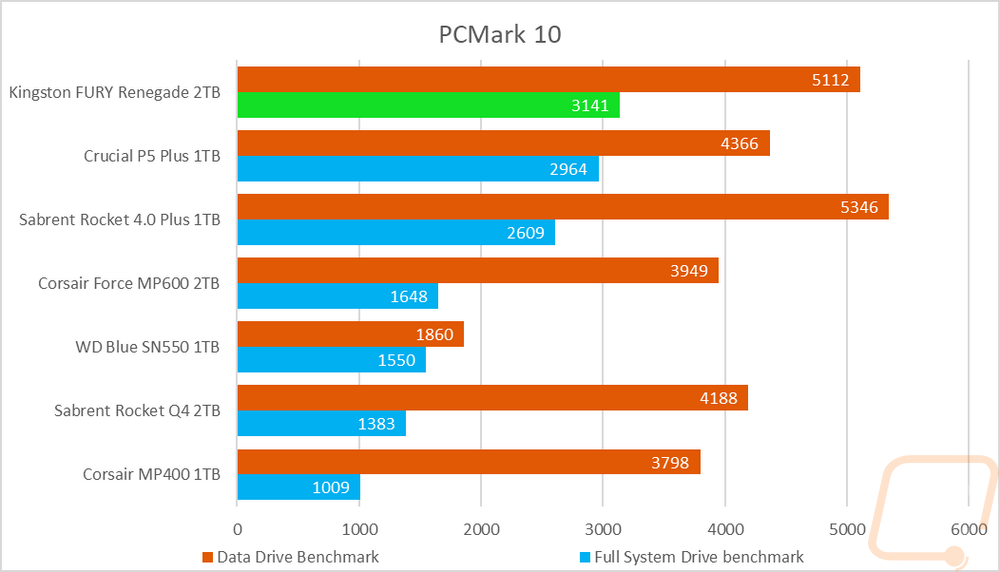
Next up I wanted to look at more real-world performance and for this, I started with PCMark 10 which has an overall full system benchmark for storage and then one focused on data storage drives. In the full system drive benchmark, the Renegade was at the top of the chart out ahead of the P5 Plus. But on the data drive benchmark the Rocket 4/0 Plus does pull ahead putting the Renegade in second.
Next, up for more real-world resting, I did our file transfer tests. You don’t get any more real-world than this. For each drive, I copied the folder filled with files to the drive tested and then back to the Rocket Q4 in our test bench. I used three file types, movies which are large single files, a folder filled with RAW and JPG photos, and then a folder filled with word documents. The Fury Renegade did well with the large movie files but was the second fastest drive tested. Moving them back to the PC on the other hand was at the top of the chart. For the mid-sized pictures, the P5 Plus and the Rocket 4.0 Plus were both a little faster than the Renegade but the drive did the best of the 4.0 drives when moving back to the PC. Then for the documents moving the files to the Renegade were slower, running closer to the 3.0 drives but again was fast moving the files back to the PC. Overall the Renegade was a little slower than expected in these tests, but when I say that I only mean in comparison to the other E18 drives. It is still a fast drive compared to the rest.
|
Windows 11 File Transfers |
Movies to Drive |
Movies to PC |
Pictures to Drive |
Pictures to PC |
Docs to Drive |
Docs to PC |
|
WD Blue SN550 1TB |
852 |
1360 |
937 |
1001 |
2.42 |
5.32 |
|
Sabrent Rocket Q4 2TB |
2720 |
2060 |
1140 |
1030 |
5.75 |
5.2 |
|
Corsair MP400 1TB |
2140 |
875 |
996 |
1410 |
2.57 |
5.98 |
|
Corsair Force MP600 2TB |
1250 |
1330 |
816 |
1320 |
2.83 |
5.48 |
|
Sabrent Rocket 4.0 Plus 1TB |
2120 |
2960 |
254 |
842 |
1.63 |
5.16 |
|
Crucial P5 Plus 1TB |
2060 |
2720 |
1030 |
1140 |
5.2 |
5.75 |
|
Kingston FURY Renegade 2TB |
2330 |
3220 |
857 |
1270 |
2.58 |
5.88 |
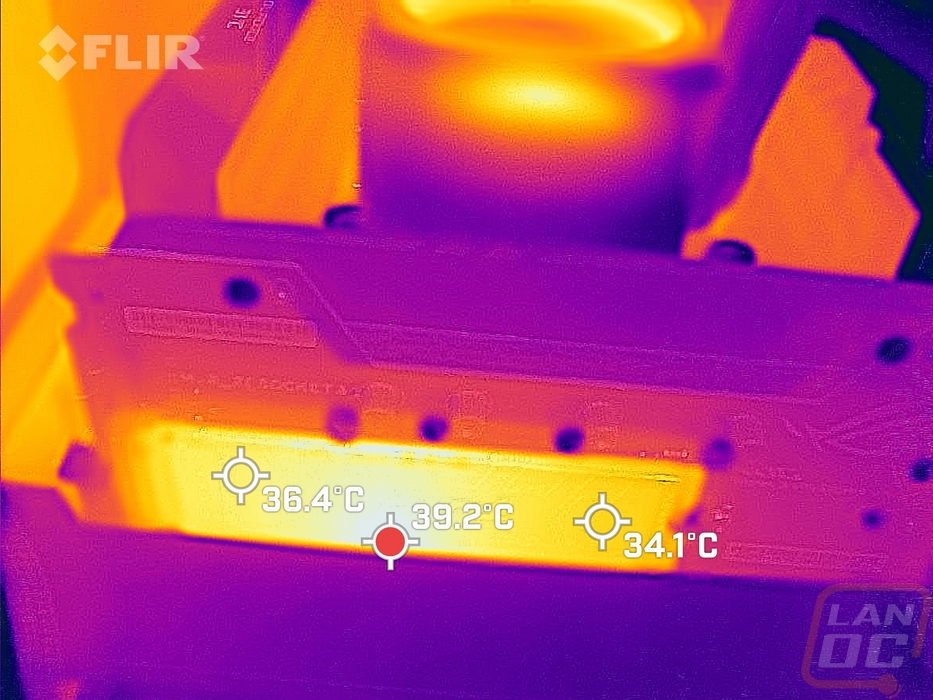
Last up I did take a look at the overall thermals of the Fury Renegade. For this I used out Flir and to heat things up I ran AIDA64’s disk benchmark with a linear read for 20 minutes. The metal backed sticker on the top of the drive does do a decent job of spreading the heat around as most of the drive has an even temperature. The hottest area is in the center of course near the controller but that is on the backside of the drive compared to this angle.