Synthetic Benchmarks
To start off my testing I always like to take a look at a few different synthetic benchmarks. These help give us a first look at overall performance. I also find that they are some of the best tests at comparing card to card. They don’t really translate to a specific FPS for in game performance, but I have those tests later. So for performance tests, I really like the 3DMark tests. They used to be branded under the Futuremark name but they are now from UL. But in addition to that, I take a look at the performance in Unigine Superposition. I like that benchmark because it is based on an engine that is used for other games and the test has a wide range of resolution and detail tests.
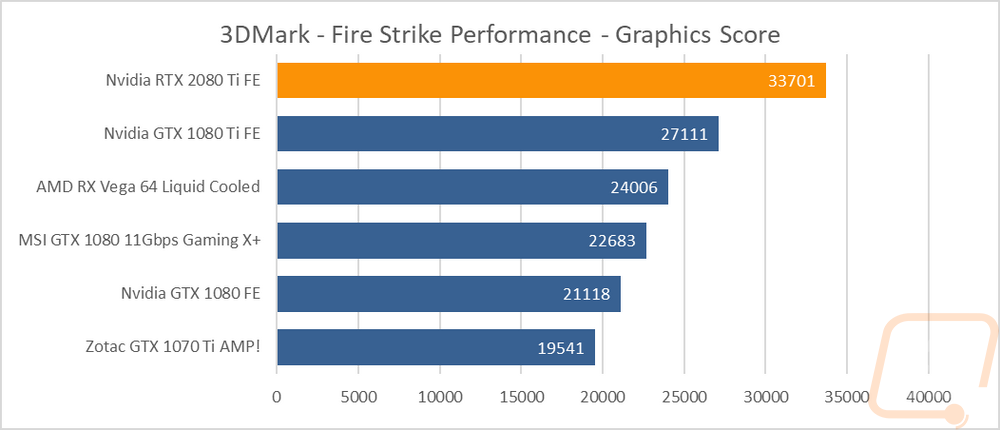
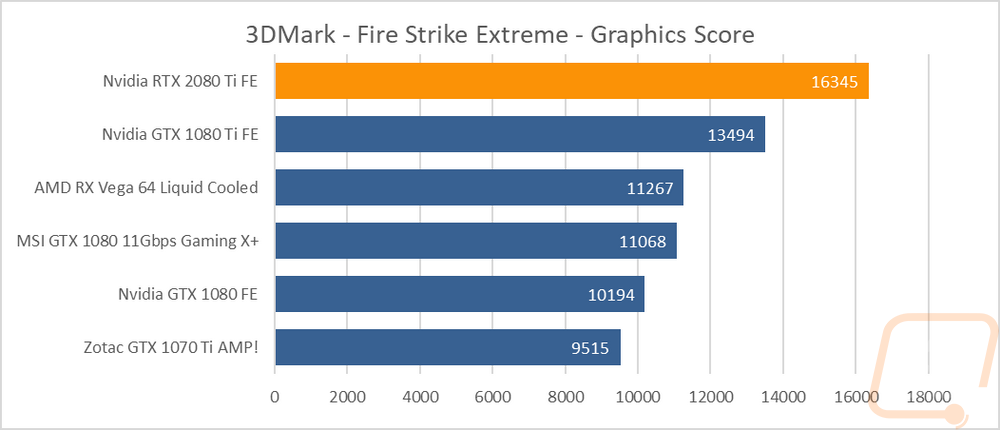
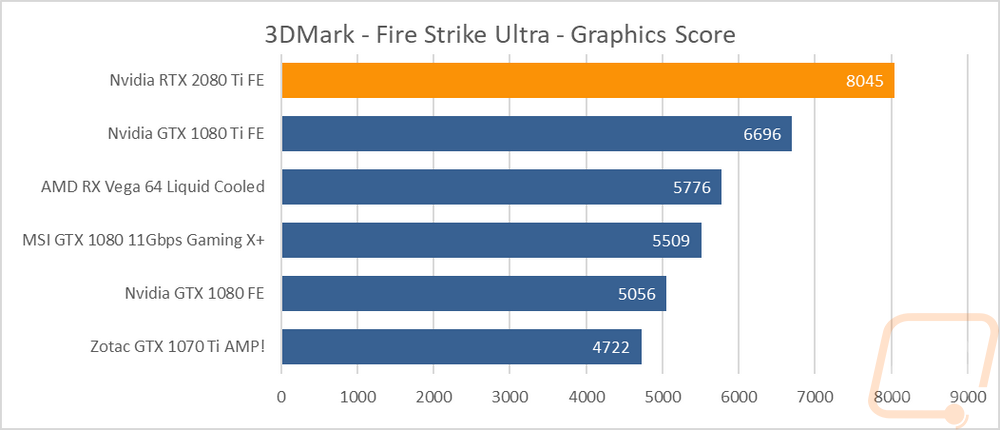
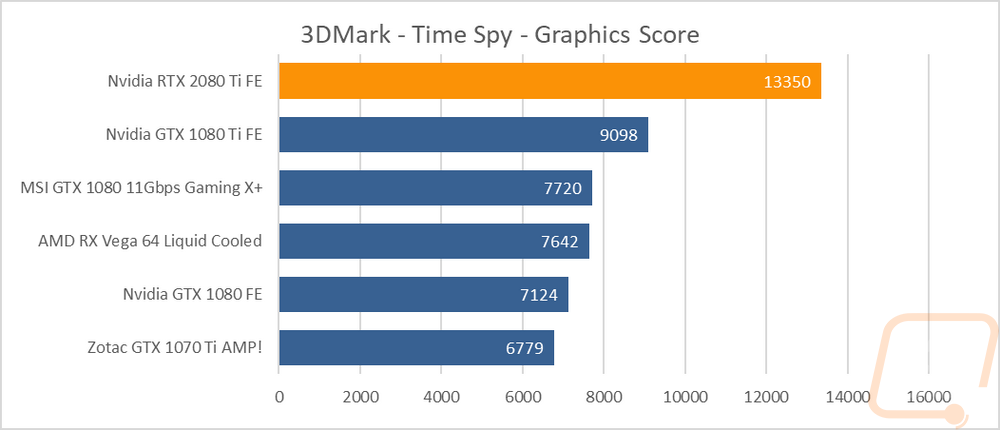
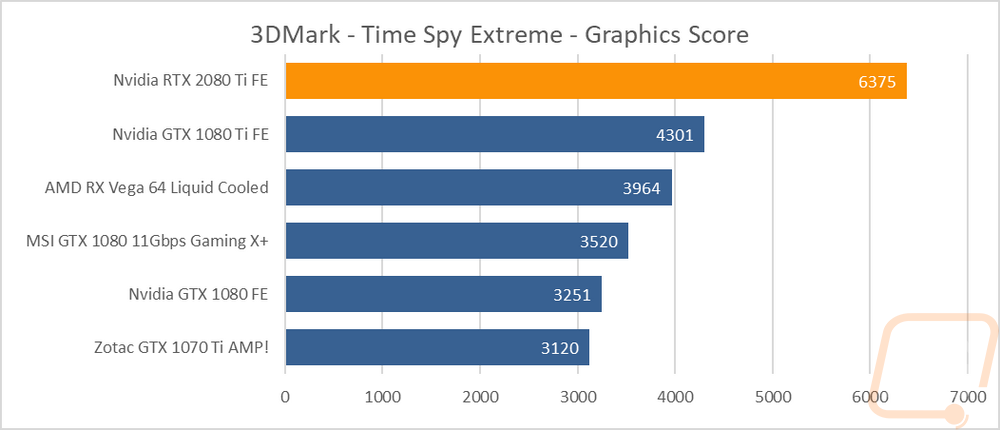
Starting with the 3DMark testing. I tested using the three available Fire Strike benchmarks. All three are DX11 based and they focus on 1080p for performance, 1440p for the extreme test, and then 4k for the ultra test. In all three tests, the RTX 2080 Ti really stood out against the previous generation cards. I took a look through and percentage wise the RTX 2080 Ti went up 24.3% in the performance test over the GTZX 1080 Ti, 21.1% in the extreme test, and 20.1% in the ultra test. That is a nice jump, but in the Time Spy and Time Spy Extreme tests that are DX12 focused the increase was a LOT better. Time spy jumped 46.7% and time spy extreme 48.2%. It is clear that while the number of Cuda cores went up, adding that asynchronous compute back into the picture is really making a difference in DX12 titles. This is where AMD has normally outperformed Nvidia and with DX12 being the future it is good to see Nvidia turn their focus to it.
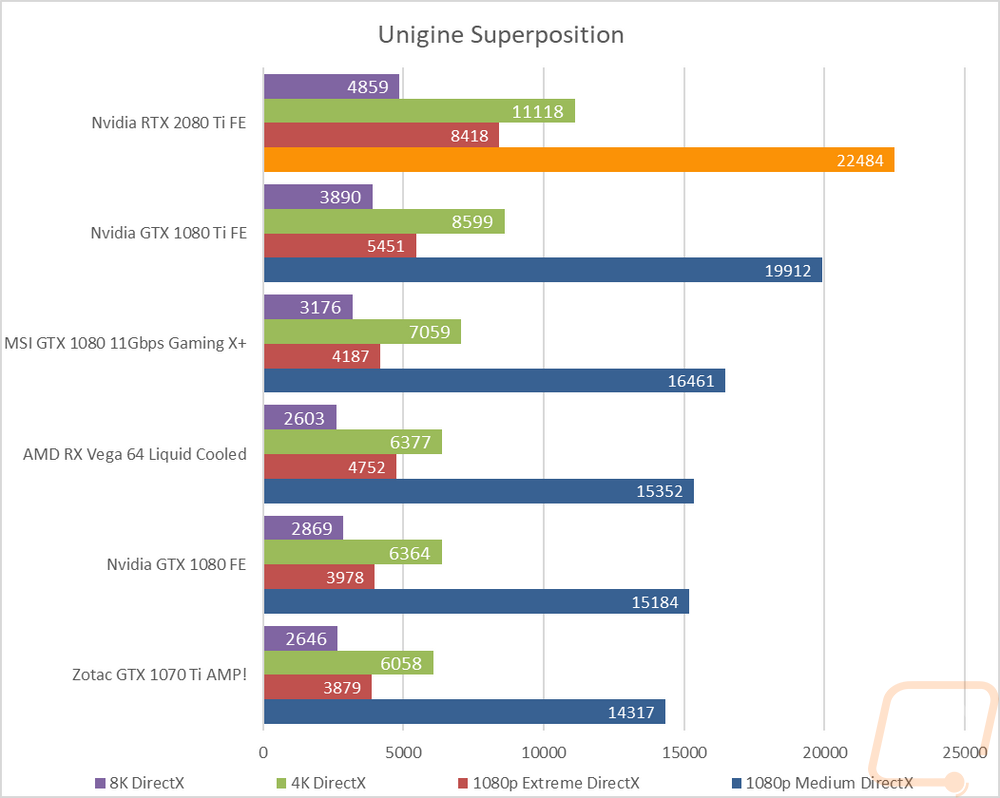
Now the Unigine Superposition results show right away that this is a DX11 title, it actually surprising that Unigine didn’t go with DX12 or Vulkan support for their newest test. Overall the performance jump from the GTX 1080 Ti to the RTX 2080 TI FE is good, but not out of this world good. That of course still puts the 2080 Ti at the top of the charts in every one of the tests.