In-Game Benchmarks
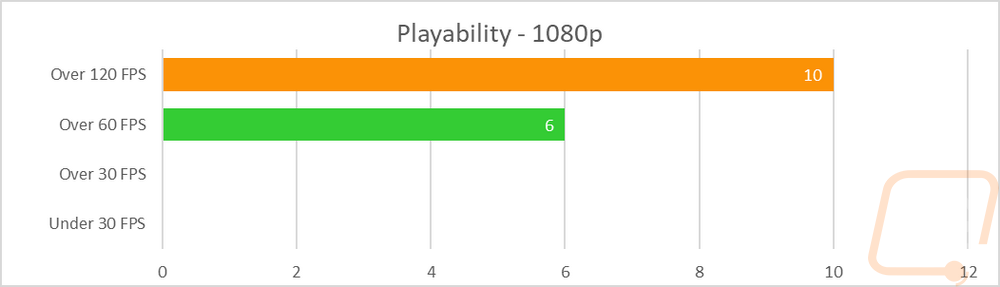
Now we finally get into the in game performance and that is the main reason people pick up a new video card. To test things out I ran through our new benchmark suite that tests 11 games at three different resolutions (1080p, 1440p, and 4k). I also slipped in a few variations on the same games for comparisons like DX11 to DX12, OpenGL to Vulkan, and a couple of games are just tested at their highest setting and lower but still high detail options to show the performance difference when things are turned down slightly. In total, each video card is tested 51 times and that makes for a huge mess of graphs when you put them all together. To help with that I like to start off with these overall playability graphs that take all of the results and give an easier to read the result. I have one for each of the three resolutions and each is broken up into four FPS ranges. Under 30 FPS is considered unplayable, over 30 is playable but not ideal, over 60 is the sweet spot, and then over 120 FPS is for high refresh rate monitors. This covers all of the games tested except Final Fantasy XV that we have a score rather than a FPS, because they like to be different.
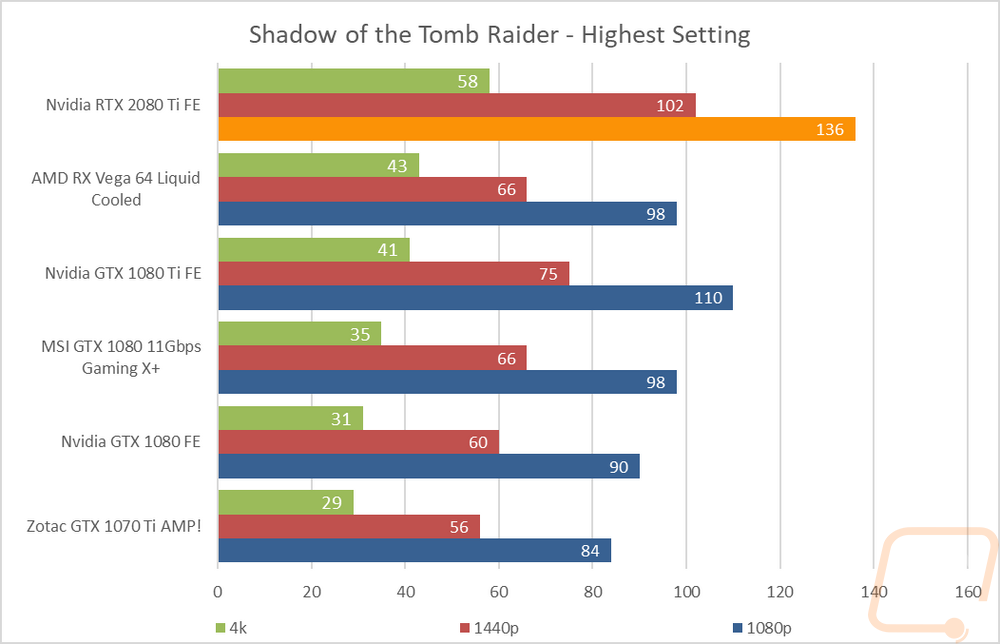
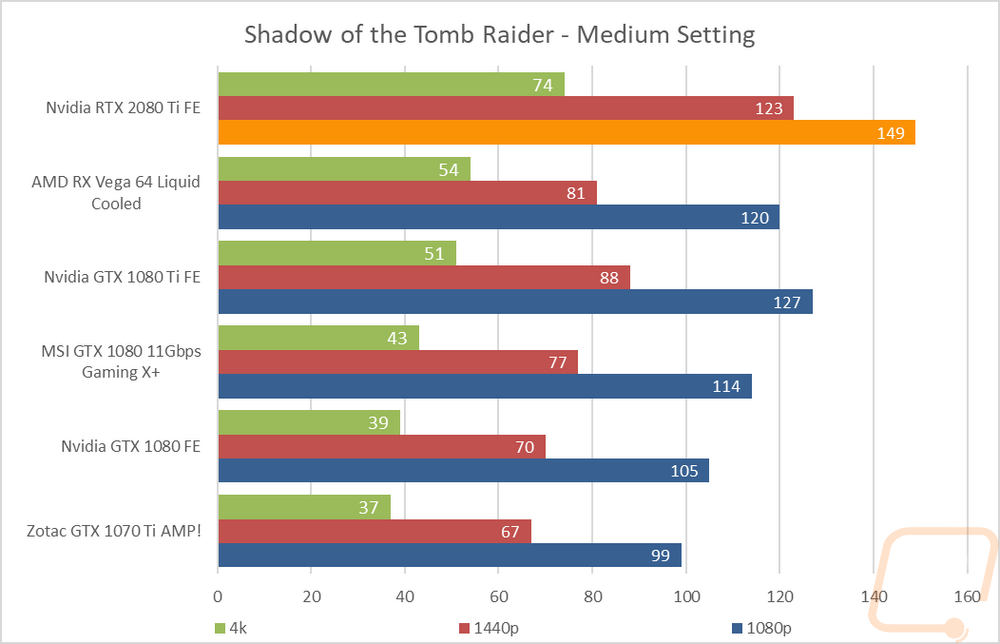
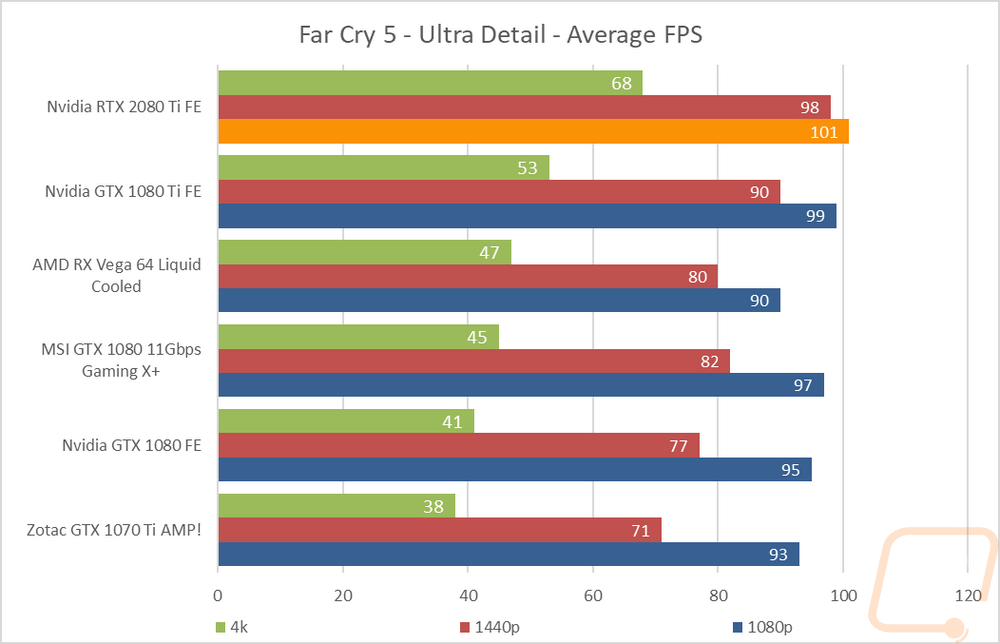
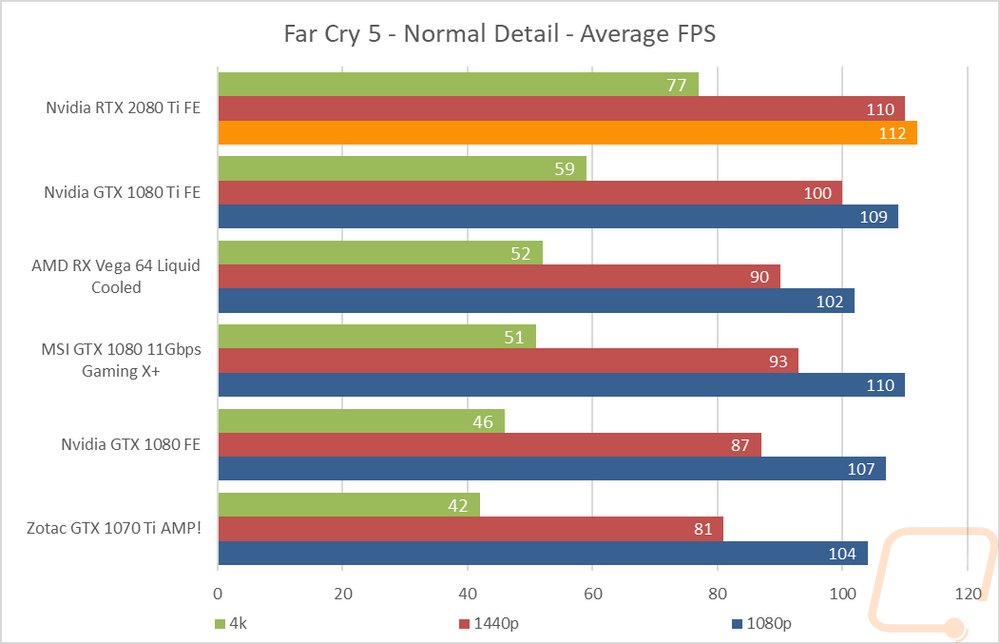
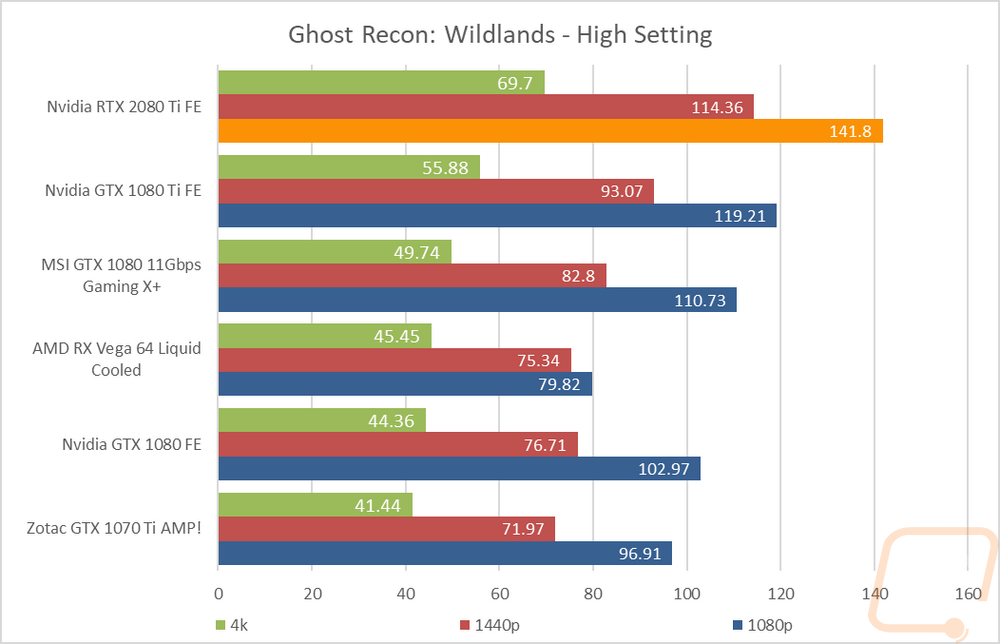
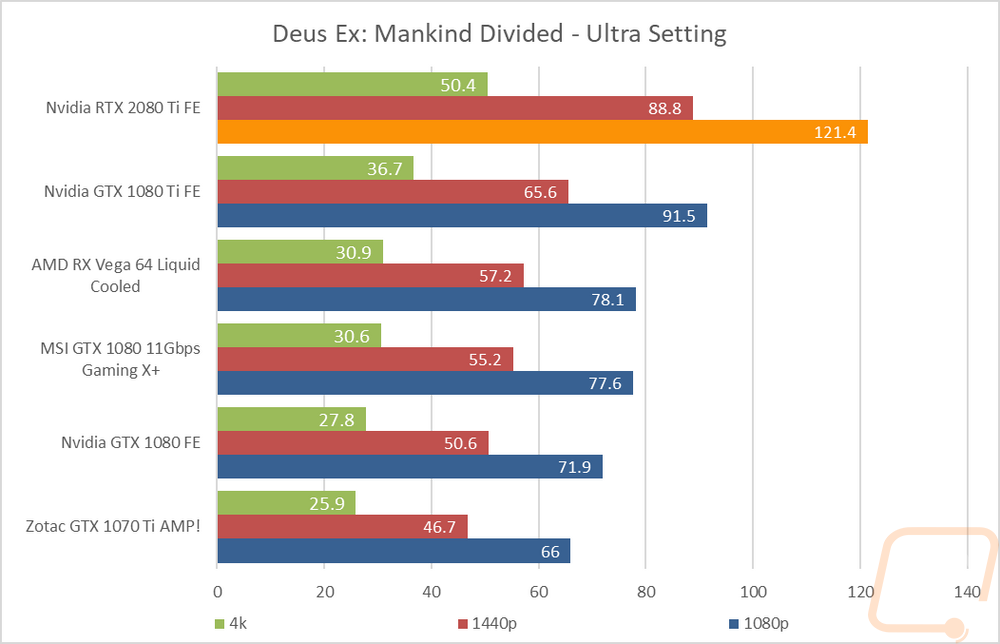
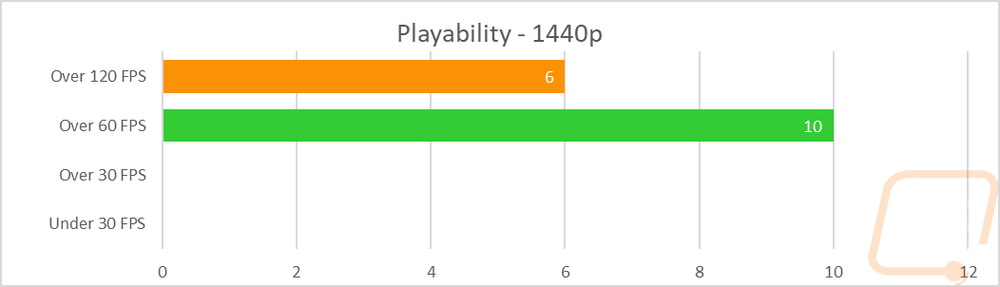
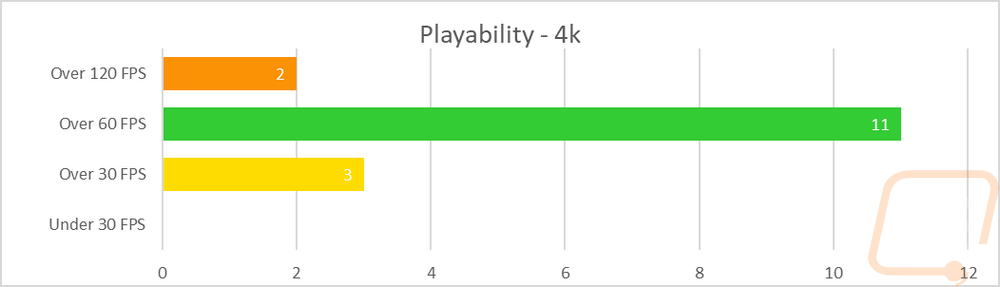
So how did the new RTX 2080 Ti perform? Well, let's just say you aren’t going to have trouble playing any games anytime soon. When looking at the 1080p results everything was above 60 FPS, but a majority were in the 120 FPS or higher range. Really this doesn’t show the whole picture, most of the 60+ results were actually in the 100-119 range. 1440p was the same, everything in the sweet spot of 60 FPS or higher with a lot in the 120+ FPS range. Then there is 4k, this is the range I was most curious about. Can we finally take advantage of the higher refresh 4k monitors? Well yes, 4k60 is basically where this card shines. There were a few results just a hair under 60 FPS (Deus Ex, Wildlands, and Shadow of the Tomb Raider). SotTR came in at 58, and all three only came in less than 60 FPS on their highest possible detail settings. Running high rather than ultra is about all you need to keep these averaging above 60 FPS as well.
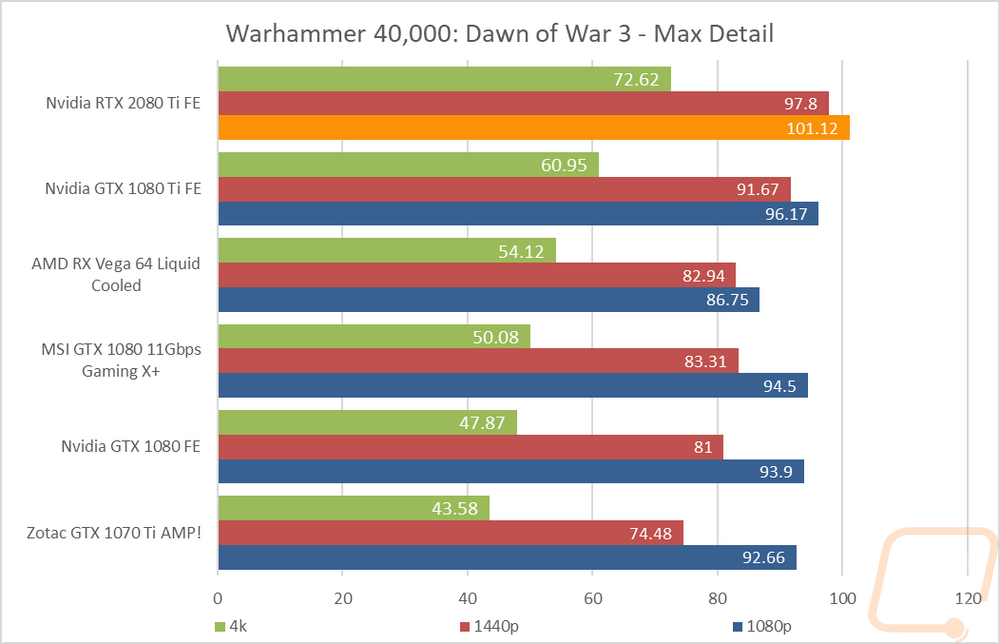
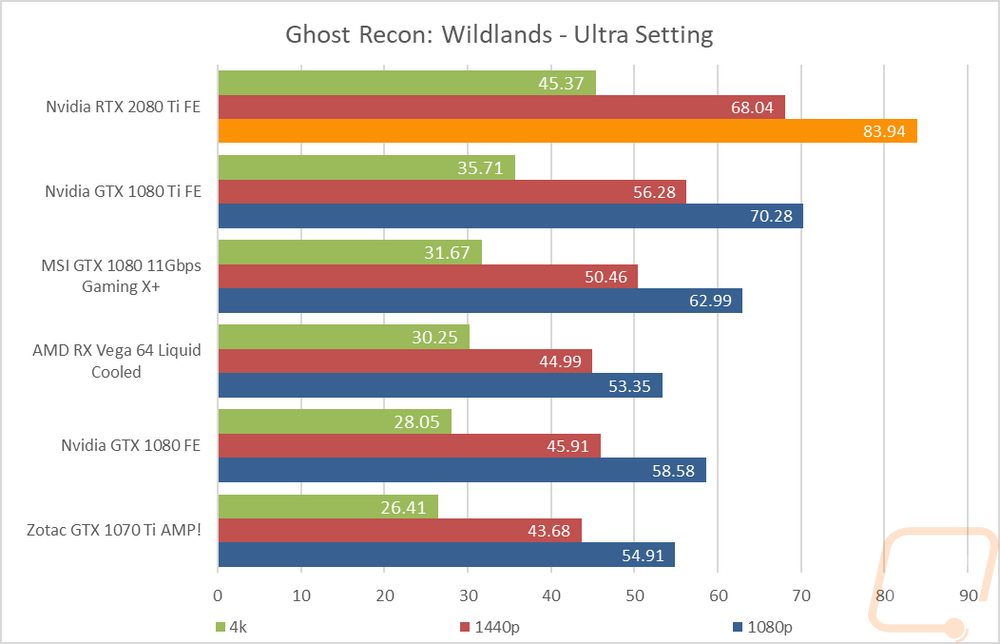
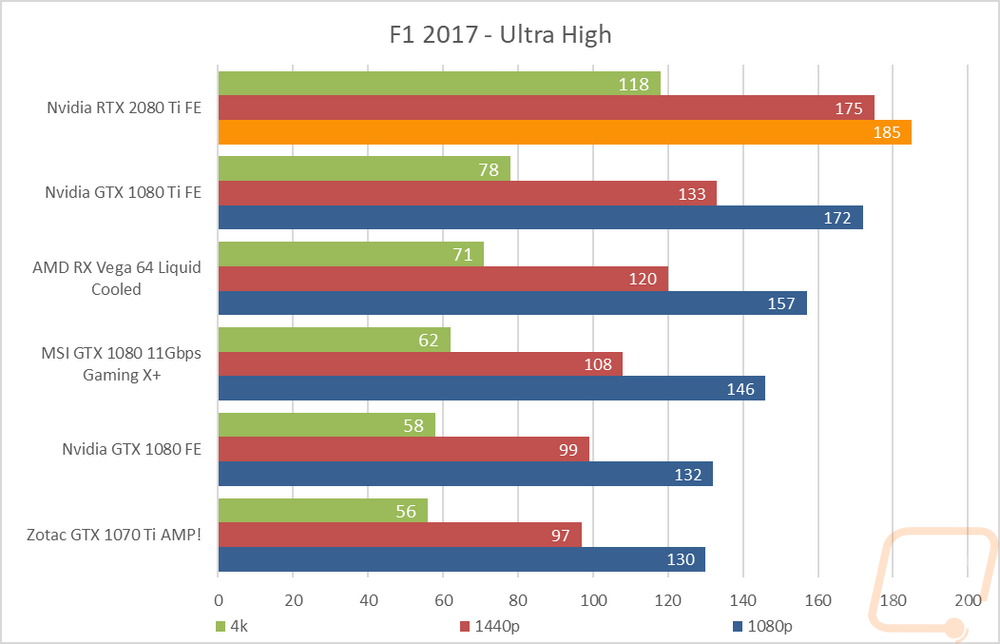
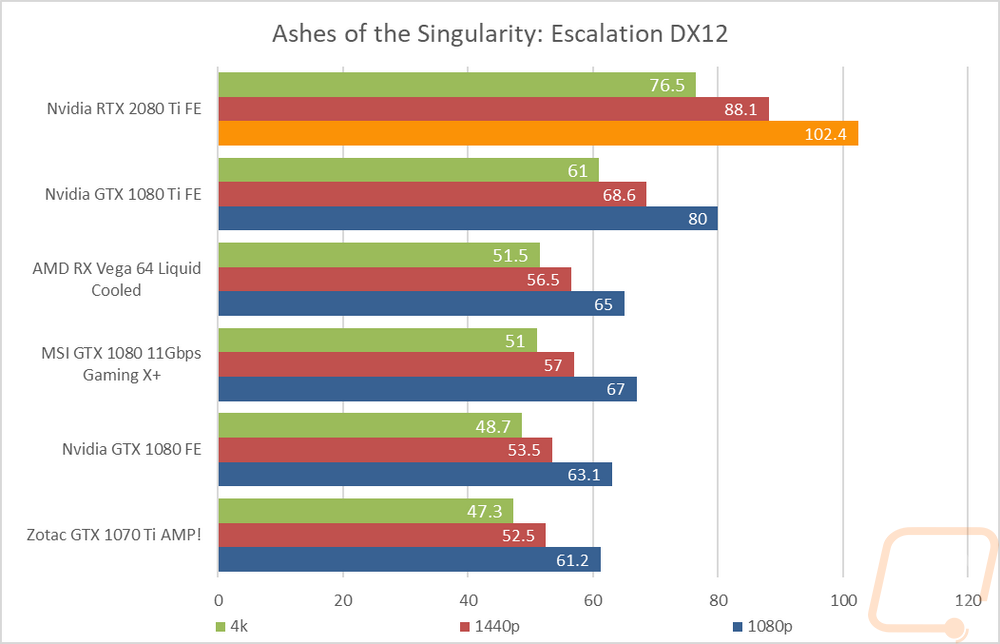
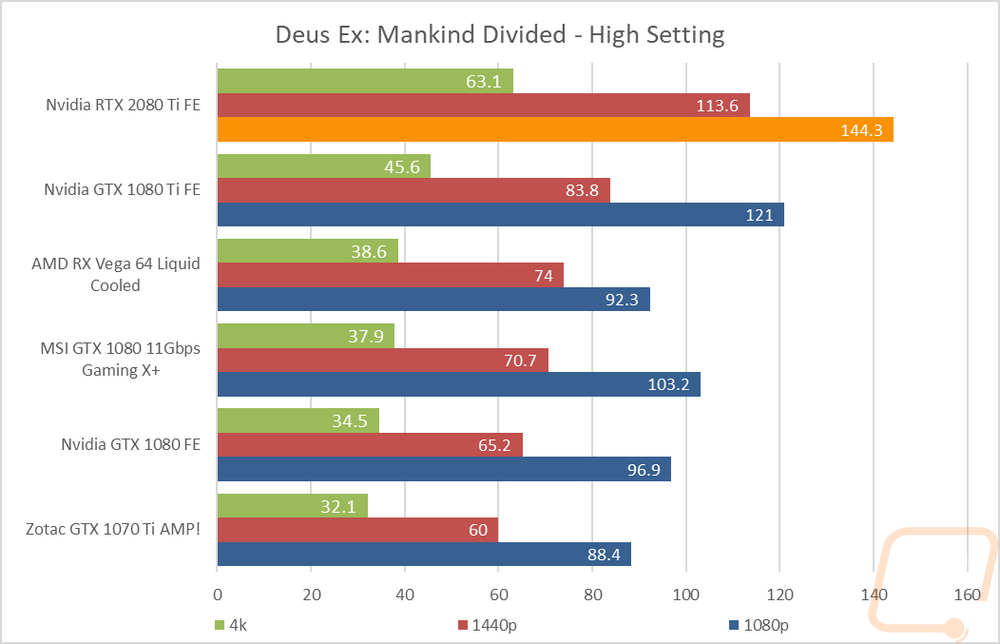
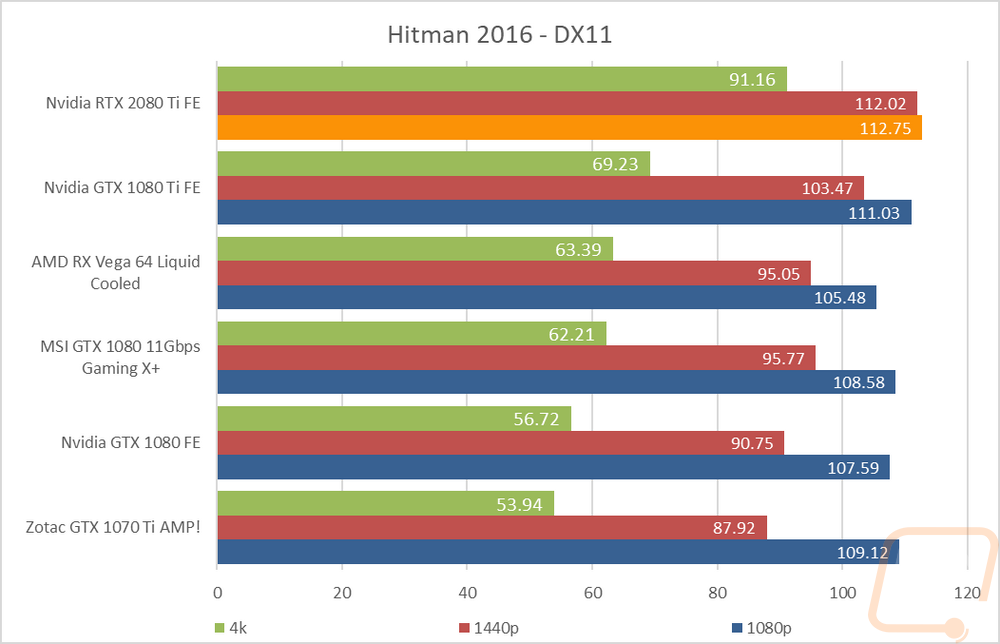
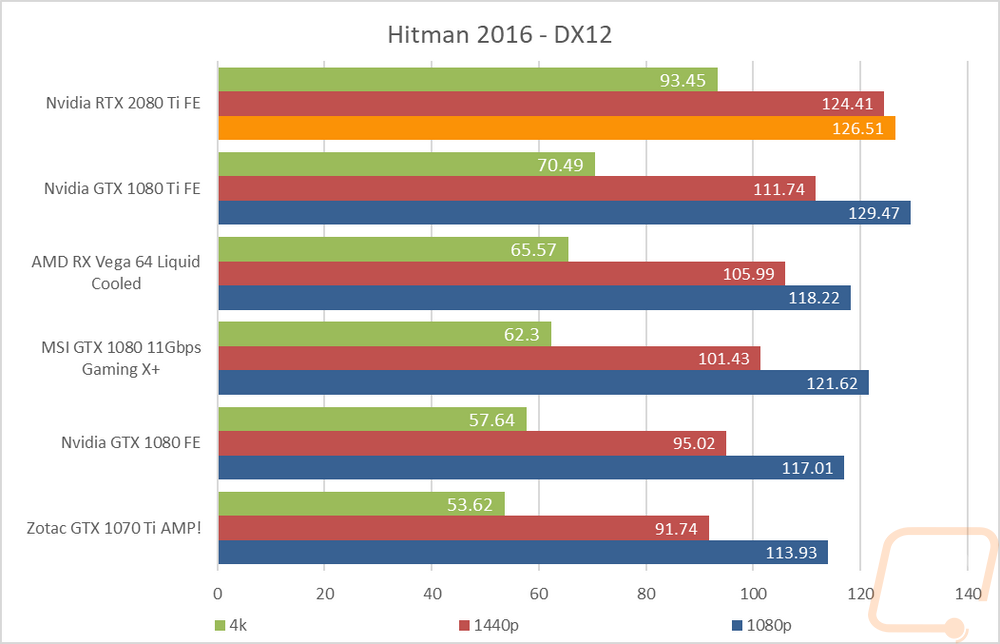
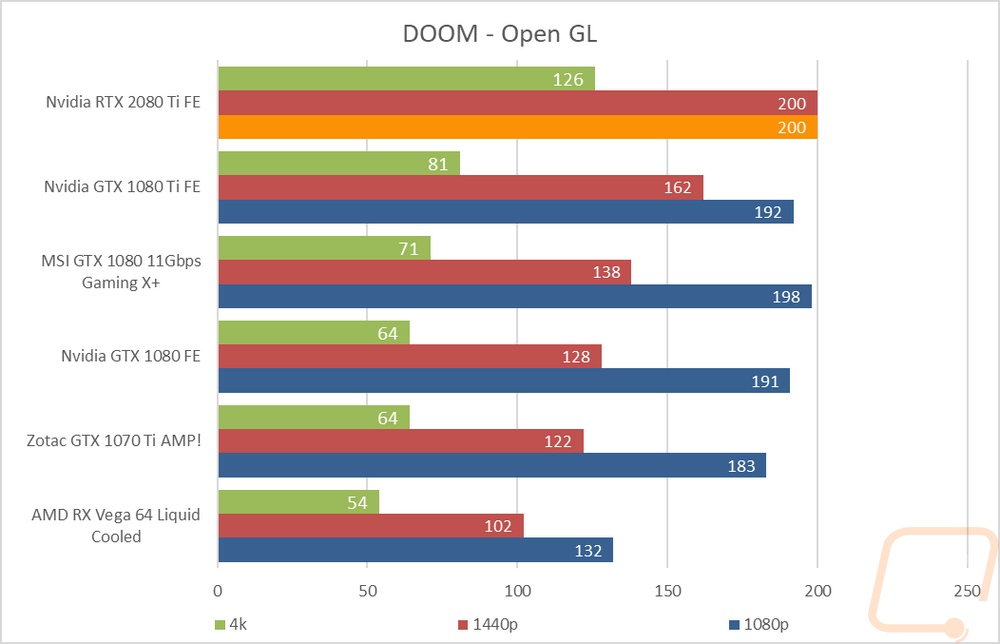
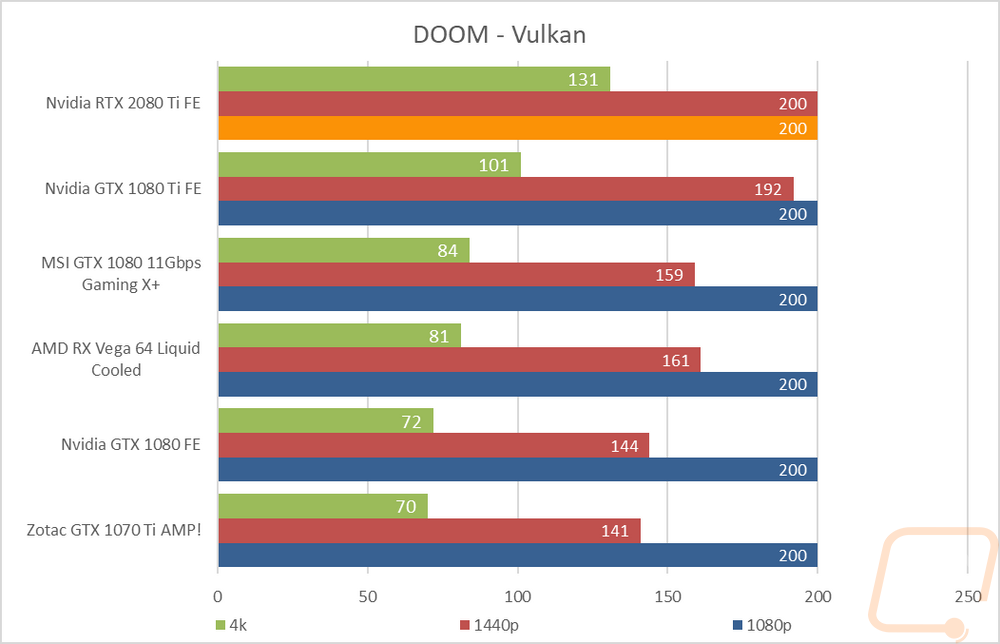
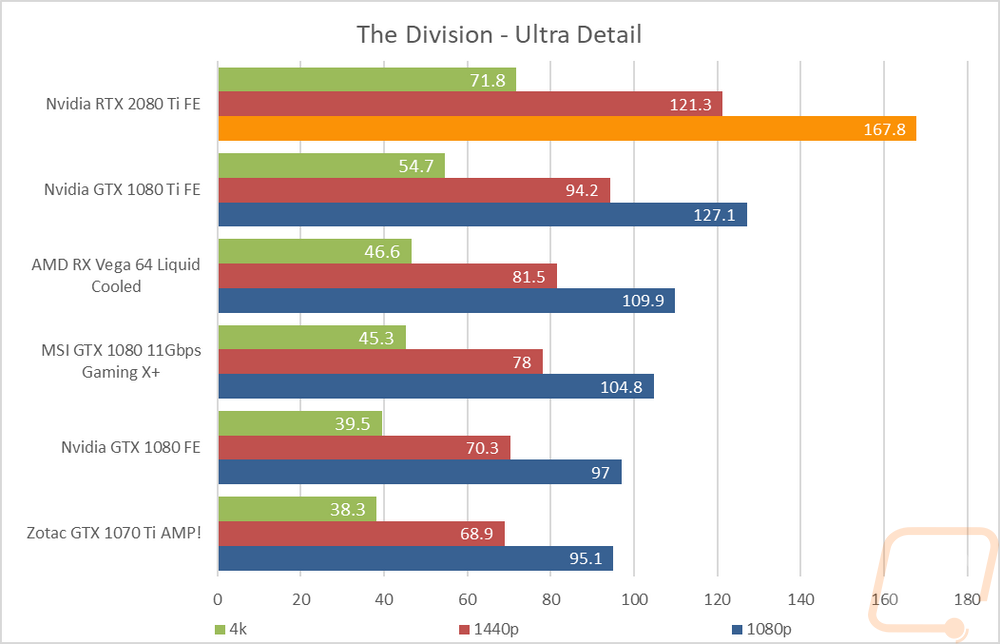
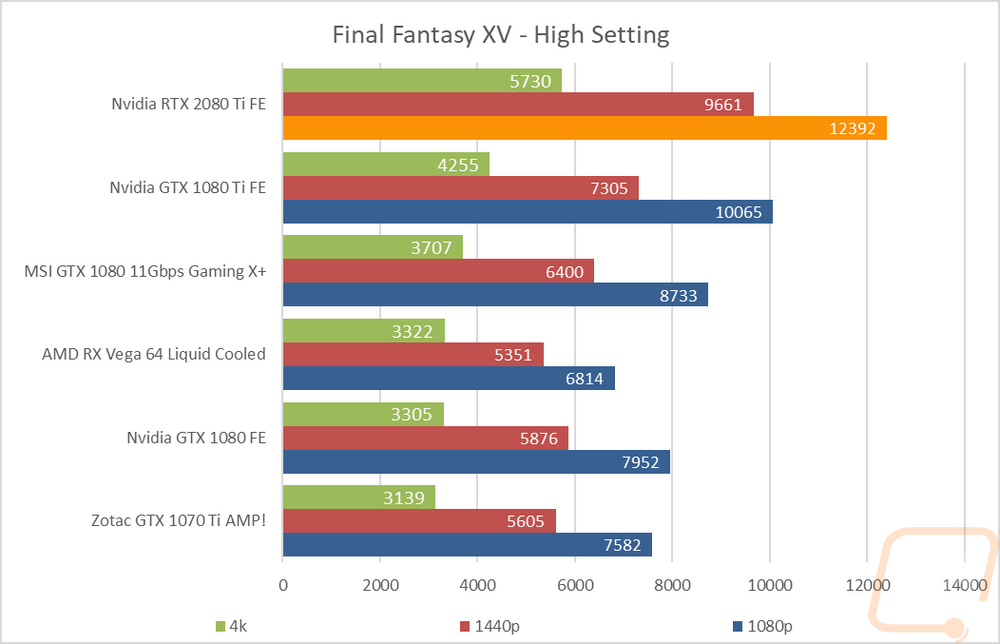
Of course, I did include all of our normal graphs as well. I wouldn’t just leave you with our roundup numbers. I just think the 51 results per card across 6 cards takes a crazy man or woman to dig through (like me). So does anything stand out, good or bad? Well for starters, the RTX 2080 Ti FE tops the charts in every single game. There were a couple results like Hitman DX12 at 1080p where the 1080 Ti was faster, but the 2080 Ti did really well. Especially in the 4k results. Most of the games are DX11 and like in 3DMark the 2080 Ti is ahead but not in proportion to the increase in price.
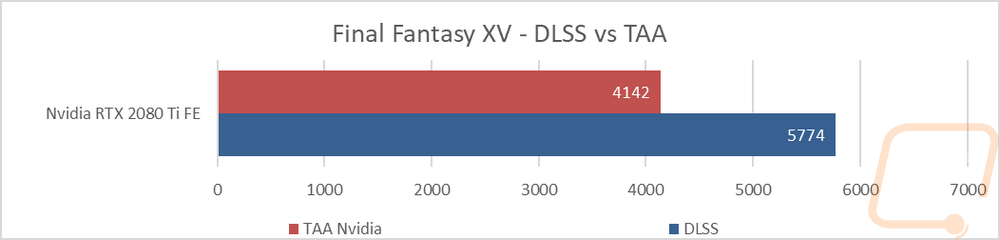
Before all of the other charts, I did want to touch on the Final Fantasy tests at the top here. The test I ran all of the cards through showed about what you would expect. In line with all of the other games. But I also went back and tested the RTX 2080 Ti with a test that Nvidia sent out. I normally don’t do this, but right not it is the only look at DLSS. The test was set up entirely by them with bin files to run so I don’t even know what the TAA or DLSS settings are, so keep that in mind. They set it up to show the same level of detail and I can confirm that they did look the same when watching them run. The end result shows the performance gap you could potentially see by using DLSS that uses the new deep learning tensor cores. The overall jump was 39.4%, I will also be testing this on the RTX 2080 as well, but I am not including this in our benchmark suite. I may make our own test later when the FFXV test is updated to support DLSS.
Here are the rest of the results, enjoy!