In-Game Benchmarks
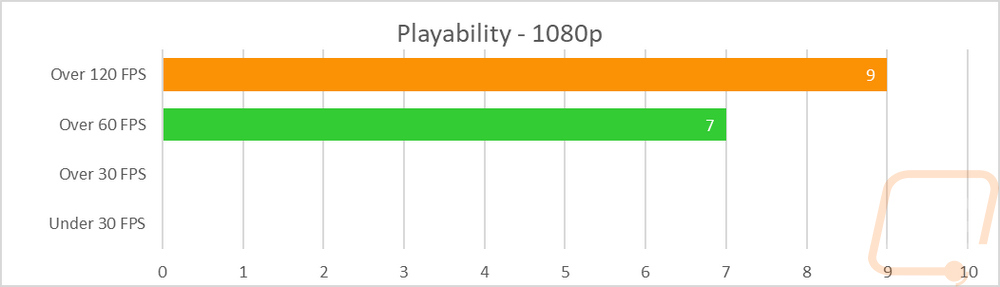
Now we finally get into the in game performance and that is the main reason people pick up a new video card. To test things out I ran through our new benchmark suite that tests 11 games at three different resolutions (1080p, 1440p, and 4k). I also slipped in a few variations on the same games for comparisons like DX11 to DX12, OpenGL to Vulkan, and a couple of games are just tested at their highest setting and lower but still high detail options to show the performance difference when things are turned down slightly. In total, each video card is tested 51 times and that makes for a huge mess of graphs when you put them all together. To help with that I like to start off with these overall playability graphs that take all of the results and give an easier to read the result. I have one for each of the three resolutions and each is broken up into four FPS ranges. Under 30 FPS is considered unplayable, over 30 is playable but not ideal, over 60 is the sweet spot, and then over 120 FPS is for high refresh rate monitors. This covers all of the games tested except Final Fantasy XV that we have a score rather than a FPS, because they like to be different.
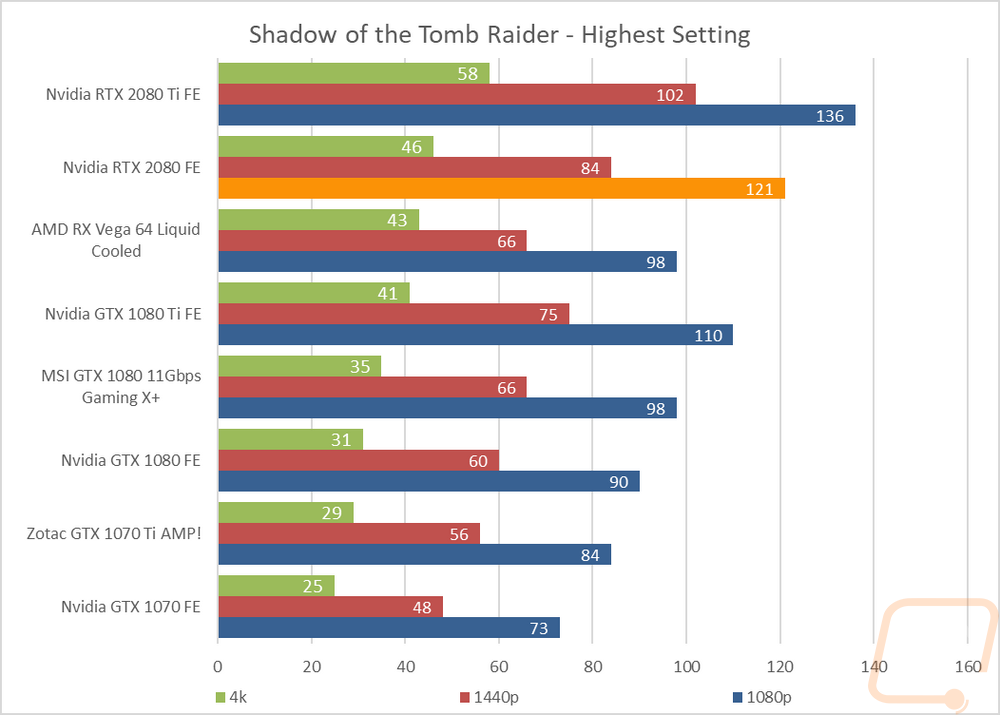
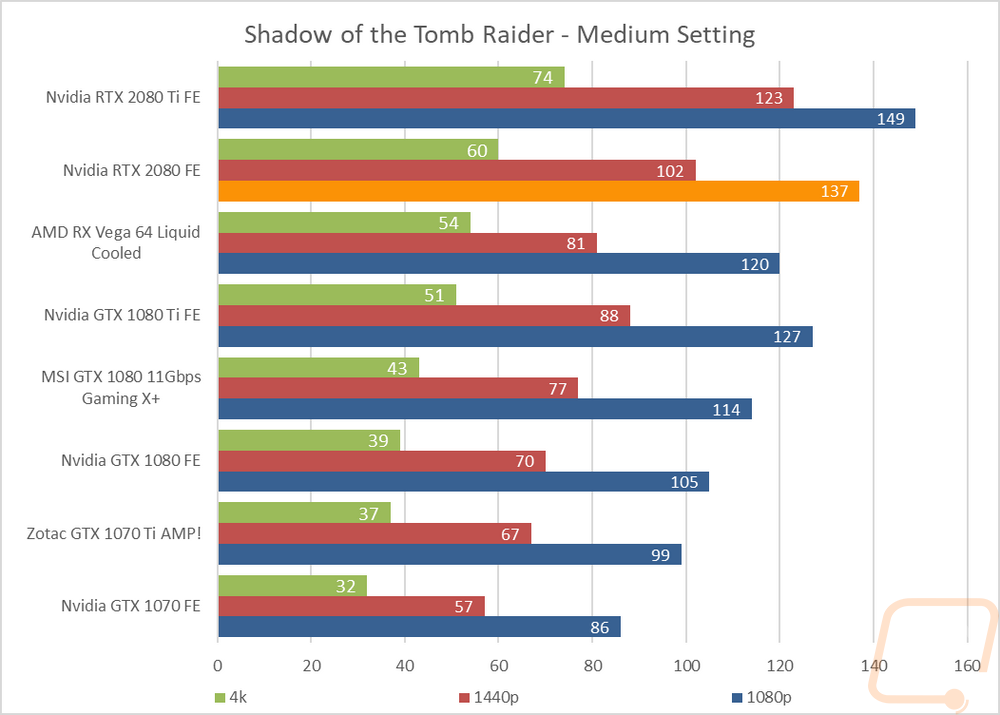
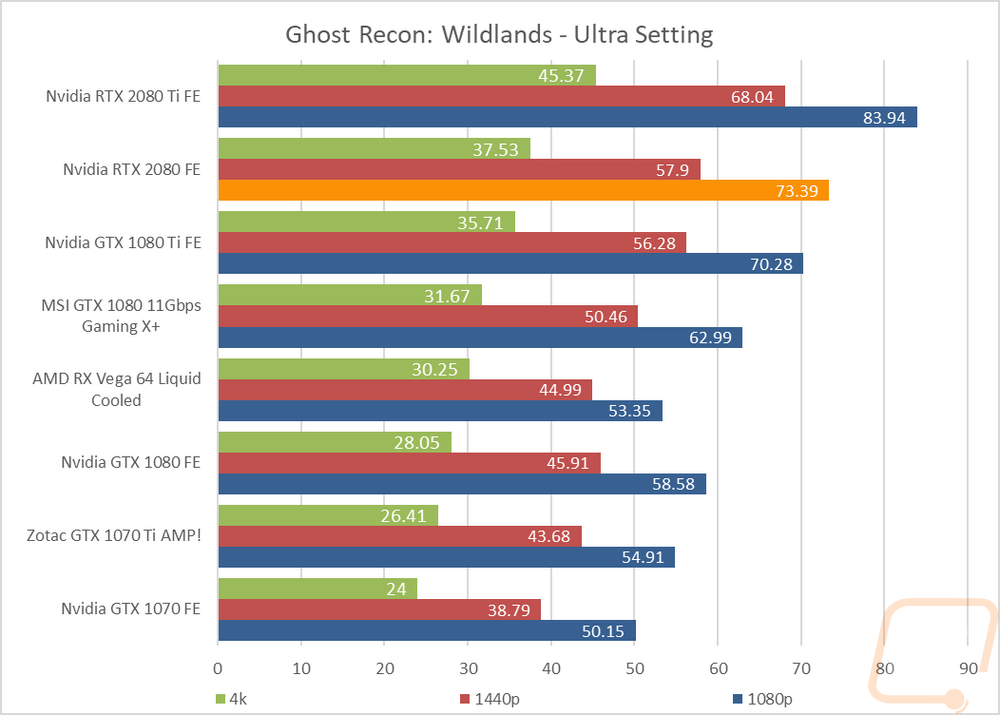
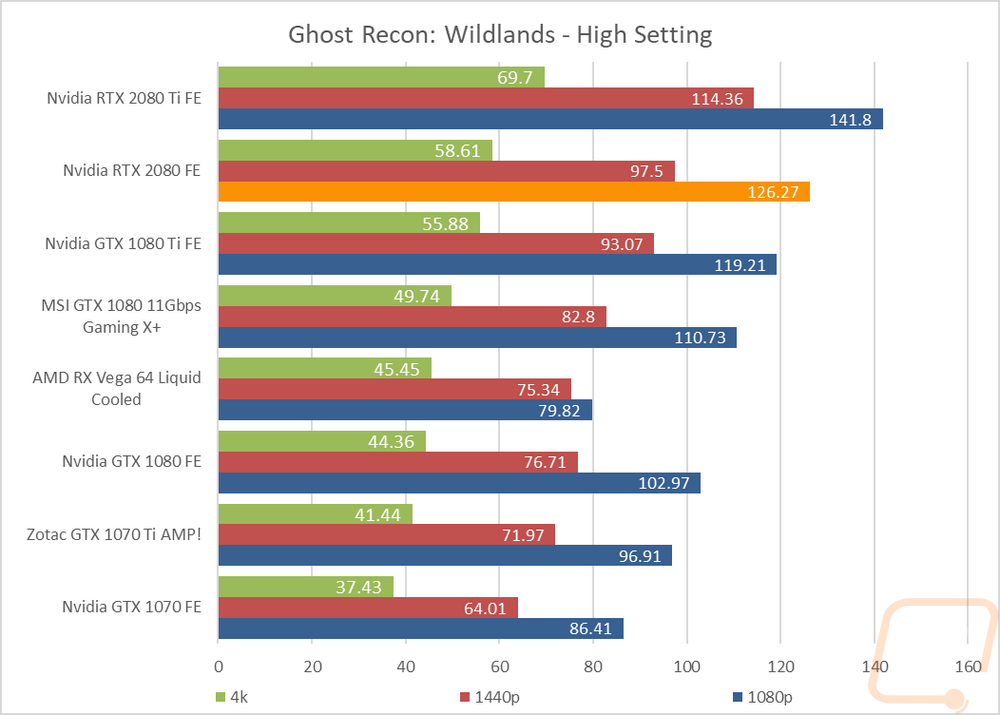
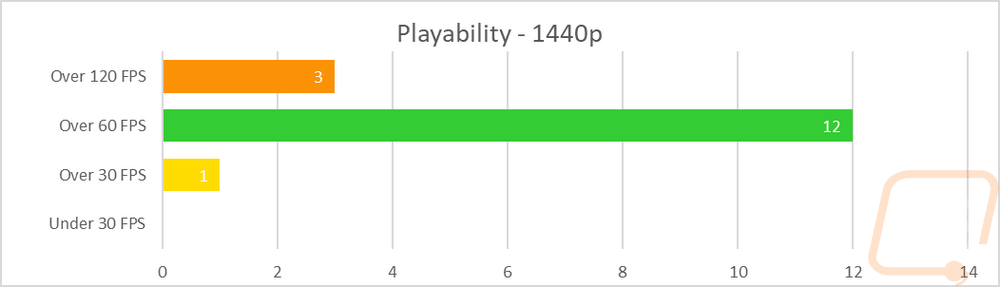
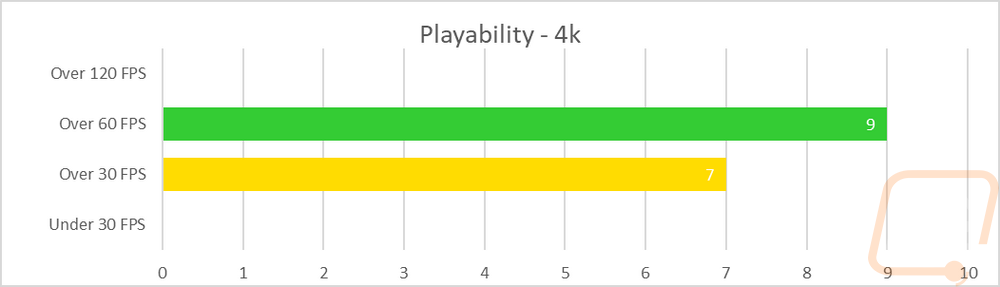
So how did the new RTX 2080 FE perform? Well at 1080p, even with nearly all of our tests running at their highest detail nothing caused any hiccups. At that resolution, a majority of the games would be silky smooth on high refresh rate monitors. At 1440p only one game came in at below 60 FPS and that was Wildlands at its highest detail and it only barely came in below that with its 57.9 FPS. Then at 4k you finally start to find more games that aren’t averaging over 60 FPS. Basically, the RTX 2080 FE will play any 4k game at their highest settings, but you may have to turn the detail down to high, not ultra if you want 4k60 like what the RTX 2080 Ti was capable of.
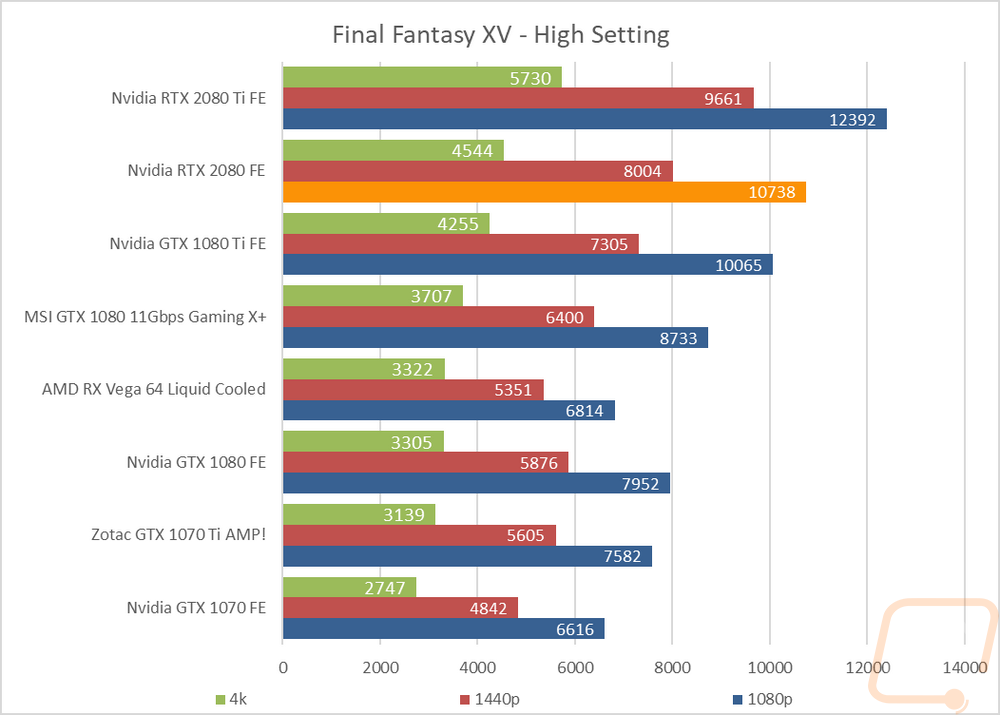
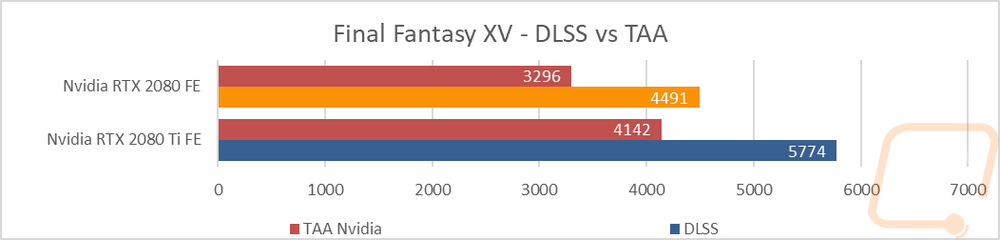
I have the Final Fantasy results up here at the top because I couldn’t include them in the roundup results with an FPS. More importantly, I also have them up here because in addition to our normal test I also ran the test that Nvidia provided that compares DLSS to TAA. They set it all so the setting details weren’t available, but I can confirm that both runs looked the same. DLSS does seem to open up performance possibilities when it is available without losing any fidelity.
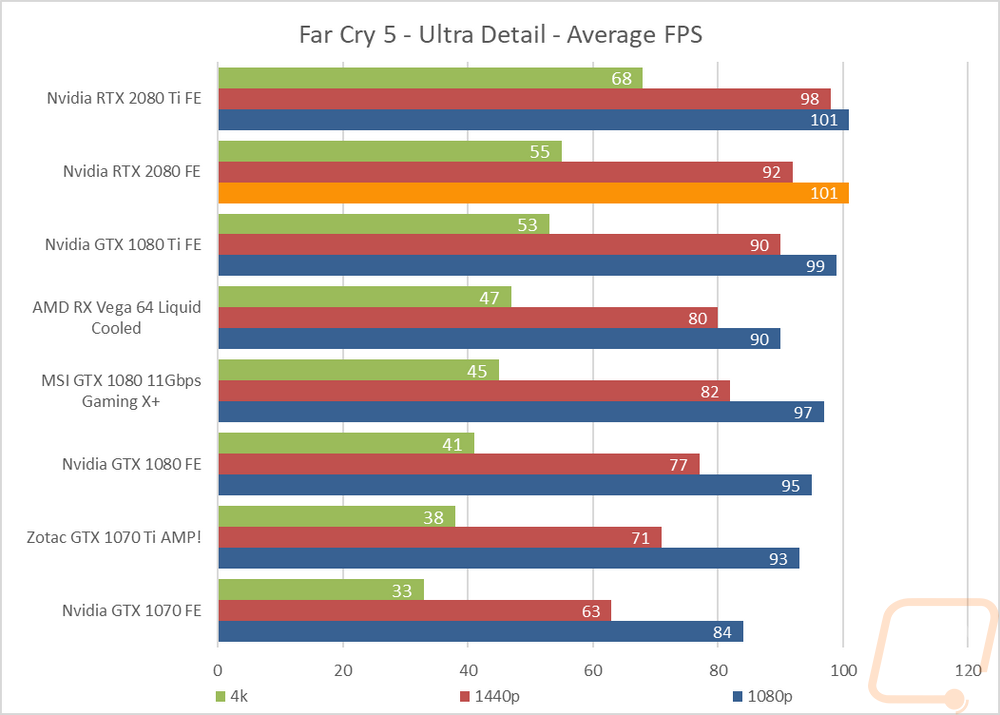
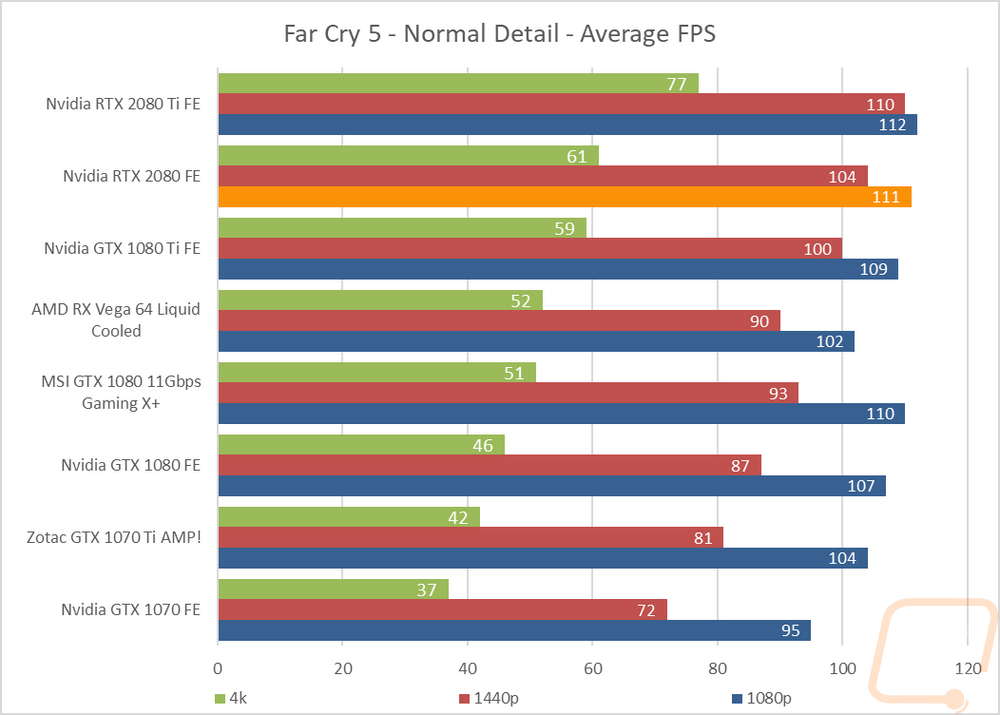
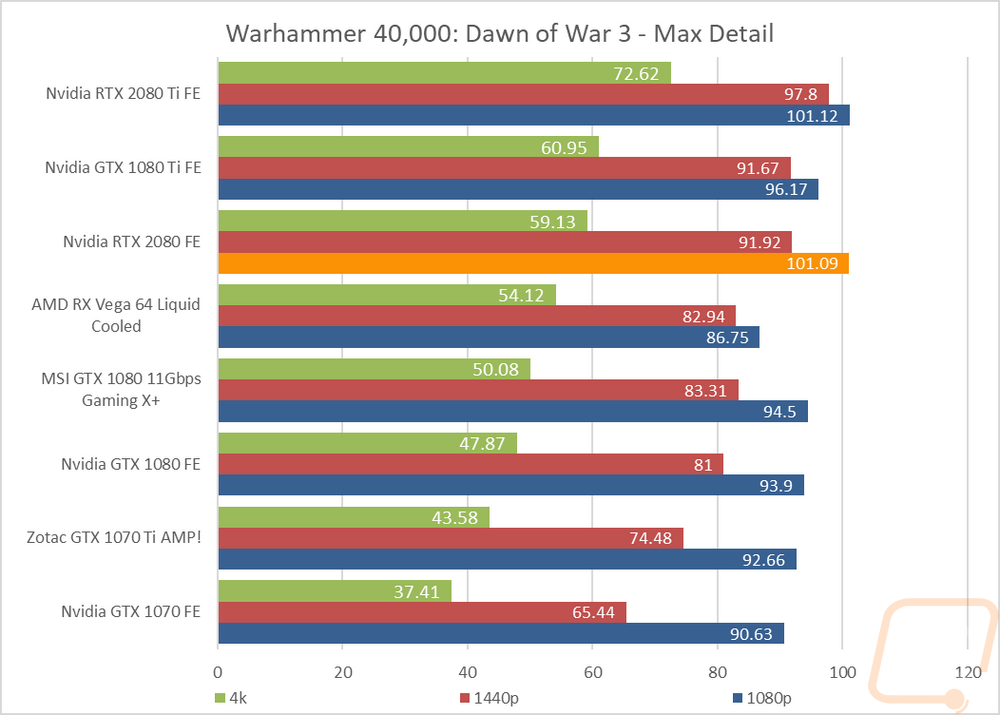
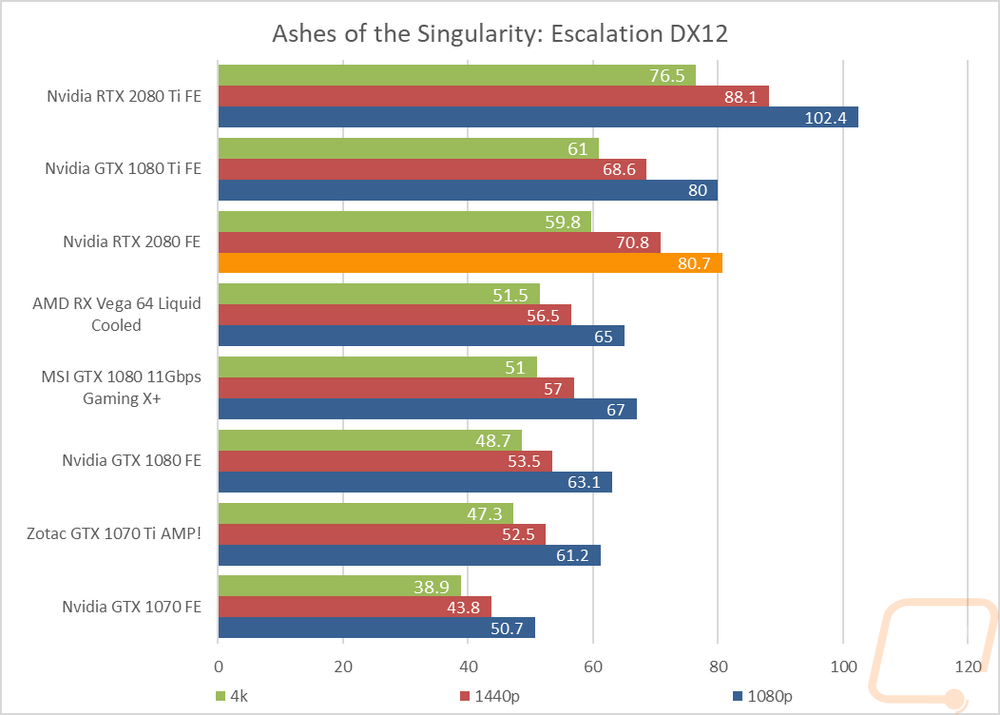
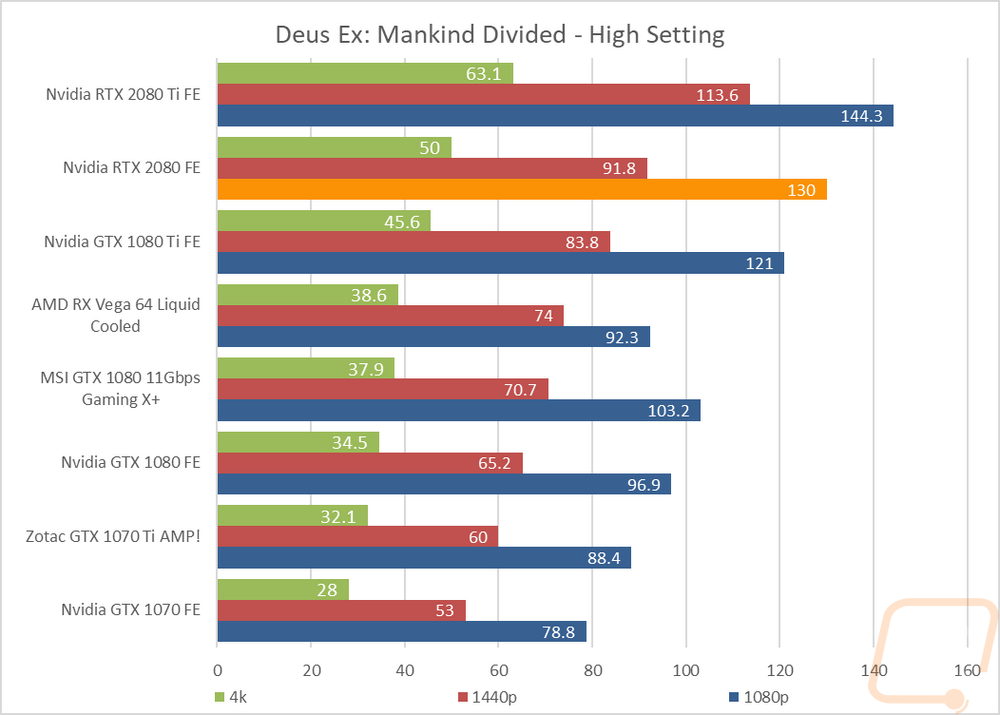
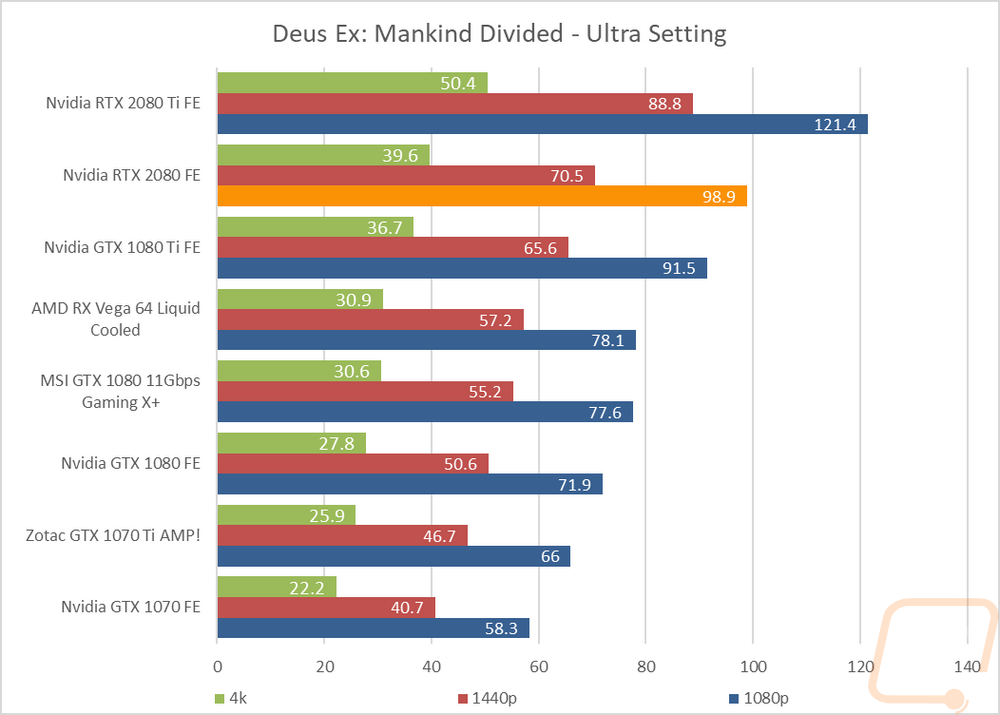
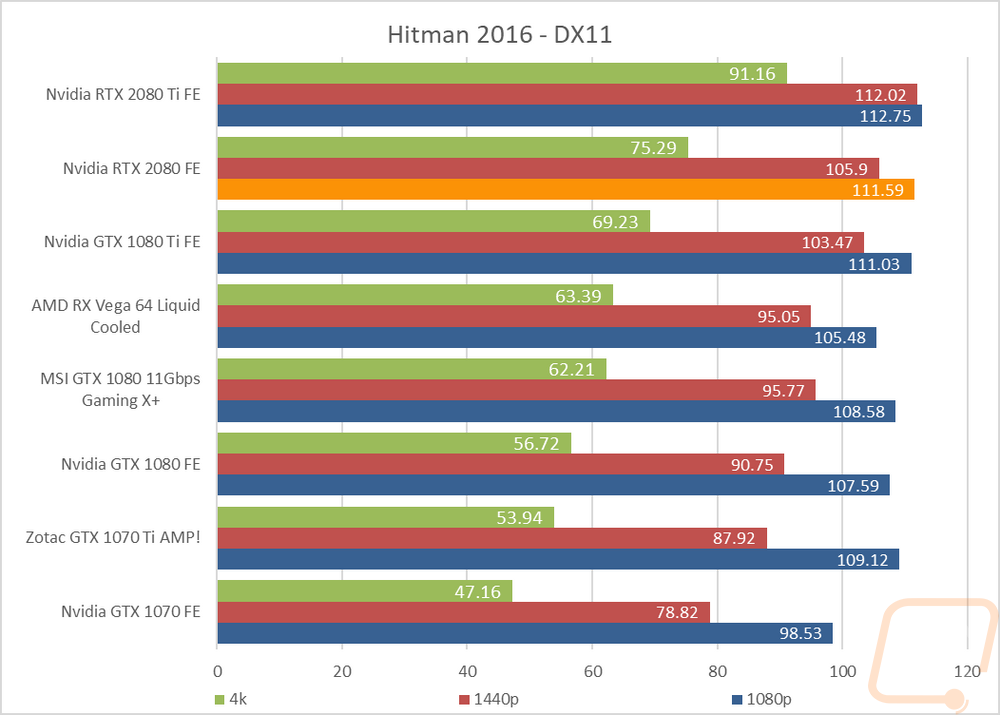
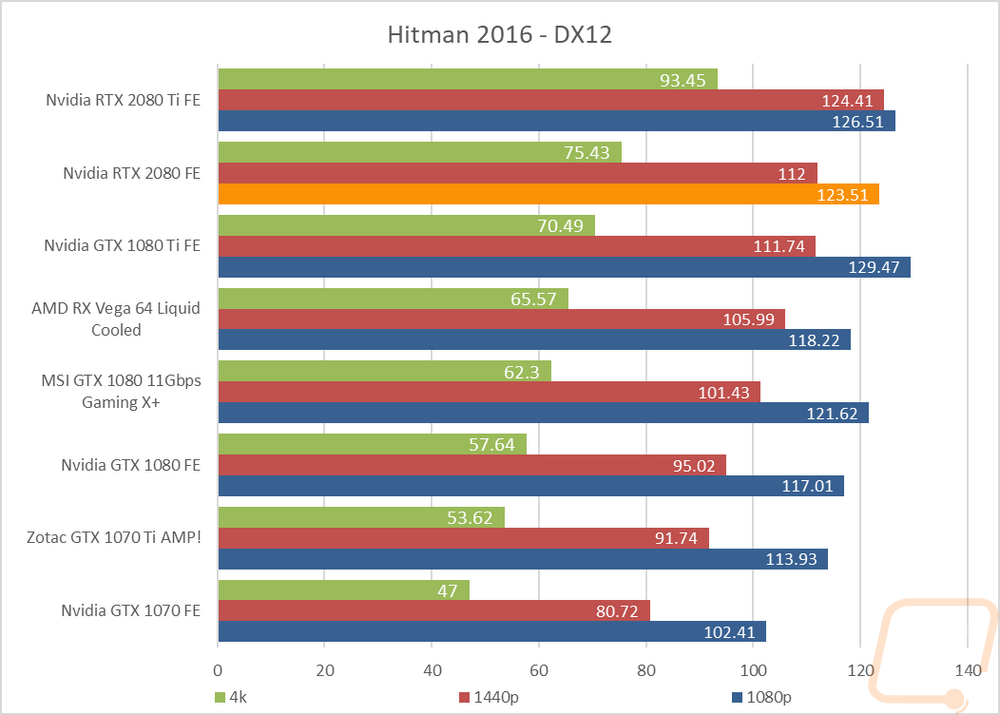
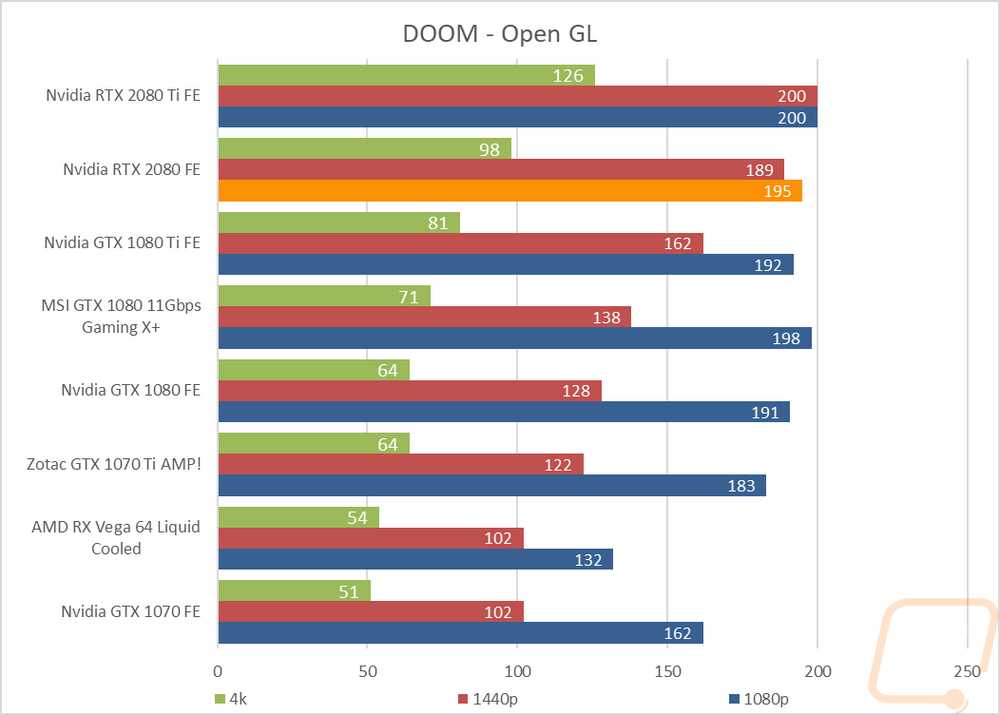
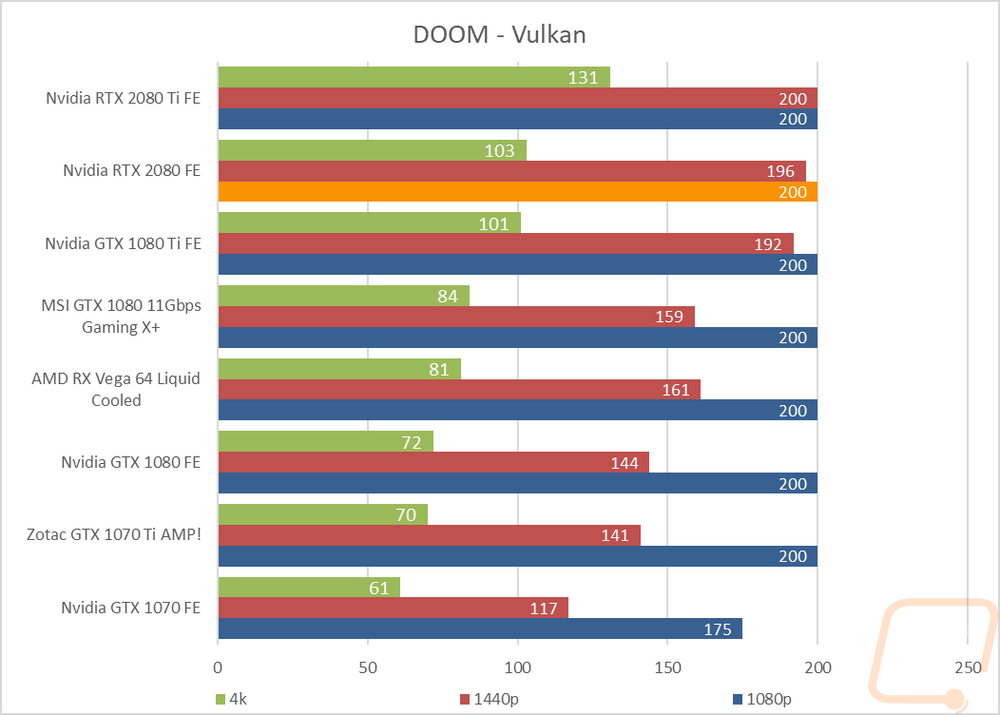
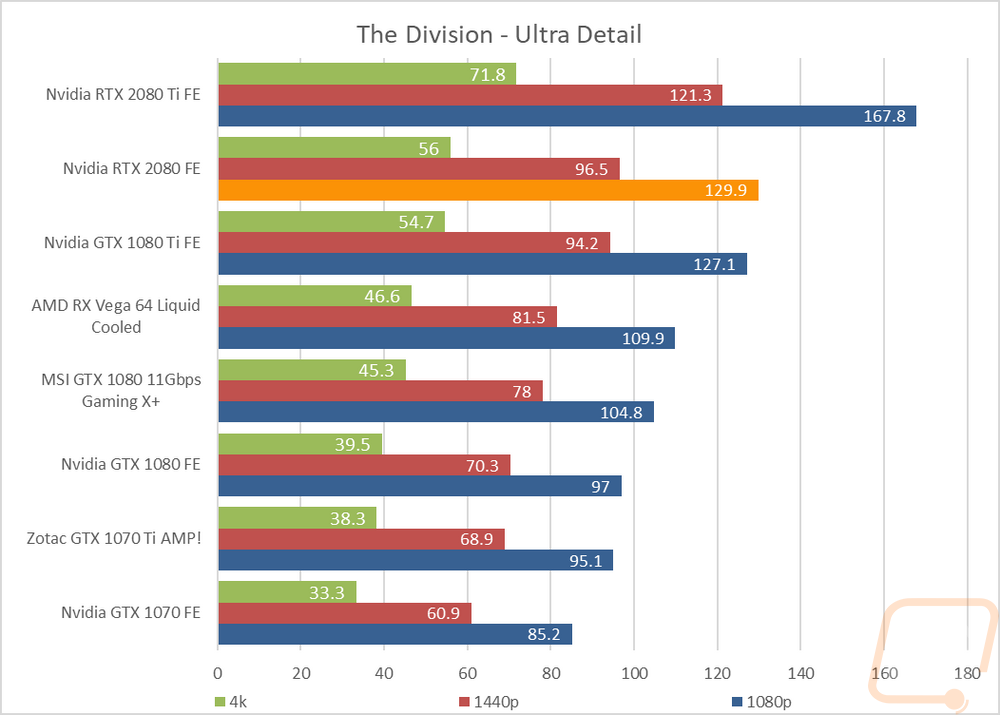
Then, of course, I couldn’t forget about all of our actual in game performance graphs. I have these available for anyone crazy enough to sort through all of the data. Unlike the synthetic tests I did earlier, I was happy to see that the RTX 2080 FE did at least outperform the GTX 1080 Ti in all but two tests. I wouldn’t call it a huge performance increase, but the 2080 did have a lead in all of the tests that it was ahead in. Beyond that there weren’t really any big surprises, the GTX 1080 Ti stayed ahead of the Vega 64 in all but one test, and below that the other 10 series Nvidia cards stayed in their expected order.