Well with the original RTX 2070 launch I had to switch right back over to my Intel i9-9900K testing and I haven’t really had a chance to revisit the 2070. At launch, I covered the Founders Edition model and while I talked about the pricing on other 2070’s the Founders Edition model runs more and also has a higher factory overclock. So after that launch, I did reach out to a few companies hoping to get the “cheaper” model in to get a better idea if the $100 lower price point really made a big difference when it came to performance or value. Well, I’ve finally had a little time to check one out, I have had the Gigabyte Windforce RTX 2070 in the office and have been testing it. Today let’s look at its features, performance, and then see how it all fits in the market.
Product Name: Gigabyte Windforce RTX 2070
Review Sample Provided by: Gigabyte
Written by: Wes Compton
Pictures by: Wes Compton
Amazon affiliate Link: HERE
Packaging
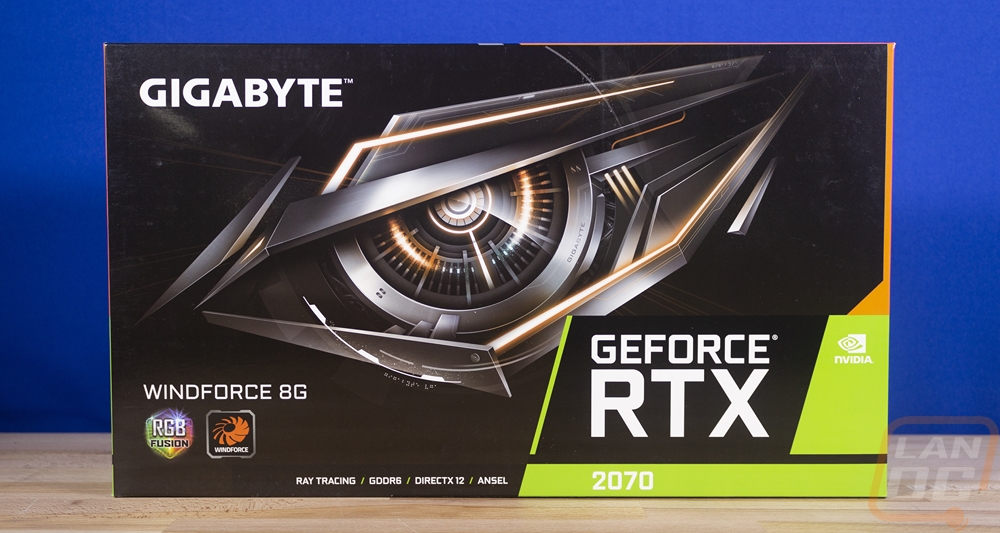
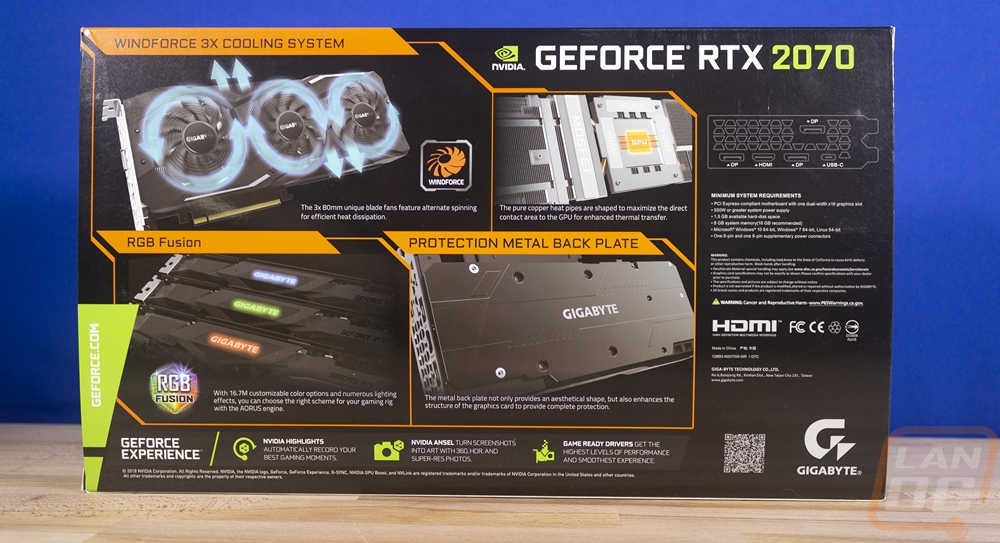
The box for the Gigabyte Windforce 8G RTX 2070 has the normal black and green area in the bottom right corner like all Nvidia products that wraps around to the side as well. But the rest of the box is actually trimmed in an orange with a black background. They skipped out on putting the card on the front sadly. In its place, the front has a large eye like design, similar to the Strix logo. Beyond that, they highlight the RGB support with a logo in the corner and one as well for Windforce. Around back they finally have details on the card including pictures from multiple angles. The only picture of the front fans is partially covered though showing how their Windforce design rotates one fan the other direction for improved airflow. Beyond that, they have pictures showing the RGB logo on top, the metal backplate, and one of the copper direct contact heatpipe design. There is also a line drawing of the rear I/O that shows all of the display connections you get, this is important for in-store shopping but card dimensions would also be nice as well.
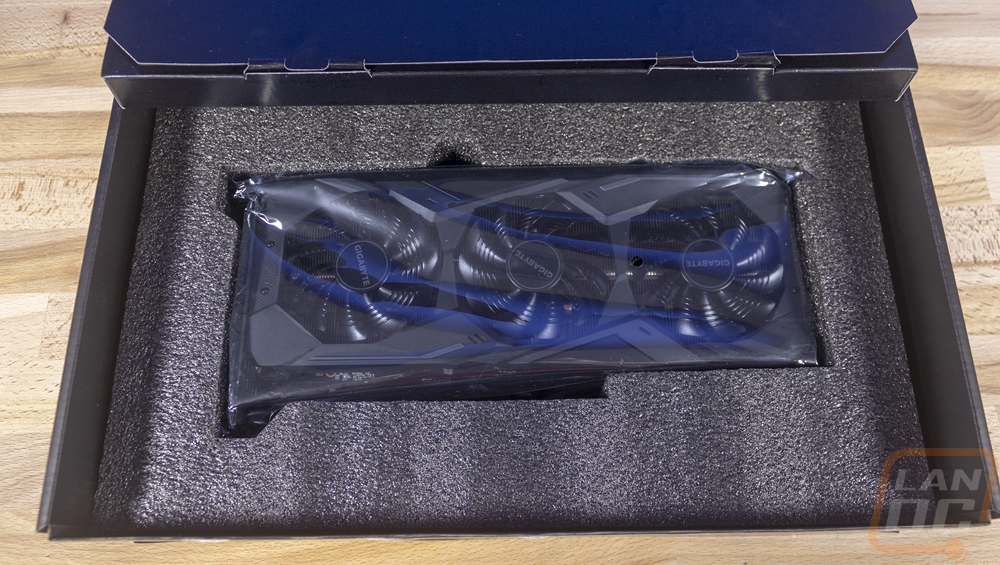
So inside, like most video cards these days, there are boxes within boxes. The outside of the packaging has a main big box inside, then inside of that a box on top with the documentation in it. Then all the up under that you finally get to the card itself. It comes wrapped in its static protective bag and it sits in a foam cutout to keep it safe. There weren’t any accessories and even documentation was slim. You get a driver and software disc and a thin paper quick guide for setup.
Card Layout and Photos
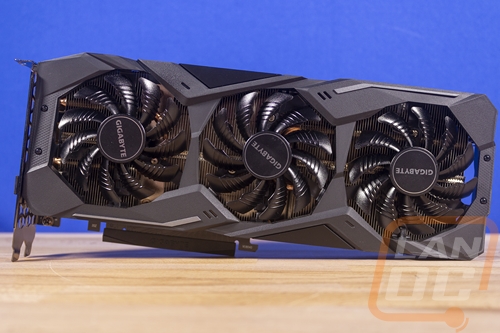
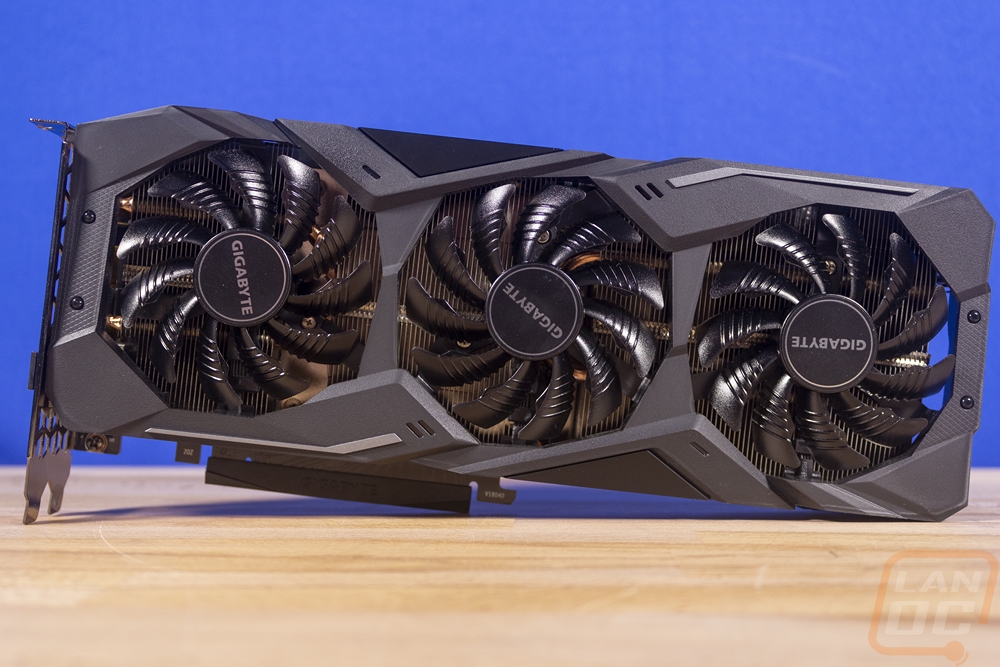
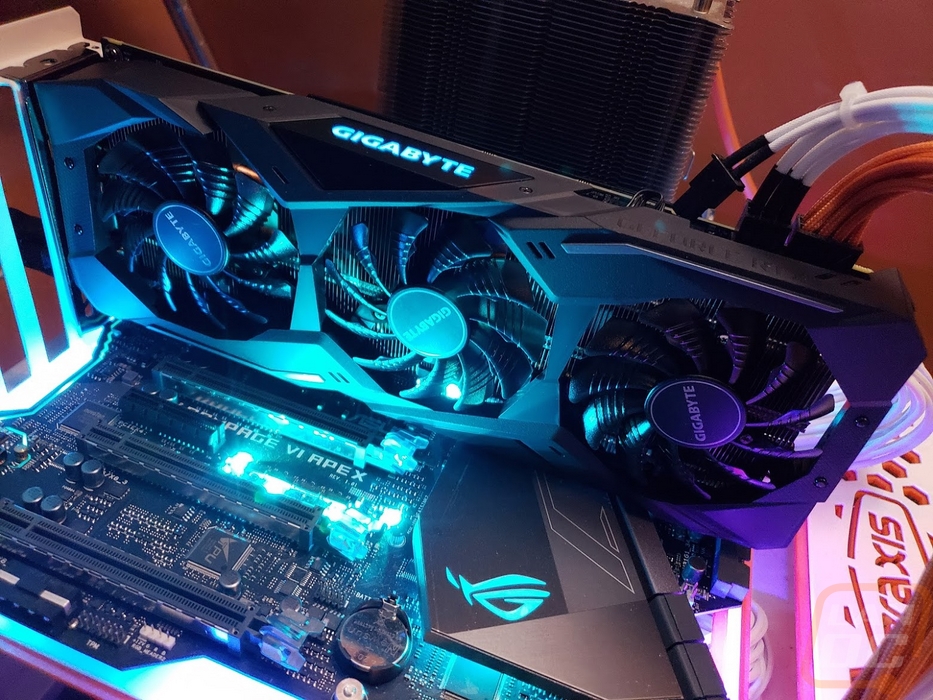
The Gigabyte Windforce cards, in general, have stuck with a similar look for a few years now with the exception of a little more styling built into the fan shroud. A lot of that has to do with Gigabyte sticking with their three fan design on higher end cards where most other cards have moved to two fan designs with much larger fans. I used to look at the triple fan design as the potential for even more noise, but now with everyone else moving to the dual fan design that creates very tall video cards, I’m really liking Gigabytes direction. This design is noticeably shorter than a lot of the cards I’ve taken a look at recently. It is also lighter weight, even with it being a long card. I mentioned it in the packaging section but one of Gigabytes features with their triple fan design is using fans that spin two different directions. You can see the outside fans have the same fan blade design where the inside fan is curved the other way. That fan spins clockwise where the other two spin counter clockwise. The goal with that design is to cut down on turbulence in the area between the fans. While all of the fans mostly push air down, there is some that goes outward, with this design the area between the middle and right fan has both fans pushing air down and between the left and middle fans pushing air up. You can see this because the curves in the fans point down and up respectively.
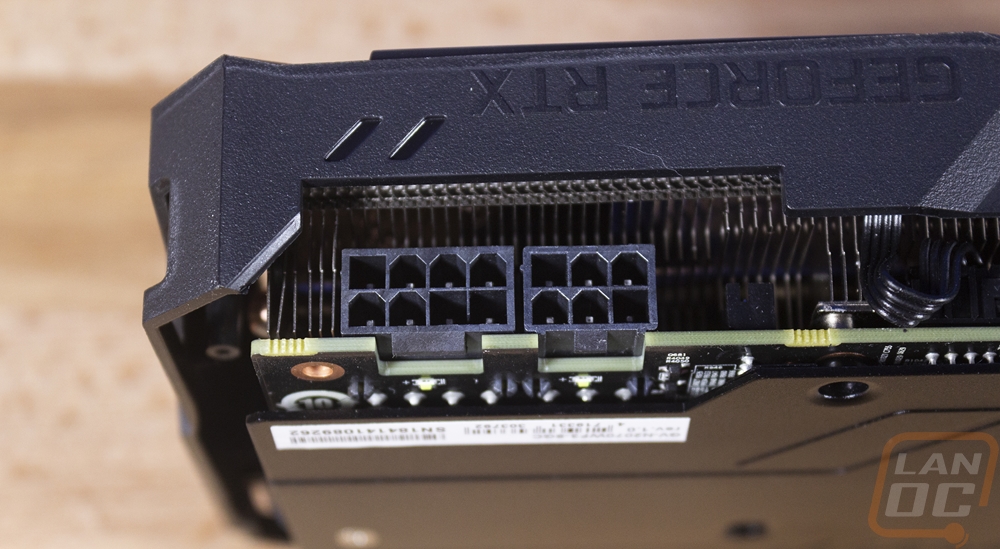
So the power connection configuration here was actually a surprise for me. The Founders Edition card officially comes with a higher clock speed and a higher TDP to go with that and it only has the one 8-pin power connection. Gigabyte, on the other hand, went with an 8-pin and a 6-pin combo. You can see that they also flipped the connections around with the clip on the PCB side and notched the PCB to fit them. This allows the heatsink to be larger and up closer to the power connection but from the looks of it, Gigabyte didn’t really take advantage of that space. There is also a big gap to the right where there is a header, it isn’t labeled but looks just like the other header nearby that is used for the RGB logo, I don’t know why they would have that on here unless they were using this same PCB design on a different board as well. If I had to guess, the Aorus model with the RGB lighting in the fans as well, but I can’t currently find any pictures that can confirm that at this time.
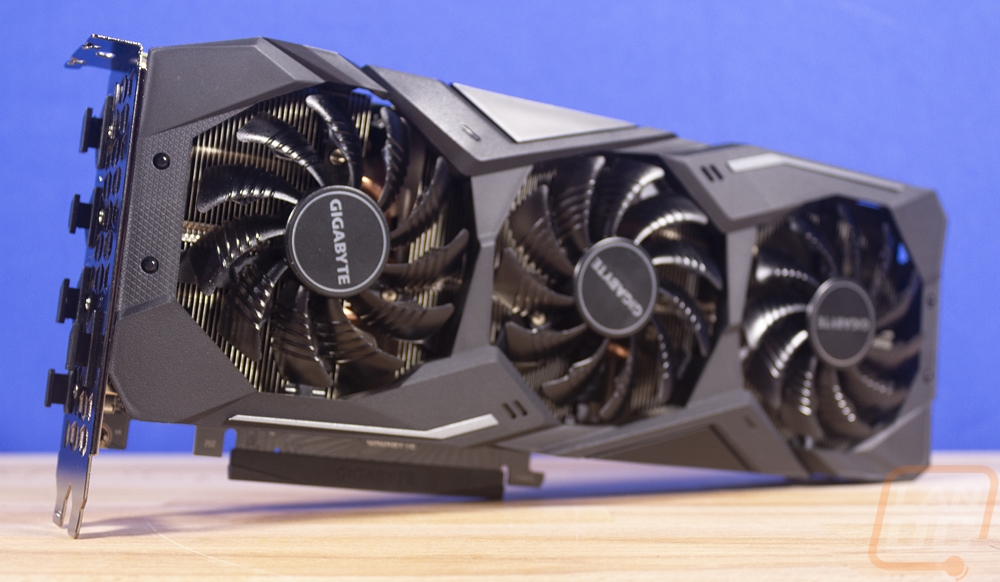
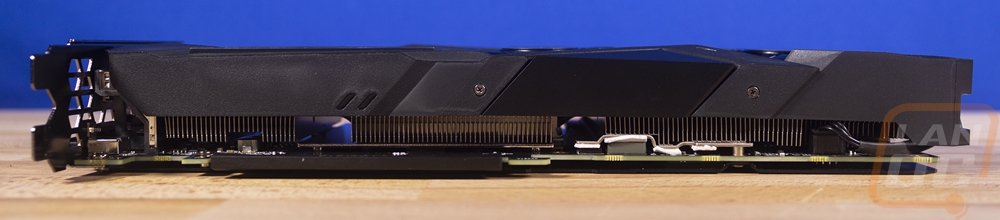
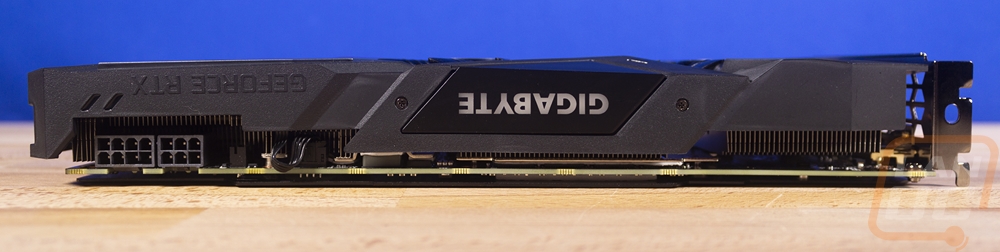
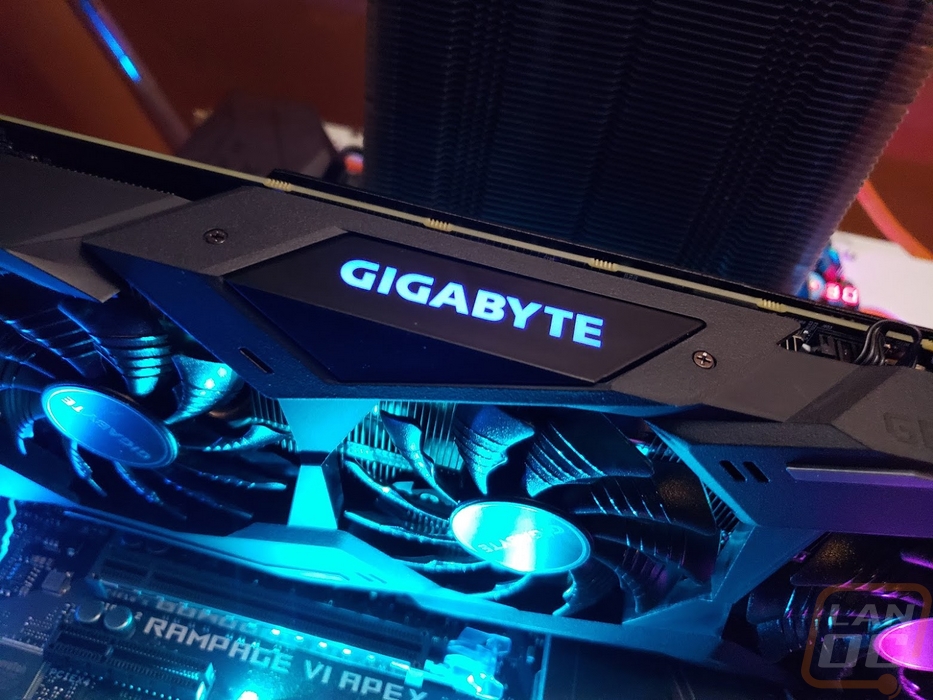
So in addition to not being a tall card Gigabyte also was careful to fit the Windforce RTX 2070 into a normal 2 slot form factor, not the 2.5 slot design a lot of cards are moving too. The top, bottom, and edge view of the card tells us a lot more about the cooling design as well. For starters, there aren’t any heatpipes visible on the top or bottom but they can be seen on the ends. That is because they run horizontally where most other cards go up, adding to the height. They are direct touch so they are right on top of the GPU and then they pull the heat out to both ends of the cards. Each of the three fans has a heatsink design directly under it that is attached to the heatpipes. The fans blow down over the heatsink and into the PCB, then the fan shroud is open around the edge on all sides to allow the heat to go out the top, bottom, and end. The overall shroud design is blacked out with no crazy colors that aren’t going to go with some builds and on the top edge, you have the Gigabyte logo backlit with controllable RGB lighting and the GeForce RTX logo embossed out of the shroud but otherwise hidden.
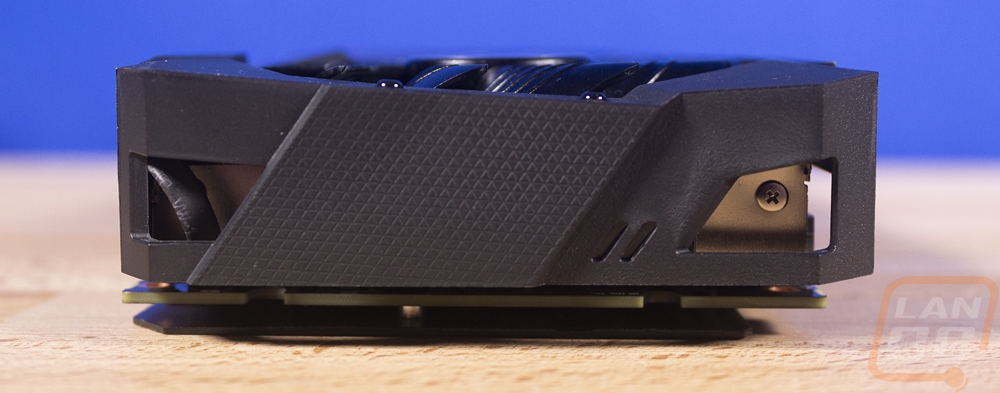
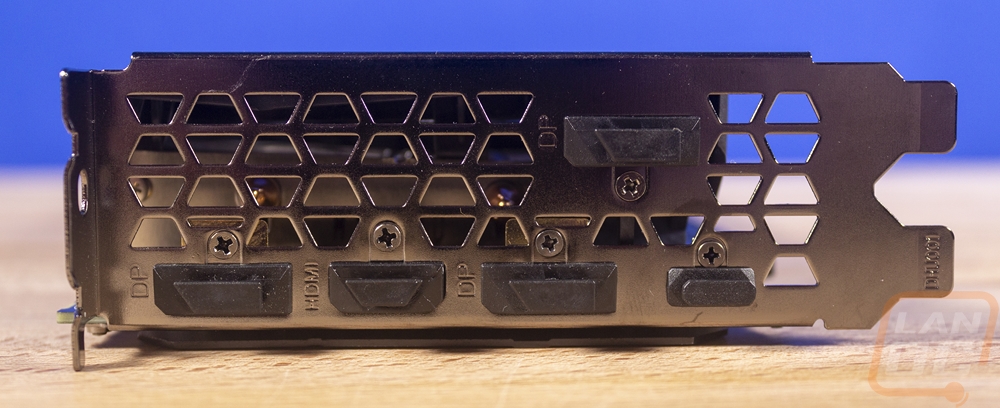
The PCI bracket end of the card does have ventilation as well and some air will vent out this way but because the other directions will have less restriction it won’t be as much. The display connection options aren’t any different than the Founders Edition. You get three DisplayPort connections and one HDMI. Then in the bottom right corner, they slipped in the new USB Type-C connection that is designed specifically for VR headset usage. It does power, USB, and the display connection in a universal format that should allow VR headsets to be connected right to the video card in the future without ¾ other connections.
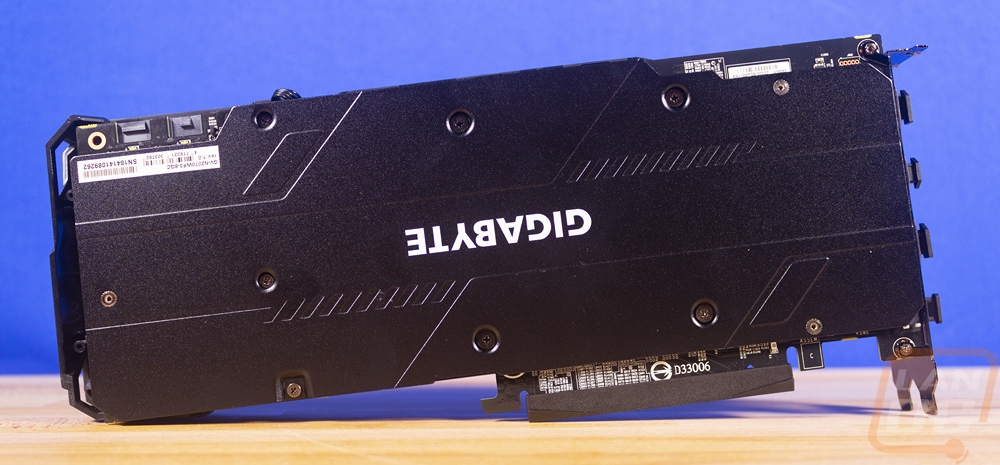
The back of the RTX 2070 Windforce has a full-length backplate as well. It is a sheet metal design so it is thinner than what the Founders Edition comes with but it is also black to match the rest of the card. In the middle, the Gigabyte logo is in bright white and facing out the correct direction for traditional case designs. There is a little bit of styling, but not too much, just like the fan shroud.
So unlike the Aorus RTX 2070, there aren’t fancy RGB fans or any of that. The Gigabyte logo is all you get, but unlike the Founders Edition card you can actually change the color of this one
Our Test Rig and Procedures
Our Test Rig Configuration (with affiliate links)
CPU - Intel i9-7960X
Motherboard - Asus ROG Rampage VI Apex
Memory - HyperX DDR4 Predator 3000MHz
Storage - Kingston A1000 960GB M.2 SSD
Cooling - Noctua NH-U12S
Power Supply - Corsair AX1200w
Case - Primochill Wetbench
Synthetic Benchmarks
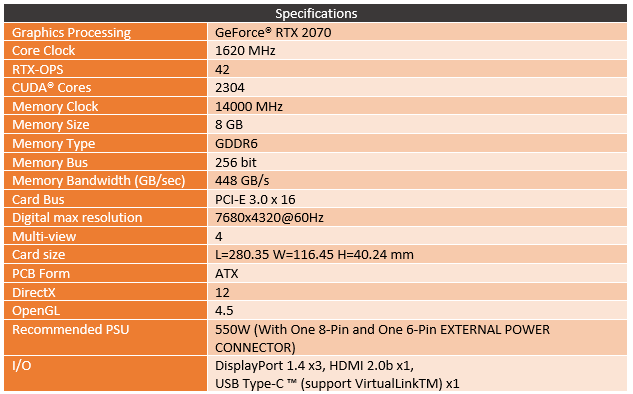
As always, to start off my testing I prefer to take a look at synthetic benchmarks. They don’t directly translate to in game FPS but they are consistent and normally have the best driver support so we get a great look at how cards compare against each other. In this case, I wanted to keep an eye on a few specific things. The Gigabyte Windforce is a stock clocked RTX 2070 where the Founders Edition that I already reviewed is clocked higher. Specifically, the boost clock on this card is 1620 MHz where the Founders Edition came in at 1710 MHz so I want to see how they compare in all of our testing. With that I also want to keep an eye on how things compare with the GTX 1080, the Founders Edition was faster but the stock clocked RTX 2070’s are the cards that are priced at the same price.
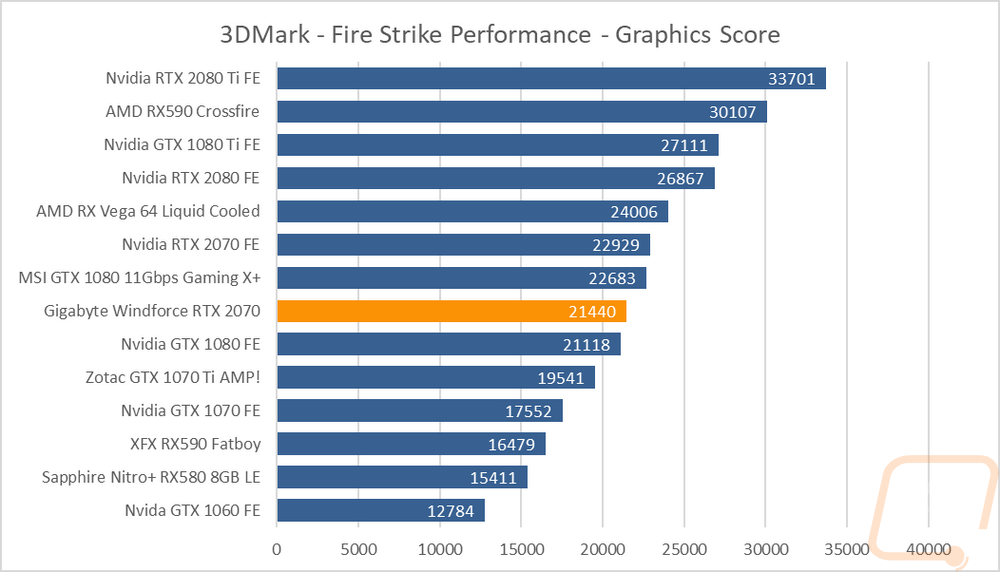
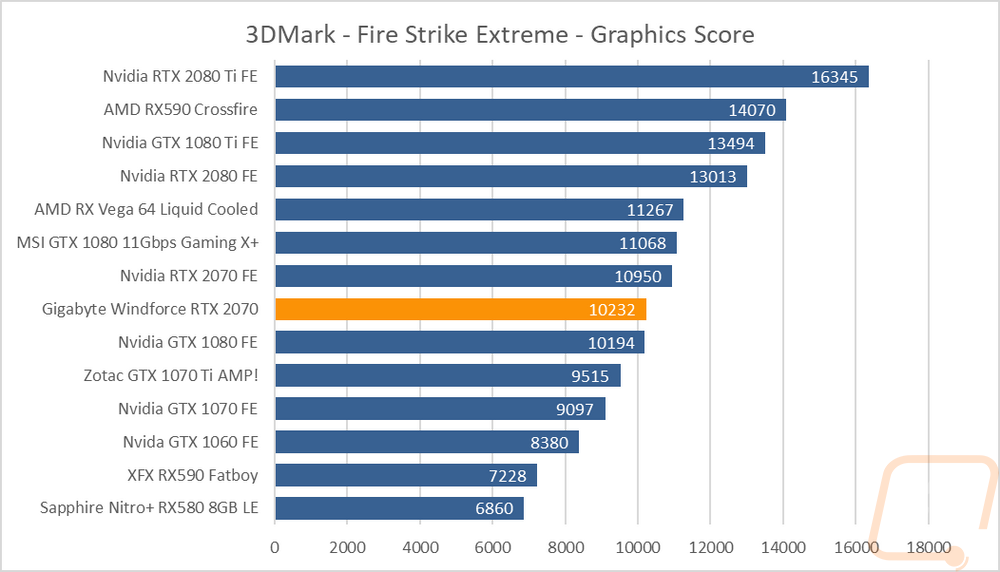
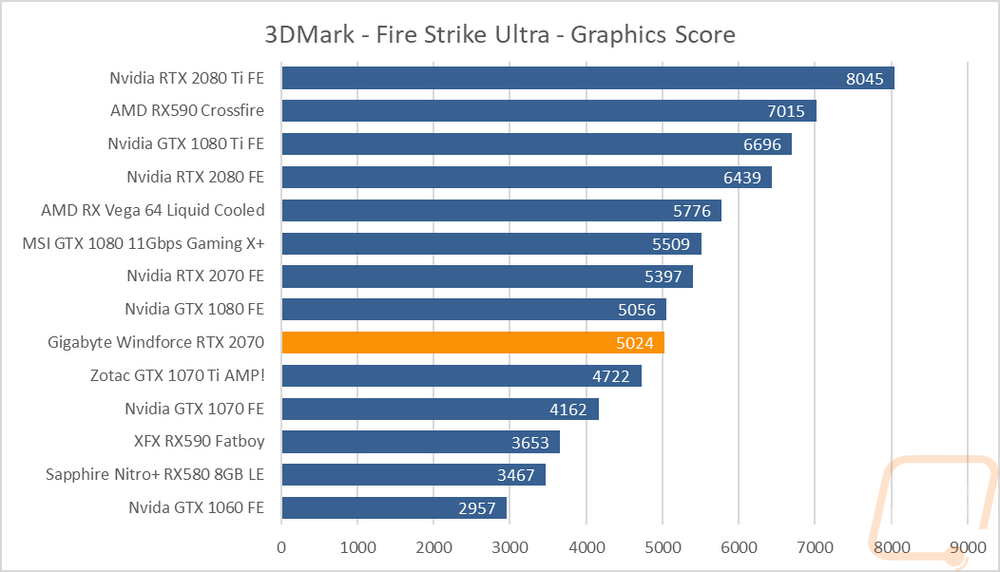
With that in mind, I started with the DX11 based 3DMark Fire Strike benchmarks. I did three of them using the three preset settings. All three tests have the Windforce RTX 2070 almost spot on with the GTX 1080 Founders Edition card. The gap between this and the Founders Edition RTX 2070 is noticeable and it is also important to note that the overclocked GTX 1080 with upgraded 11Gbps memory was right with the RTX 2070 FE.
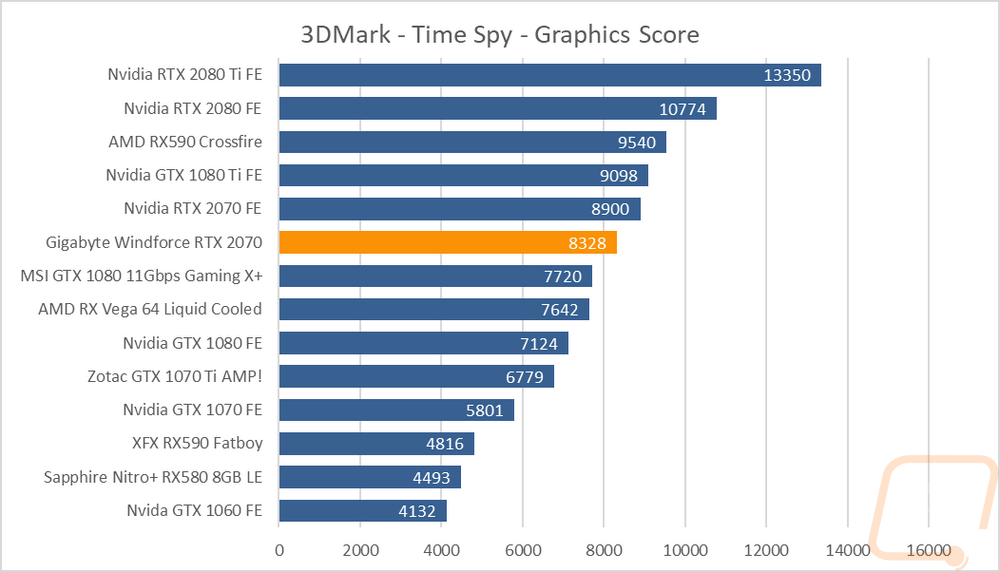
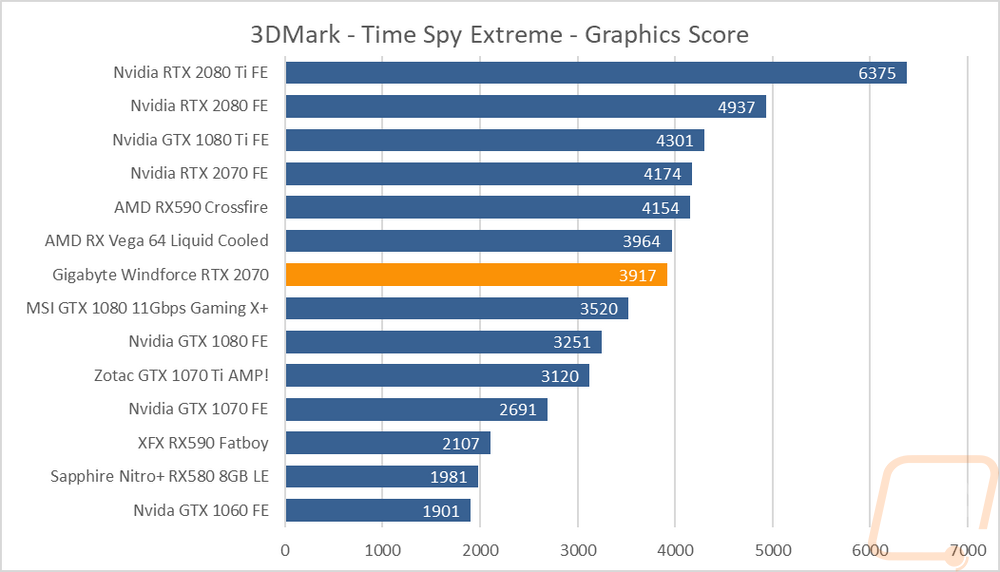
Now switching to the DX12 based Time Spy tests, also in 3DMark the results did change. Like the Founders Edition 2070, the Windforce 2070 performed much better here. Even with the lower clock speeds it pulled ahead of the GTX 1080 Founders Edition and overclocked GTX 1080 as well by 16.9% and 7.8% in the normal Time Spy and an impressive 45.5% and 11.2% in the Time Spy Extreme test. The Founders Edition RTX 2070 was 6%-7% faster in both as well for perspective.
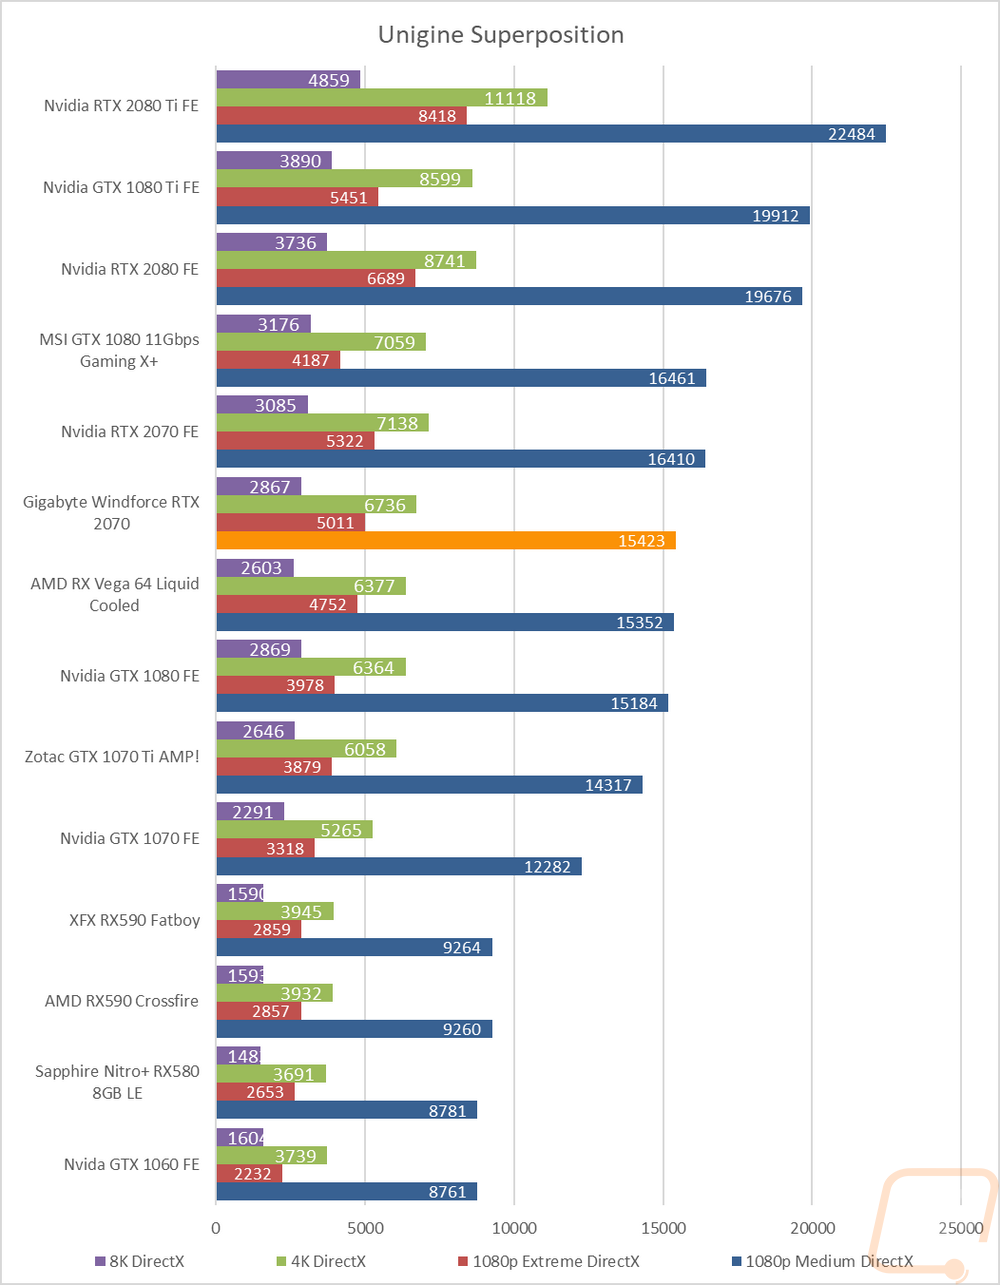
The last synthetic tests were done using the Unigine Superposition test. I tested at two different quality settings at 1080p, then at 4k and 8k to take a look at ultra high resolutions. The Windforce RTX 2070 came in just above the Vega 64 Liquid Cooled card as well as the GTX 1080 though the gap wasn’t much. The RTX 2070 Founders Edition was the next fastest card with it trading blows with the overclocked GTX 1080.
VR Benchmarks
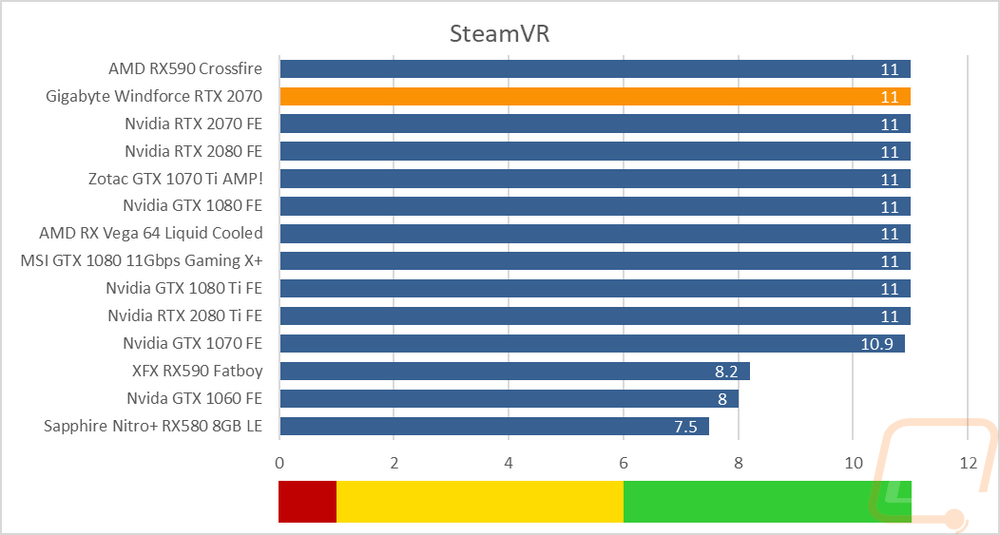
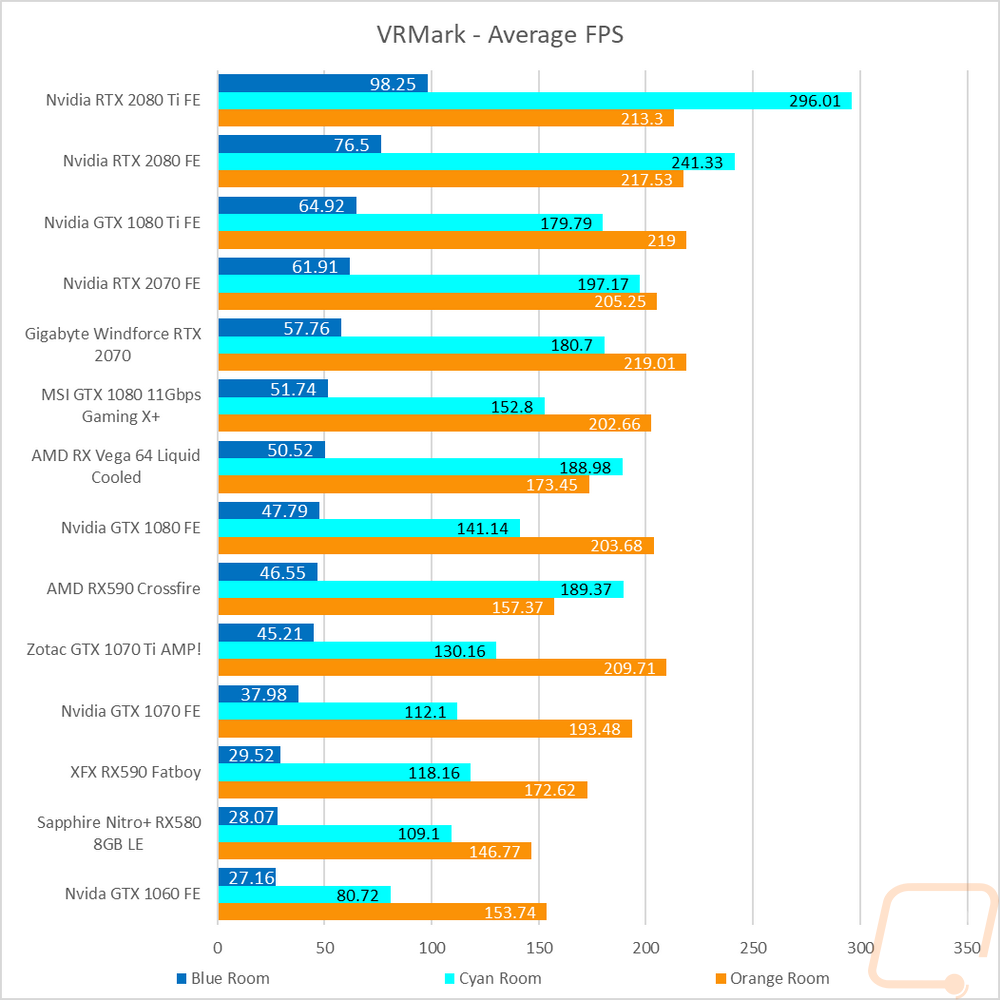
The currently available VR benchmarks are all synthetic tests as well. But they do offer a nice look at potential VR performance and given VR has very specific requirements in that if your FPS dropped too low it can make you dizzy or sick it is important to at least get an idea of performance. The SteamVR test is capped at a score of 11 so it really only applies to lower end cards and the RTX 2070 doesn’t qualify as that. So my focus was on the VRMark results. I ran all three tests, the orange room is the most basic and is a lot like current games. Cyan is the newest test and it is like more demanding games from today. Then the blue room is a future looking test for more realistic and demanding games. Oddly enough the orange room result was higher on this round of testing than the Founders Edition 2070 when I tested it last month, clearly there was a driver improvement there. Overall though The 2070s were faster than the GTX 1080s in the blue room test and in the cyan room it was even faster than the GTX 1080 Ti.
In-Game Benchmarks
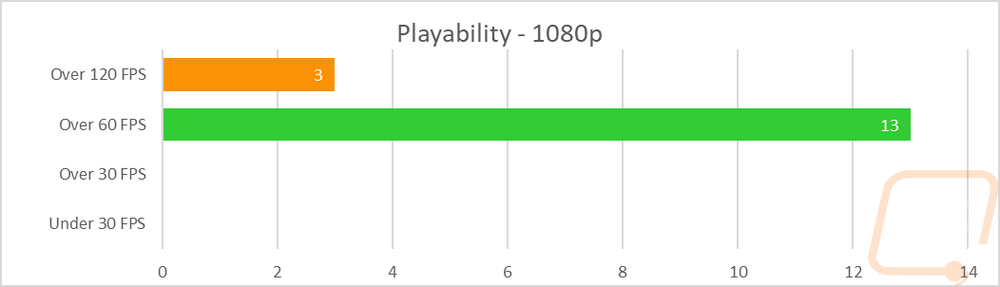
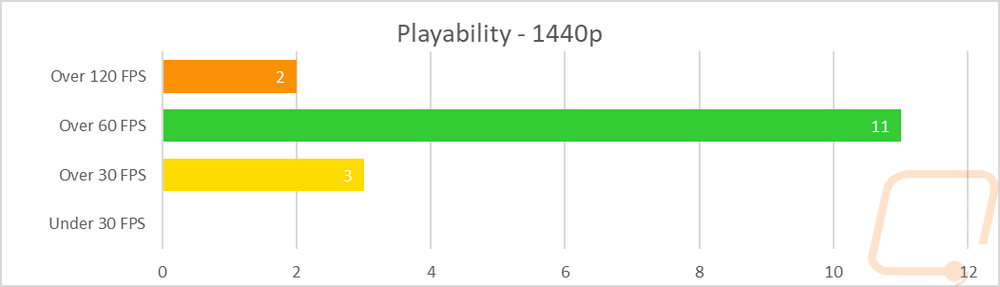
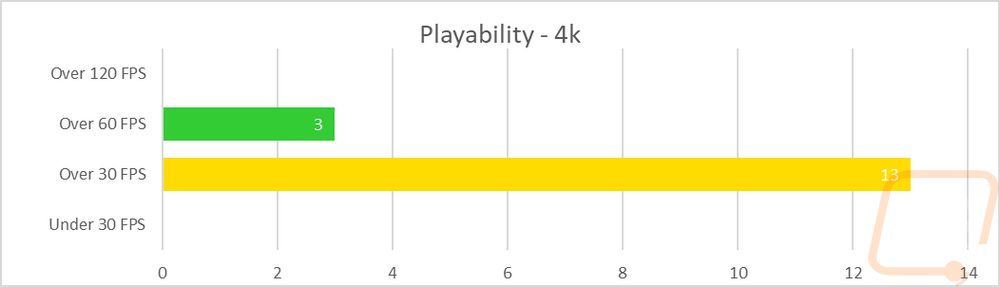
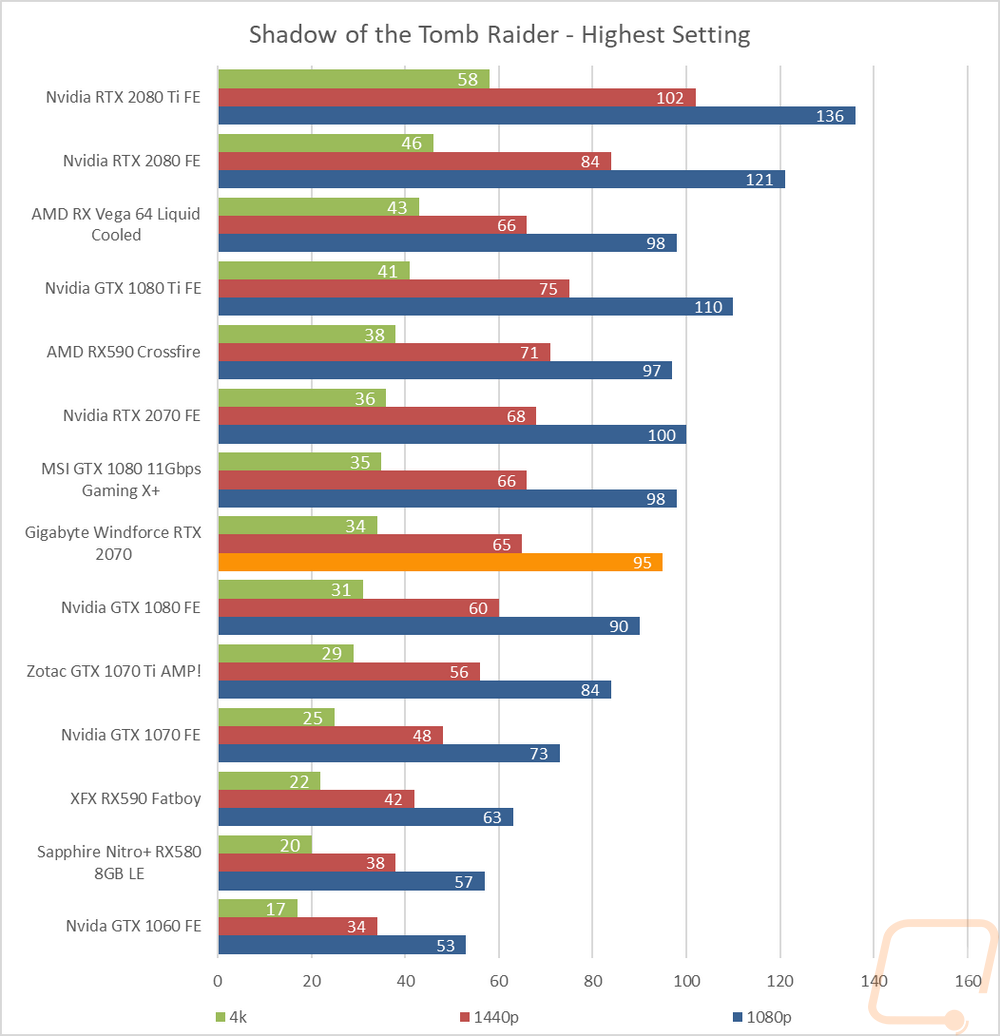
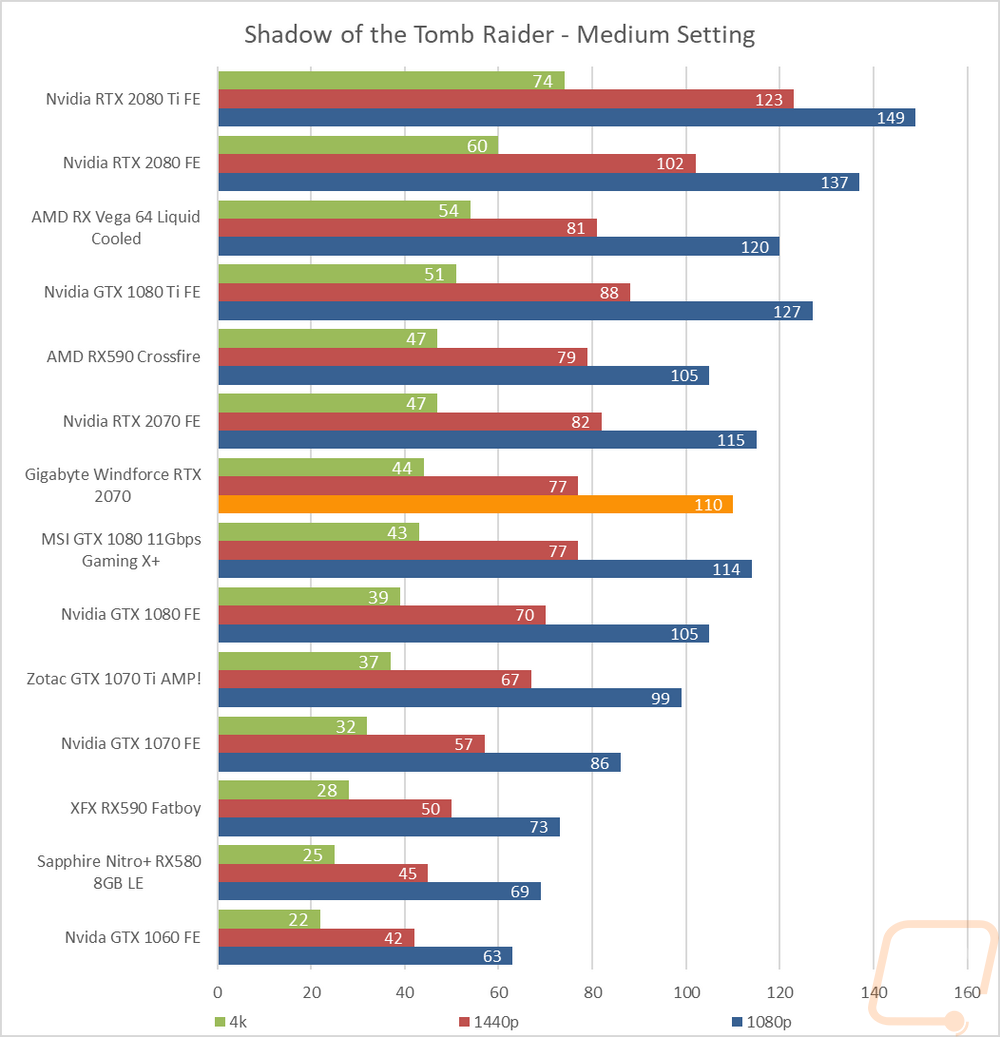
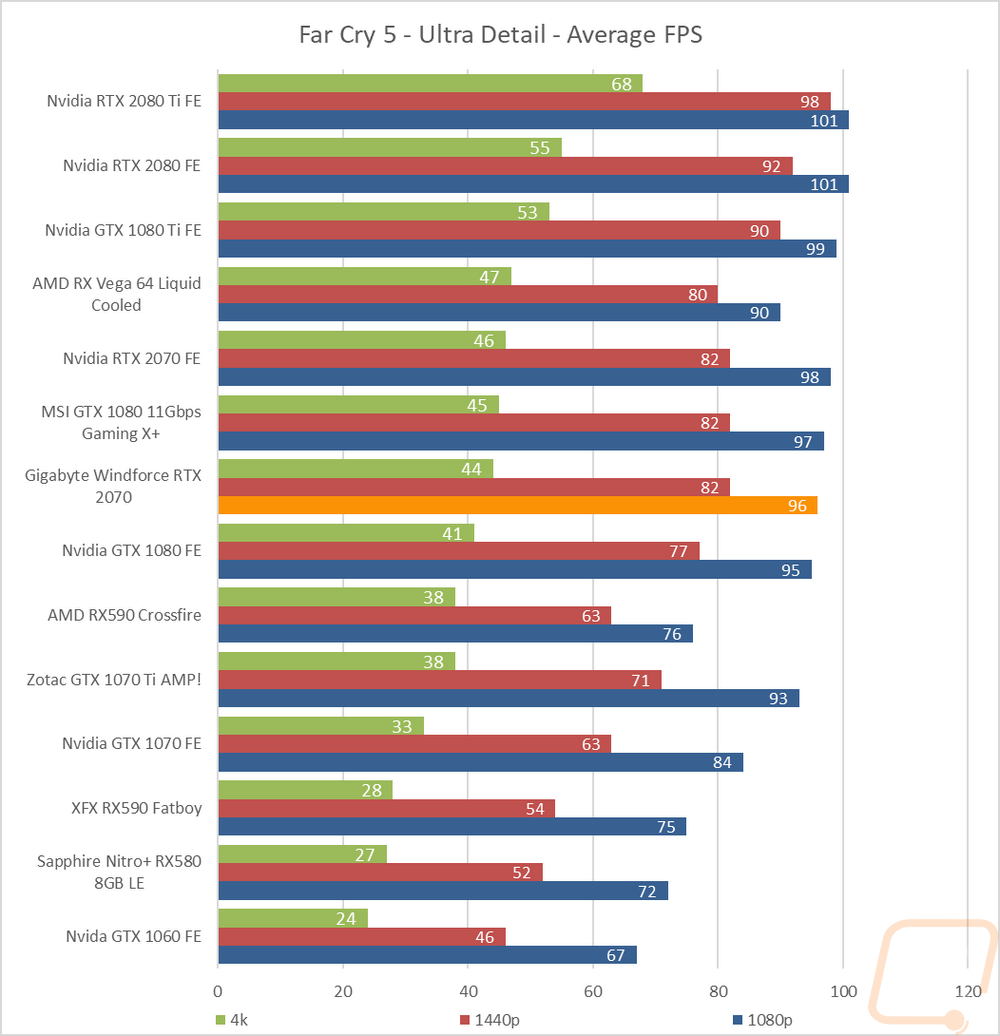
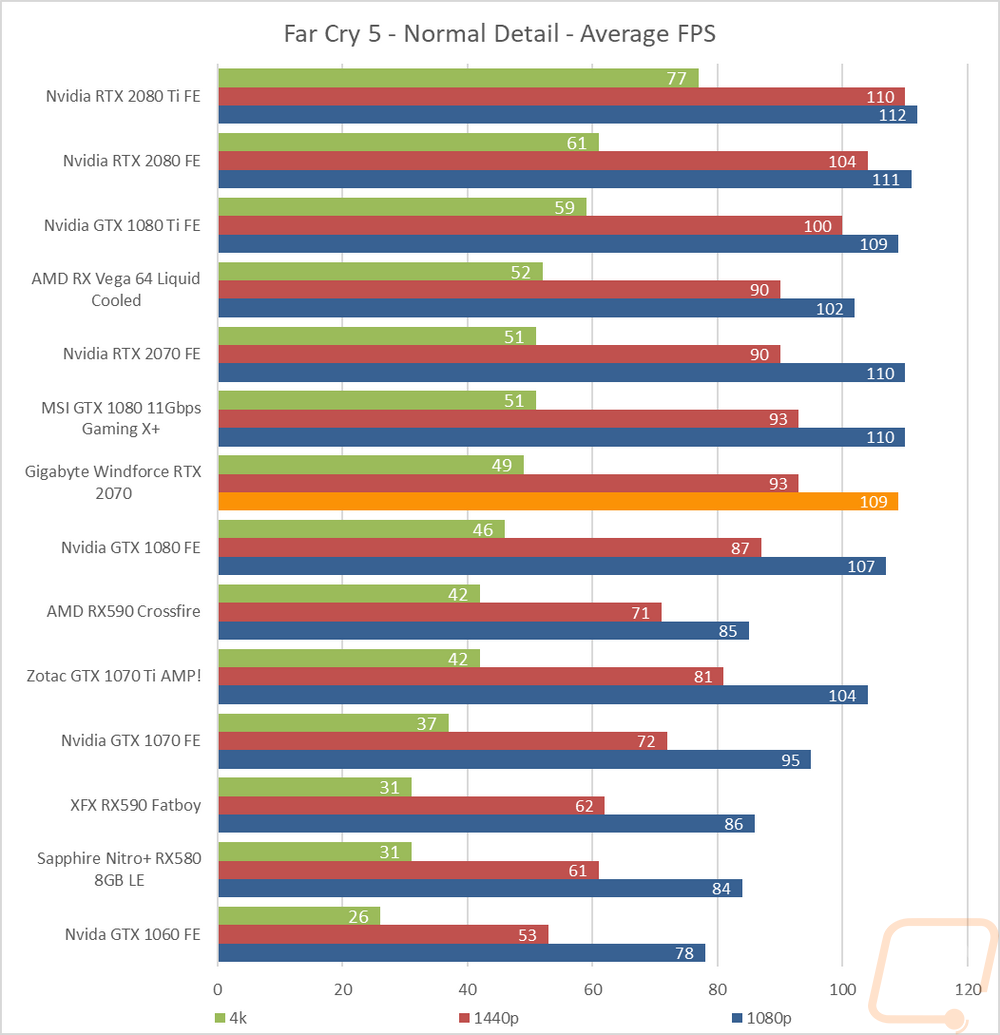
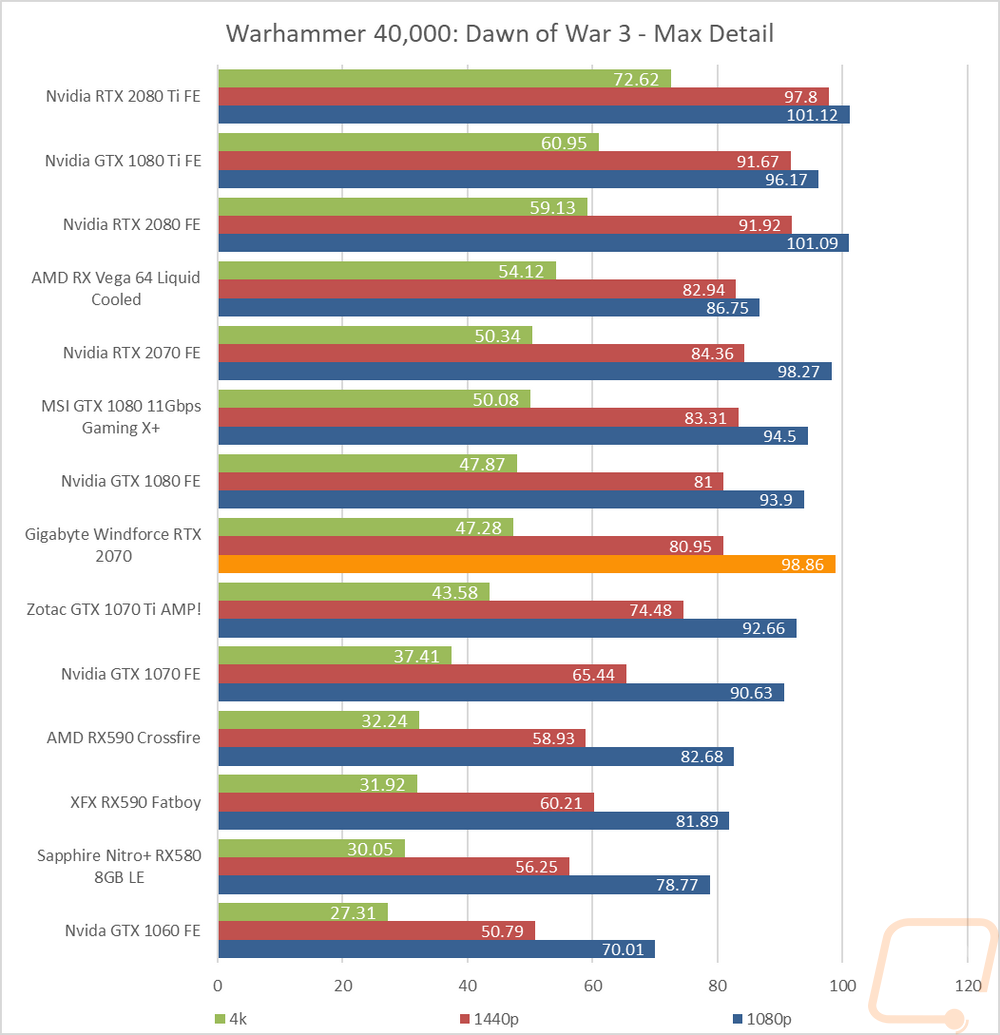
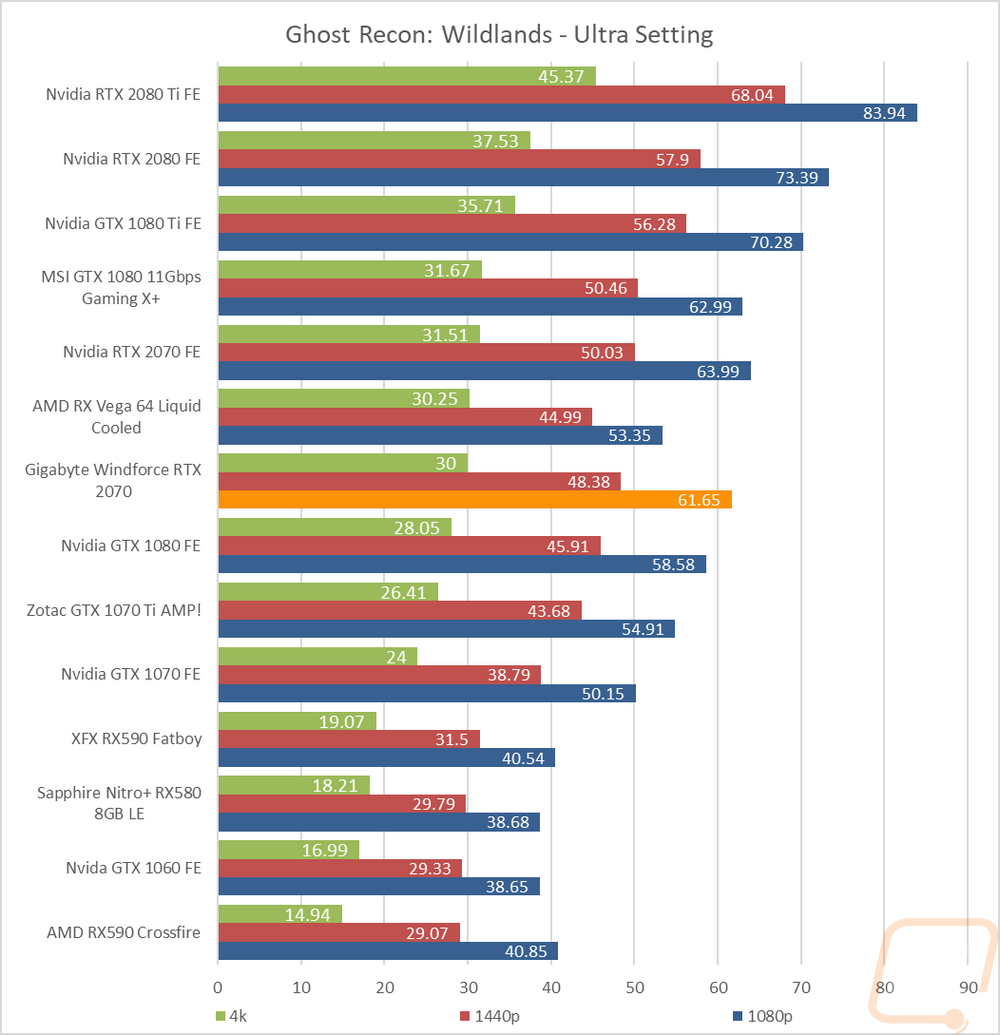
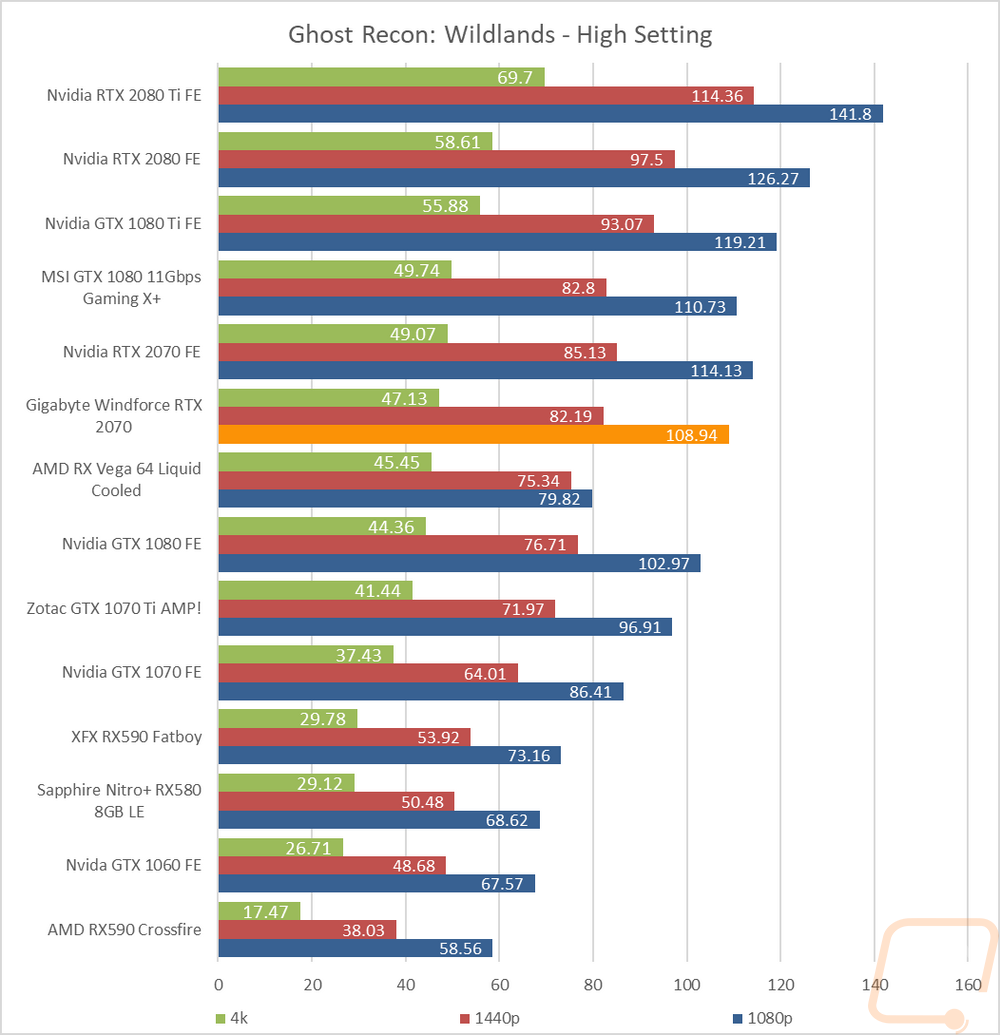
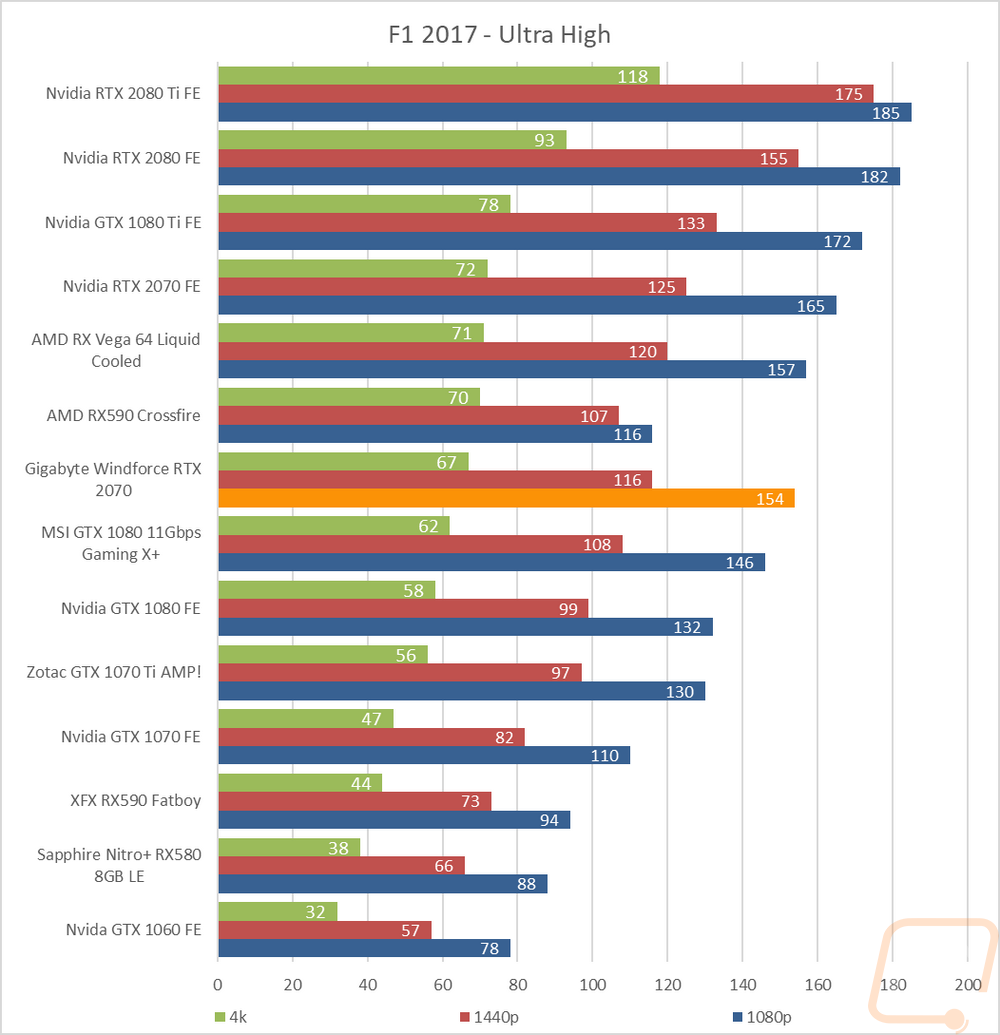
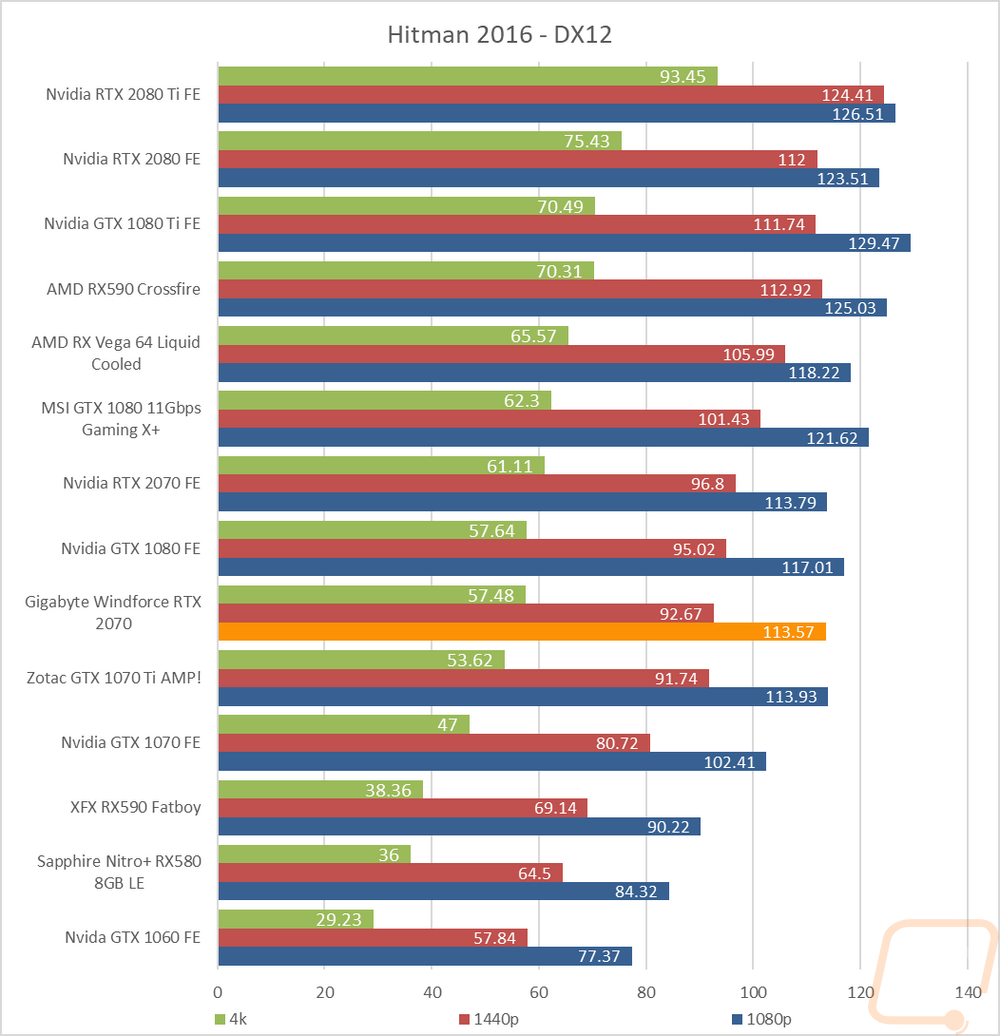
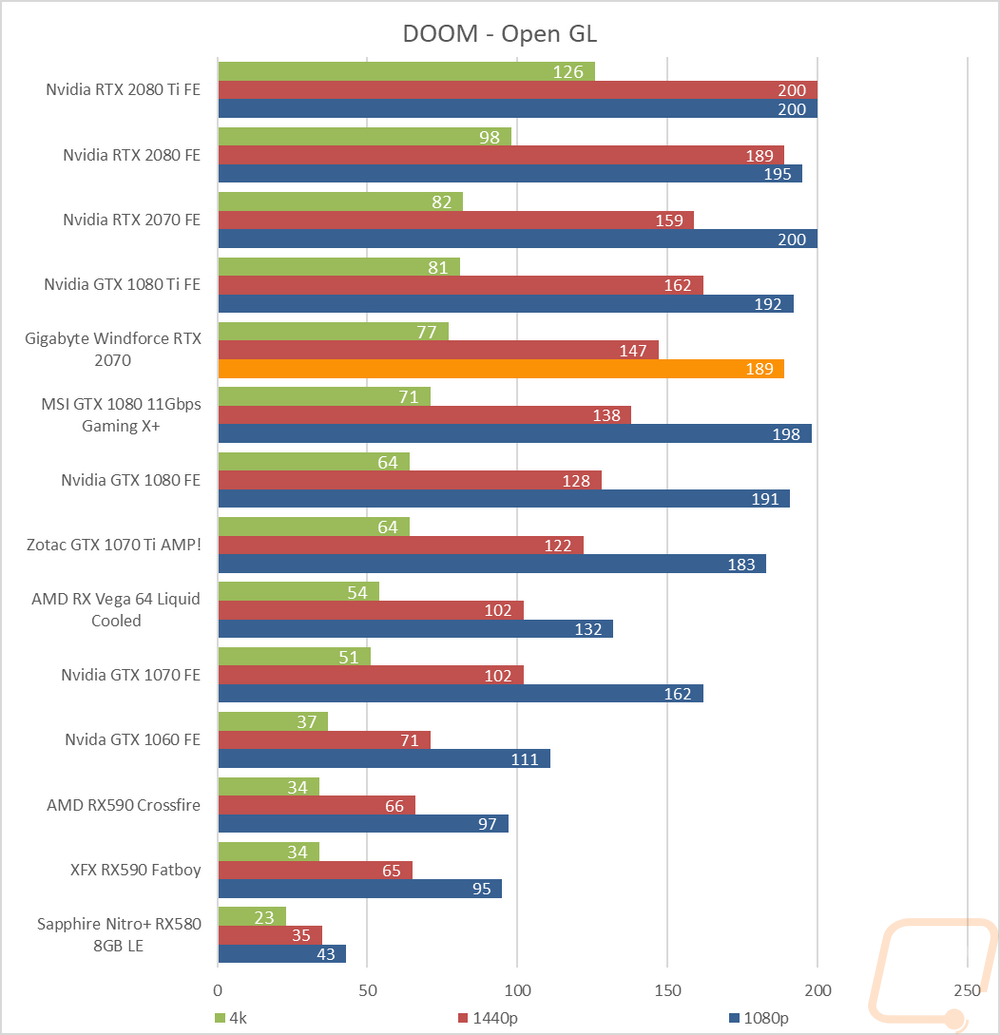
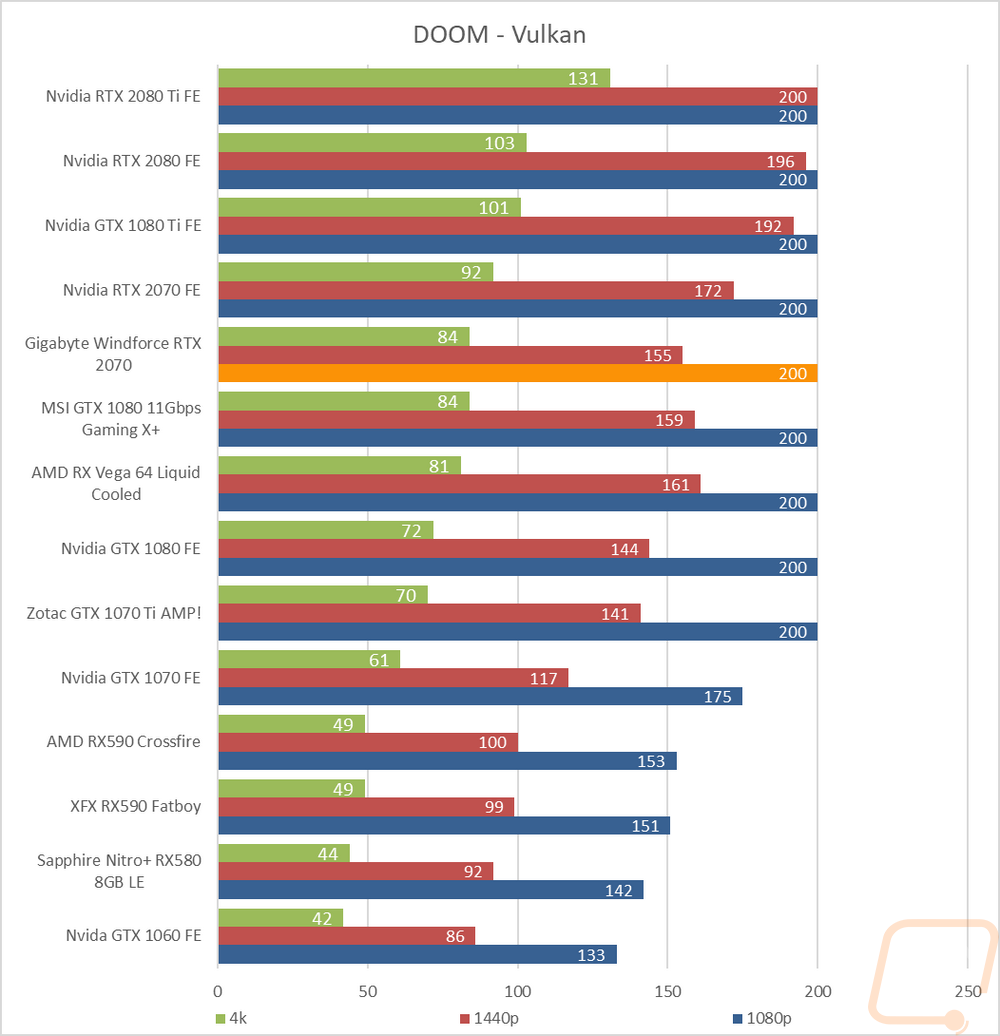
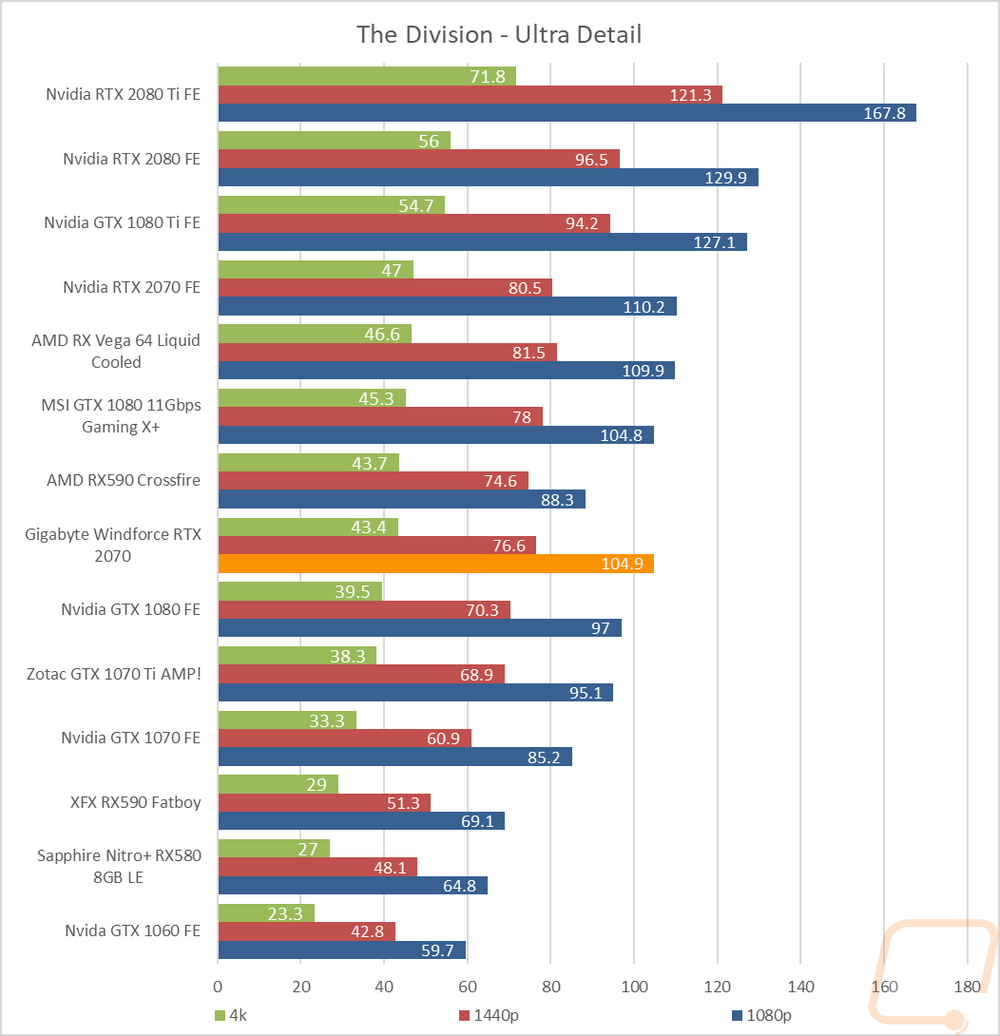
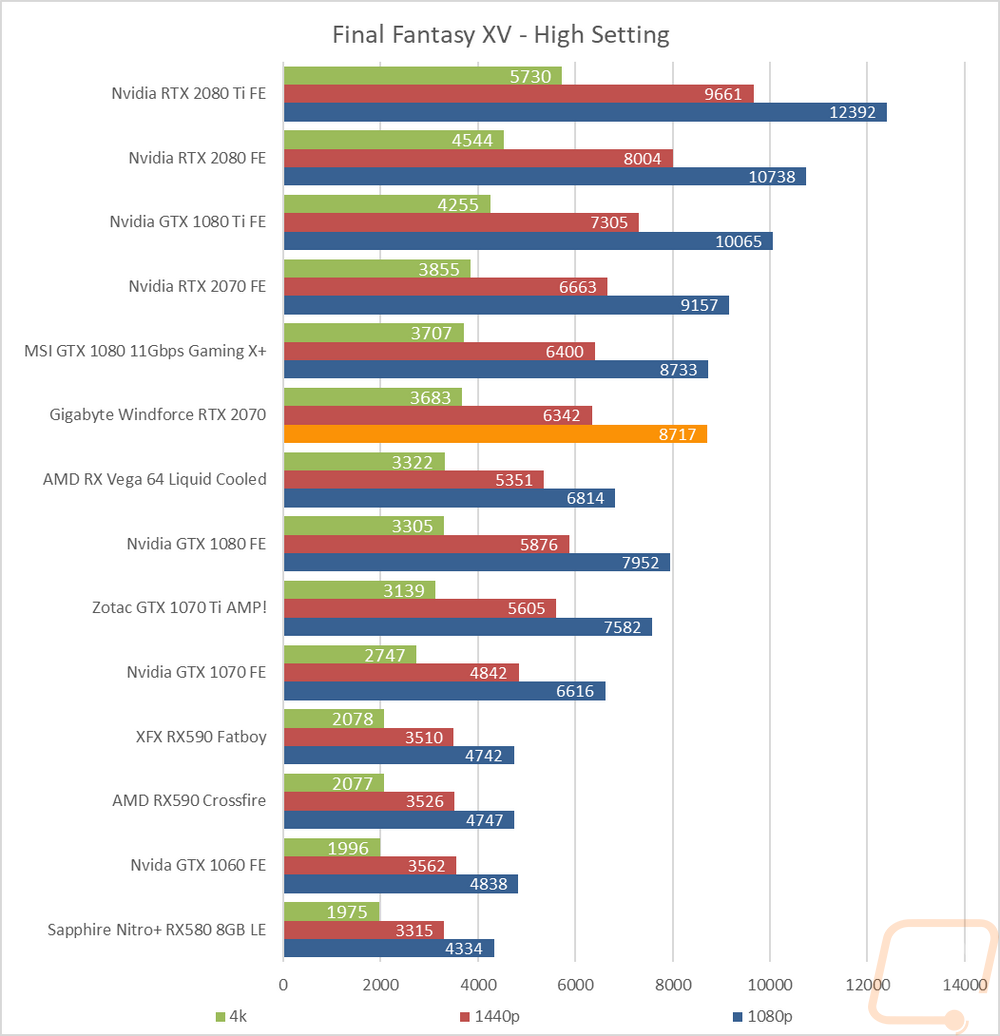
Now we finally get into the in game performance and that is the main reason people pick up a new video card. To test things out I ran through our new benchmark suite that tests 11 games at three different resolutions (1080p, 1440p, and 4k). I also slipped in a few variations on the same games for comparisons like DX11 to DX12, OpenGL to Vulkan, and a couple of games are just tested at their highest setting and lower but still high detail options to show the performance difference when things are turned down slightly. In total, each video card is tested 51 times and that makes for a huge mess of graphs when you put them all together. To help with that I like to start off with these overall playability graphs that take all of the results and give an easier to read the result. I have one for each of the three resolutions and each is broken up into four FPS ranges. Under 30 FPS is considered unplayable, over 30 is playable but not ideal, over 60 is the sweet spot, and then over 120 FPS is for high refresh rate monitors. This covers all of the games tested except Final Fantasy XV that we have a score rather than an FPS because they like to be different.
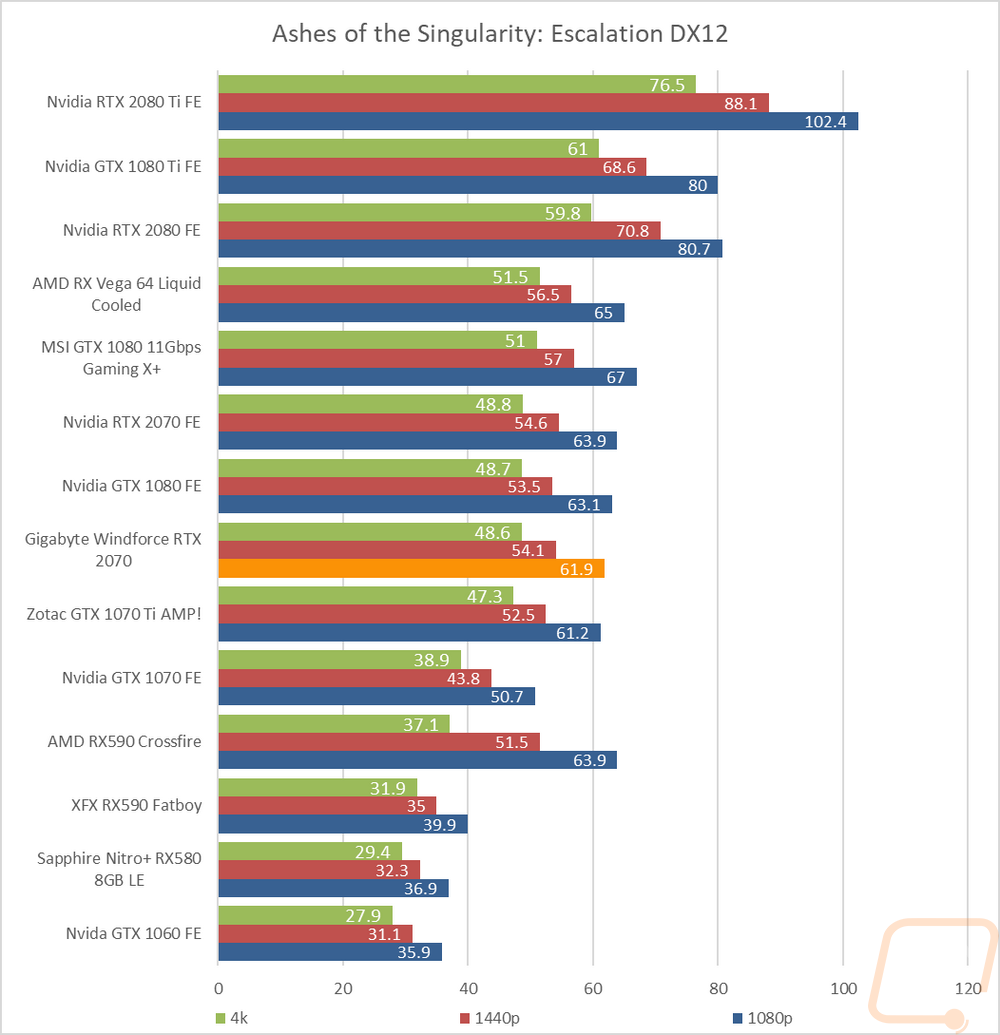
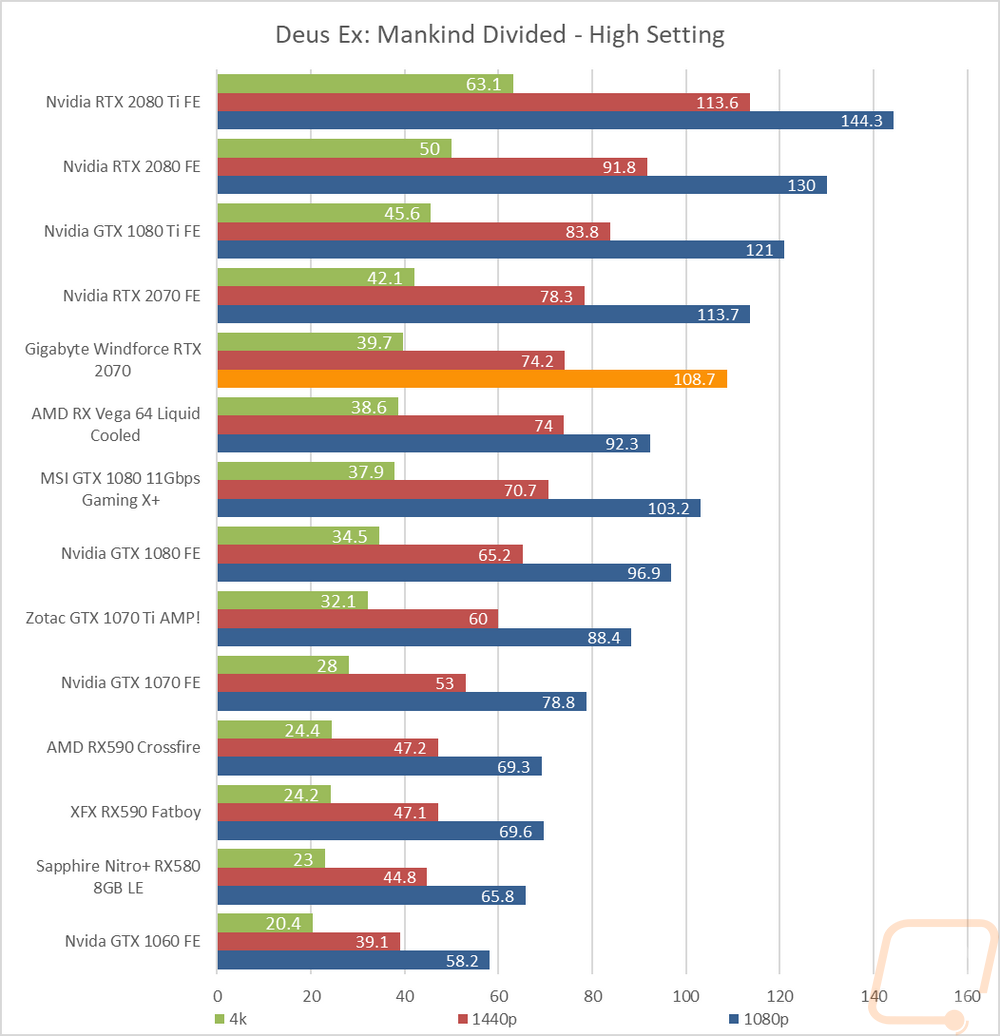
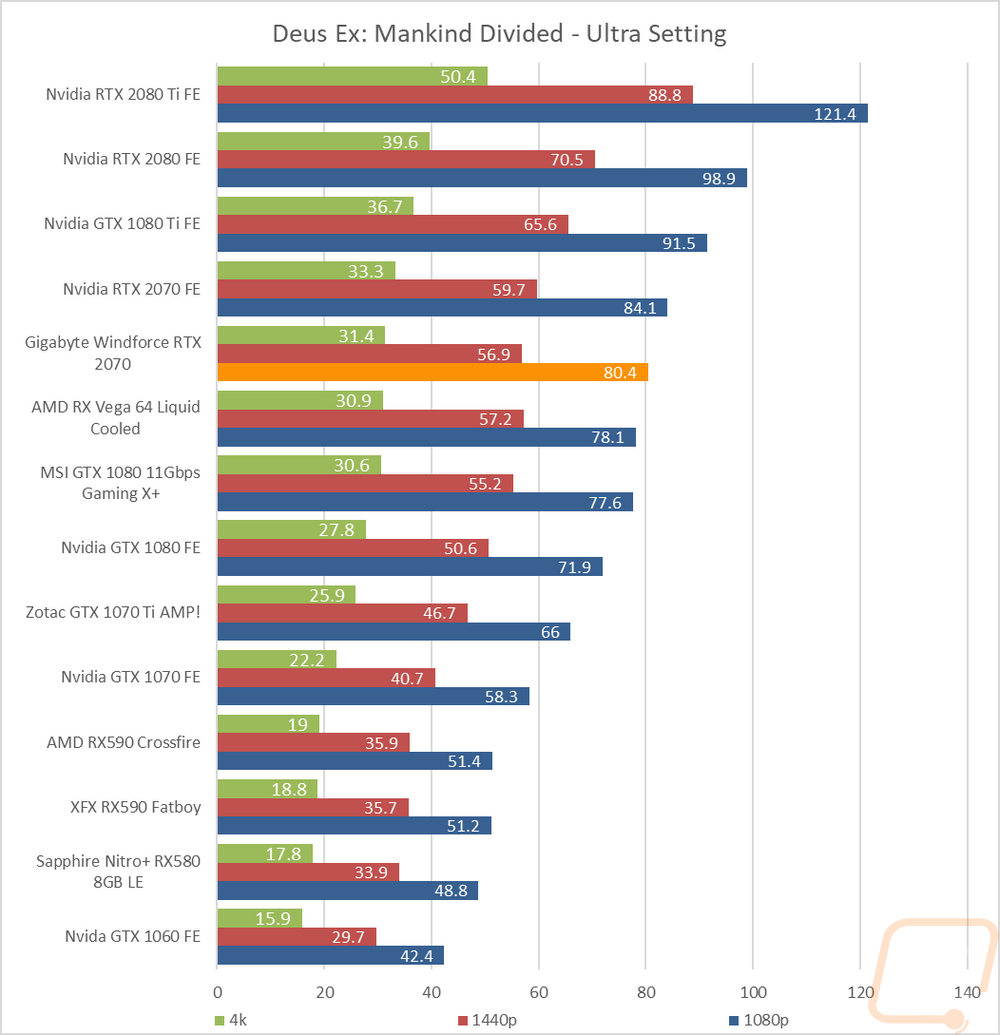
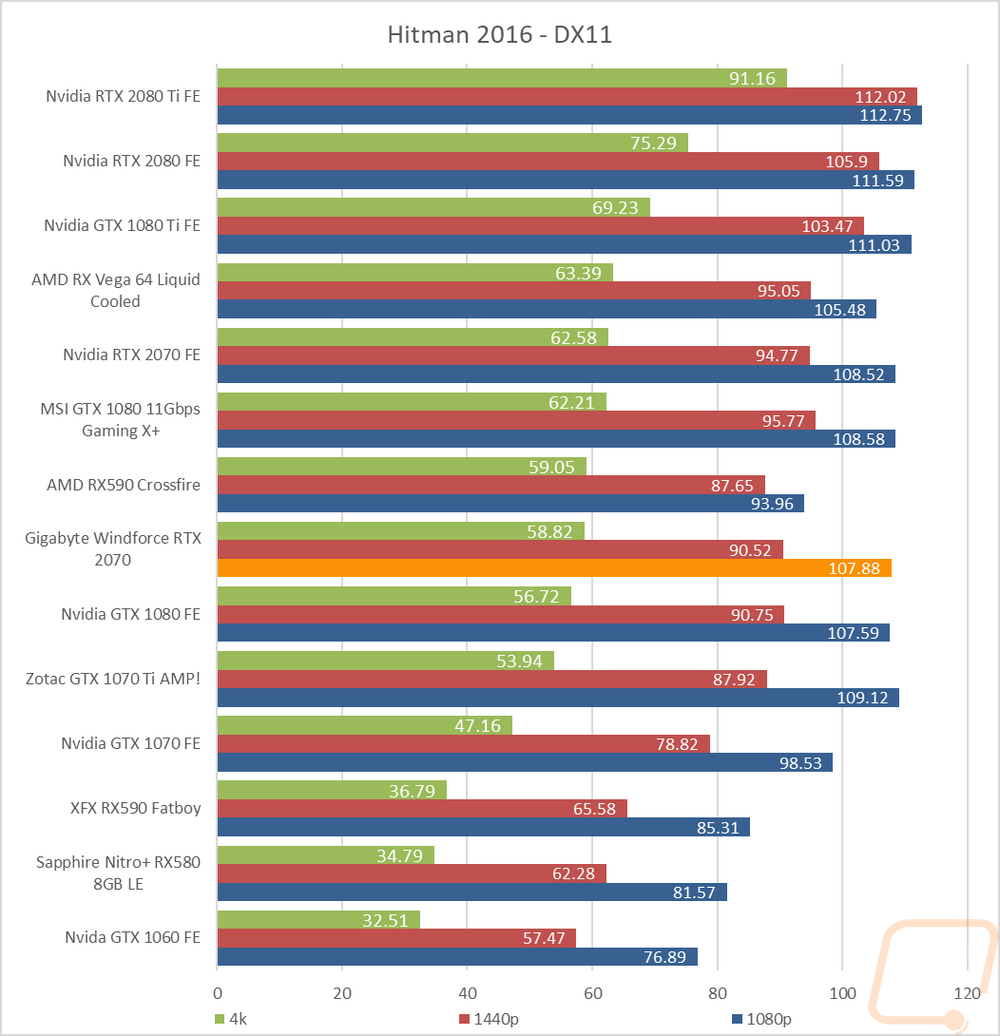
So how did the Gigabyte Windforce RTX 2070 perform? Well no big shocker here, it handles 1080p without a problem and 1440p is solid with just three games that you might have to make some adjustments on. 4K, on the other hand, the Windforce struggled, just like the Founders Edition 2070 did. What was interesting though is when I compared the results between the Founders Edition and this stock clocked card. At 4k two of the 60+ games dropped down into the 30-60 FPS range. At 1440p one of the 120+ games dropped into the 60-120 range. Then at 1080p things were the same. Of course, these results don’t really show how big of a performance change there was, but I honestly thought that even with the lower clocks the roundup results would still be the same. The difference wasn’t much, but it was interesting at least.
I of course also have the actual graphs for all of our testing as well, not just the roundup from above. It’s just there are so many results to read through you might have to be as crazy as me to get through them all. Anyhow, what did I find? Well in nearly ever test the stock clocked Windforce RTX 2070 outperformed the GTX 1080 and went back and forth with the overclocked GTX 1080 with 11 Gbps memory. In fact, to double check I averaged out the results and the RTX 2070 came in with an average of 86.92 FPS, the Windforce RTX 2070 was behind that with 83.21 FPS. Then for the GTX 1080’s the Founders Edition averaged 76.68 FPS and the overclocked model was a fraction of an FPS faster than the stock clocked 2070 with 83.82 FPS. That was across all resolutions.
Compute Benchmarks
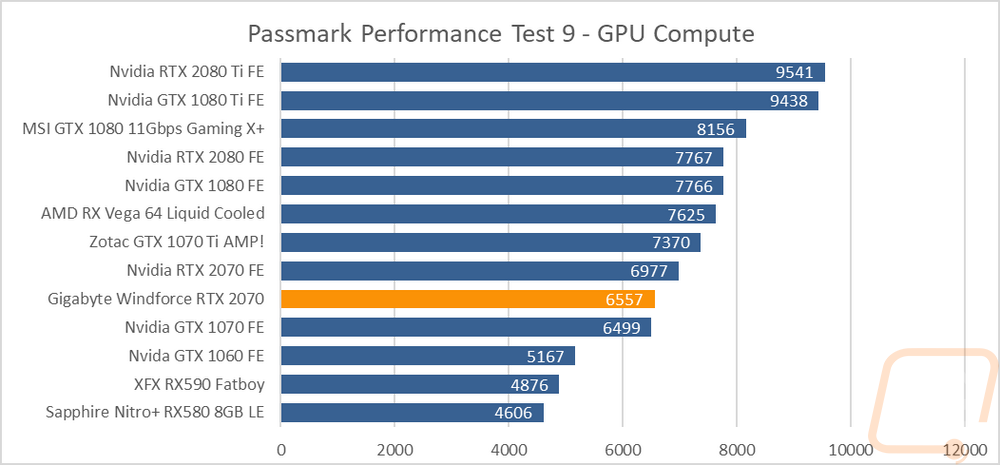
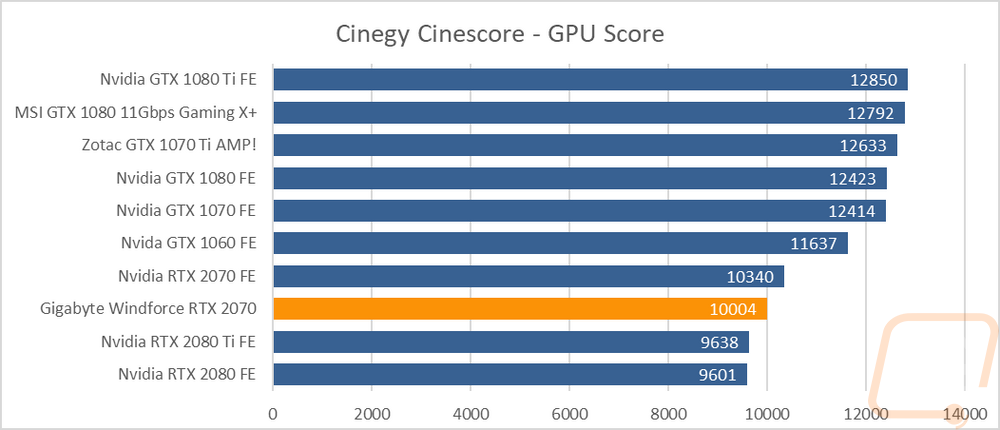
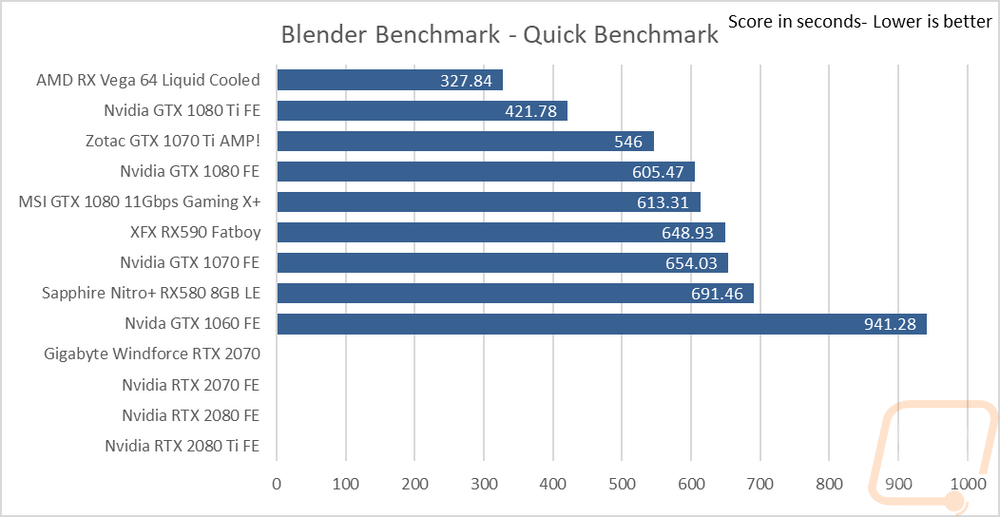
It doesn’t matter to most people but I always still try to include some compute benchmarks in our testing for those of you who might be doing video encoding or other compute related workloads. This time around I was aiming for three tests. The Blender benchmark failed just like on all of the RTX cards and I included it here just to remind everyone that out of the box Blender doesn’t work with the RTX cards though there is a fix coming and I’ve seen some people be able to fix it. Anyhow, for the other tests I ran Passmark Performance Test 9’s GPU Compute test. This is where the GTX 1080 was still much faster. The stock clocked RTX 2070 actually was right in line with the old GTX 1070, the Founders Edition did better but was still not up where I would like to see it perform. The Cinegy test was similar, new tech means compatibility issues early on.
Cooling, Noise, and Power
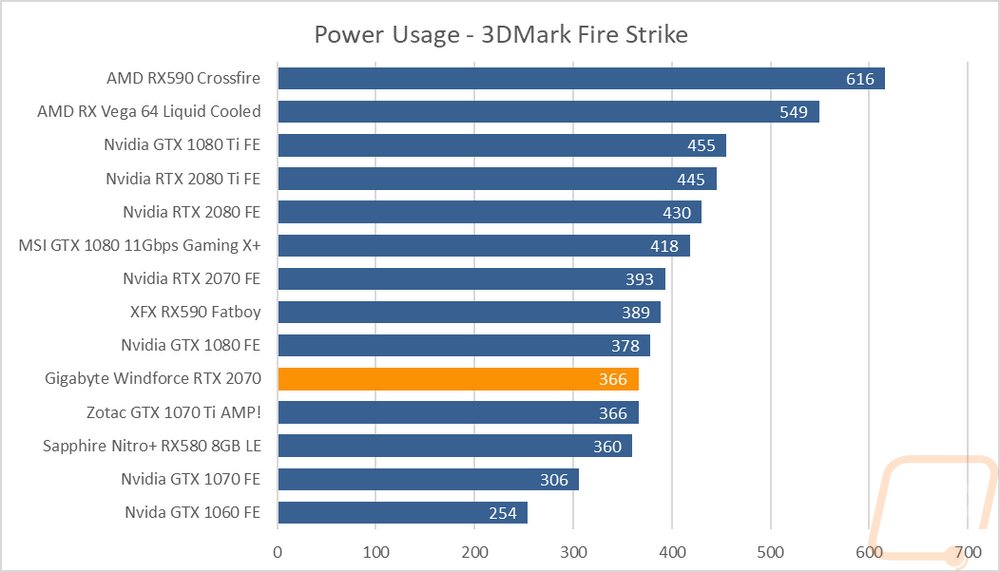
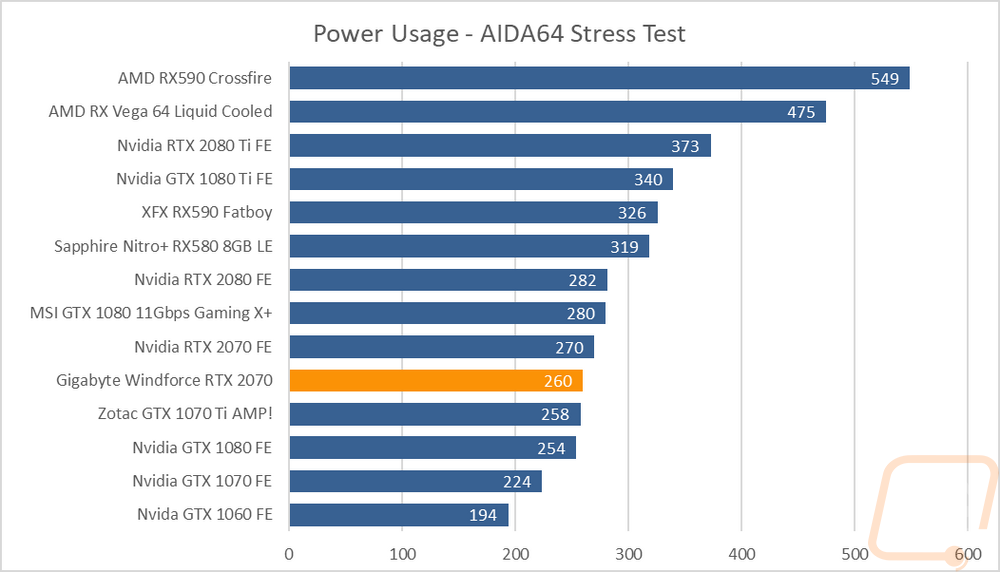
My last batch of testing ends up actually being some of the most important when it comes to comparing between cards with the same GPU. That is because cooling and noise both depend on the cooling design and power usage depends on the overclock, or in this case the stock clock speeds compared to the default overclock the Founders Edition comes with. That is what my first test was, power usage. So I documented the total wattage of our test system under two different loads. The first was while running the 3DMark Fire Strike benchmark, specifically the combined benchmark that runs both the GPU and the CPU to get a look at overall system power usage in a game load. Then I used AIDA64’s stress test to put the GPU under a full load. With the 3DMark load, the Windforce RTX 2070 pulled 366 watts, putting it right with the GTX 1070 Ti. This was 23 watts less than the Founders Edition RTX 2070 pulled with the same load. Then under the AIDA64 stress test, it pulled 260 watts, less than before because there wasn’t a CPU load as well. For that test, the gap between the stock and Founders Edition was 10 watts, more in line with the TDP that Nvidia provided originally as well. In that test, the Windforce was again right with the overclocked GTX 1070 Ti and the stock GTX 1080 FE as well.
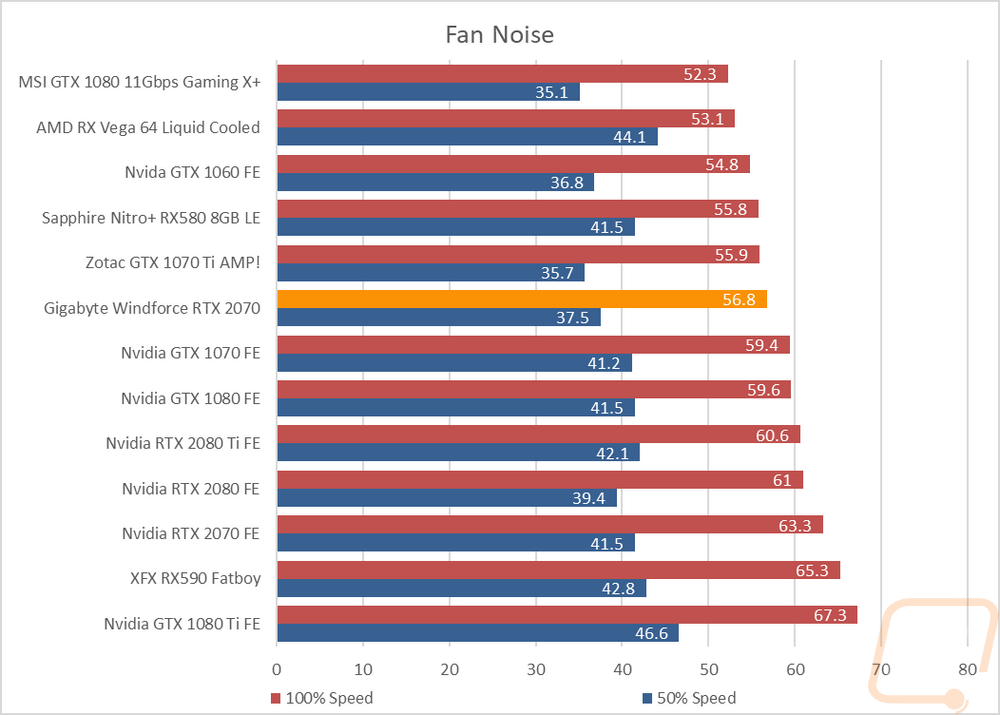
The next test was the fan noise test and as I mentioned earlier this used to be where I would have an issue with the triple fan designs. Clearly however with Gigabyte spinning the middle fan the other direction to drop turbulence they have also cut down noise levels as well because even with three fans the Windforce RTX 2070 came in the much quieter than all of the Founders Edition cards. It is still a little noisier than some of the other custom cards, but you can see the divide with the next card being almost 3 decibels louder.
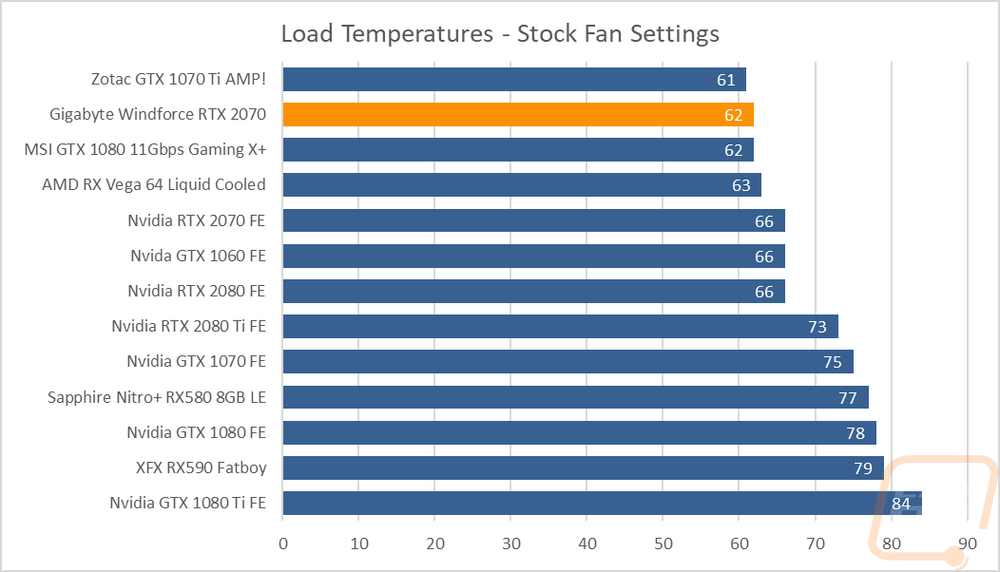
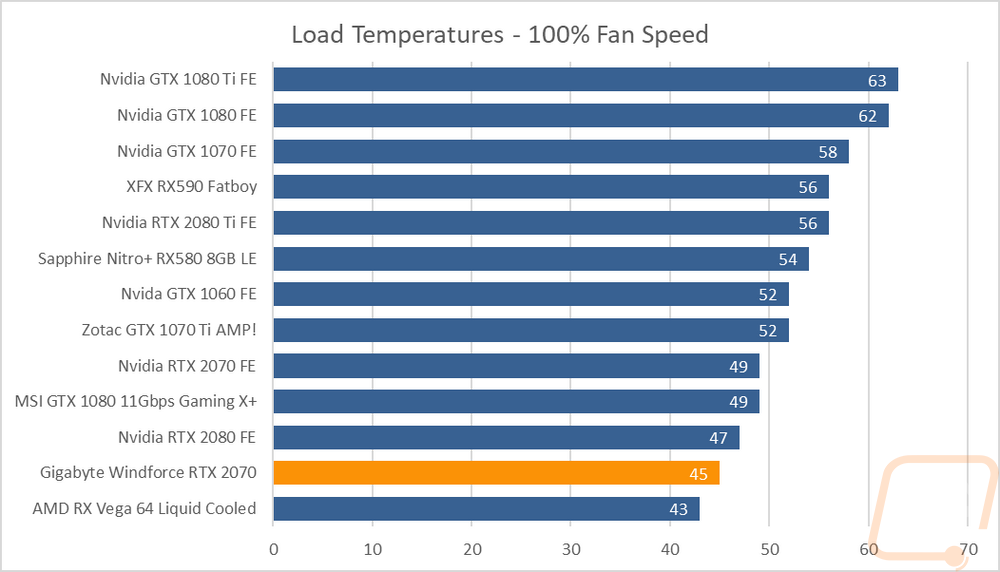
My last tests were focused on the performance of the cooler. Here I used AIDA64 to put the GPU under load over a long period of time and documented the temperature the card leveled off at. I did this twice, once with the stock fan profile and then again with the fans cranked up to 100% fan speed. The idea with that is to check out the out of box performance and then see how much cooling headroom is left. A small delta between those two would indicate that there isn’t much leeway left for overclocking and also that the card would most likely be running the fans higher under long loads. That wasn’t the case here though. The Windforce cooler kept the RTX 2070 running cool with the stock profile with an impressive 62 degrees, cranking the fans up dropped things down to 45 degrees under load. Both at the bottom of our charts and much better than the Founders Edition.
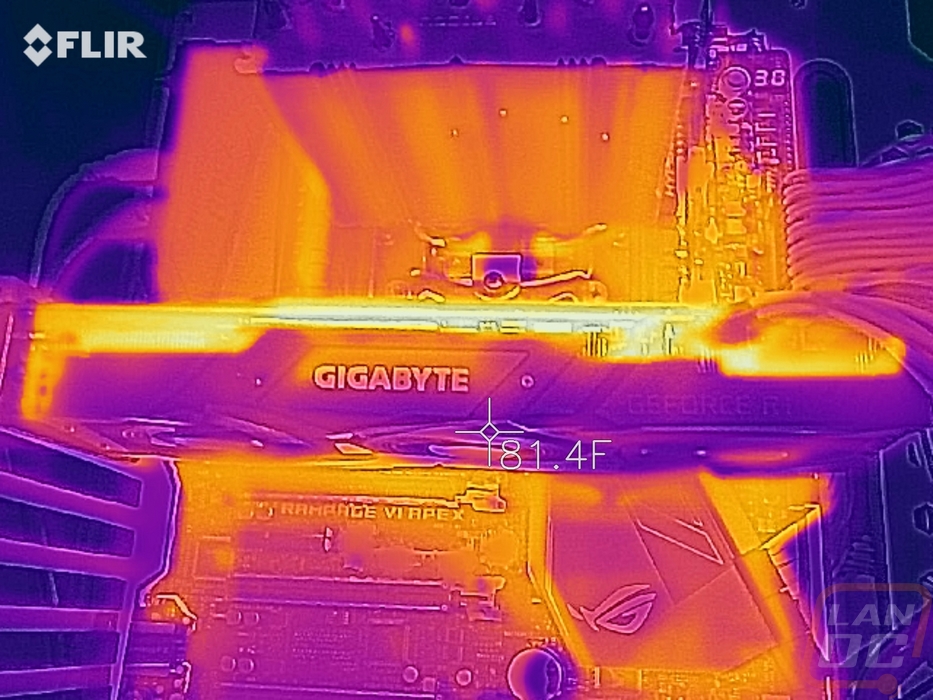
I also busted out the thermal camera to take a look at the card and make sure there weren’t any weird hotspots as well. I thought it was interesting that between the middle and right fans the cooler seems to be better cooled but nothing on that side stood out. The same goes for on the rear. Even with a backplate none of the card ran very hot while under load. The hottest area was on the back past the center towards the end of the card where the VRM heat is at.


Overall and Final Verdict
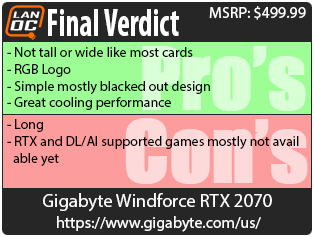
With our testing finished up and having taken a look at the card, let’s recap. So the Gigabyte Windforce RTX 2070 is different from the RTX 2070 Founders Edition that I took a look at in just about every possible way. On the outside, the Founders Edition design is bright and in your face with its silver finish where Gigabyte went with a much subtler all blacked out look. Gigabyte also included an RGB logo up on top where the Founders Edition forced you to still run the green logo, one of my complaints about the card. The Windforce design is also a lot longer with its triple fan design, this was especially different when you compare it to other aftermarket designs. Most other aftermarket designs these days are going with two large fans that force the card to be very tall. Gigabyte went with a longer card design but stayed a lot closer to the traditional PCI height. They also kept the card a 2 slot design, not 2.5 like a lot of other aftermarket cards. While SLI isn’t available on the RTX 2070, this should allow for better fitment in cases with a vertical GPU.
As for performance, I spent a lot of time checking out how the actual stock RTX 2070 performance compared to the overclocked Founders Edition clock speeds as well as the GTX 1080 that the 2070 is priced to match. Obviously, the Founders Edition with its higher clock speeds is faster, but I was happy to see that even at stock speeds the RTX 2070 was within a fraction of an FPS of our overclocked GTX 1080 with 11 Gbps memory and it was faster than the stock clocked GTX 1080. Now we can get back into the argument that we should have seen an improvement in either pricing or performance over the GTX 1080 and I do agree. The RTX 2080 has basically just replaced the GTX 1080 price for price and performance for performance, but offering the potential for RTX support as well as the DL/AI support in the future. With Battlefield V finally being the first game available with RTX support we have learned that there will be a big performance hit to take advantage of that. But I am interested in seeing games with DLSS come out, I think using those AI focused cores is really the only area where you will see the RTX 2070 really pull ahead of the GTX 1080. Sadly that is also one of the big downsides, RTX and DL/AI support is still really not available with the exception of BFV with RTX. So we can only really speculate.
So that brings us to the pricing. Being one of Nvidia’s stock clocked RTX 2070’s the Gigabyte Windforce actually sells for the $499 price point that Nvidia pushed. In fact, it is one of only two RTX 2070s available at that price right now on Newegg. The GTX 1080, on the other hand, has started to rise in price with just one card still available at or below $500 on Newegg. I think that alone really answers the question. If you are looking in the $500 range the Gigabyte Windforce RTX 2070 is going to match or beat the performance of the GTX 1080 and actually be available. Will the RTX and Tensor cores be useful in the future? Well, I suspect the Tensor cores will be, RTX is still up in the air. But keep in mind you also have a little overclocking headroom left, especially considering the cooling performance of the Windforce cooler. The RTX 2070 is still best for people looking to game at 1440p or at higher refresh rates at 1080p so keep that in mind as well.
Live Pricing: HERE


