Cooling, Noise, and Power
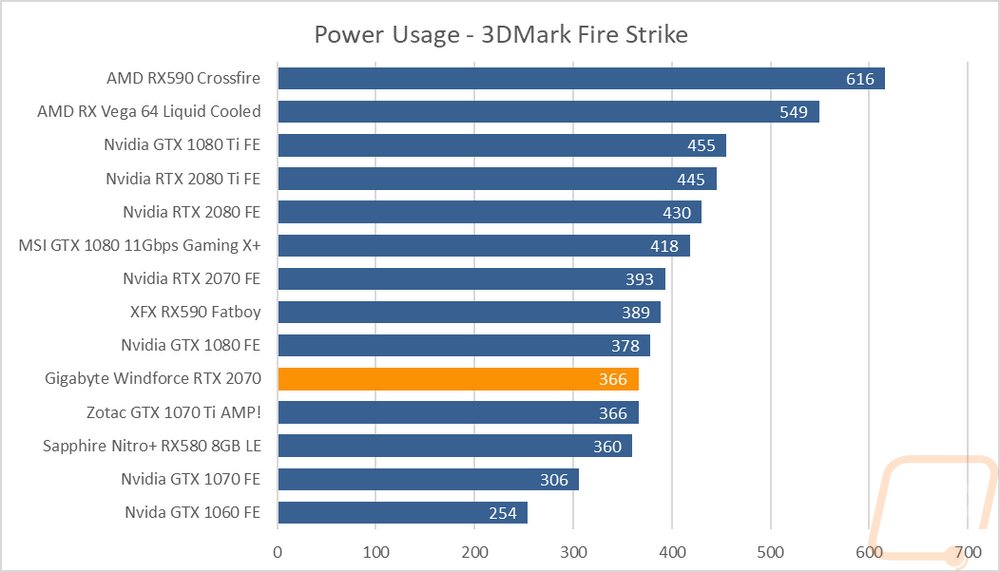
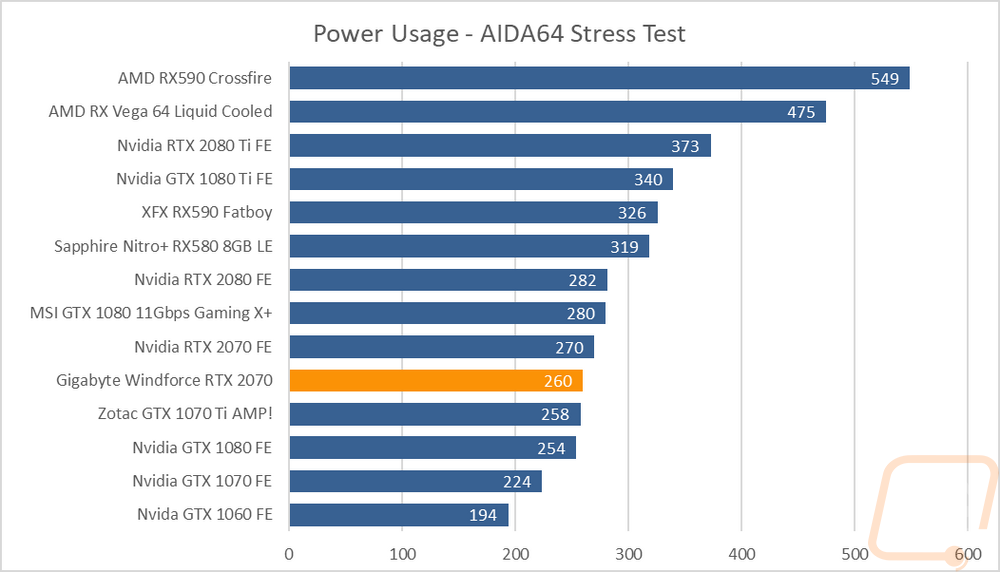
My last batch of testing ends up actually being some of the most important when it comes to comparing between cards with the same GPU. That is because cooling and noise both depend on the cooling design and power usage depends on the overclock, or in this case the stock clock speeds compared to the default overclock the Founders Edition comes with. That is what my first test was, power usage. So I documented the total wattage of our test system under two different loads. The first was while running the 3DMark Fire Strike benchmark, specifically the combined benchmark that runs both the GPU and the CPU to get a look at overall system power usage in a game load. Then I used AIDA64’s stress test to put the GPU under a full load. With the 3DMark load, the Windforce RTX 2070 pulled 366 watts, putting it right with the GTX 1070 Ti. This was 23 watts less than the Founders Edition RTX 2070 pulled with the same load. Then under the AIDA64 stress test, it pulled 260 watts, less than before because there wasn’t a CPU load as well. For that test, the gap between the stock and Founders Edition was 10 watts, more in line with the TDP that Nvidia provided originally as well. In that test, the Windforce was again right with the overclocked GTX 1070 Ti and the stock GTX 1080 FE as well.
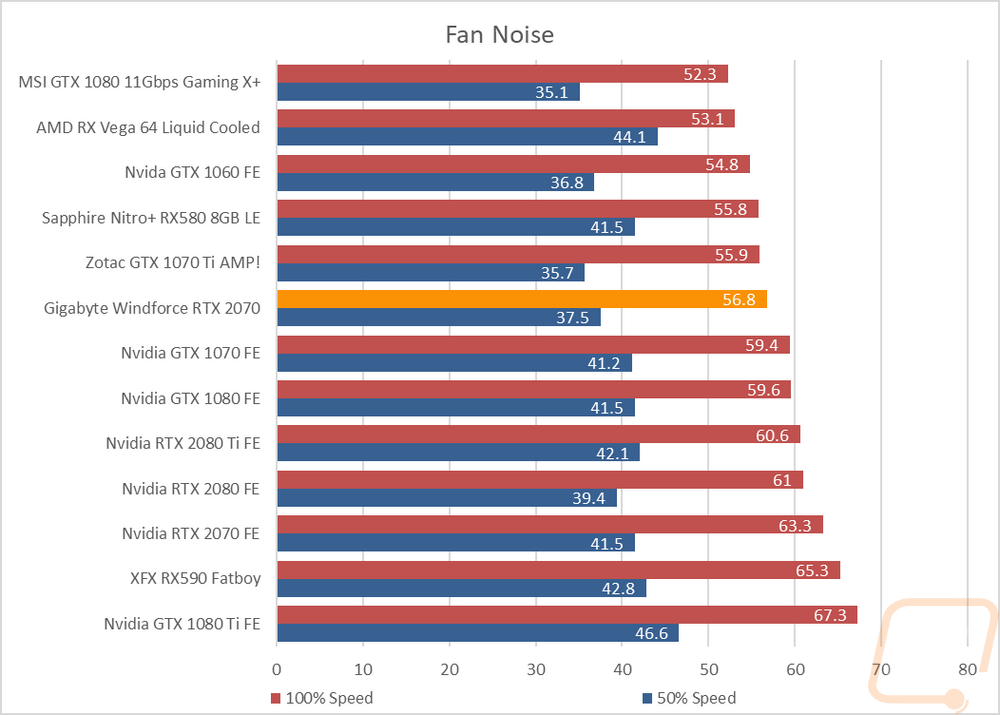
The next test was the fan noise test and as I mentioned earlier this used to be where I would have an issue with the triple fan designs. Clearly however with Gigabyte spinning the middle fan the other direction to drop turbulence they have also cut down noise levels as well because even with three fans the Windforce RTX 2070 came in the much quieter than all of the Founders Edition cards. It is still a little noisier than some of the other custom cards, but you can see the divide with the next card being almost 3 decibels louder.
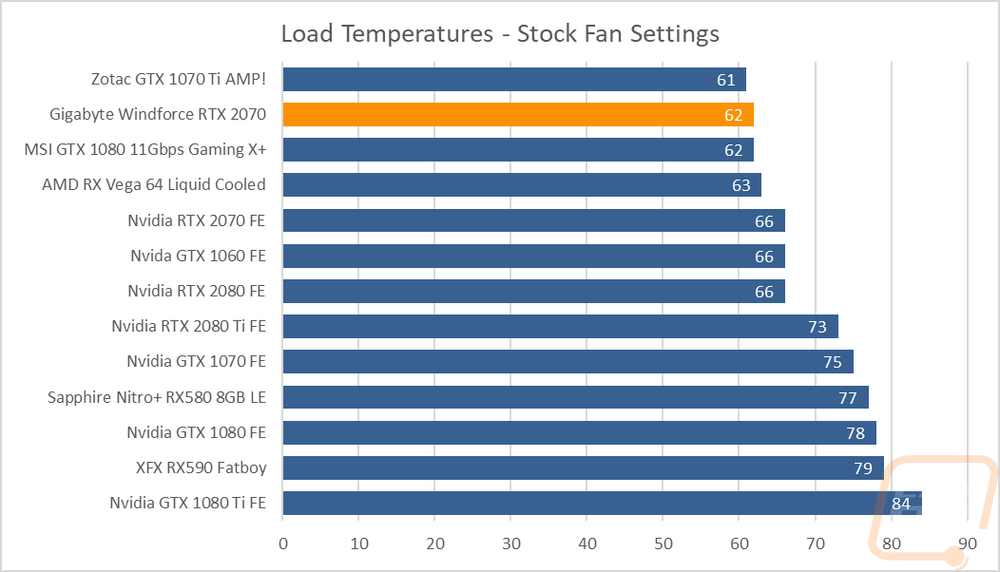
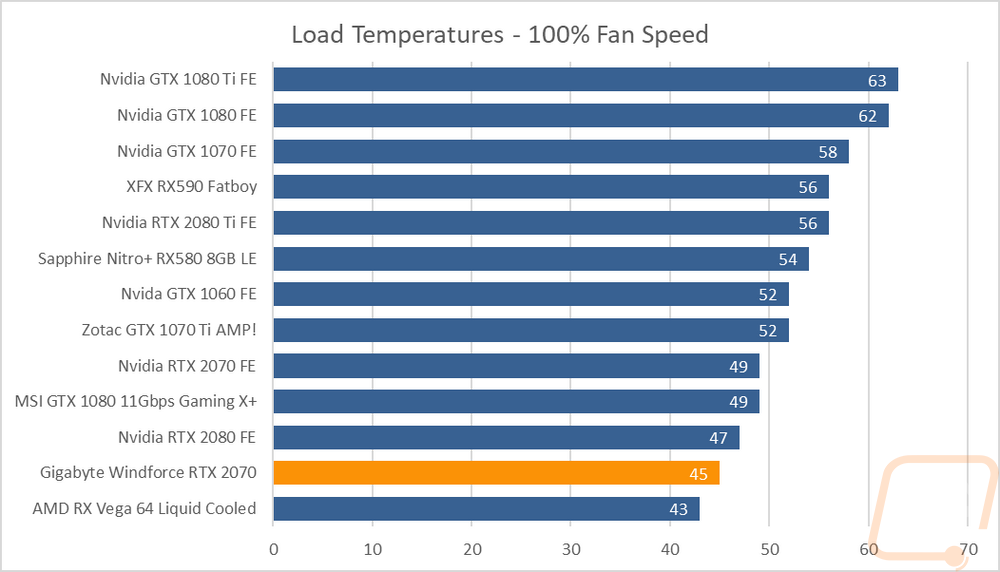
My last tests were focused on the performance of the cooler. Here I used AIDA64 to put the GPU under load over a long period of time and documented the temperature the card leveled off at. I did this twice, once with the stock fan profile and then again with the fans cranked up to 100% fan speed. The idea with that is to check out the out of box performance and then see how much cooling headroom is left. A small delta between those two would indicate that there isn’t much leeway left for overclocking and also that the card would most likely be running the fans higher under long loads. That wasn’t the case here though. The Windforce cooler kept the RTX 2070 running cool with the stock profile with an impressive 62 degrees, cranking the fans up dropped things down to 45 degrees under load. Both at the bottom of our charts and much better than the Founders Edition.
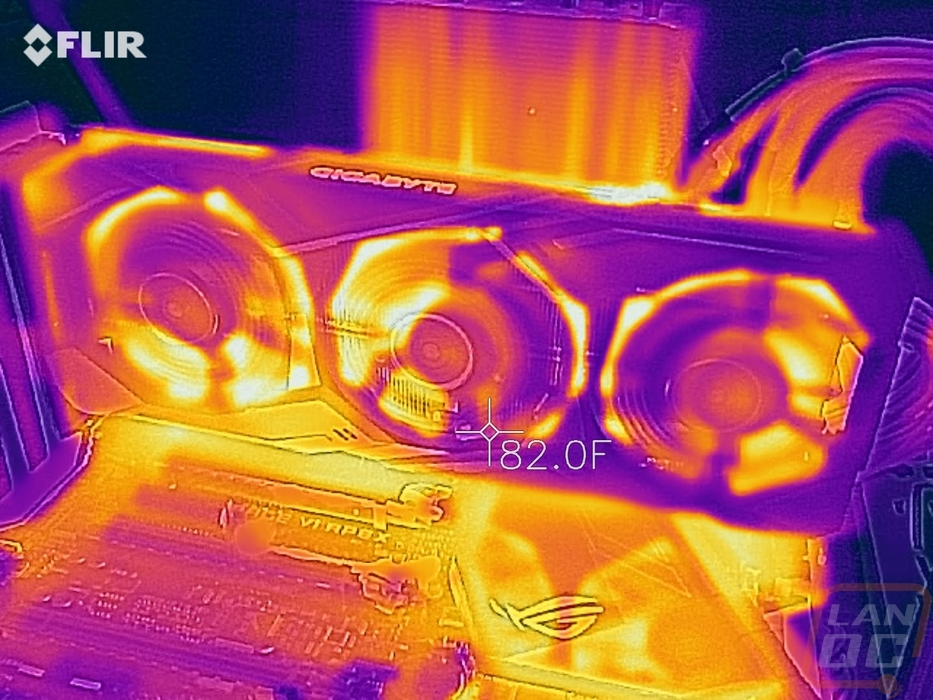
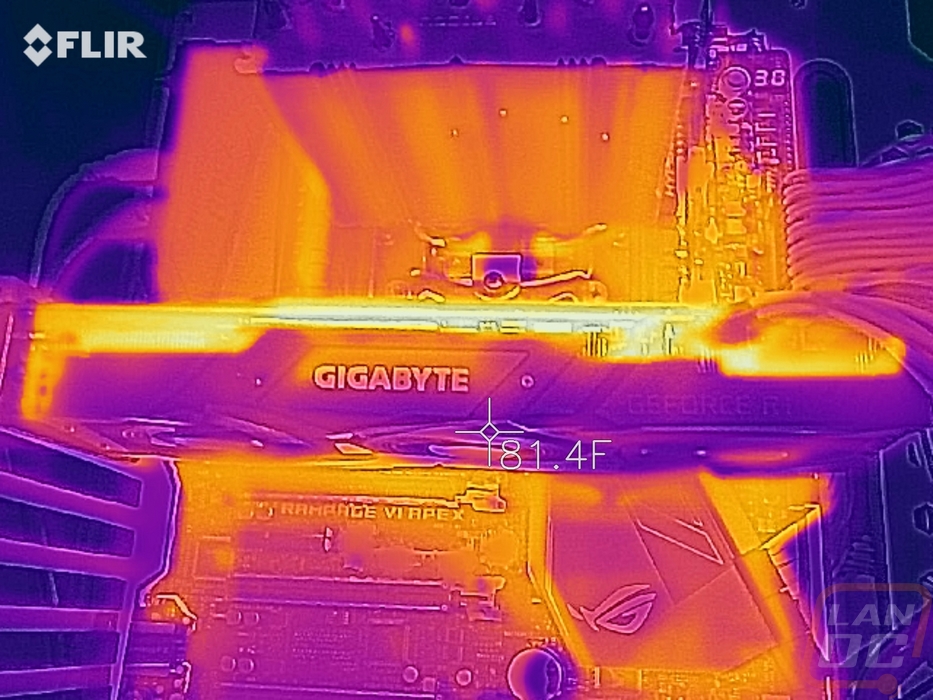
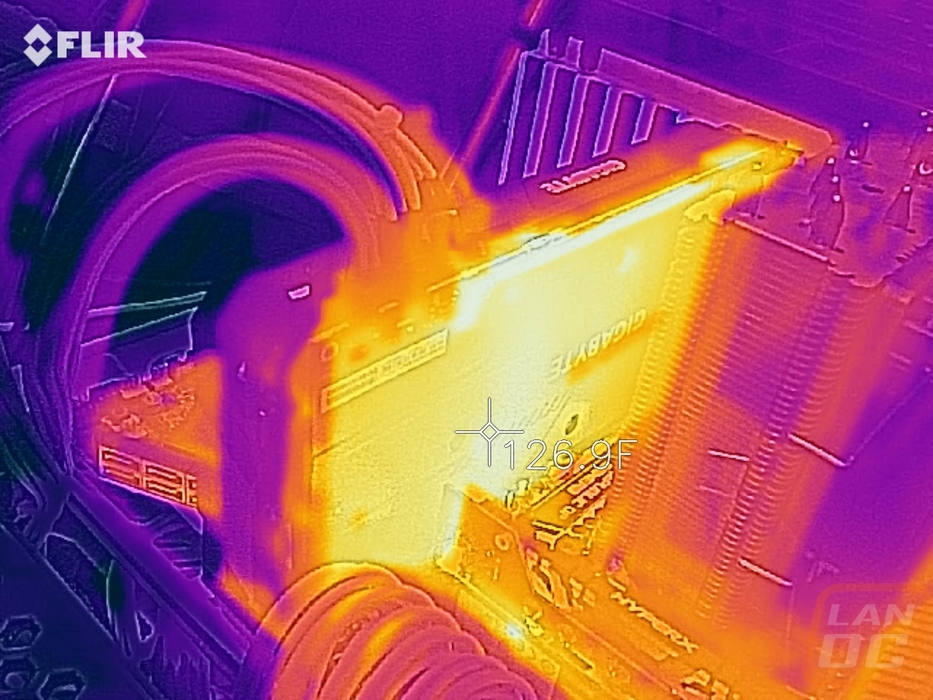
I also busted out the thermal camera to take a look at the card and make sure there weren’t any weird hotspots as well. I thought it was interesting that between the middle and right fans the cooler seems to be better cooled but nothing on that side stood out. The same goes for on the rear. Even with a backplate none of the card ran very hot while under load. The hottest area was on the back past the center towards the end of the card where the VRM heat is at.