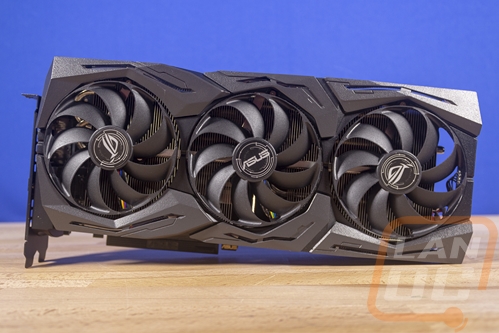
Cooling, Noise, and Power
My last round of testing is actually the most important when comparing the same GPU cards with different coolers and clock speeds like the Strix and the Founders Edition. I take a look at cooling performance, noise, and power usage. The heatsink is really important here as is the overclock when it comes to temps and power usage.
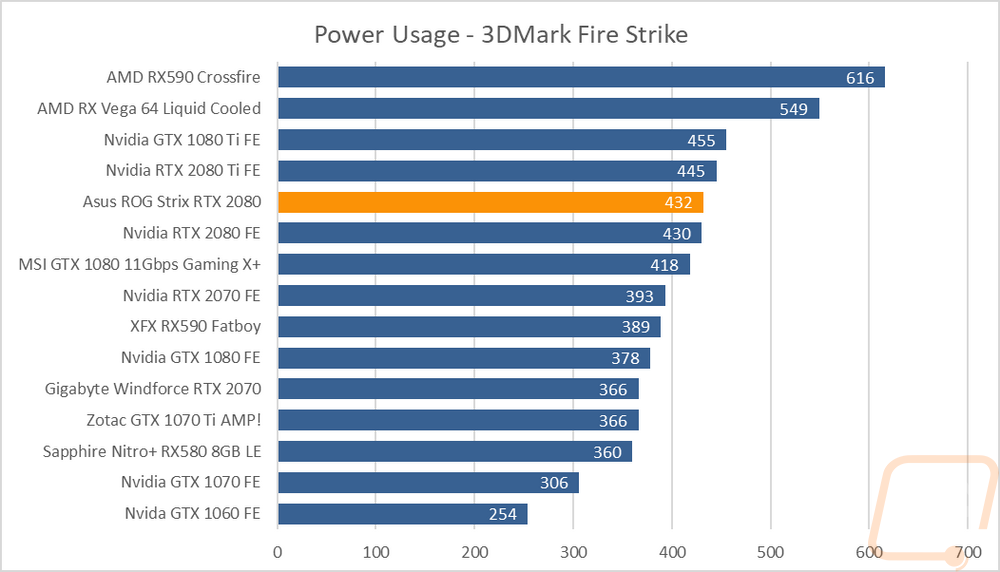
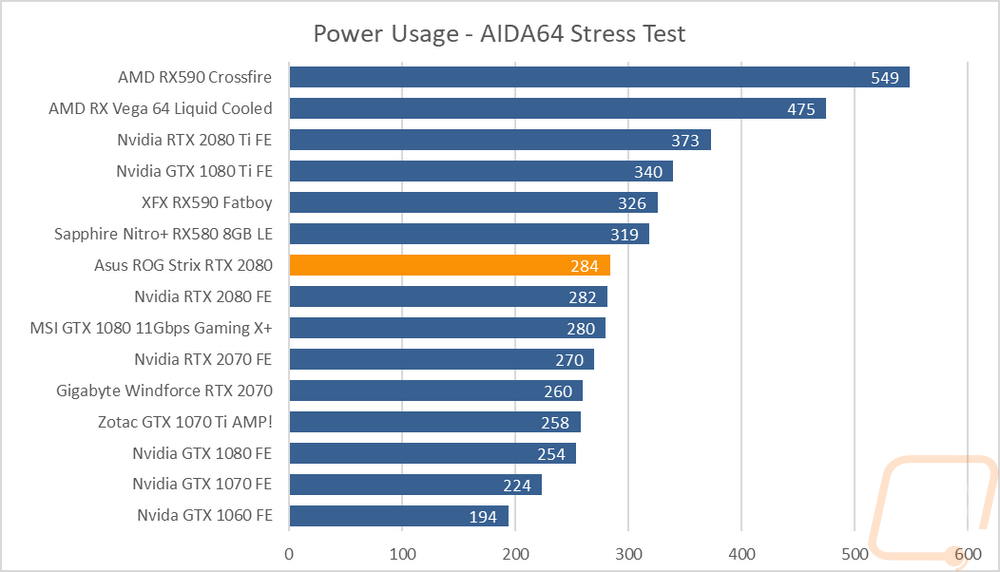
So the first tests are power focused. With both, I used our Kill-A-Watt to monitor the total system power draw of the test bench including the video card. Then I put the system under two different load types. The first one was using 3DMark with the combined test that loads the CPU and GPU in a similar way to most games that helps give us a look at overall system draw. Then I went back and used AIDA64’s stress test to just load the GPU. That second test is a more unrealistic load, but it does give us a better look at a more maxed out power usage. There is one thing though, with this being an RTX card both tests don’t load up the RT or Tensor cores, so there is still a little room for additional power draw later when/if those aspects get more use. Anyhow on to the numbers. With 3DMark the Strix 2080 actually pulled nearly the same wattage as the 2080 Founders Edition, with the difference being just two watts. This was just over 20 watts less than the 1080 Ti and above the 1080 11Gbps. With the AIDA64 load, I just confirmed exactly what I saw before with just 2 watts being the difference between the RTX 2080s again and here the gap between the 2080 and the 1080 Ti was later at 56 watts.
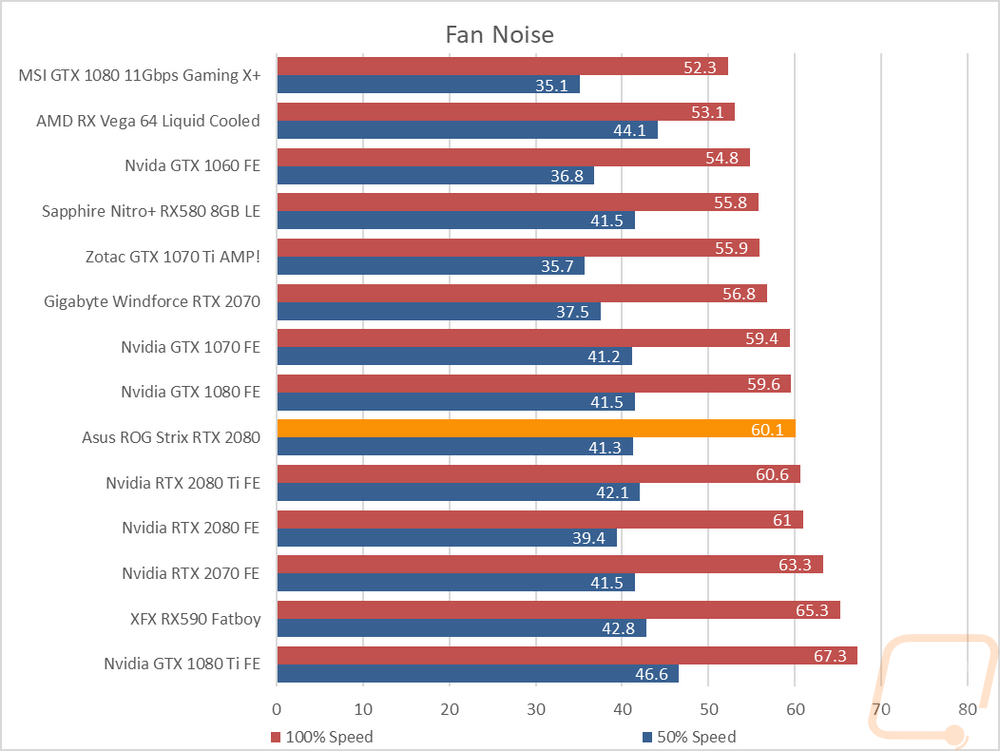
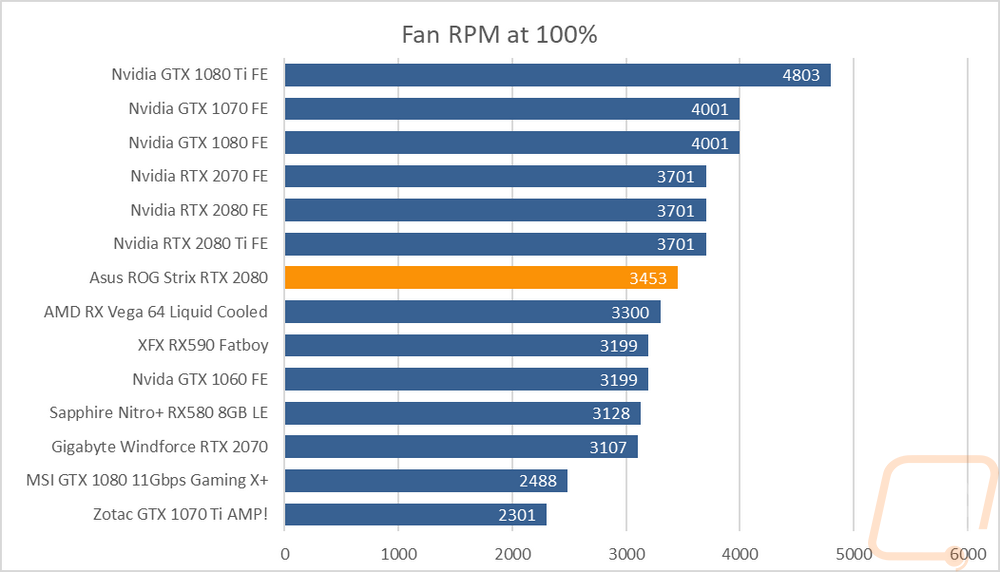
For noise testing our test bench configuration is going to give higher results than a video card inside of a closed system. That said it does help get a more direct listen to the noise levels. I use a decibel meter set up 18 inches away from the GPU at a 45-degree angle but facing the fan side and I test 100% fan speed and 50% fan speed. Idle numbers are pointless now that all cards turn the fans off when not under load and “in game” numbers are hard to replicate because the fans will go up and down in speed. The 50% and 100% numbers at least help look at the range that you can expect depending on how well the card cools. In a lot of situations, a well cooling card will never even need to reach 50% fan speed. Anyhow at 100% fan speed the Strix RTX 2080 came in the middle of our charts and not far from the different dual fan Founders Edition models. The new fan design did push a lot of air but the downside to that is the more air they push the more noise it can make. When turned down to 50% fan speed actually the Founders Edition was quieter. Funny enough when looking at the 100% fan RPM numbers the Strix card actually had its fans running slower, but having a third fan doesn’t help things. This also explains Asus having the dual BIOS setup to flip to a quieter fan profile as well.
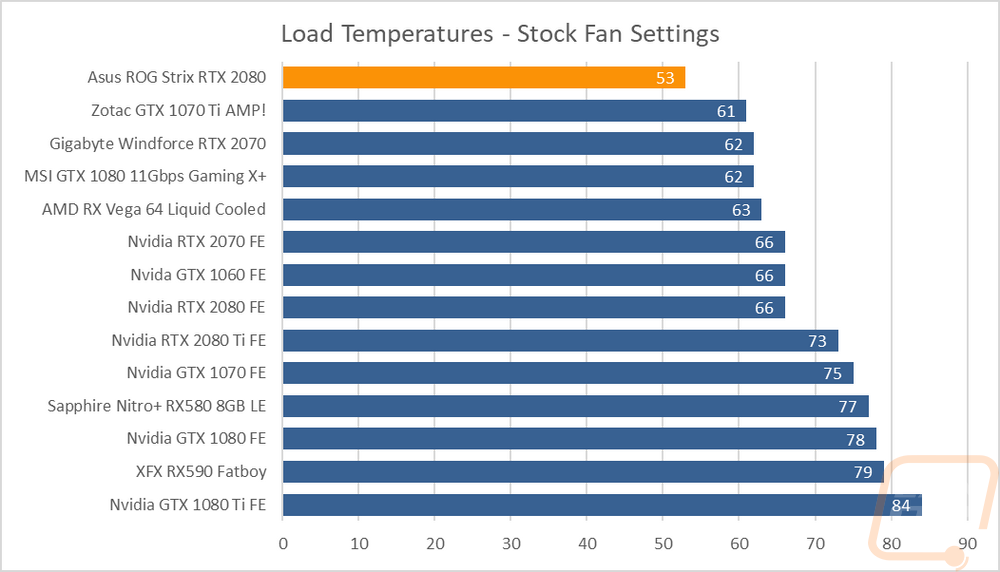
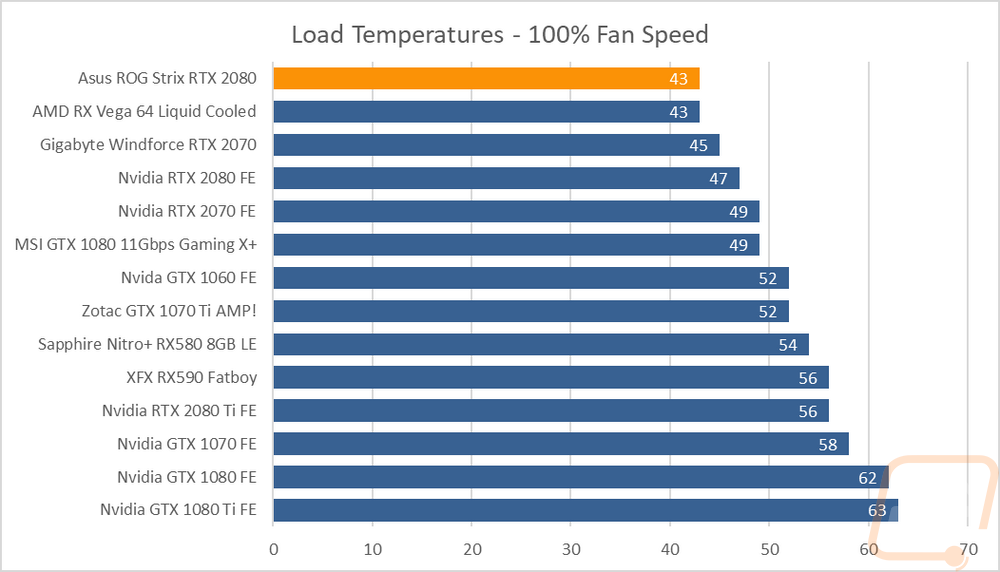
The last test was looking at temperatures. Remember fan noise also depends on if the fans even need to run at higher speeds. To test this I used AIDA64 again because remember it is a bigger load than most games. I tested twice, letting the load run for a half hour or until the temperature leveled off. I tested once with the stock fan settings and then again with the fans turned up to 100%. The stock speeds show us out of the box cooling performance and then 100% fan speeds show the cooling potential of the cooler. A big delta between those can mean even more overclocking headroom or a really aggressive stock fan profile that can be toned down for less noise if needed. You will notice though that the ROG Strix RTX 2080 came in at the top of both charts, this cooler did an amazing job. With the stock fan profile, it leveled out under load at 53 degrees. For comparison, the RTX 2080 Founders Edition which doesn’t have a bad cooler came in at 66 and the 1080 Ti was at 84. Cranking the fans up still managed to get more cooling performance. The temps were 10 degrees lower at 43 degrees, this was on par with the water-cooled Vega card. The 2080 FE wasn’t too far behind at 47 degrees and the 1080 Ti was 20 degrees higher at 63 degrees. So the wide cooler design and those aggressive fans are putting in work.
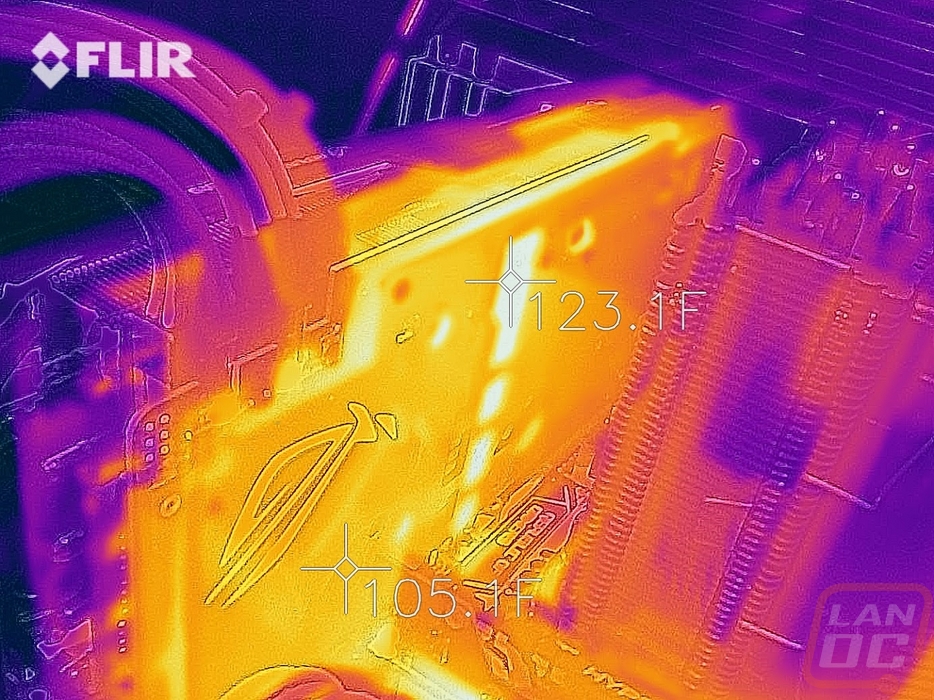
While doing temperature testing, specifically with the stock fan profile, I did get a few thermal images of the Stix 2080 at work. A look at the fan side shows that the hottest area of the heatsinks and the card is the center bearing area on the fans. This is partially because the fans create heat, but that is also an area that gets less airflow as well. Even so, the numbers on this side are really good. The heatsink isn’t getting overloaded at all.
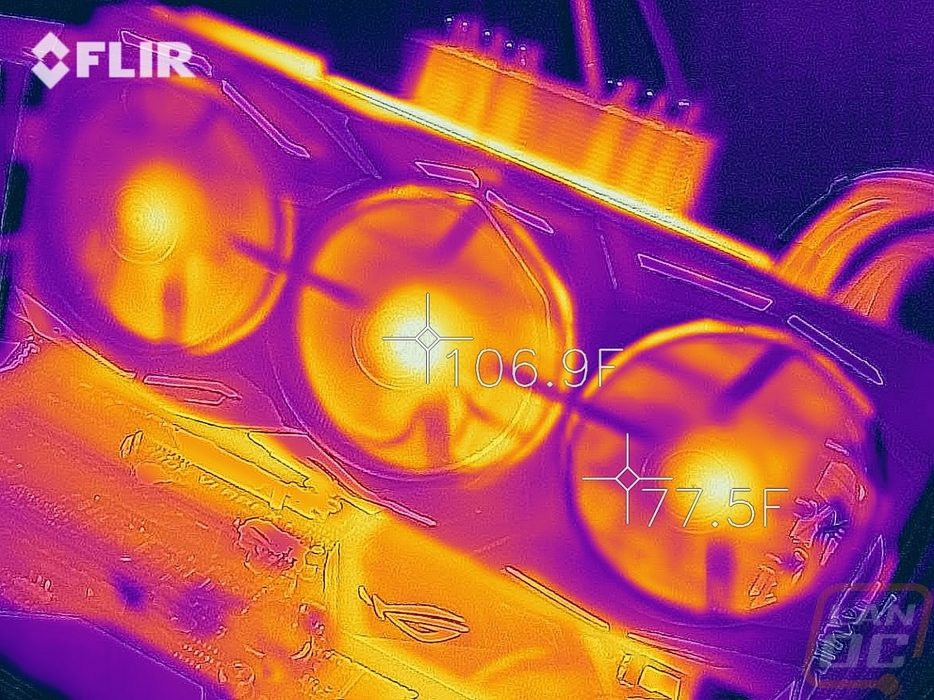
Up on the top edge, you can see the heatsink running around 107f or 41/42c and that up on the PCB it was close to 50c. This shows the heatsink pulling the heat up and out.
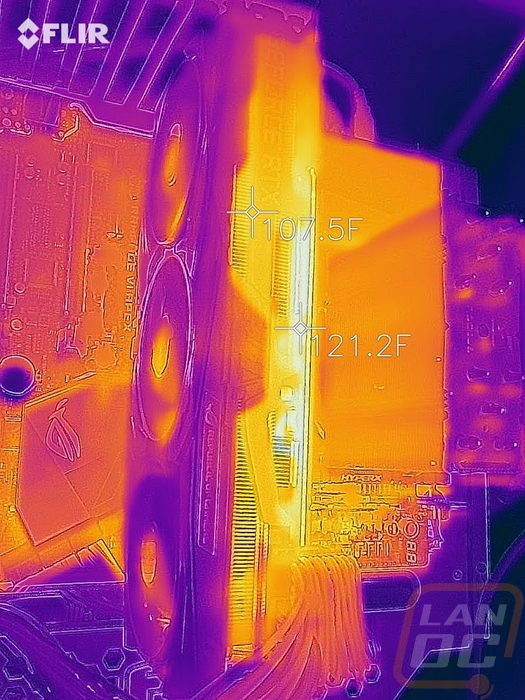
Then a look at the backplate shows that it is insulating some of the heat with the PCB behind it running warmer than the backplate and the exposed power circuitry is the hottest external part of the card. I did note a really cool shot of the heatpipes on the left side of this picture. You can see how they are pulling the heat out across the heatsink.