In-Game Benchmarks
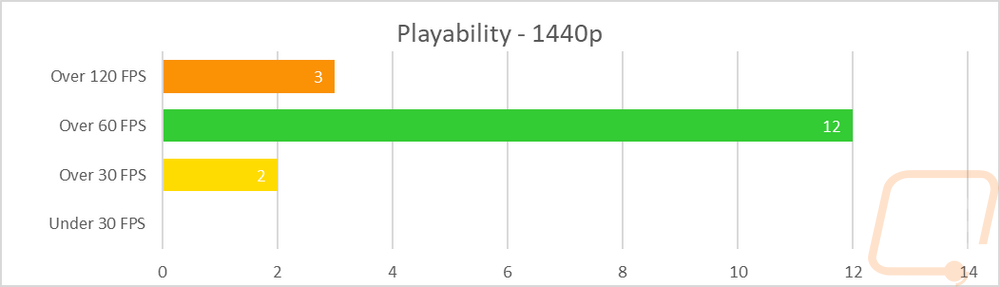
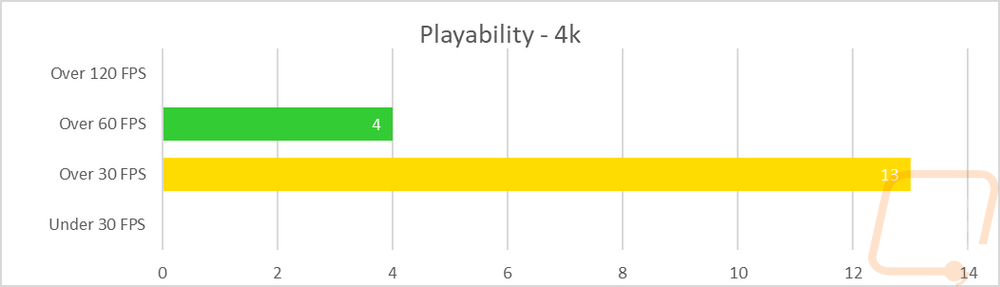
Now we finally get into the in game performance and that is the main reason people pick up a new video card. To test things out I ran through our new benchmark suite that tests 12 games at three different resolutions (1080p, 1440p, and 4k). I also slipped in a few variations on the same games for comparisons like DX11 to DX12, OpenGL to Vulkan, and a couple of games are just tested at their highest setting and lower but still high detail options to show the performance difference when things are turned down slightly. In total, each video card is tested 54 times and that makes for a huge mess of graphs when you put them all together. To help with that I like to start off with these overall playability graphs that take all of the results and give an easier to read the result. I have one for each of the three resolutions and each is broken up into four FPS ranges. Under 30 FPS is considered unplayable, over 30 is playable but not ideal, over 60 is the sweet spot, and then over 120 FPS is for high refresh rate monitors. This covers all of the games tested except Final Fantasy XV that we have a score rather than an FPS because they like to be different.
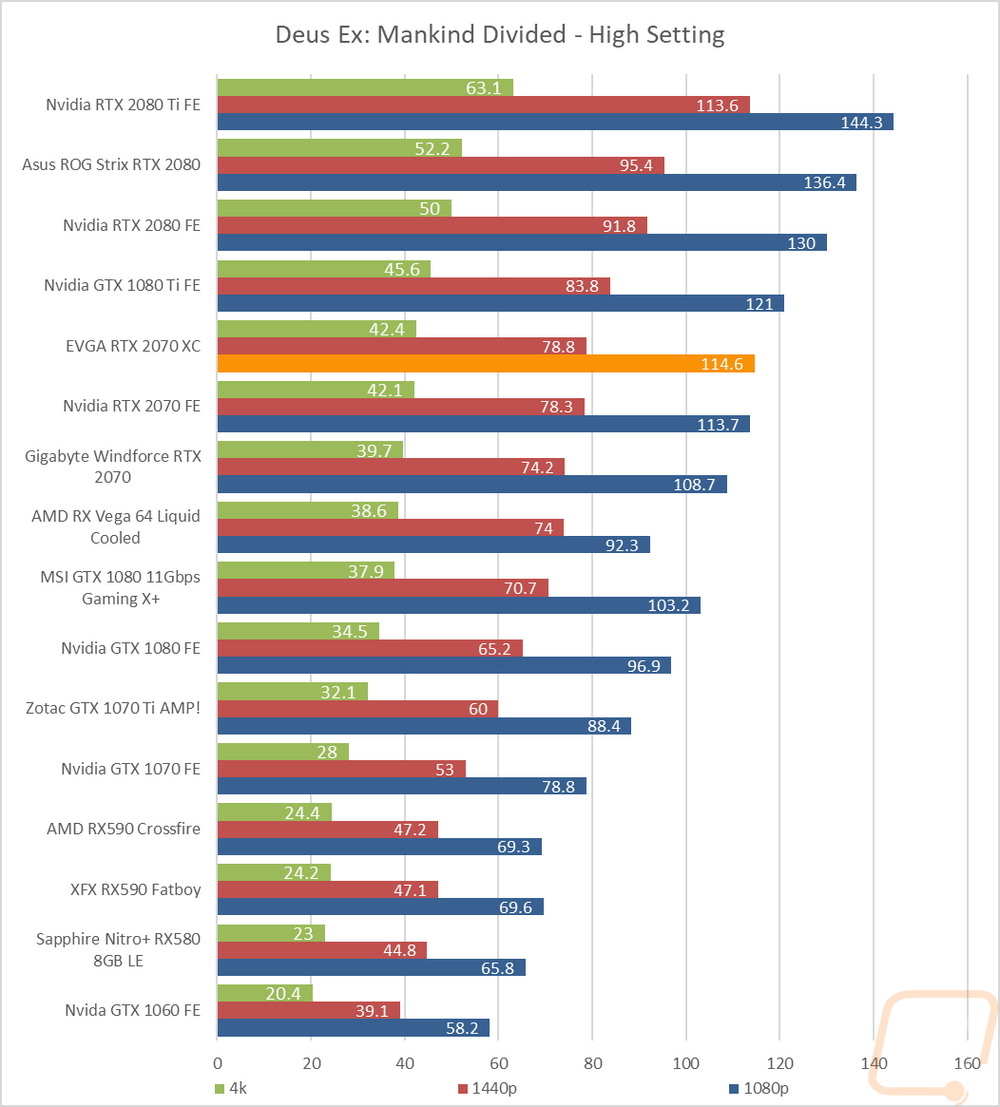
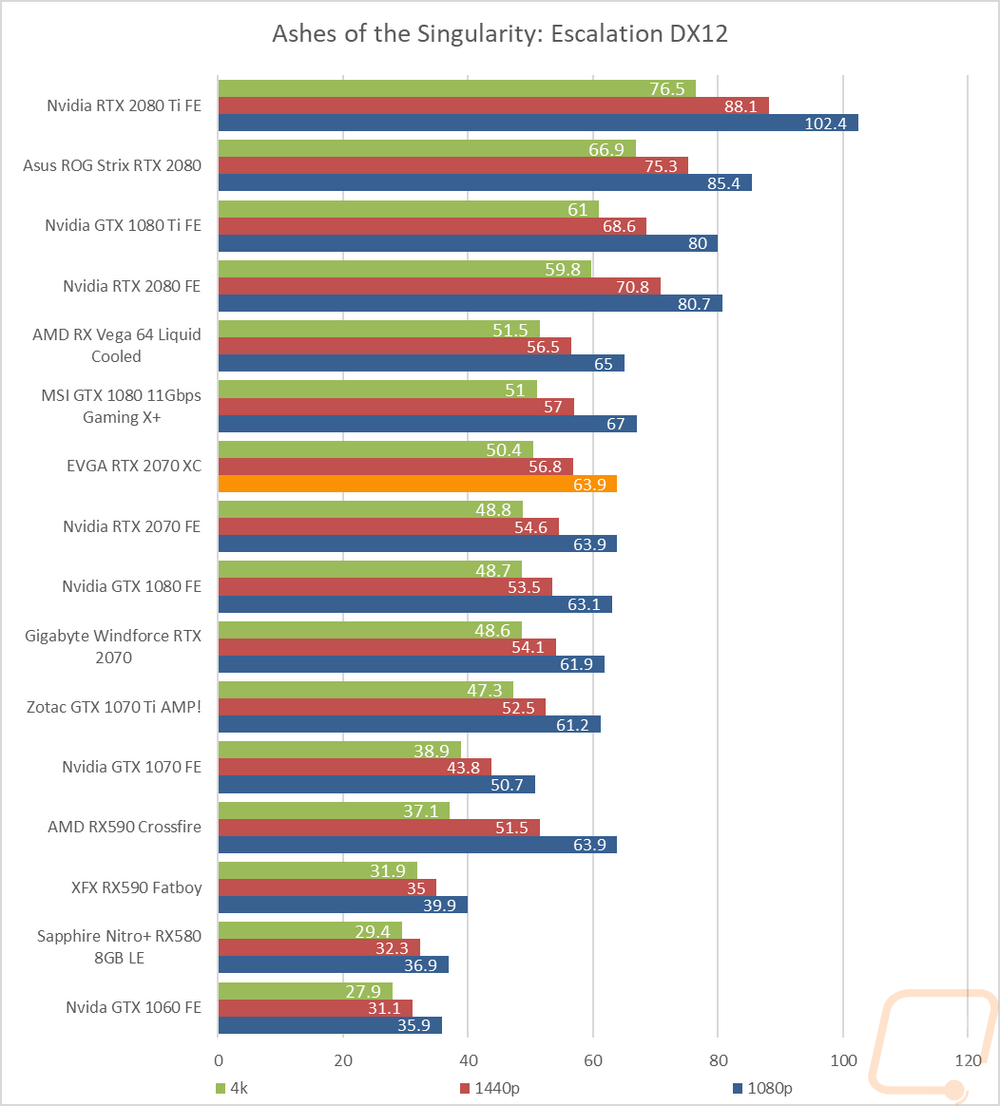
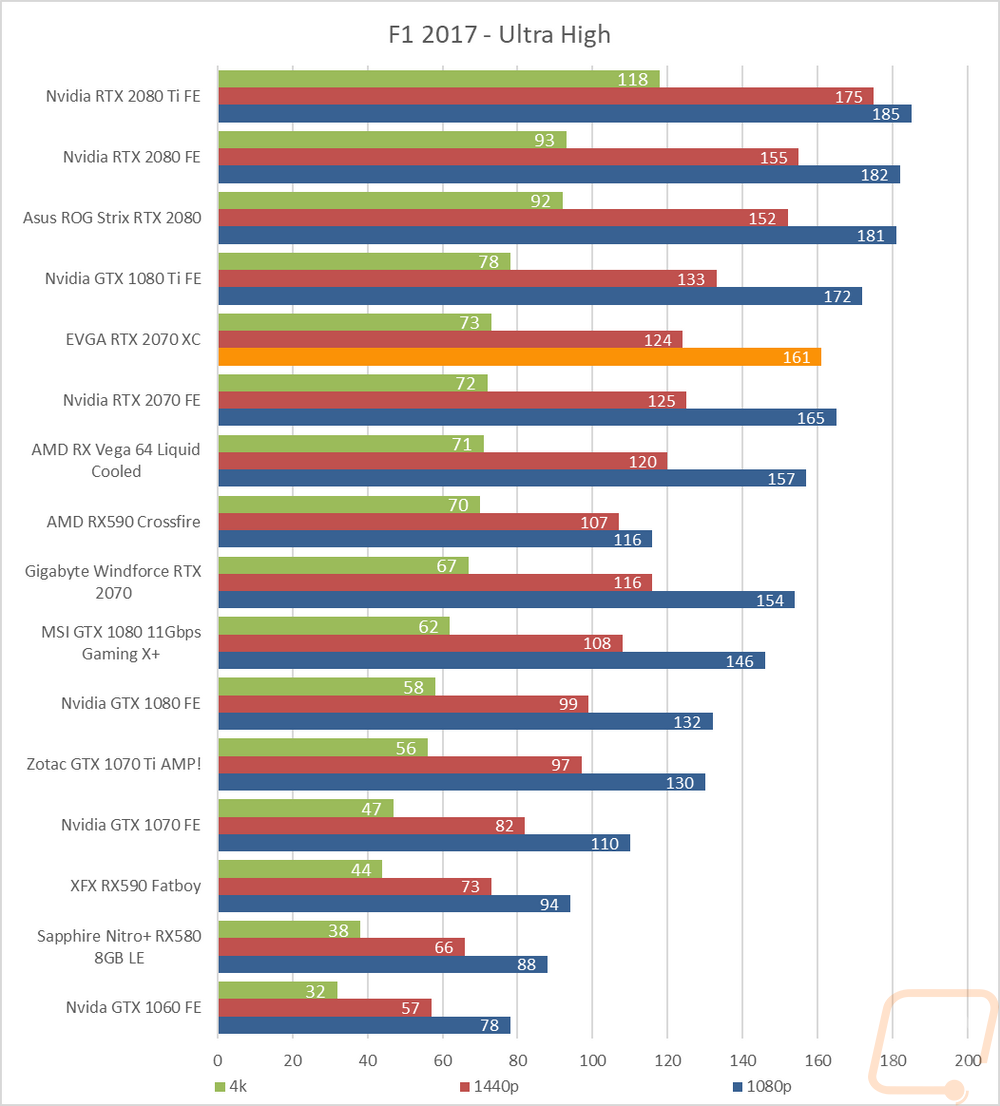
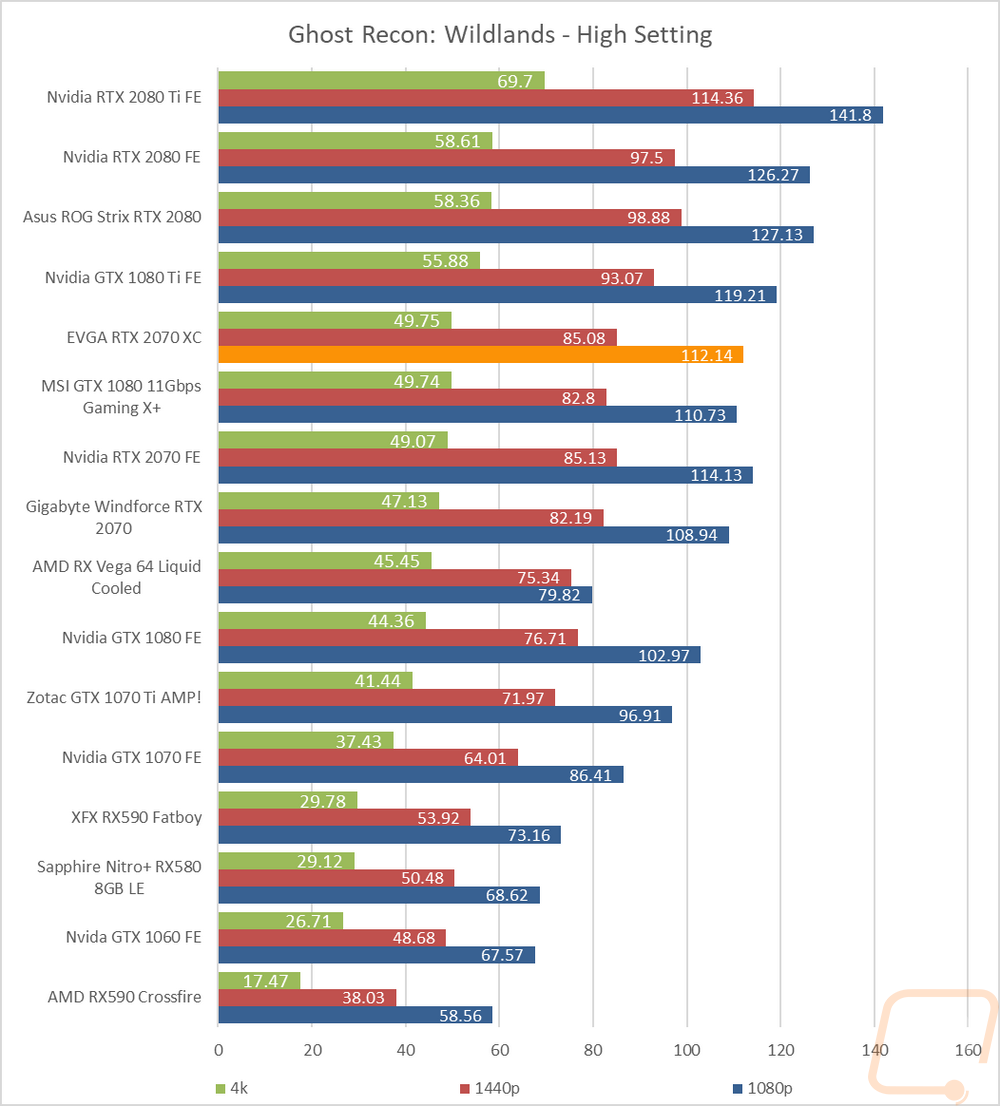
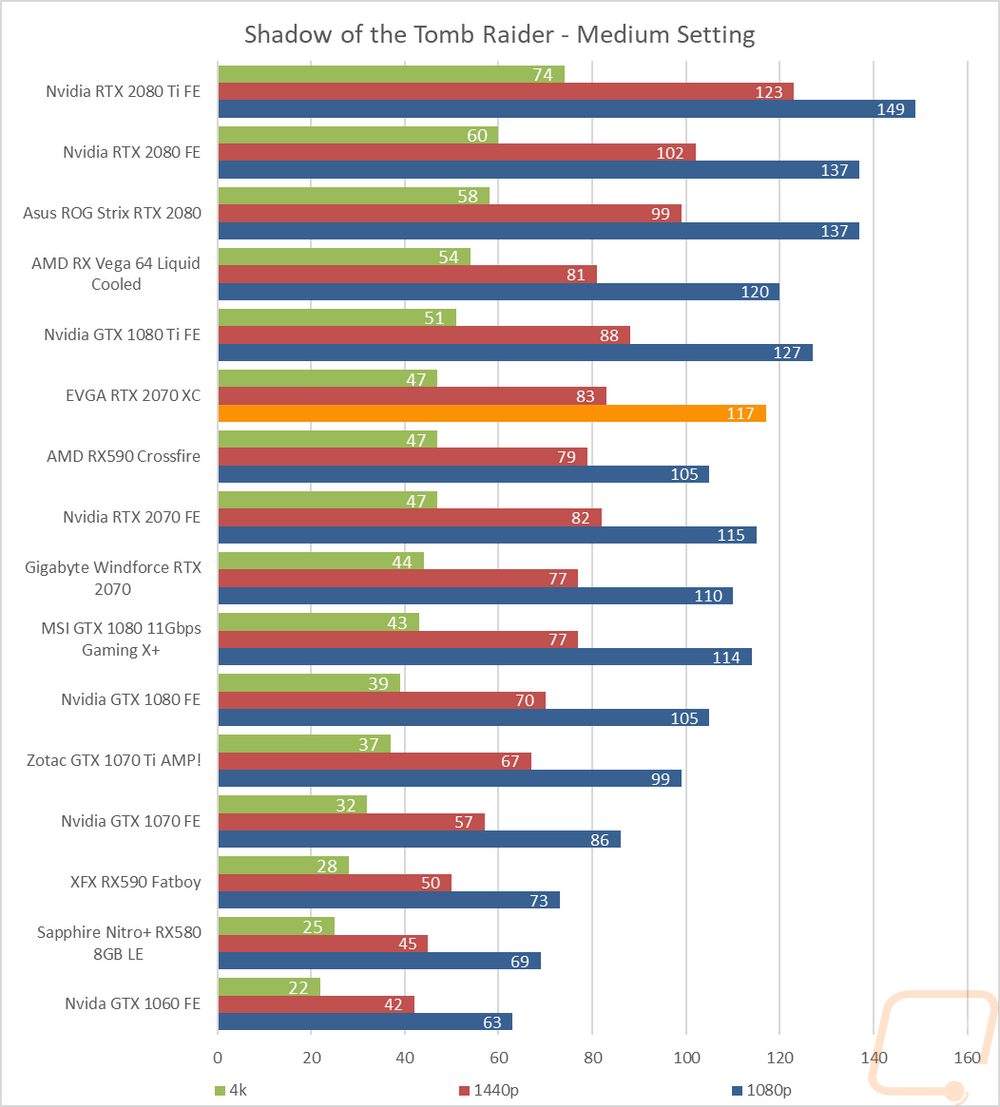
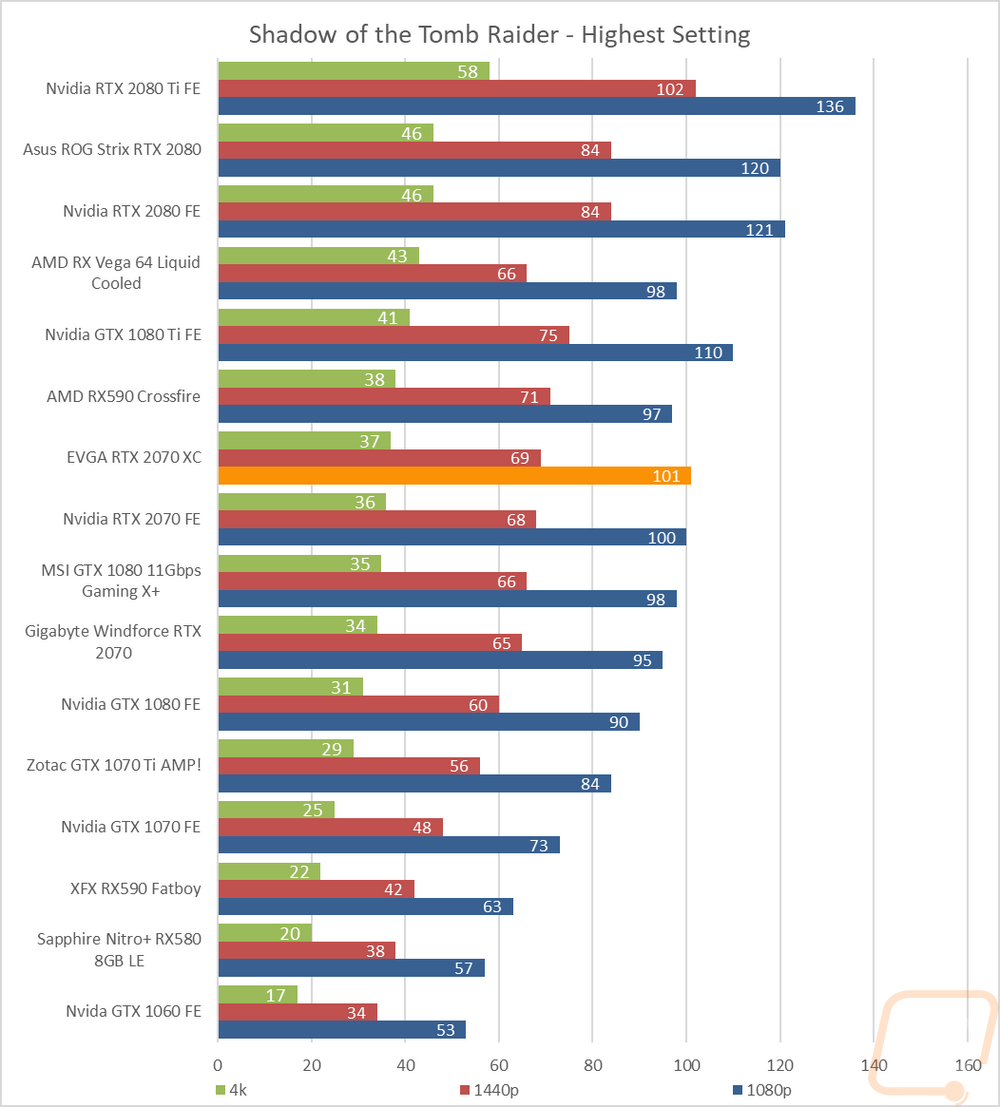
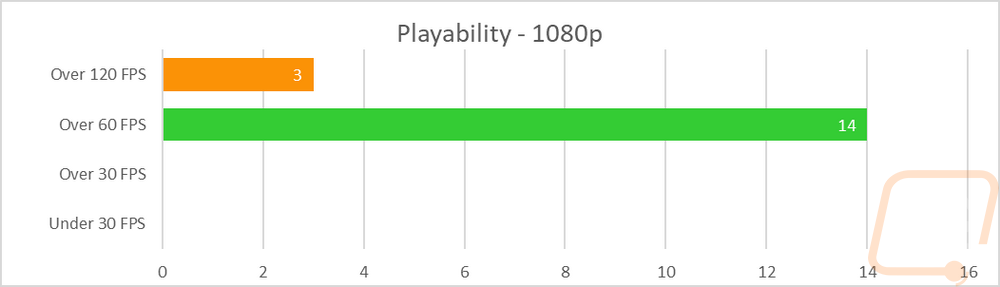
So how did the EVGA RTX 2070 XC perform? Well, the 1080p chart shows that the RTX 2070, especially the EVGA XC version is going to handle anything you throw at it at that resolution. Even with almost all of our tests being at the highest possible settings, everything was above 60 FPS and three were up over 120 FPS. What this doesn’t show is that nine of those 14 in the 60+ range were actually over 100 FPS with a few just a few FPS short of the 120 FPS cutoff. Two more were around 98 FPS as well, so if anything this chart doesn’t show just how dominant the card is at 1080p. 1440p looks similar but there are two that came in the 30-60 range. This was an improvement over the Gigabyte RTX 2070 that runs at the stock RTX 2070 speeds which had 3. But for the most part, 1440p is completely covered. Then at 4k, we can see the big dropoff where the RTX 2070 can’t handle 4k with just four games coming in over 60 FPS.
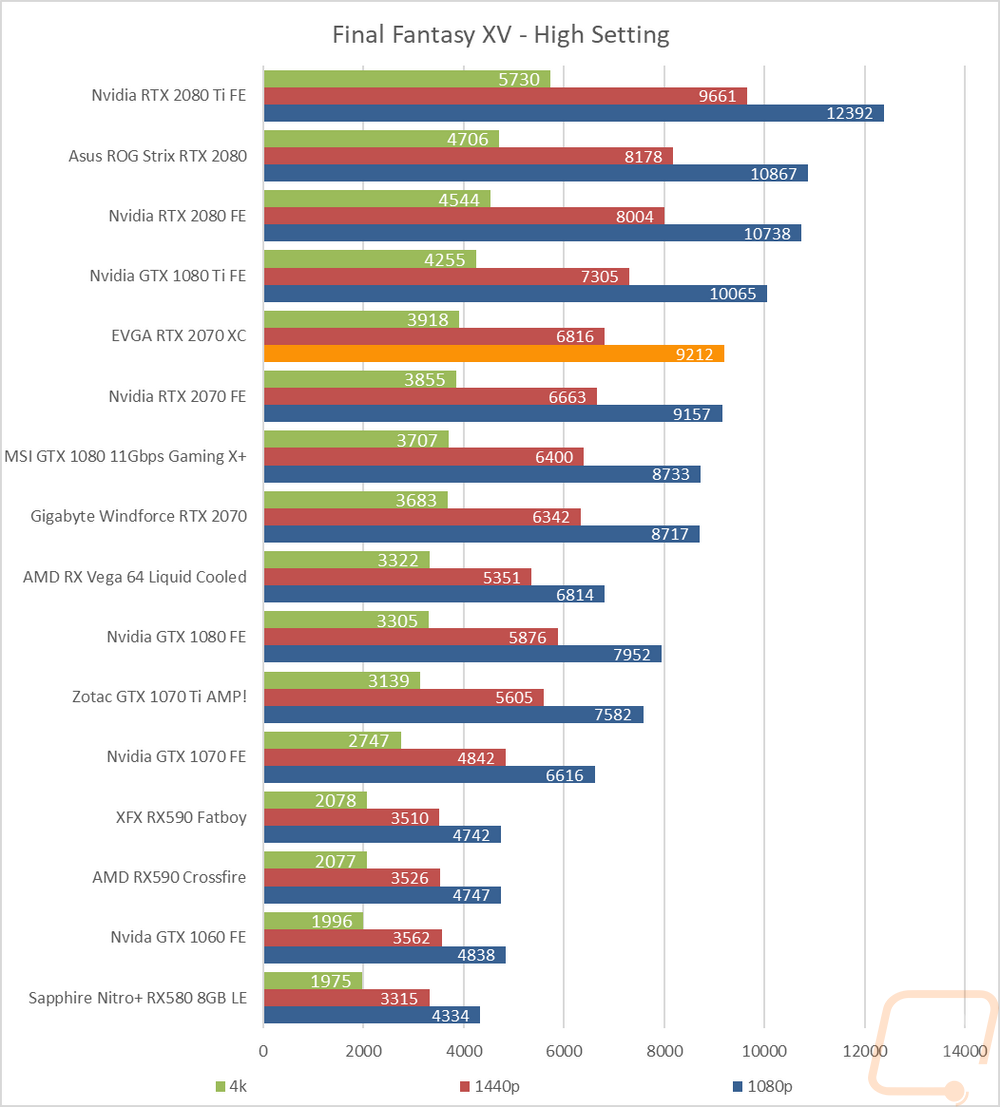
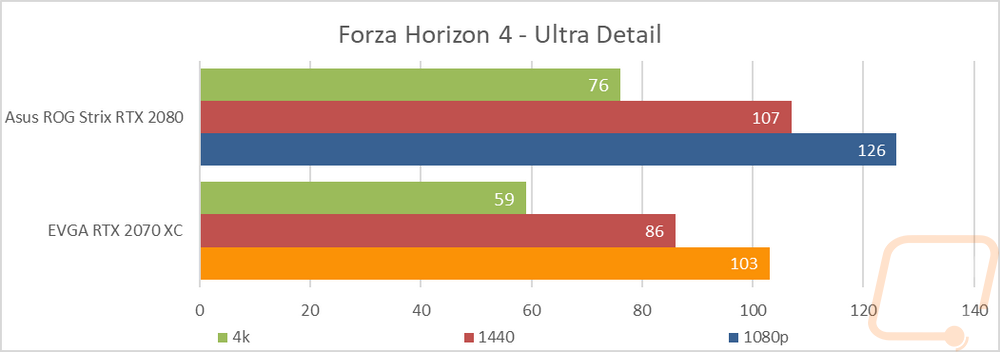
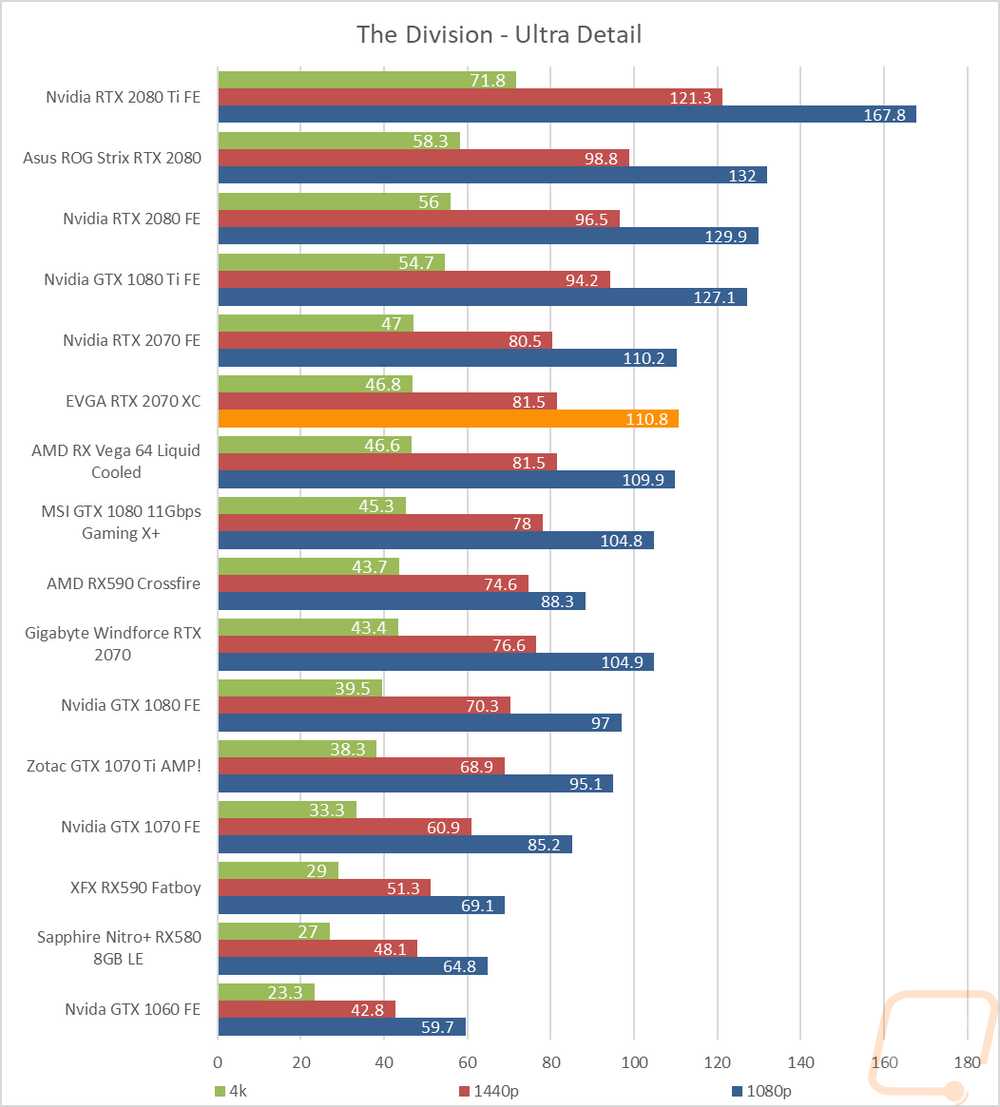
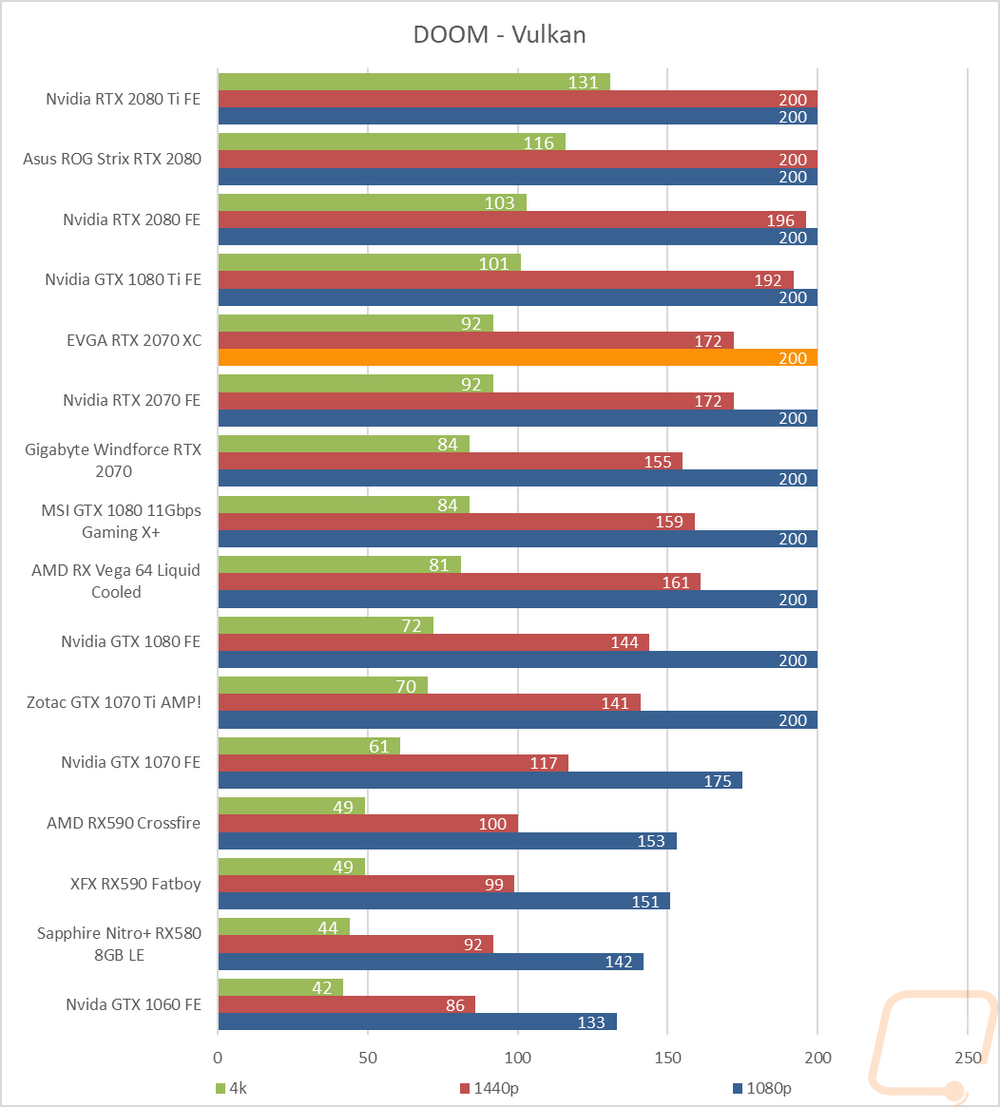
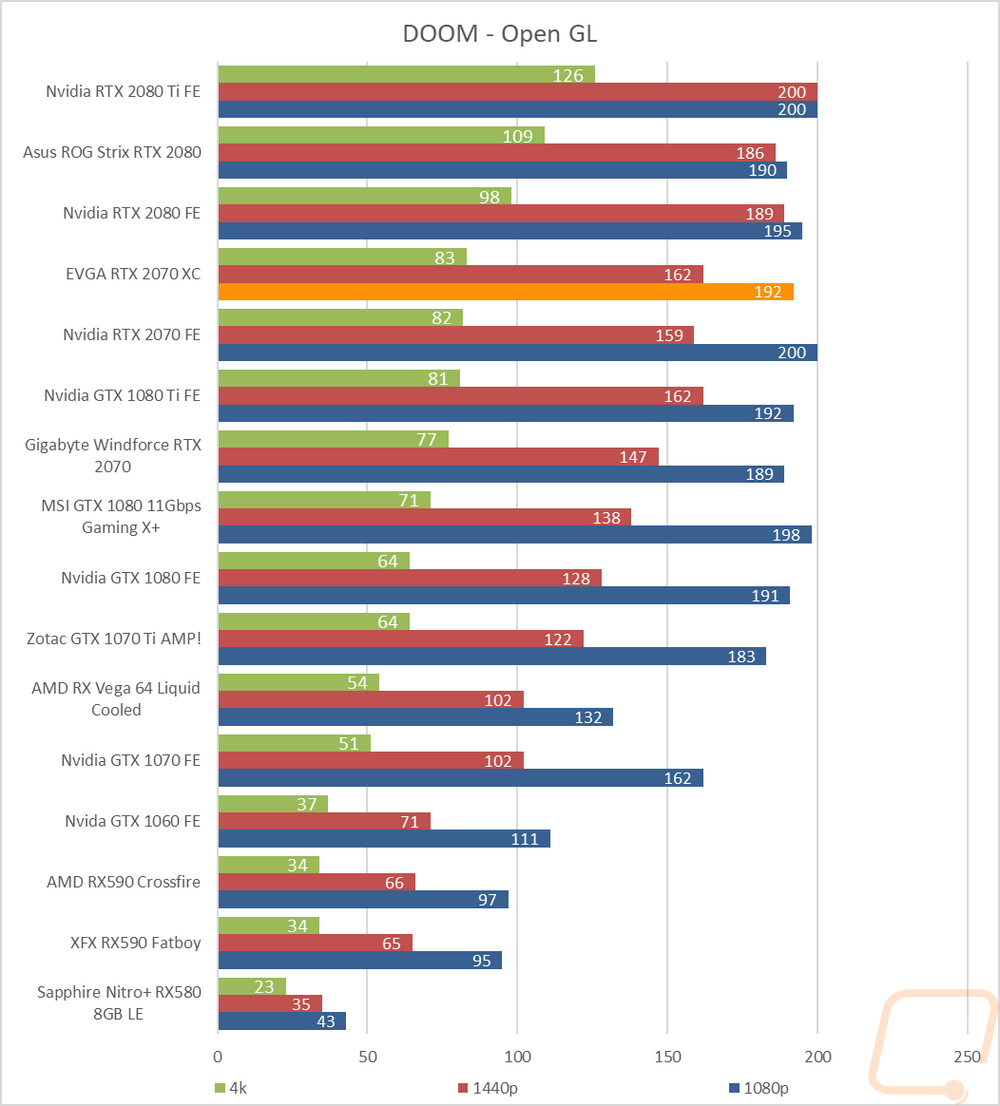
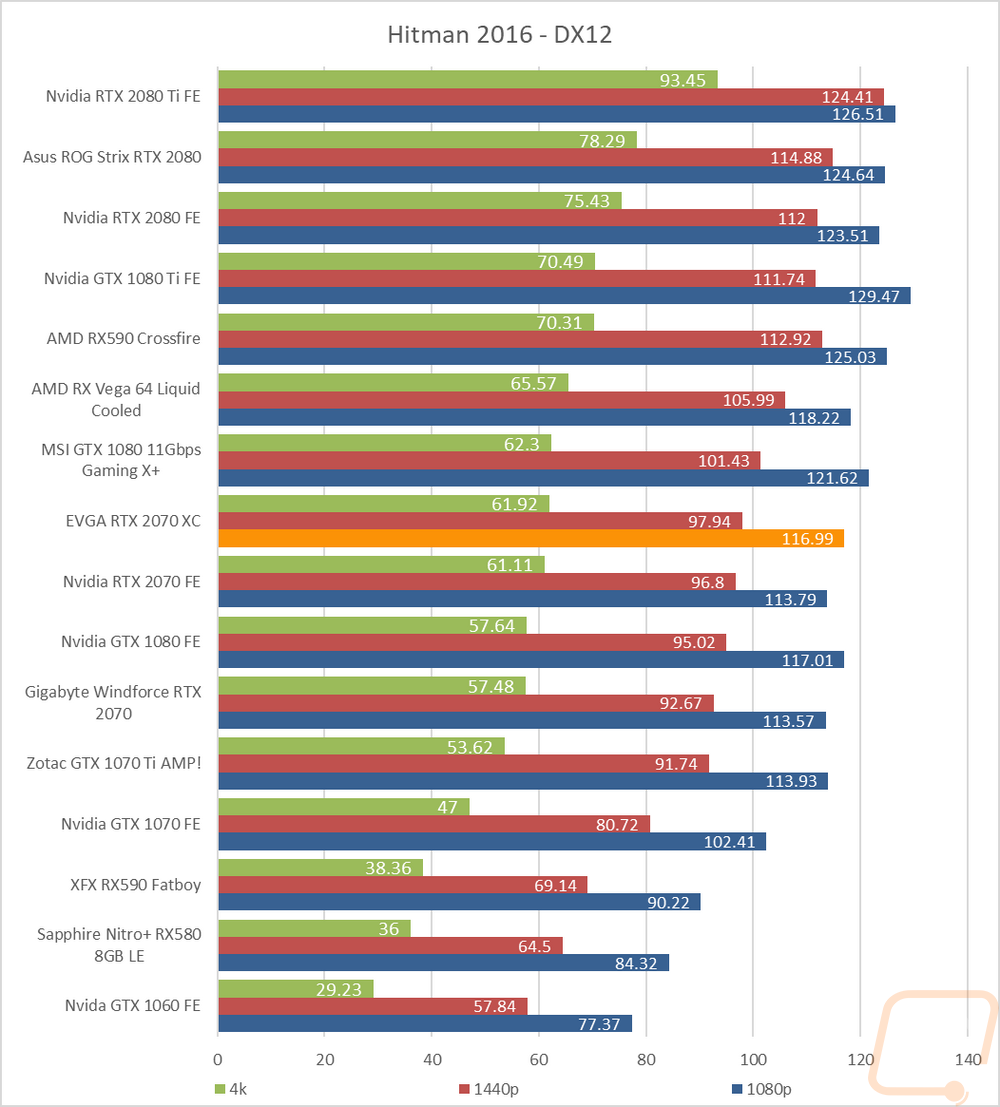
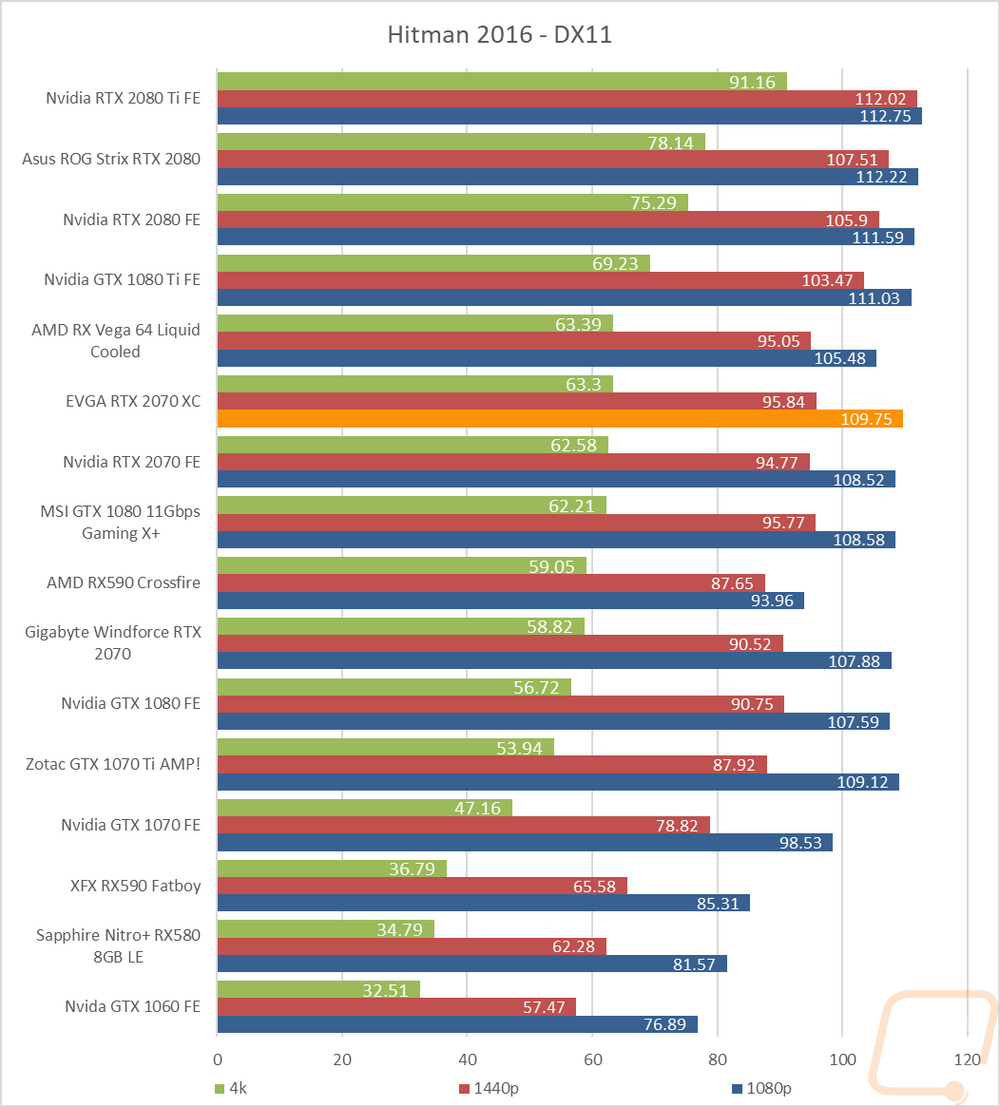
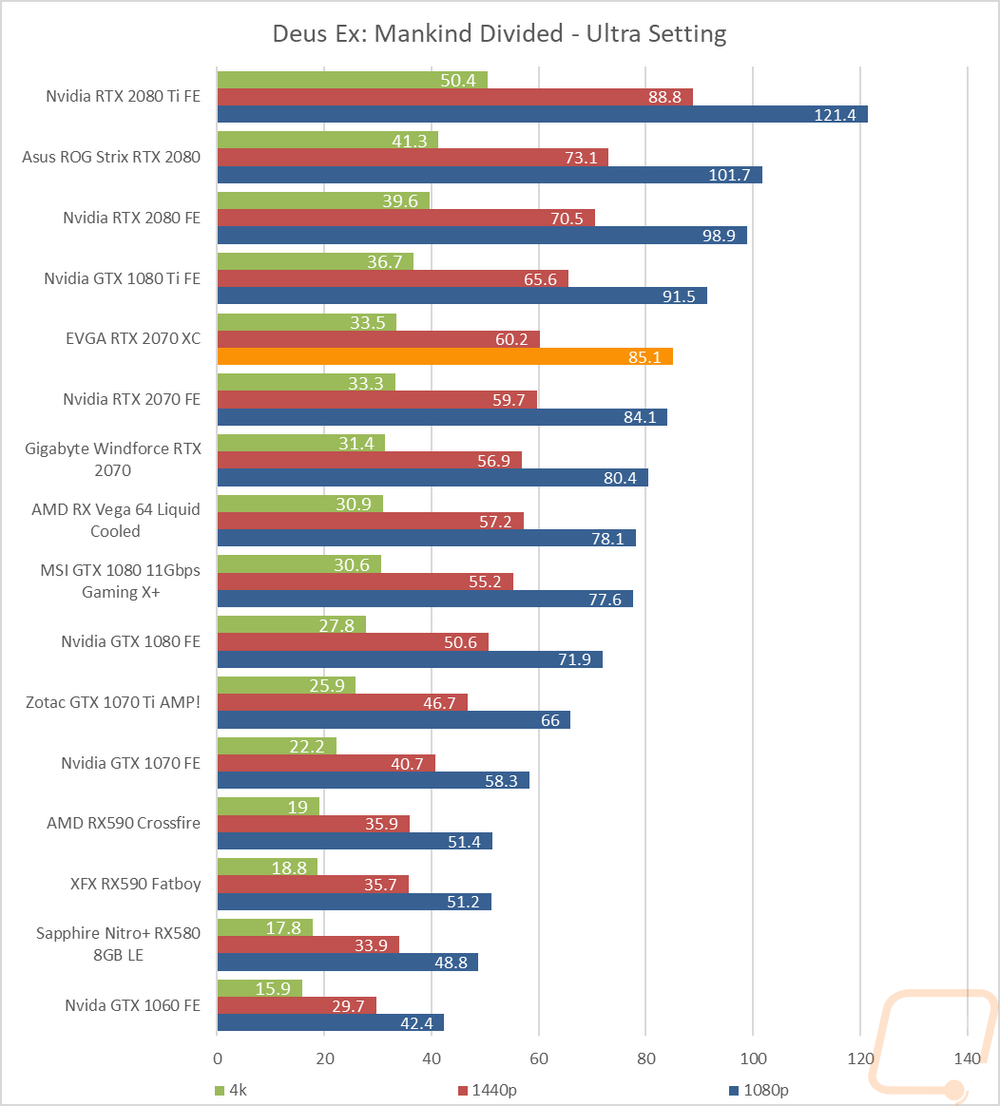
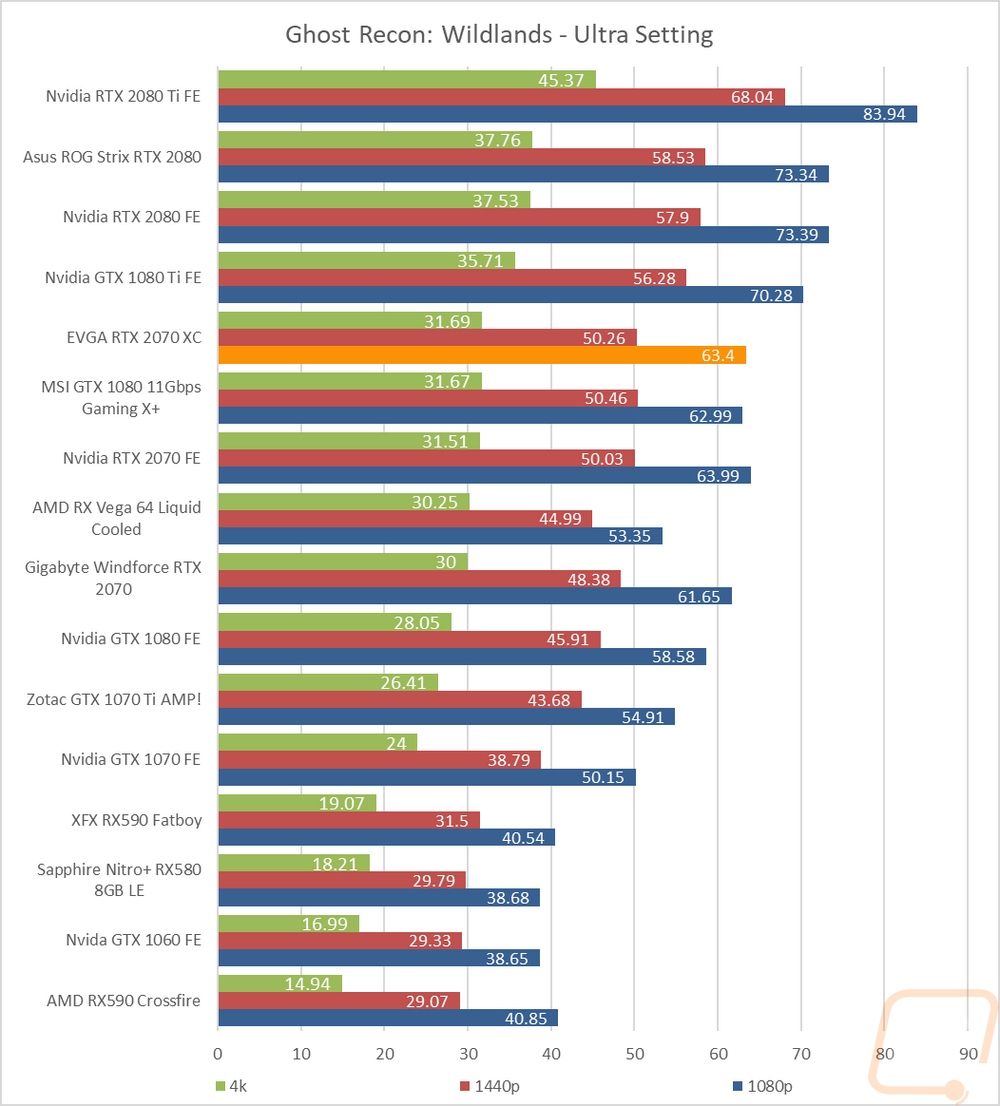
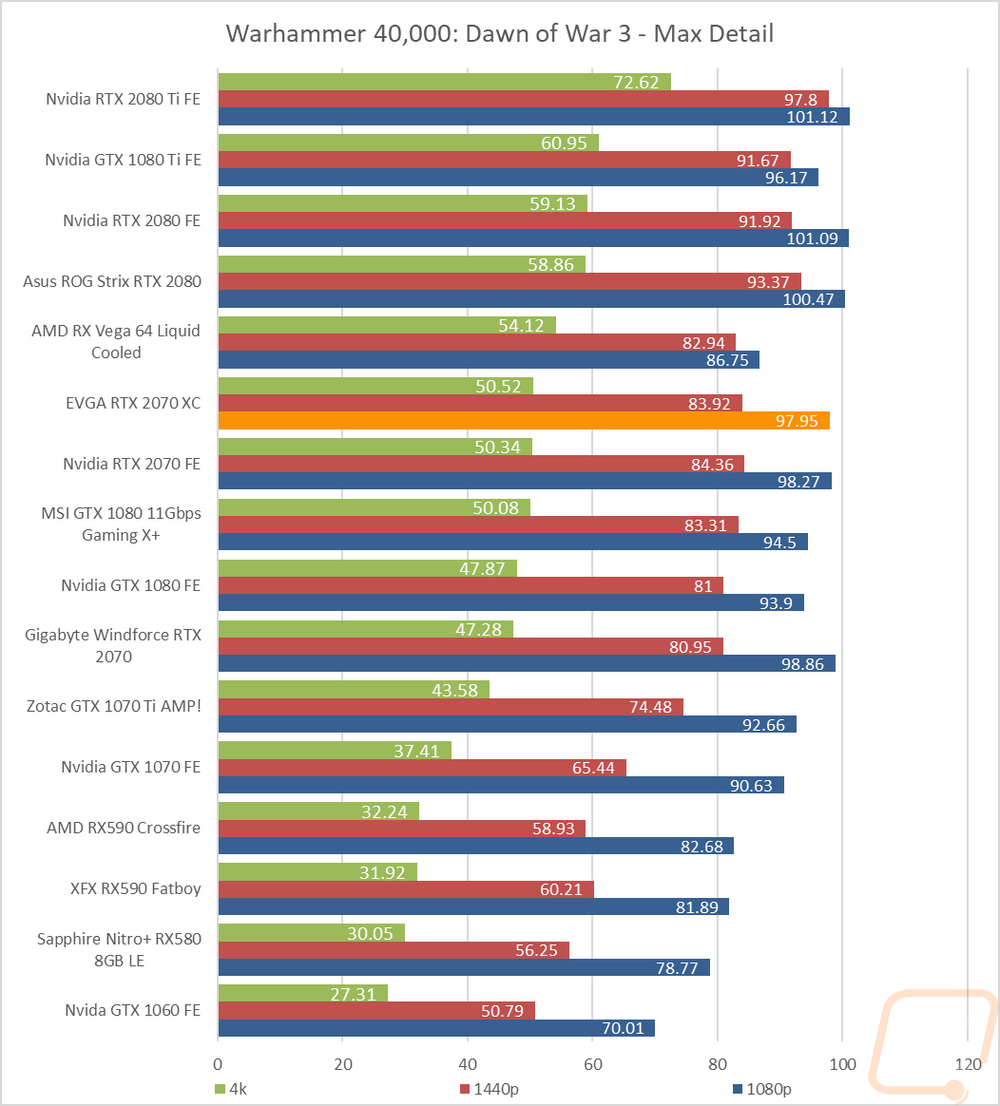
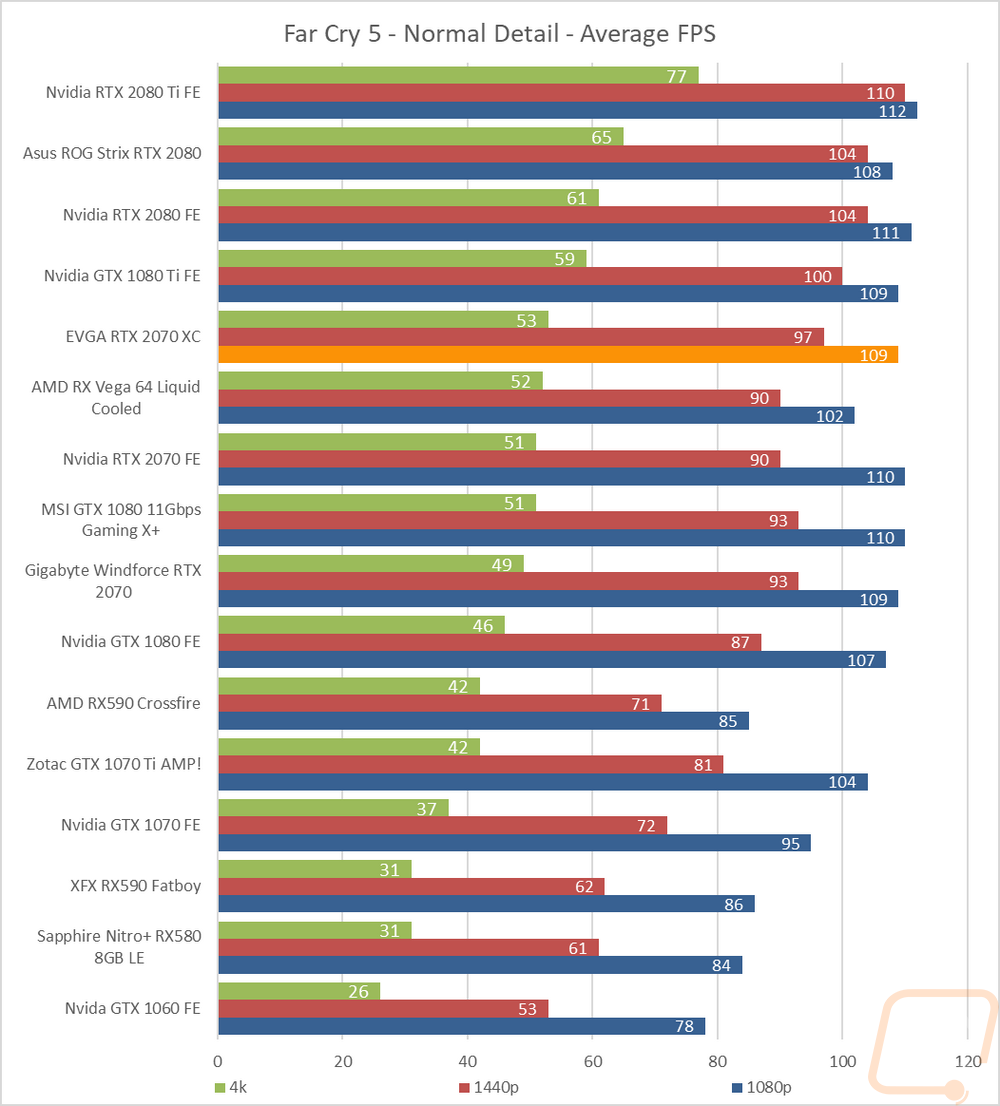
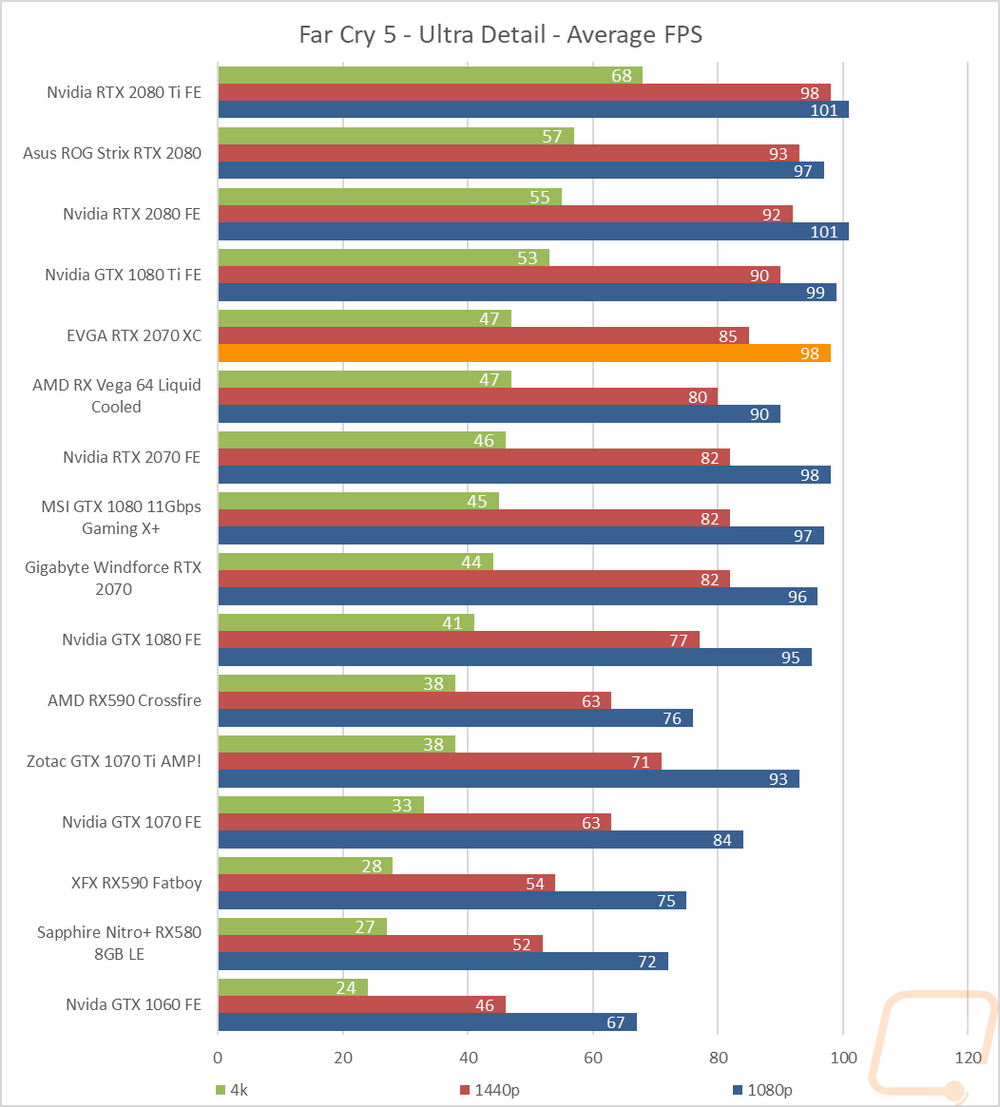
Of course, I have all of the actual results as well for those of you who are crazy enough to dig through them like I am. The Final Fantasy XV results are at the top because they are a score, not an FPS and couldn’t be included in the previous graphs. The EVGA XC comes in just a touch over the RTX 2070 Founders Edition and above the overclocked GTX 1080 and below the GTX 1080 Ti. I have our recently added Forza Horizon 4 results at the top as well. The rest of the games really just show that the RTX 2070 FE and the EVGA XC which have the same clock speed trade blows over and over. They are basically the same performance. They are faster than the overclocked GTX 1080 with 11Gbps memory and especially faster than the GTX 1080 FE. Some of the games the 2070 performs close to the GTX 1080 Ti at 1440p and 1080p. The Vega 64 Water Cooled card is typically down below them as well. No big surprises here at all, not that I was expecting any considering the Founders Edition has the same exact clock speeds.