In-Game Benchmarks
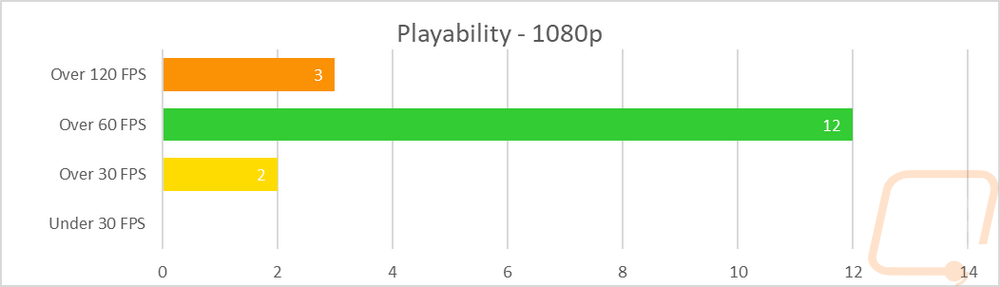
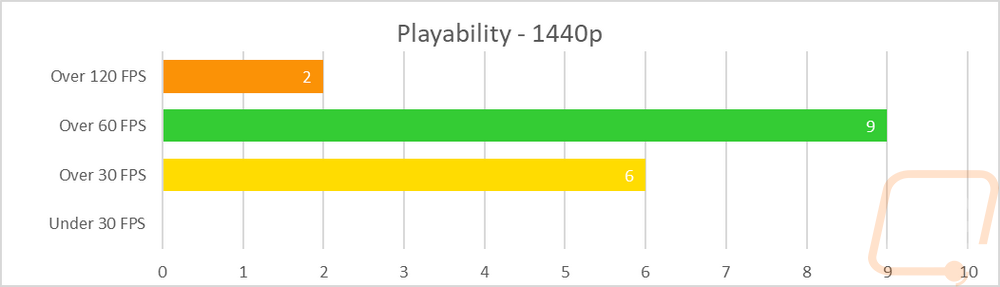
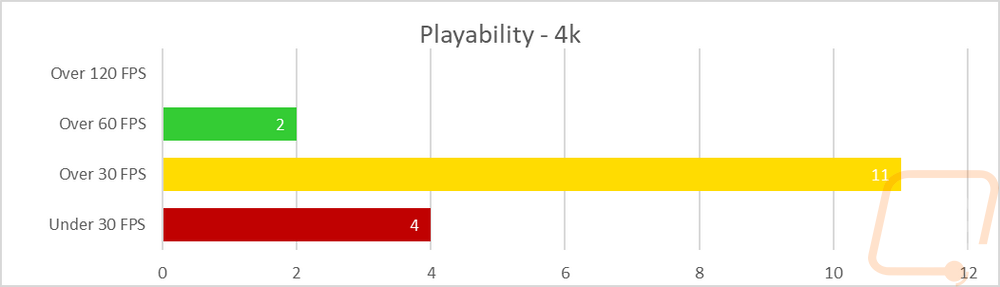
Now we finally get into the in game performance and that is the main reason people pick up a new video card. To test things out I ran through our new benchmark suite that tests 12 games at three different resolutions (1080p, 1440p, and 4k). I also slipped in a few variations on the same games for comparisons like DX11 to DX12, OpenGL to Vulkan, and a couple of games are just tested at their highest setting and lower but still high detail options to show the performance difference when things are turned down slightly. In total, each video card is tested 54 times and that makes for a huge mess of graphs when you put them all together. To help with that I like to start off with these overall playability graphs that take all of the results and give an easier to read the result. I have one for each of the three resolutions and each is broken up into four FPS ranges. Under 30 FPS is considered unplayable, over 30 is playable but not ideal, over 60 is the sweet spot, and then over 120 FPS is for high refresh rate monitors. This covers all of the games tested except Final Fantasy XV that we have a score rather than an FPS because they like to be different.
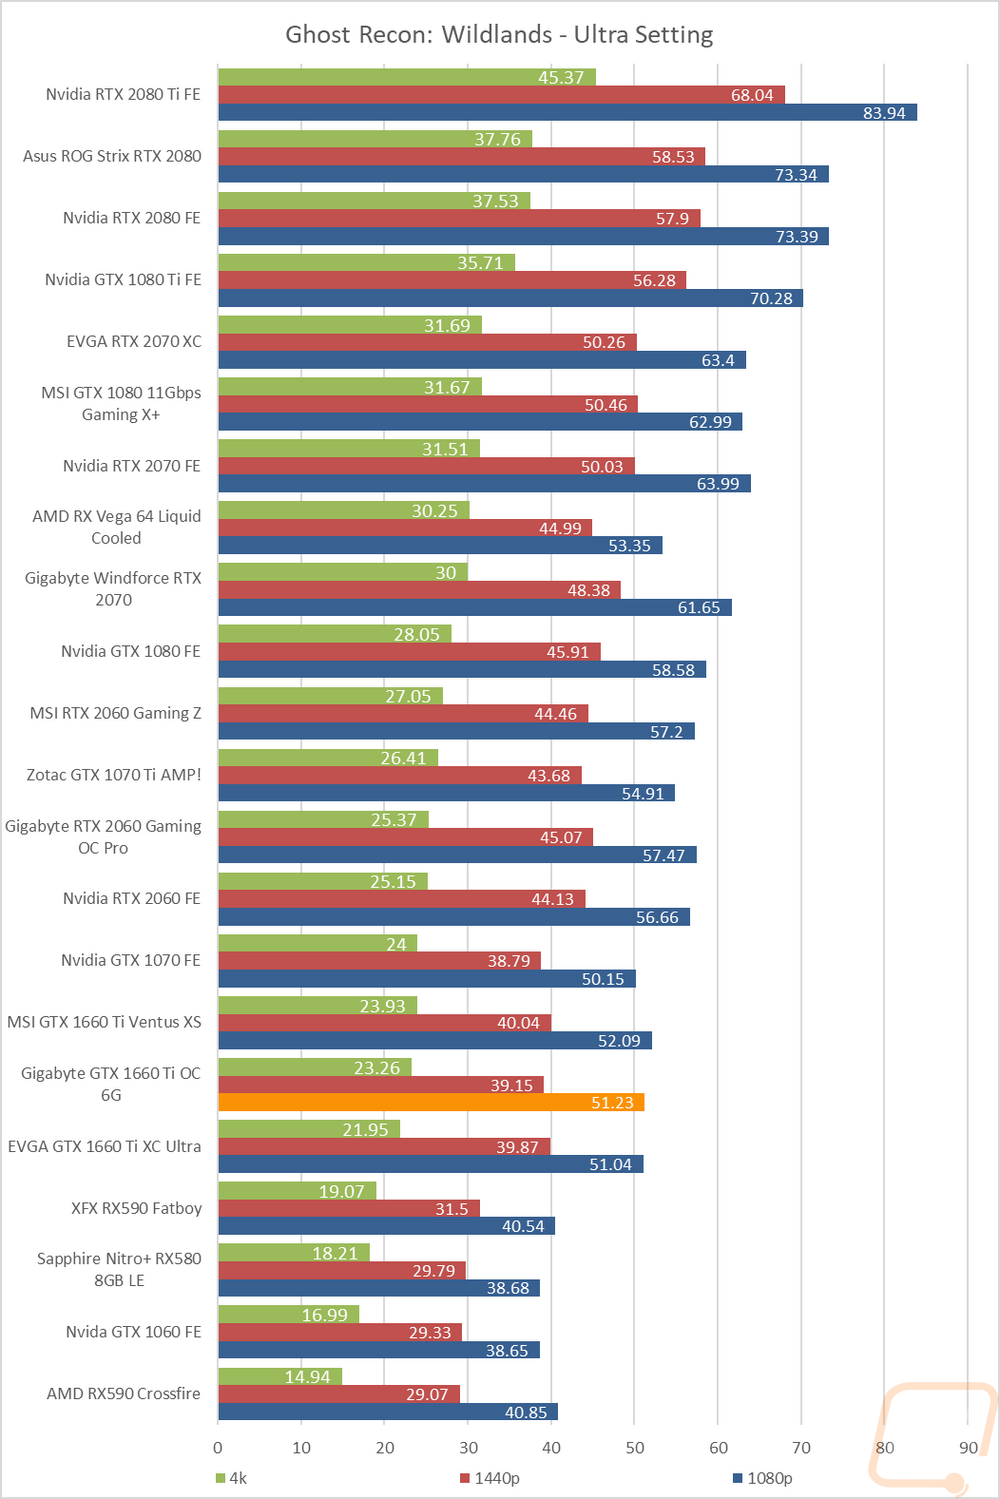
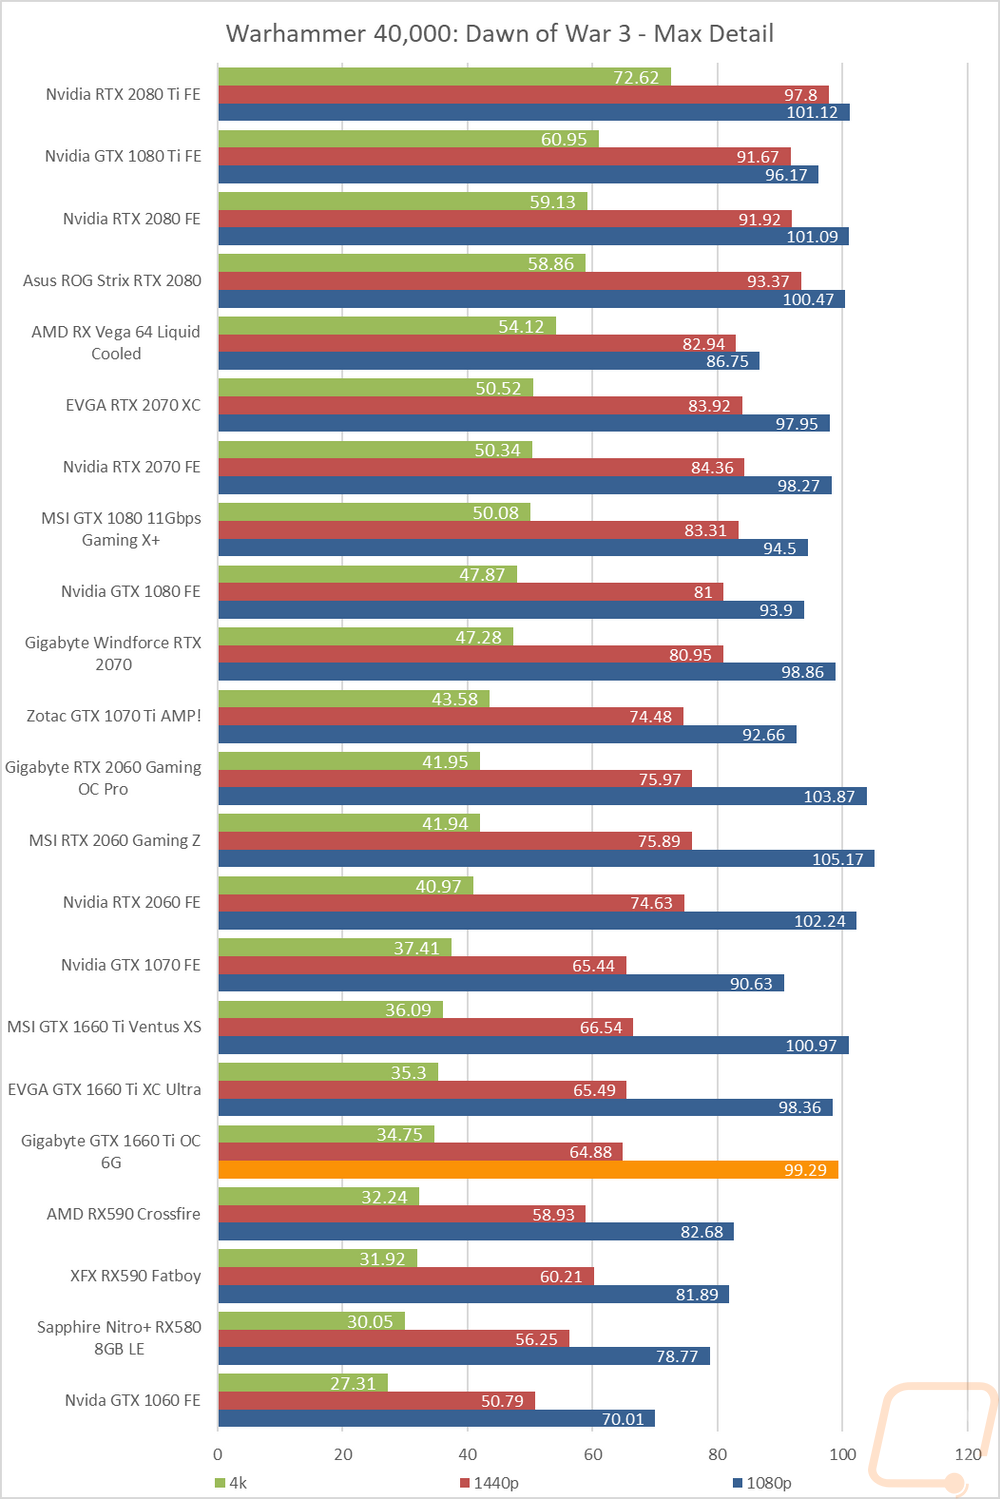
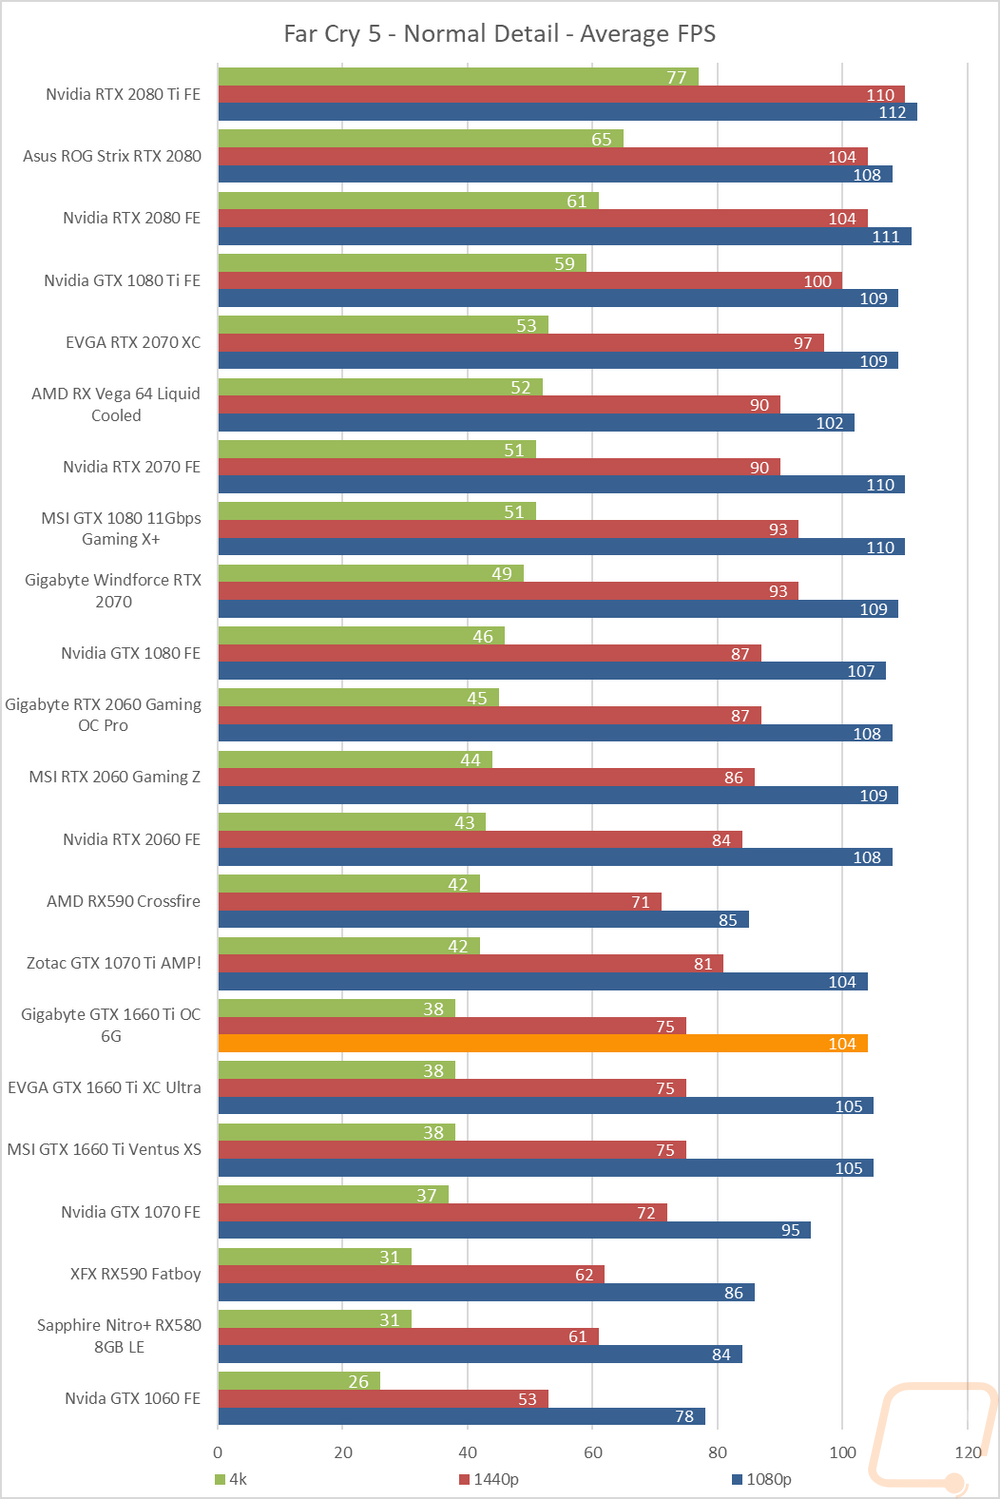
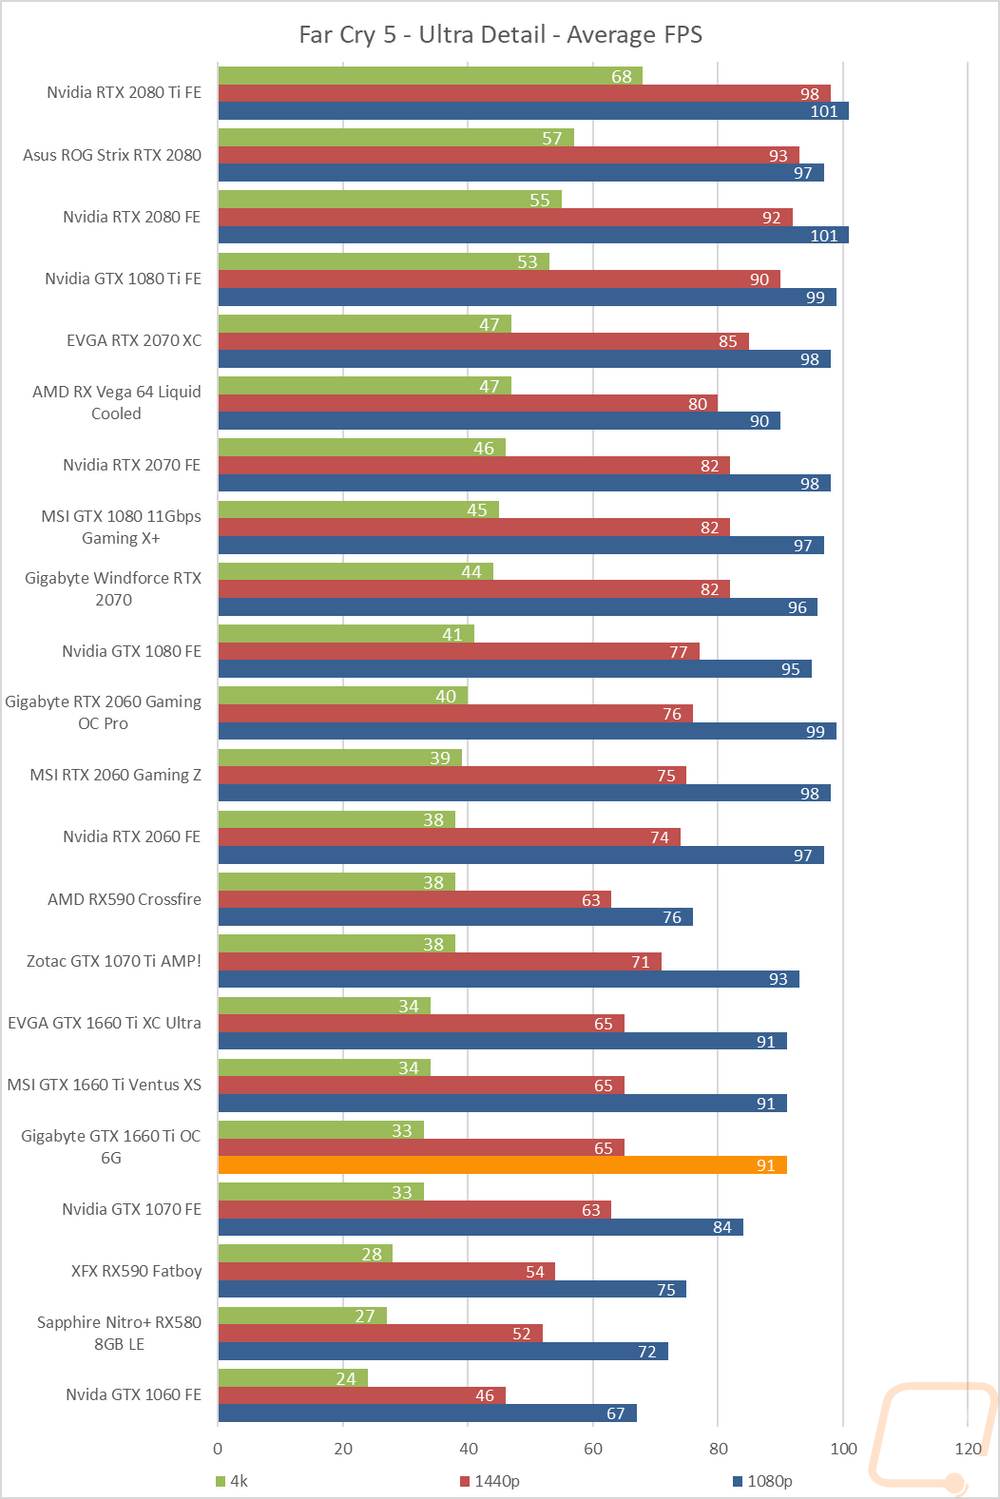
So how did the Gigabyte GTX 1660 Ti OC 6G perform? If you have seen any of our other GTX 1660 Ti coverage there wouldn’t be too many surprises here. At 1080p the Gigabyte GTX 1660 Ti OC had the same result as the other two cards. Basically, every game is playable, there are two that came in below 60 FPS with most between 60 and 119. There were three up over 120 FPS even with their settings cranked up. At 1440p the result was similar, with everything playable but you can see a lot more are in the 30-59 FPS range that you might want to play with the settings for better gameplay. Then at 4k things fall off a lot with only 2 results up over 60 FPS and most in the iffy area and most of those are really just over 30 FPS and four unplayable at all. The Gigabyte card was a little different from the other cards at 1440p with the EVGA having another in the 60+ range and then at 4k having one fewer in the less than 30 range. But all three cards were close in FPS, but the small performance difference was enough to start moving games up and down in these groups.
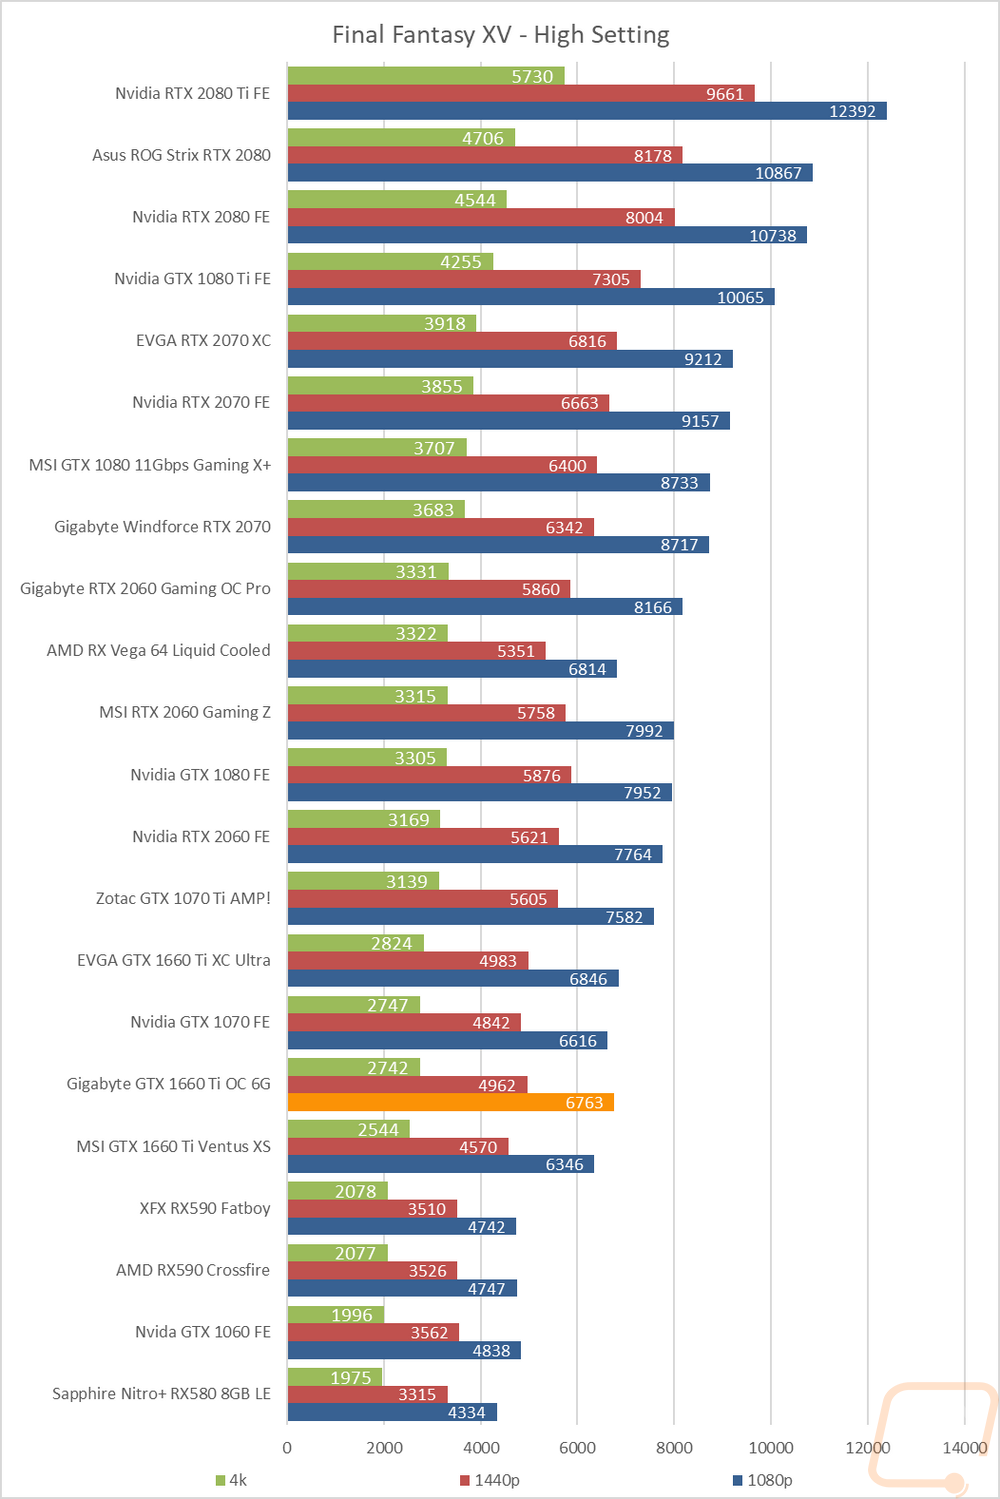
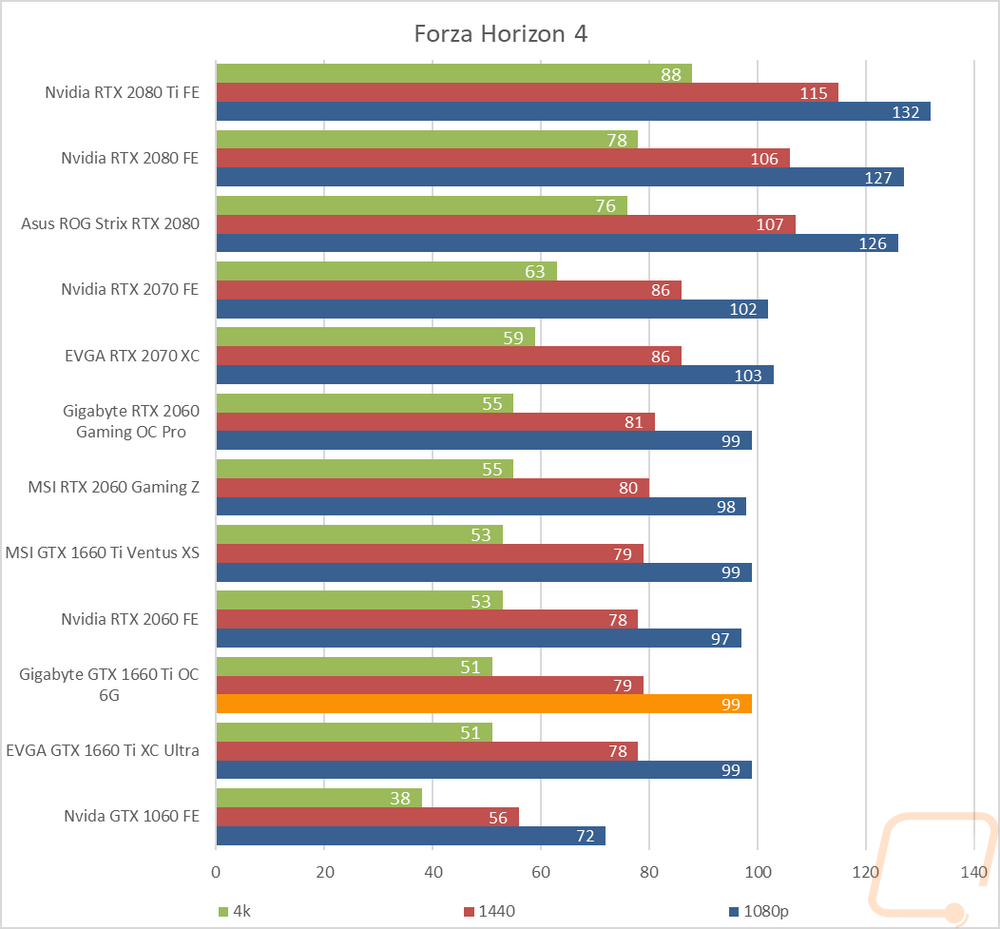
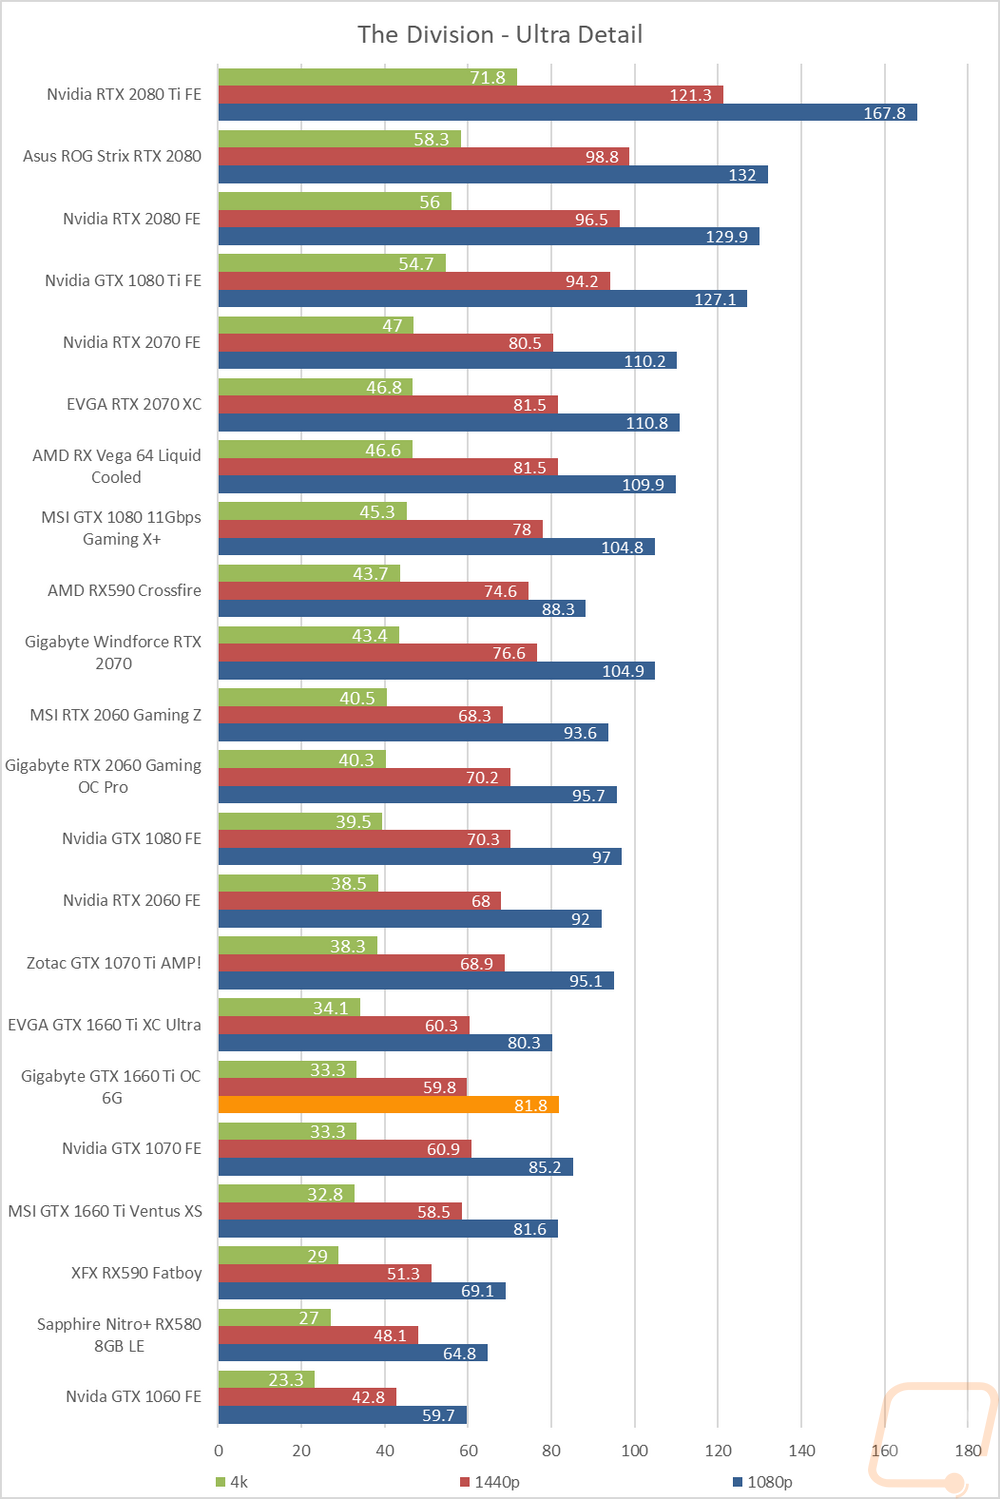
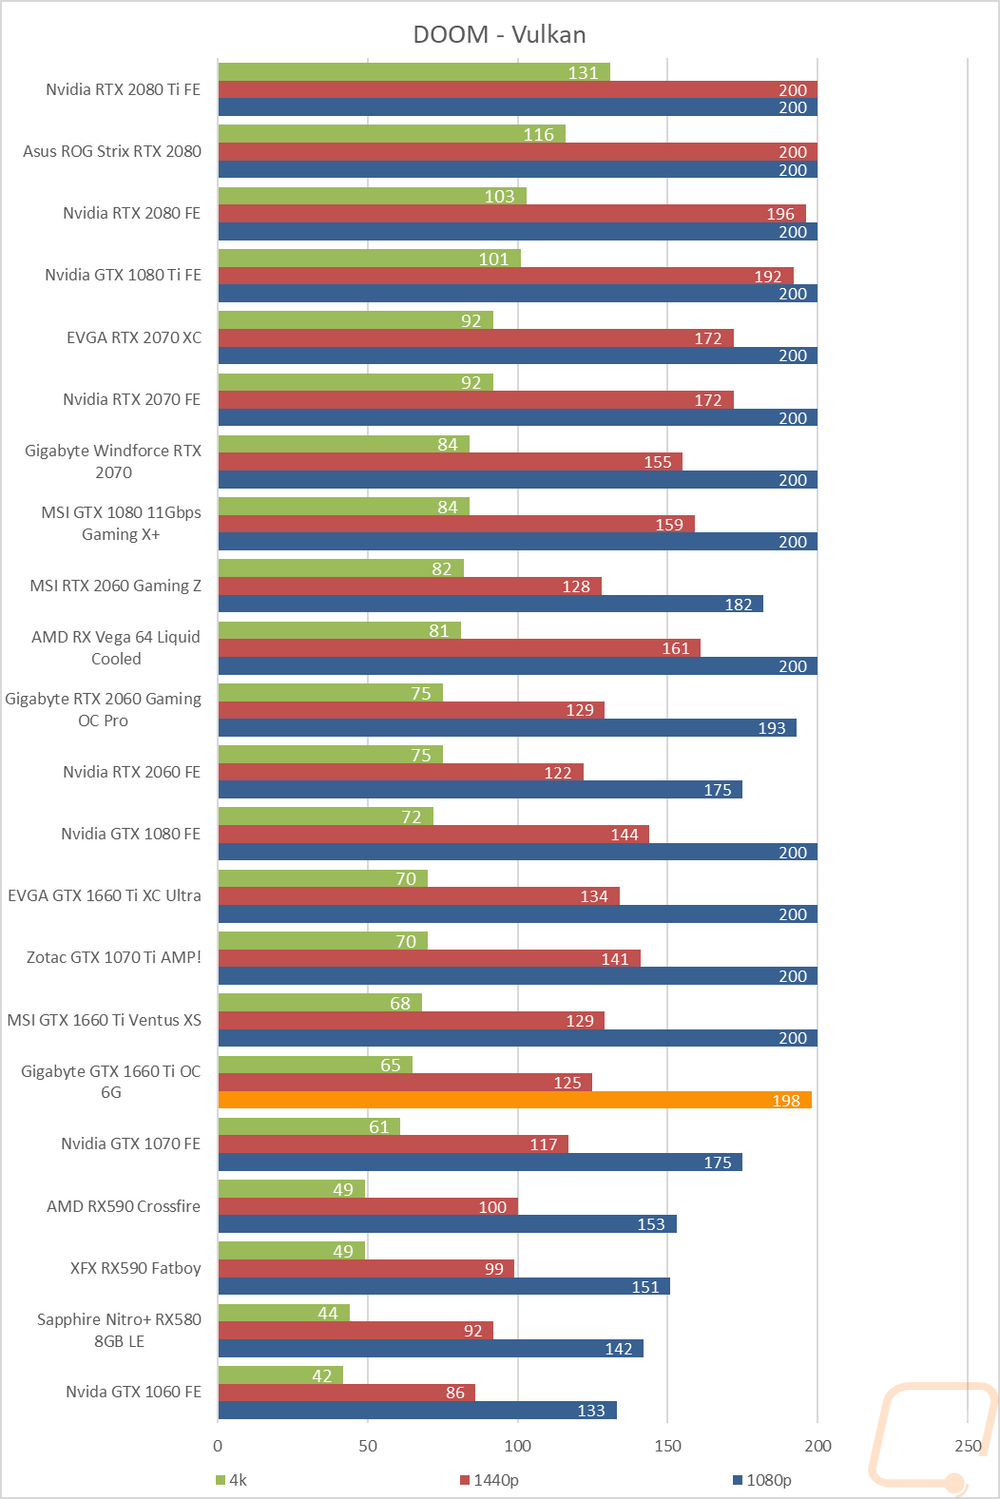
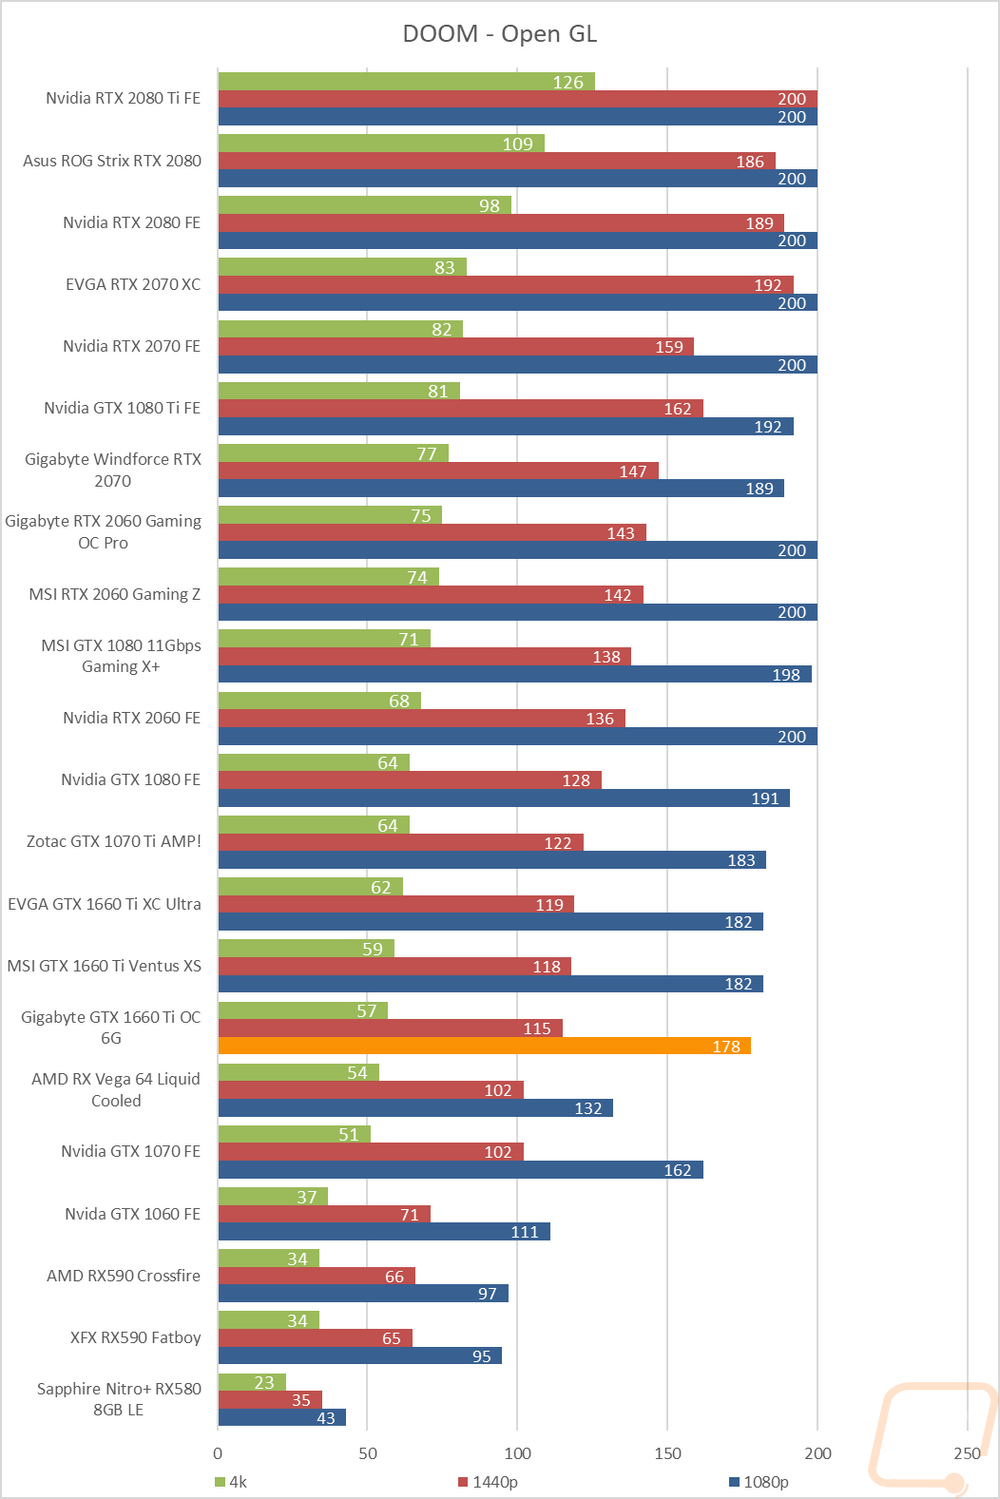
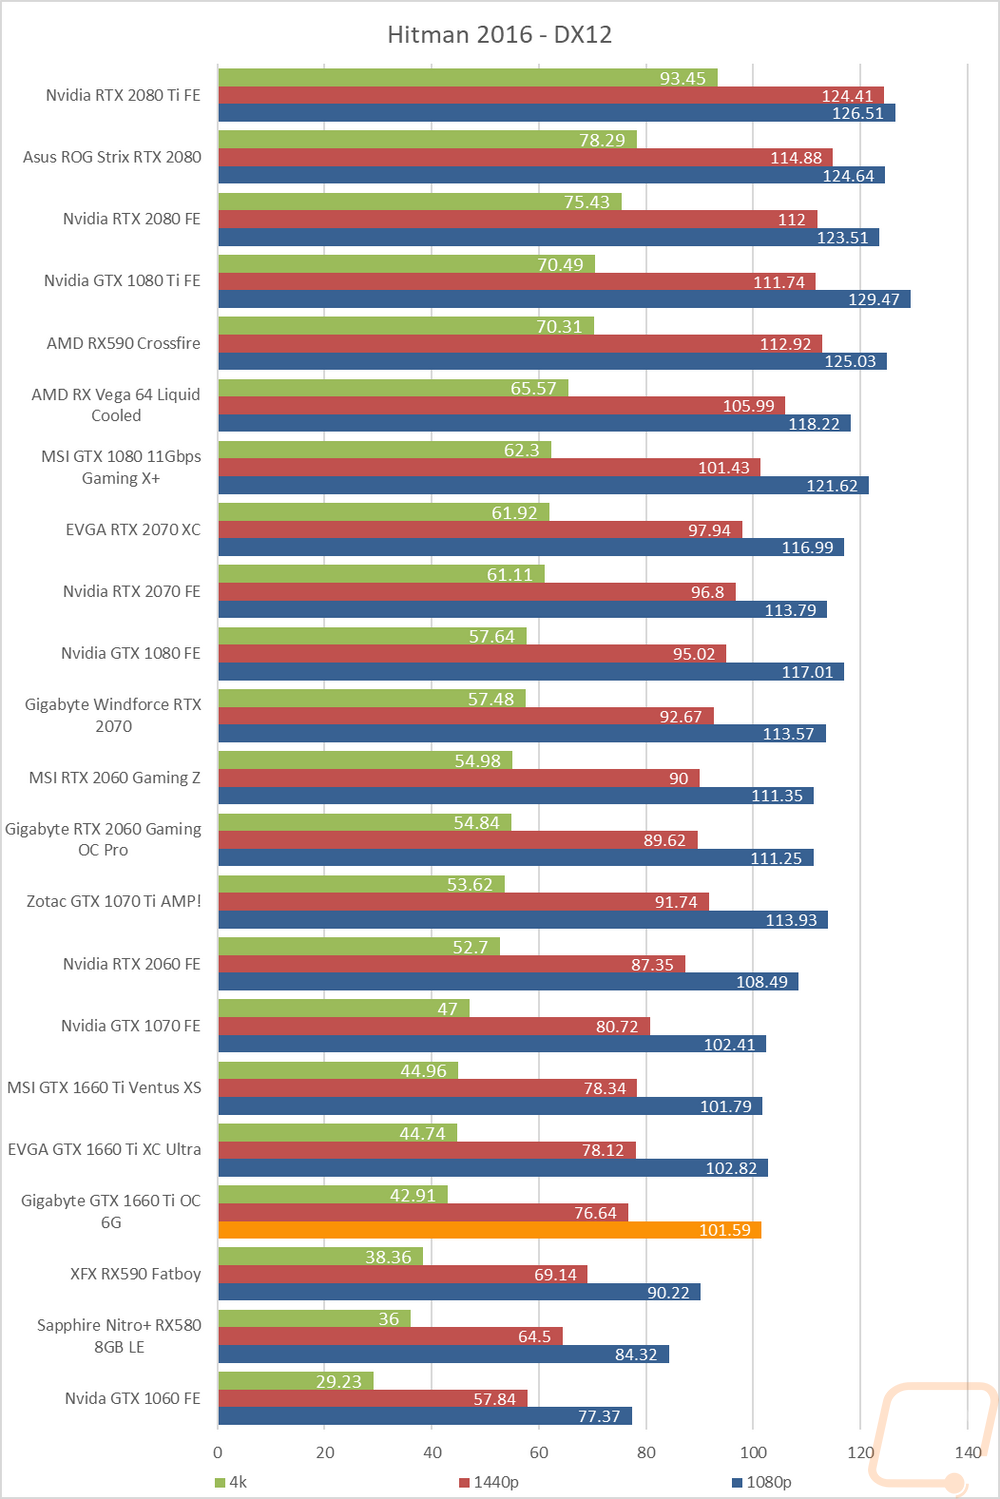
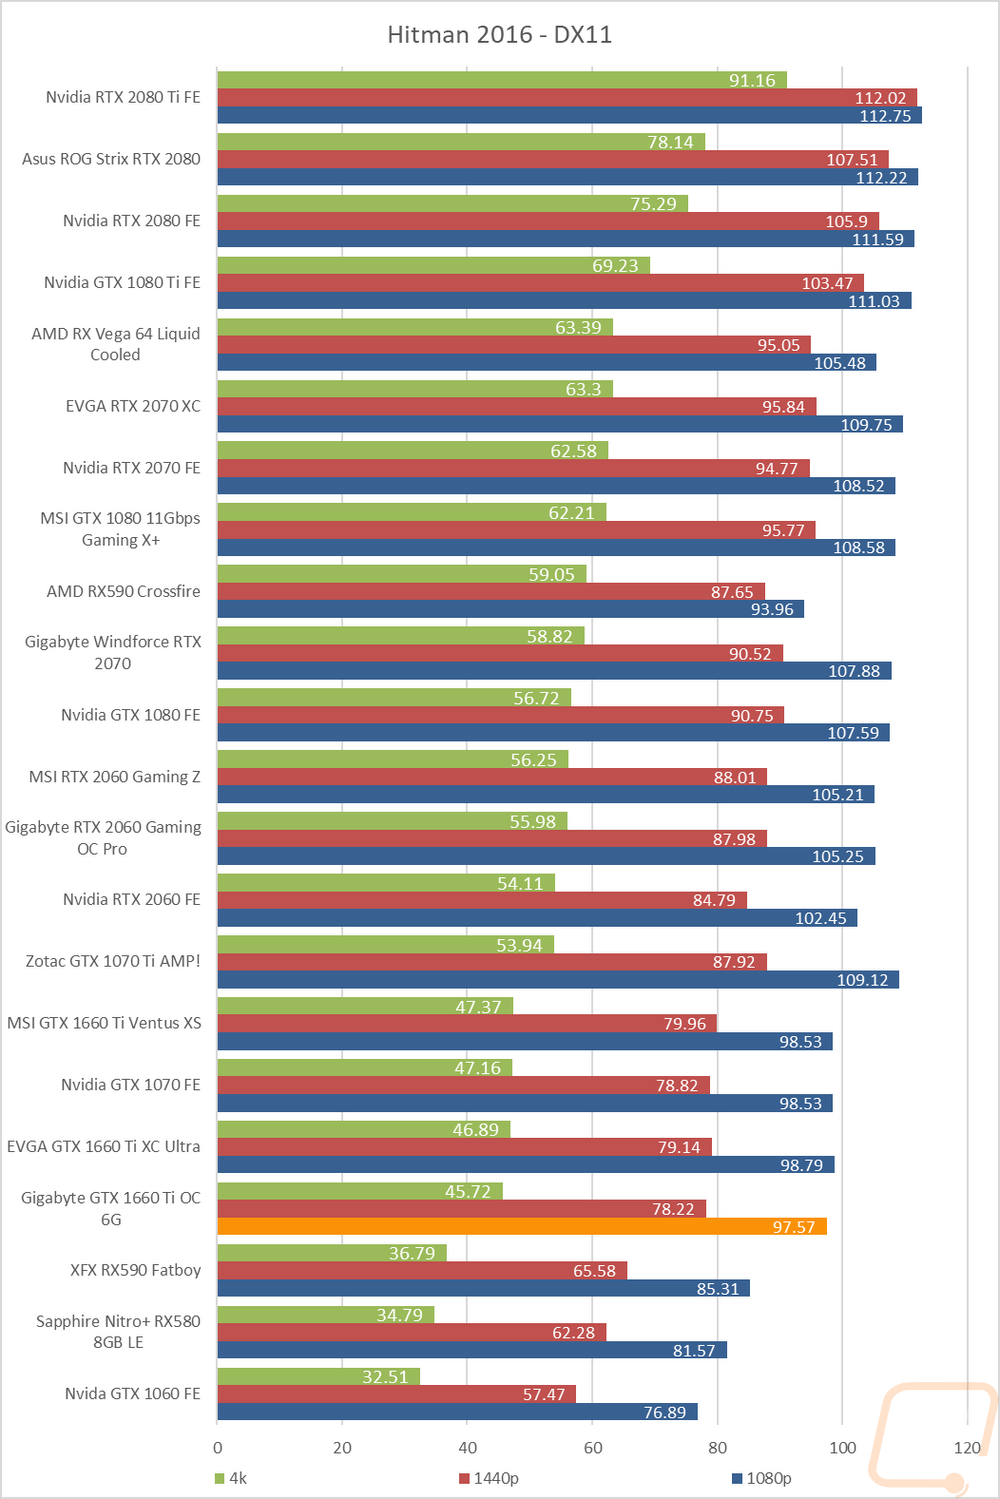
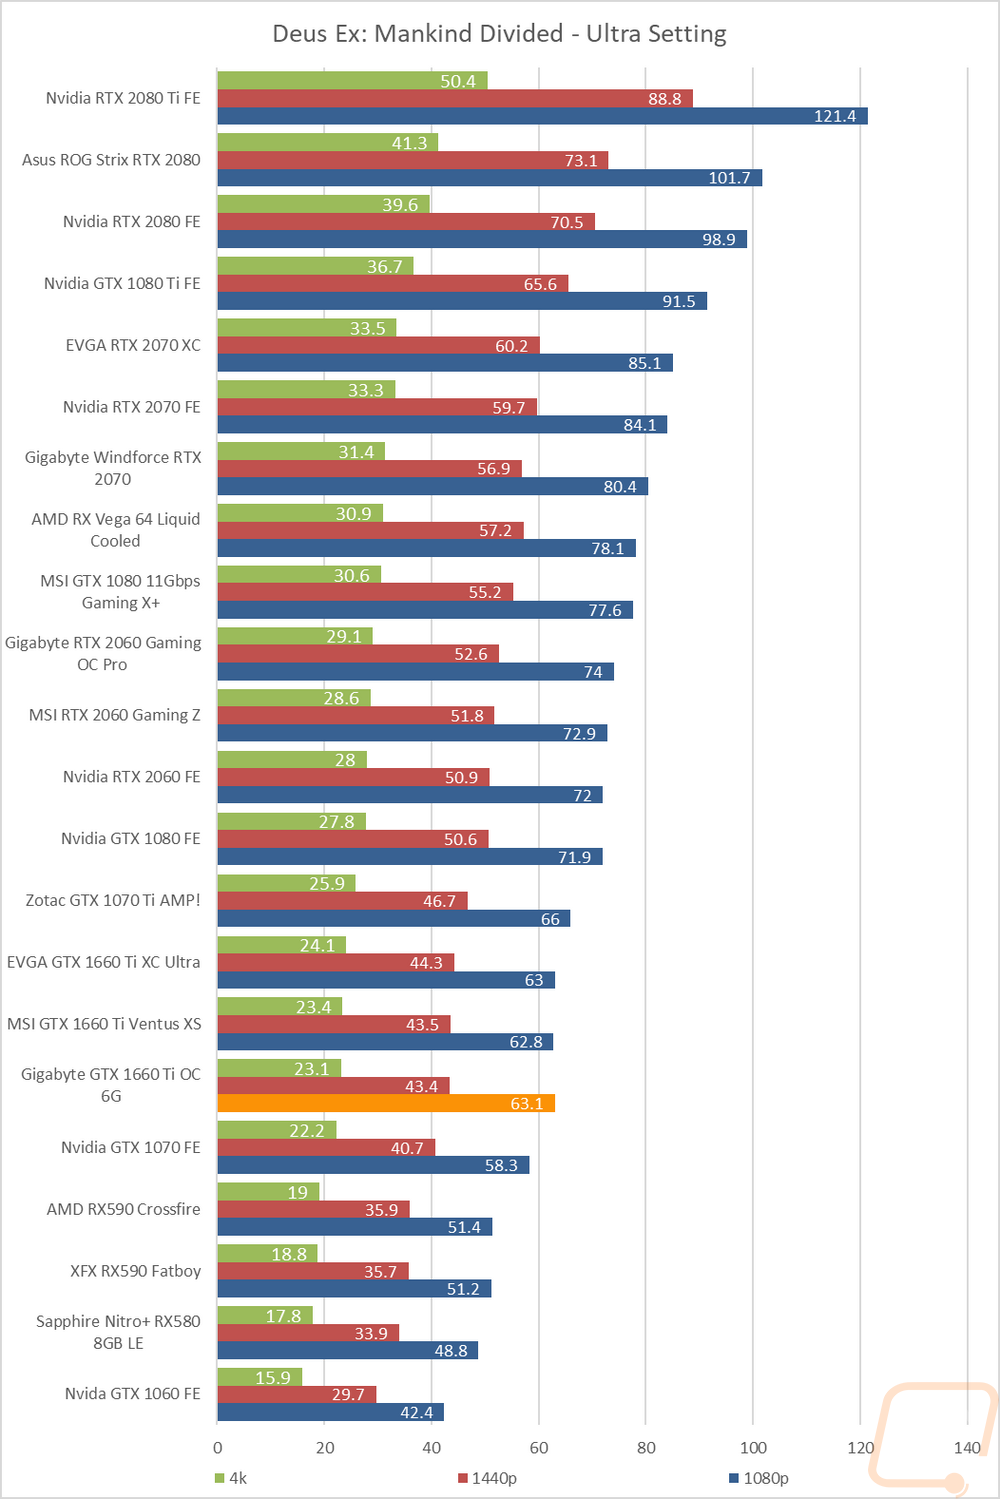
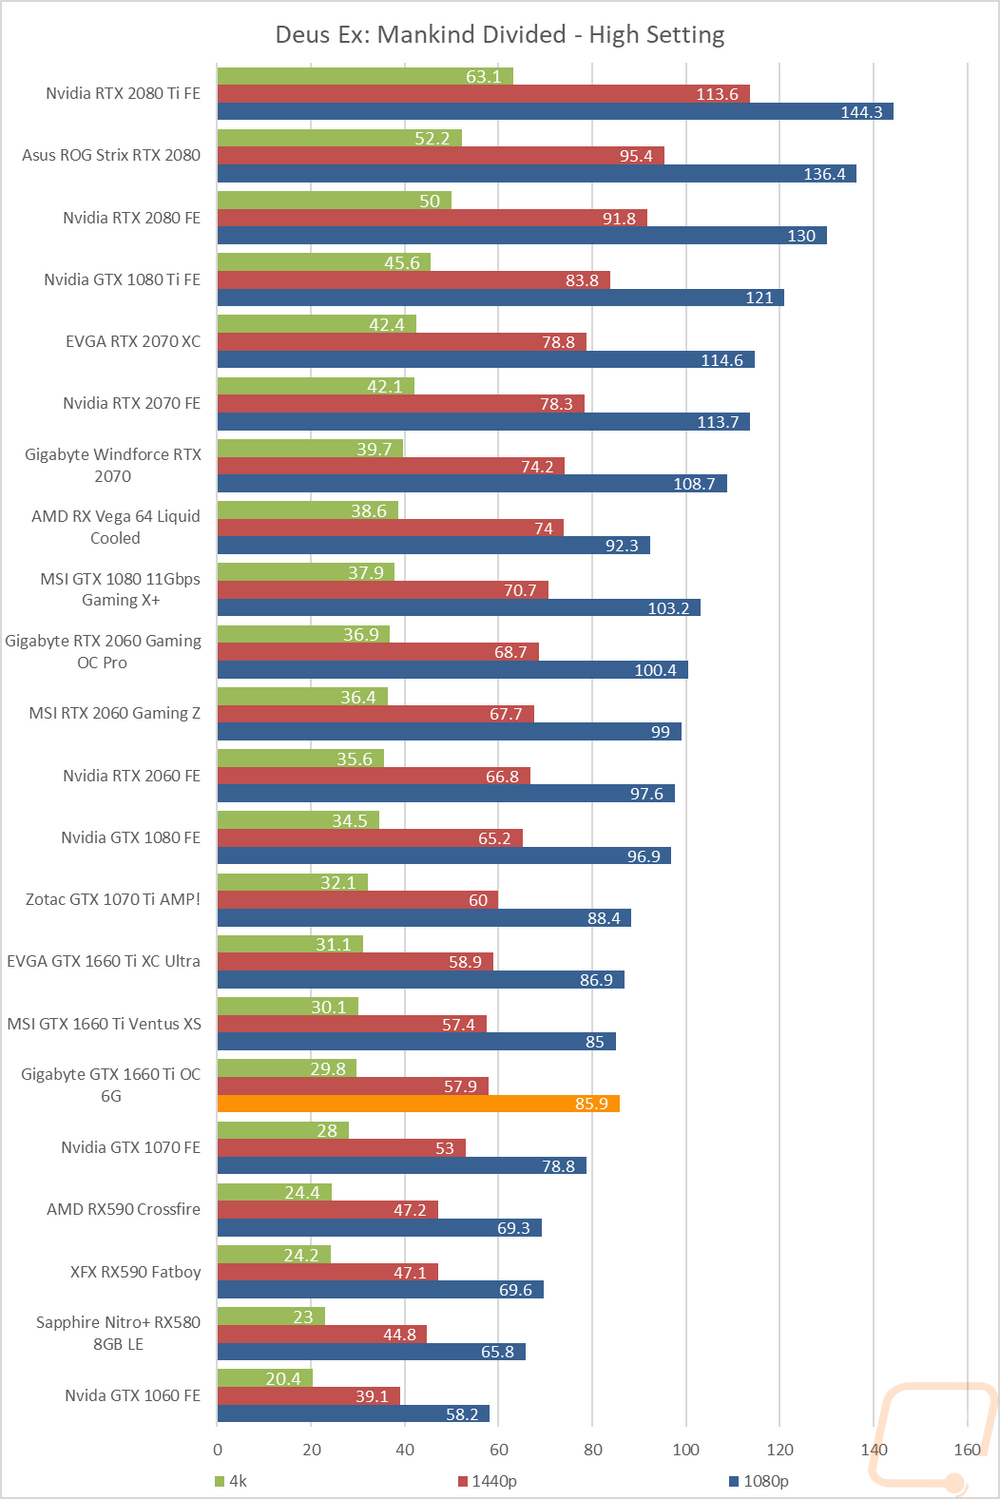
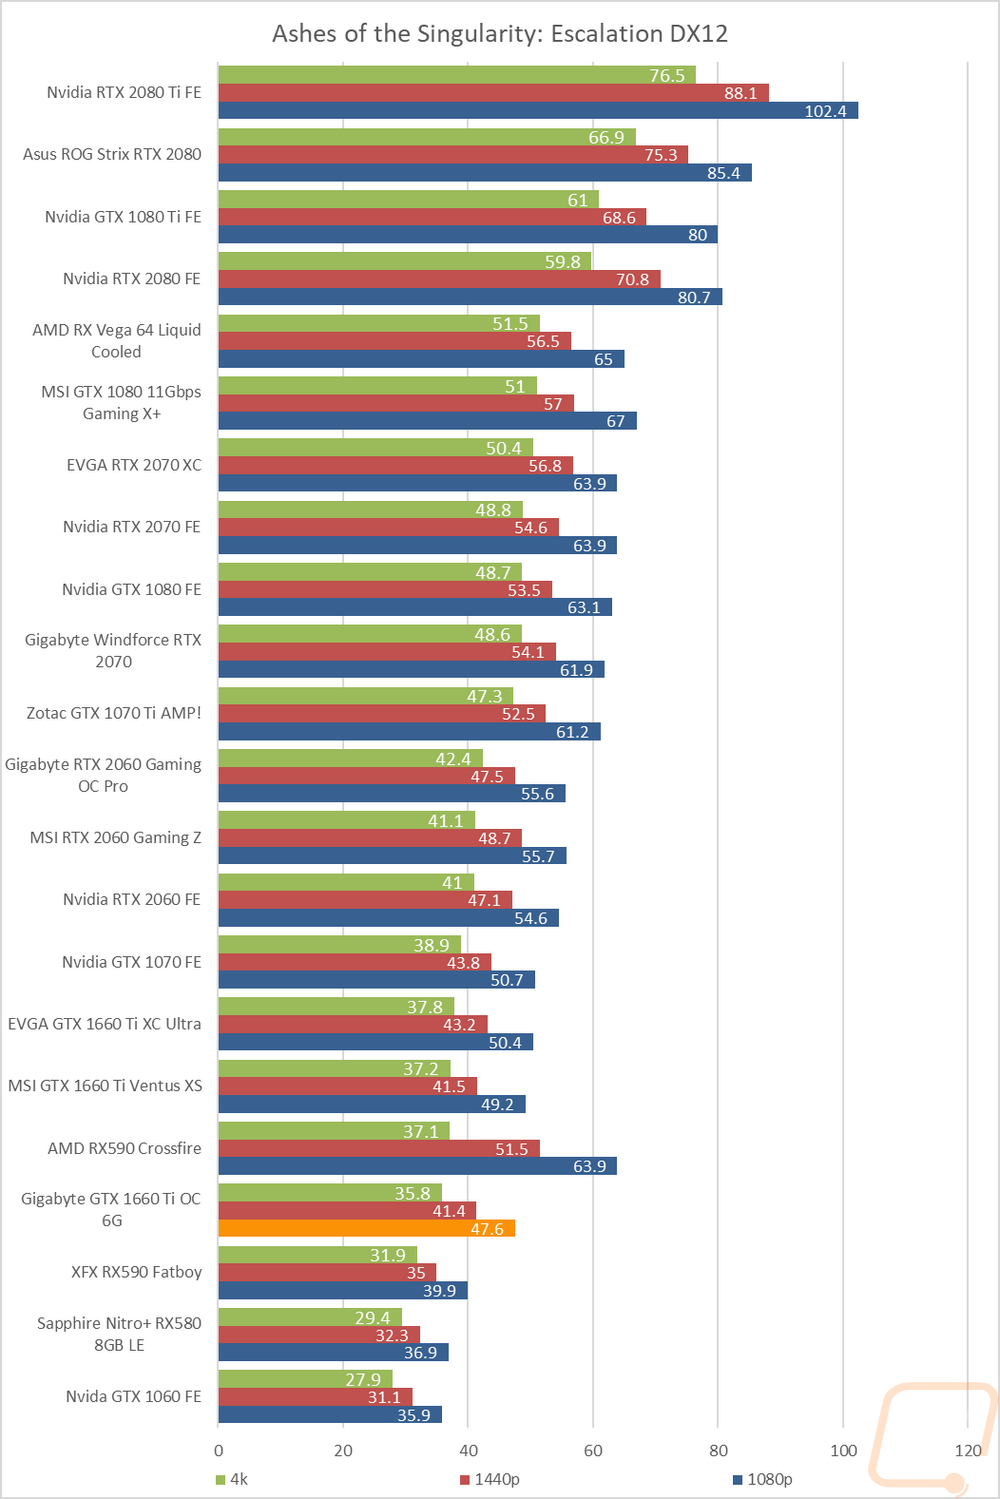
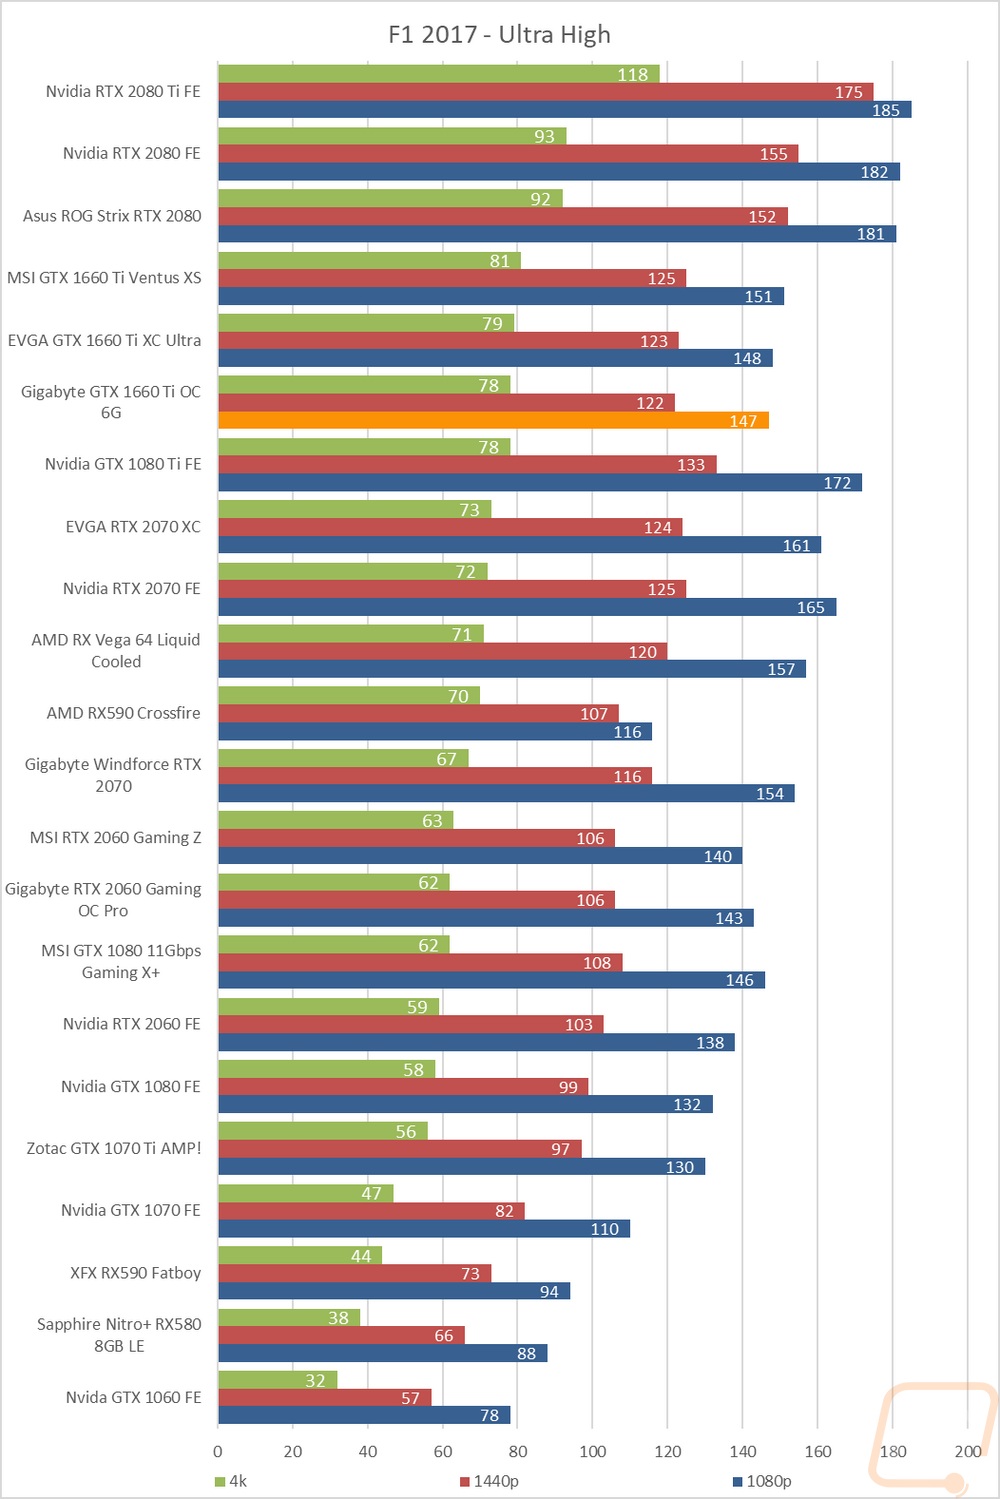
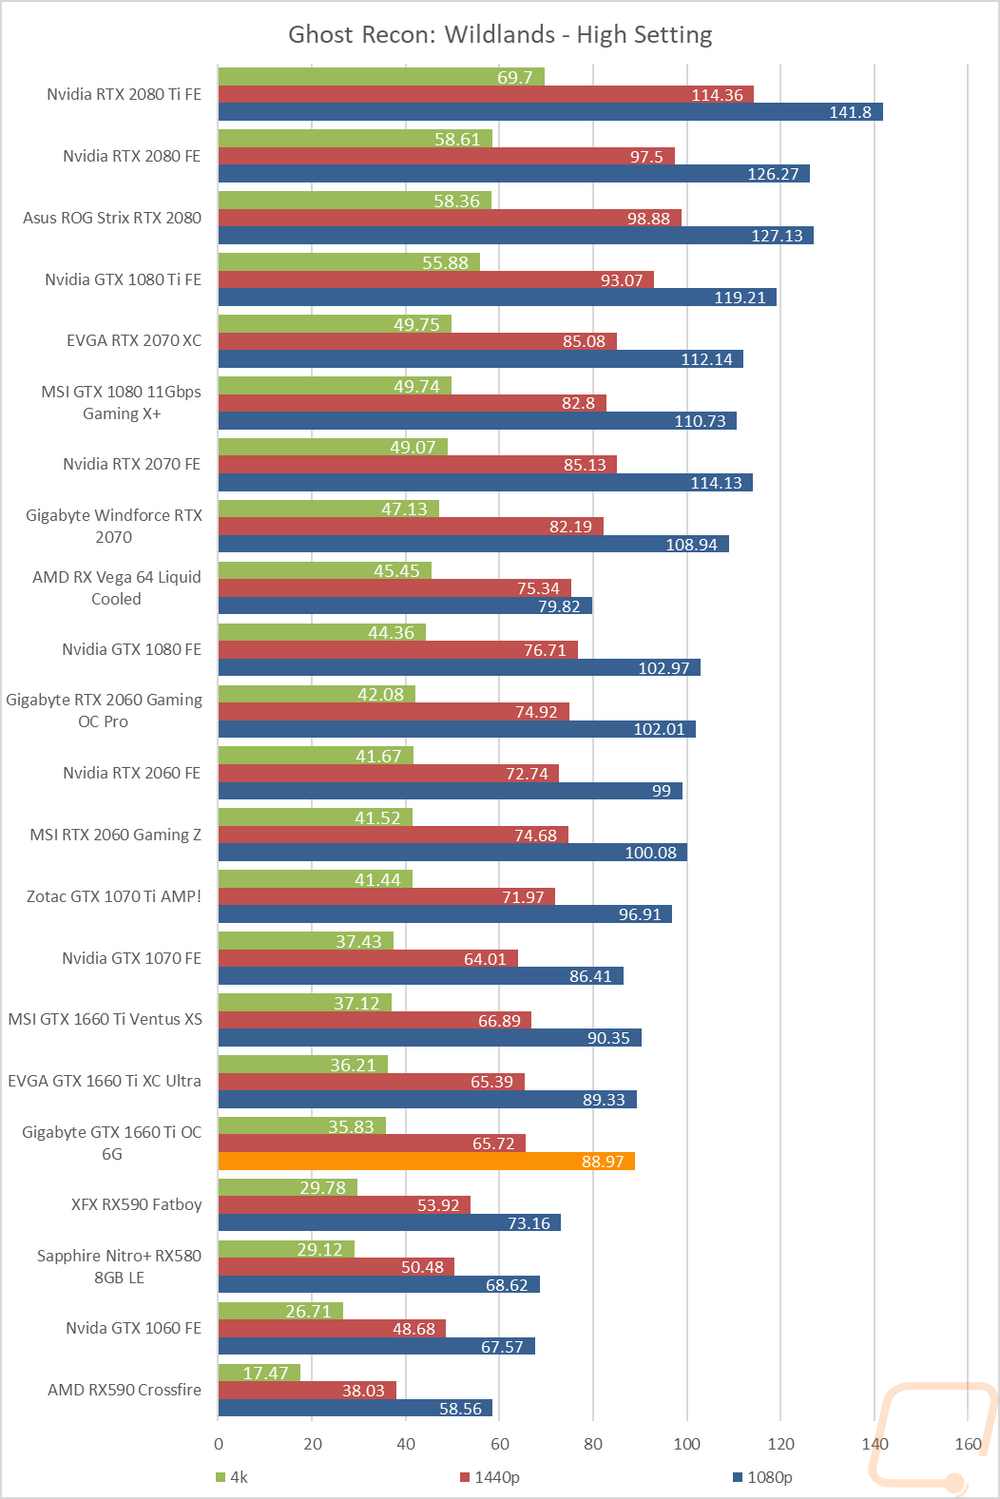
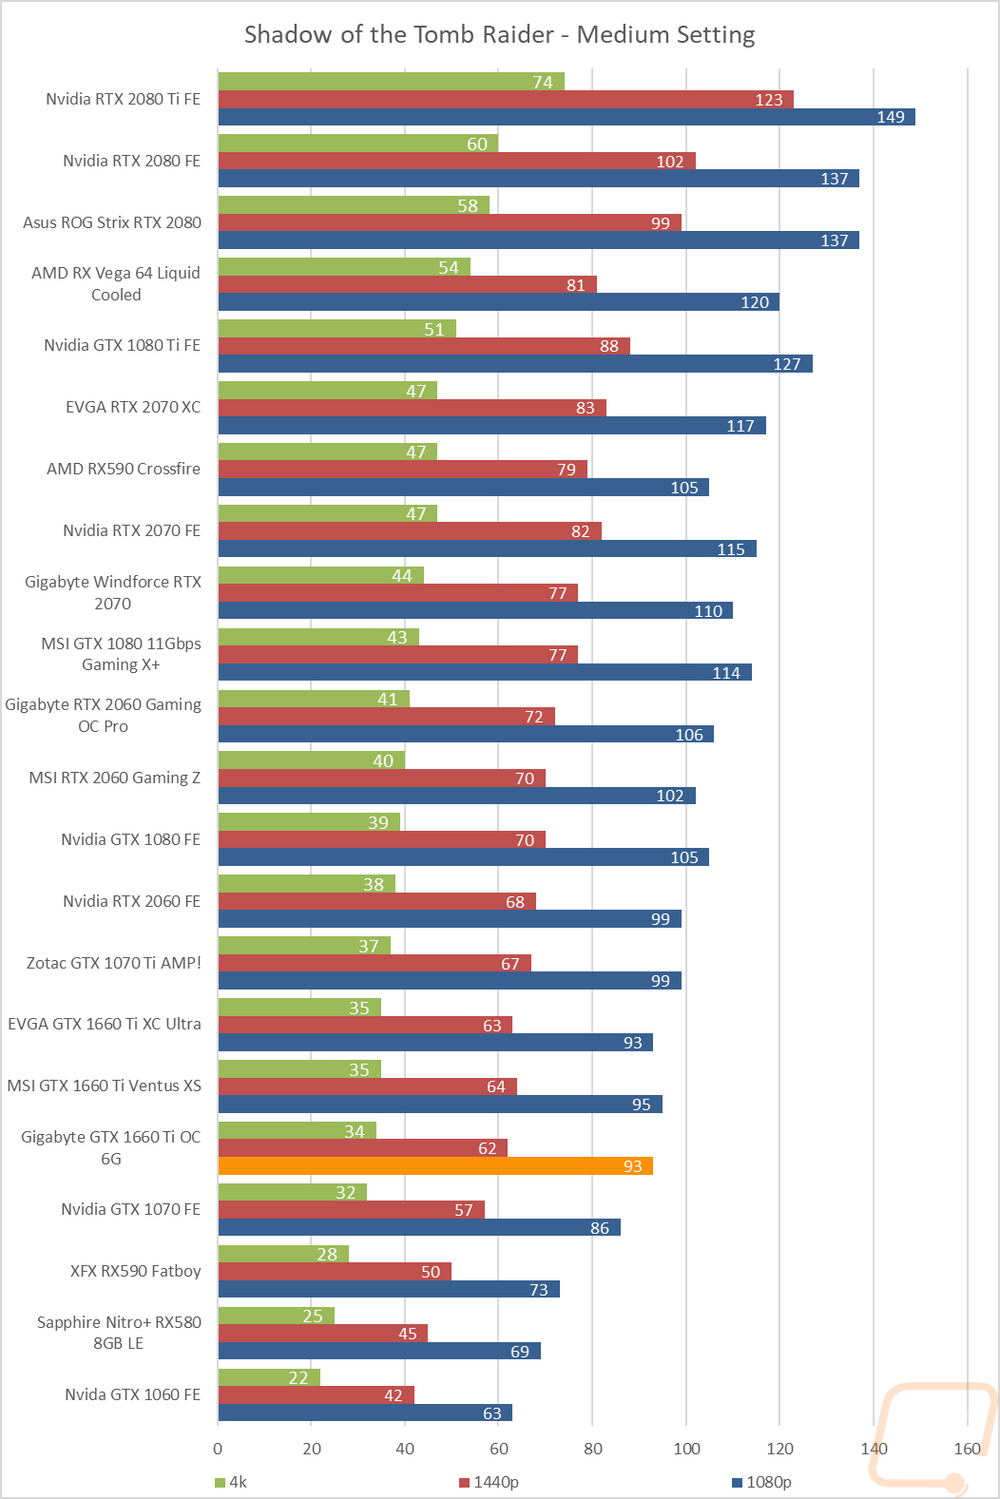
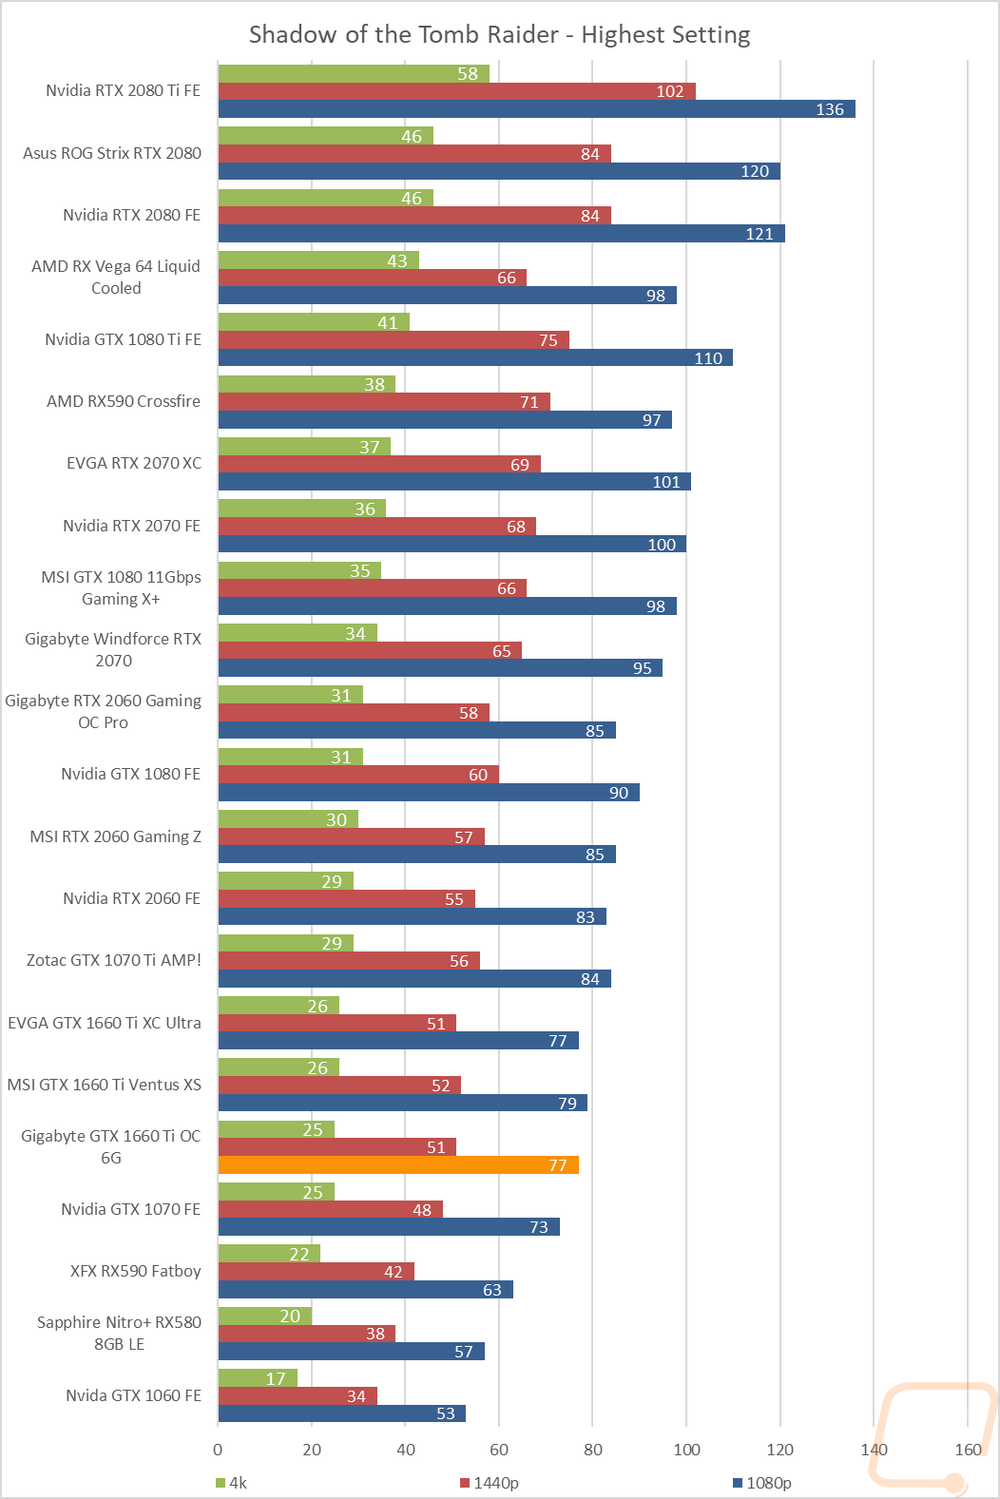
Of course, I do have all of the original graphs as well. It is a lot to parse through though. I was mostly curious how the Gigabyte card compared to the two other GTX 1660 Ti’s given its slightly lower clock speed. In the synthetic benchmarks, the small difference ended up being a larger gap. In games, the difference was a 1-2 FPS which is a lot given just the 30 and 60 MHz differences between the MSI and EVGA cards. But in the bigger picture, this didn’t change things too much when compared to the rest of the cards tested. DX12 is still favored and it does perform in between the GTX 1070 and the GTX 1070 Ti depending on the game like the other GTX 1660 Ti’s.