Compute Benchmarks
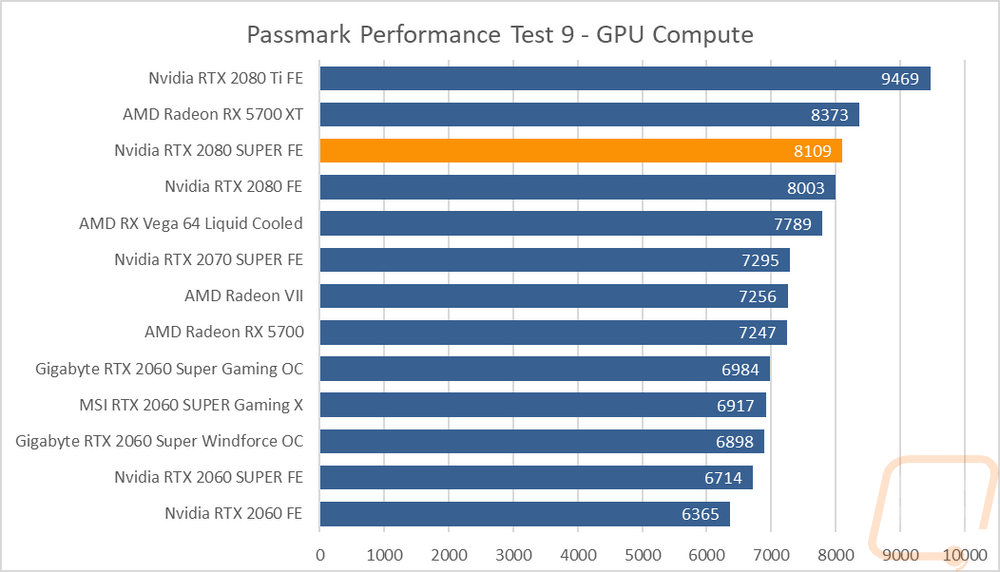
Now some people don’t need a video card for gaming, they need the processing power for rendering or 2D/3D production or in some cases people who game also do work on the side. So it is also important to check out the compute performance on all of the video cards that come in. That includes doing a few different tests. My first test was a simple GPU Compute benchmark using Passmark’s Performance Test 9 and the RTX 2080 SUPER FE did improve over the RTX 2080 but it wasn’t enough to edge past the RX 5700 XT in this test. The 100 point increase still left it behind the XT by 264 points. The 2080 Ti is still the top dog here with its huge 1096 point lead over the RX 5700 XT.
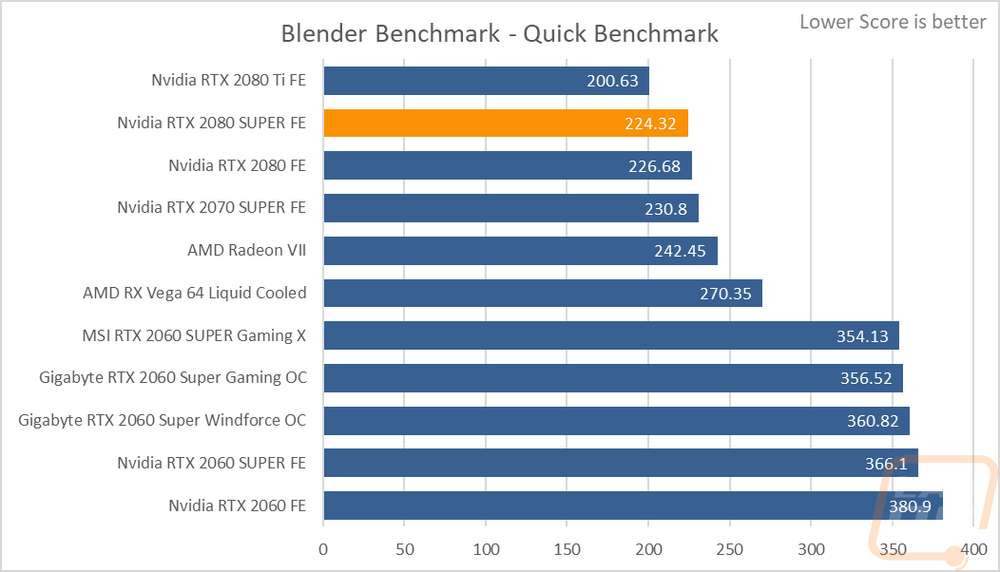
I love blender as a test because it is an extremely popular 3D modeling and production program making this a very real world benchmark. This is time based so the lower the score the better. The 2080 Ti is of course up top. I wasn’t all that impressed that the 2080 SUPER only took off a little over 2 seconds with the additional cores and GPU and memory clock speeds. Sadly the RX 5700 cards aren’t here due to a driver issue that would cause the benchmark program to crash before even getting to the test.
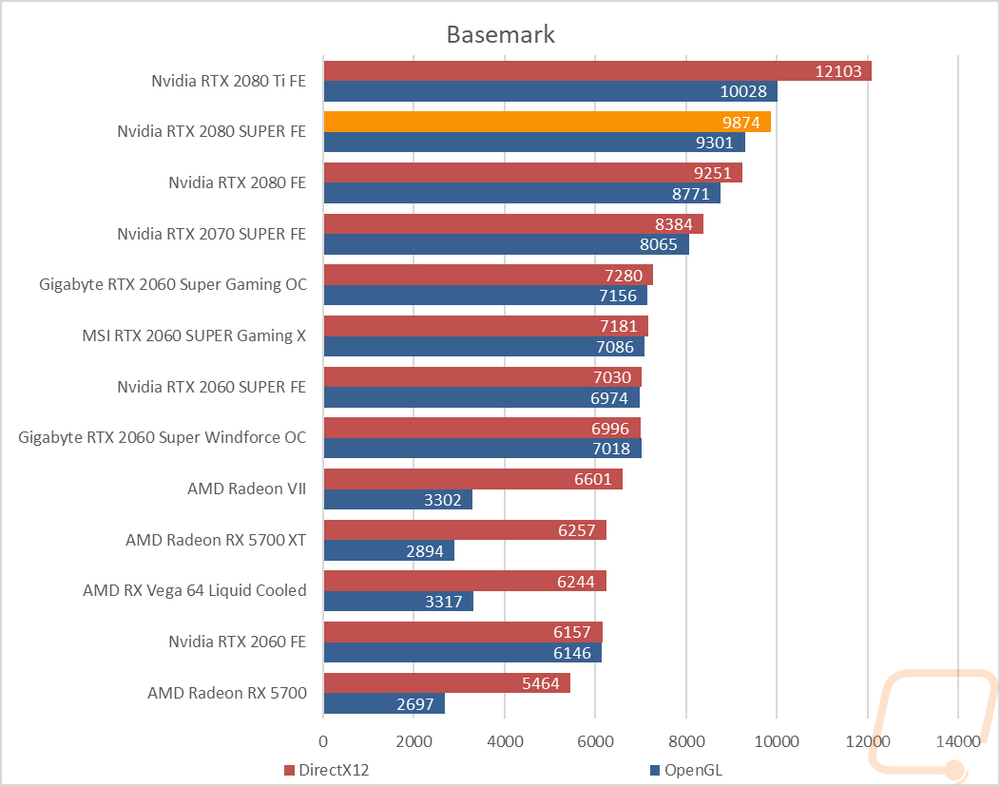
Next, we have Basemark with a look at OpenGL and DirectX 12 compute performance. As always the 2080 Ti is at the top, way ahead of everything else. The 2080 SUPER, on the other hand, gained 623 points over the RTX 2080 in the DX12 test and 530 in the OpenGL test. A nice jump, but still only about a ¼ of the way to the RTX 2080 Ti.
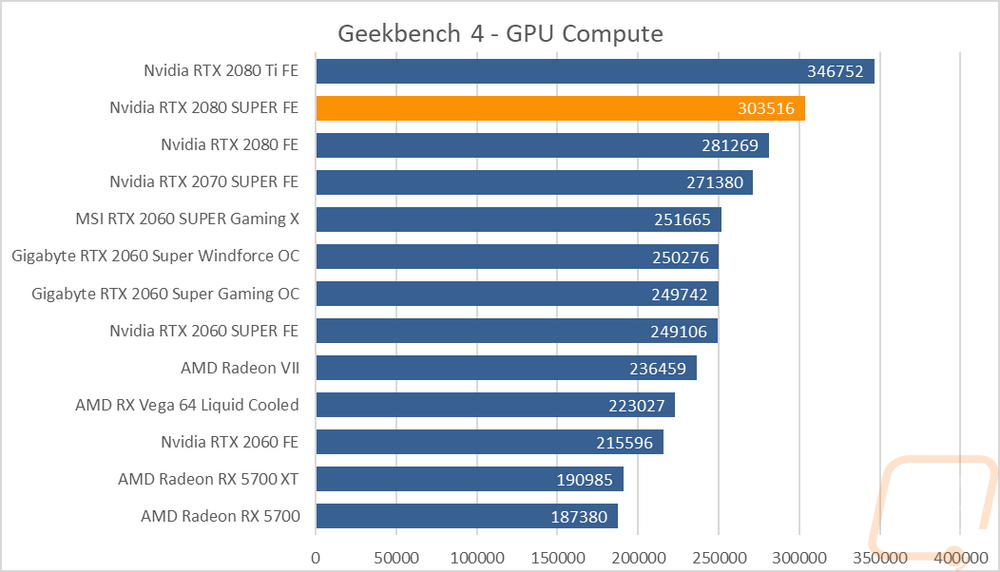
The last compute test was Geekbench and this was run with the newly updated 4.4 version along with retests on all of the other cards. 4.4 fixed a bug that affected Intel and AMD GPUs. Of course, that dropped the AMD cards down the chart. In this test the RTX 2080 SUPER increased even more over the RTX 2080, getting between 1/3 and ½ of the way into the gap between the 2080 Ti and the 2080.