Synthetic Benchmarks
As always I like to start off my testing with a few synthetic benchmarks. 3DMark especially is one of my favorites because it is very optimized in both Nvidia and AMD drivers. It's nice to not have to worry about it being favored too much either way and the repeatability of the results makes it a nice chance to compare from card to card. Going into testing the RX 5700 XT Gaming OC there are a few things I should note. I did retest ALL of our RX 5700 and RX 5700 XT cards during this one. Drivers were updated and numbers weren’t making sense. This is on top of the normal driver issues that I have been having with this launch that sometimes mean rebooting part of the way through my testing after results randomly drop in performance. This includes the Thicc II that I last reviewed. That said, going into this, like with previous 5700 XT reviews I am mostly looking at how the Gaming OC performs against other 5700 XT’s given that it has an overclocked base clock but its boost clocks are the same as the reference card. I also want to see how it compares with the RTX 2060 SUPER that is selling in the same price range.
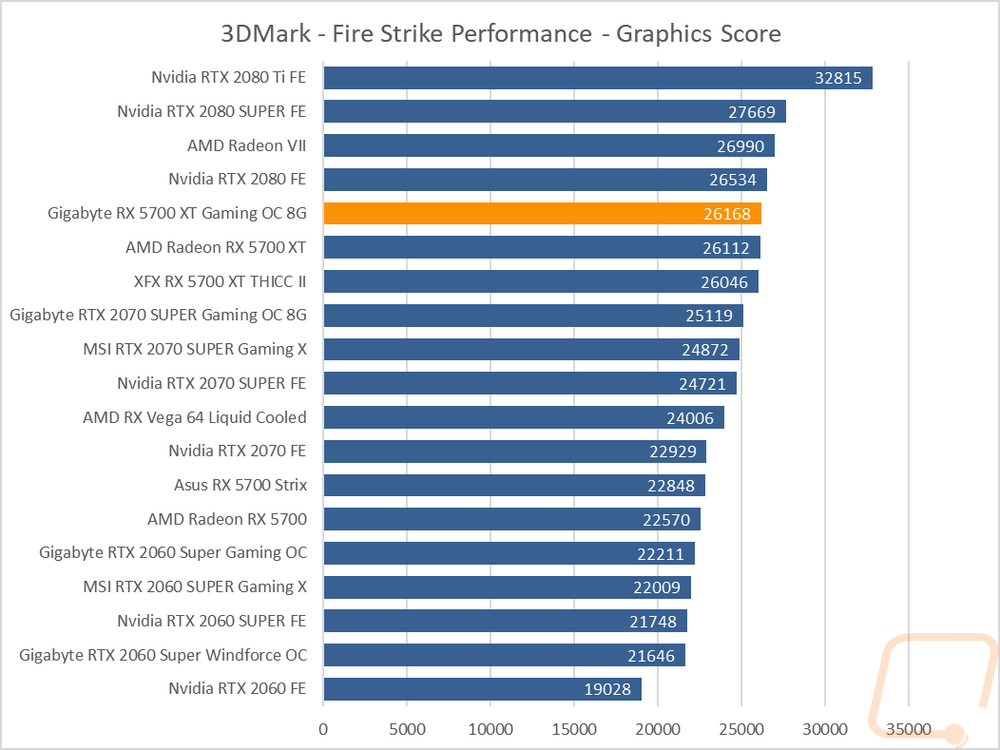
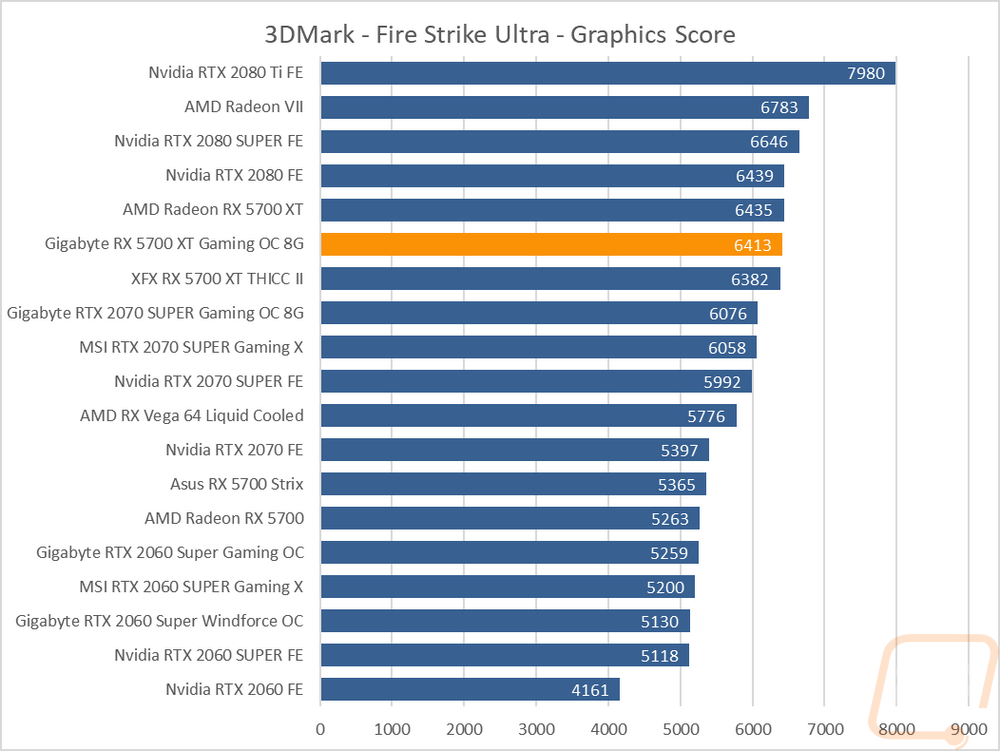
For my first tests, I went with 3DMark Fire Strike, the original test in the newer 3Dmark test suite and a DX11 focused test. They have three detail settings ranging from Performance, Extreme, and Ultra. I ran all three. In all three the Gaming OC was running right with the reference card, beating it in the lower resolution test and being right behind it in the other two. The Thicc II was actually lower on these tests. As for Nvidia even the RTX 2070 SUPER was well below, let alone the RTX 2060 SUPER. The RTX cards haven’t liked this older test like they have the DX12 test.

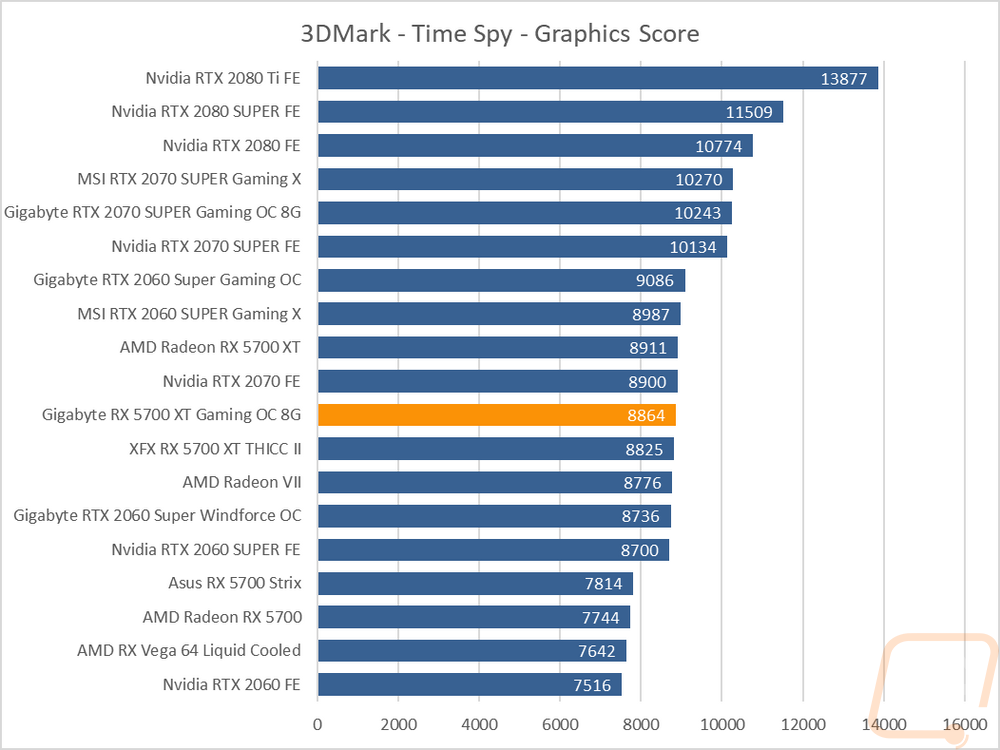
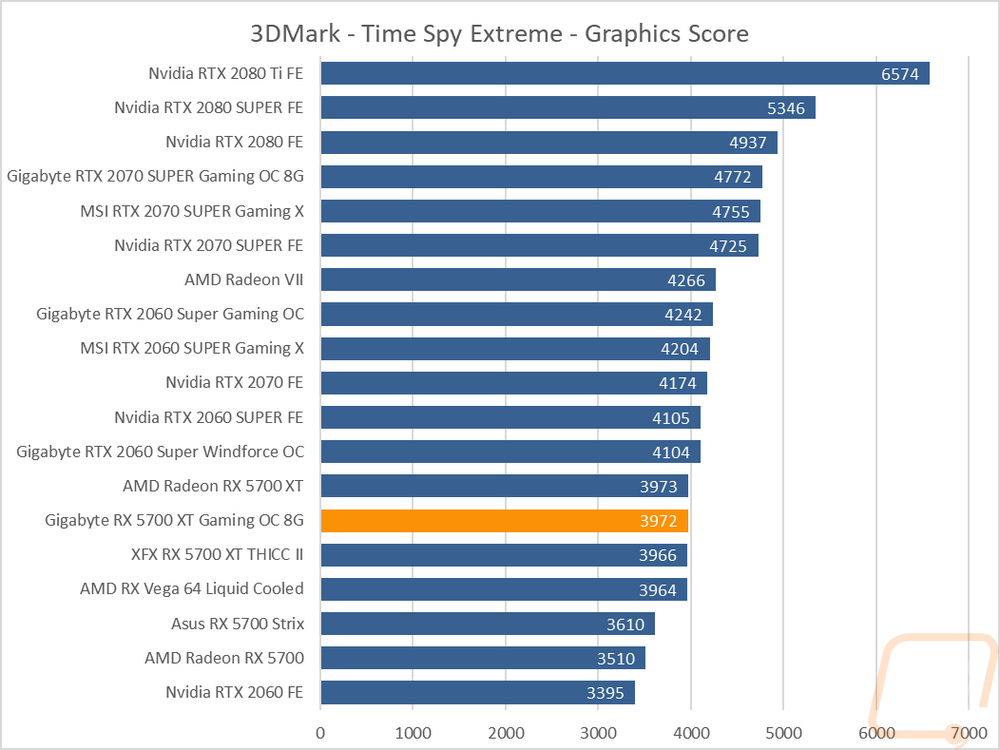
So for DX12 3DMark has Time Spy which is a newer test and they have two detail settings. The standard test and Extreme. You can see the huge jump in performance for the Nvidia cards here with all of the RX 5700 XT’s dropping down below the RTX 2070 FE and some of the higher overclocked RTX 2060 SUPERs. On the Extreme detail results, there is more of a clear break between them but the regular Time Spy has both the 2060 SUPER/RTX 2070 and the RX 5700 XT’s running neck and neck. As for the Gaming OC it was again right with the reference card, the base clock overclock isn’t really felt here at all.
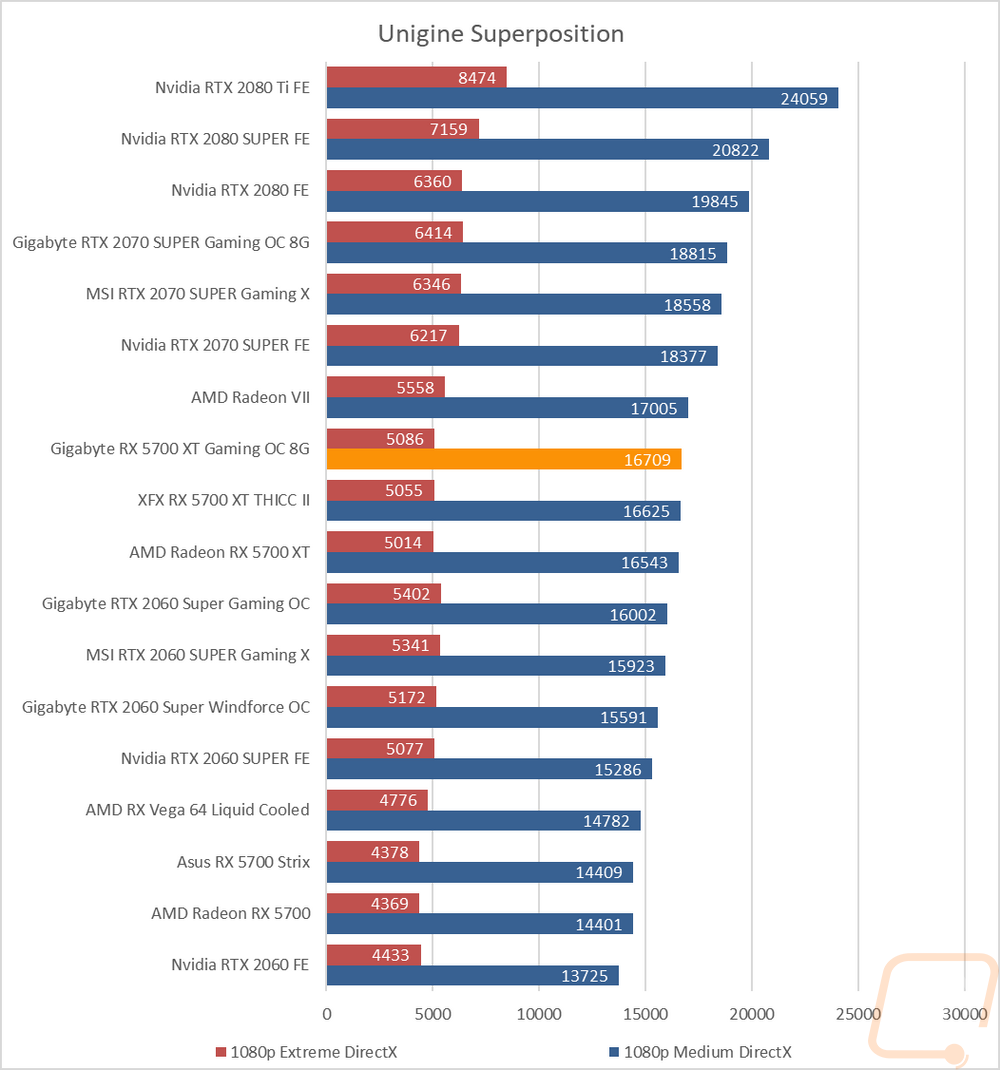
Then for my last test, I ran two tests in the Unigine based Superposition benchmark. Both at 1080p but one at medium detail and the other at an extreme detail. The Gaming OC did really well at medium detail here which is how the chart is sorted, outperforming the 2060 SUPER by a good margin. But if you look the extreme detail setting has things flipped the other way around, the Nvidia cards handled the high detail better. The Gaming OC is out ahead of the two other RX 5700 XT’s tested here as well.