In-Game Benchmarks
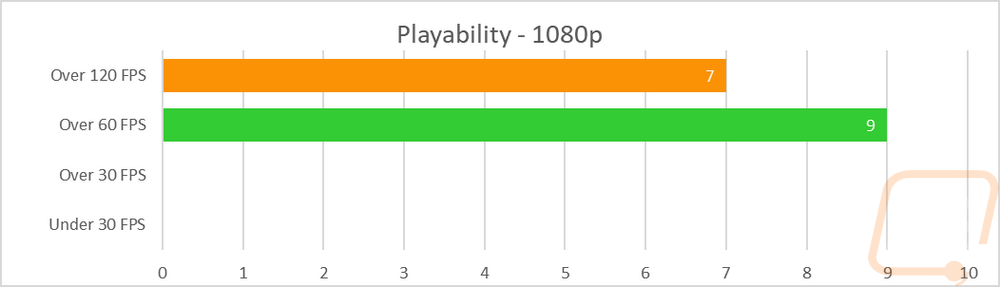
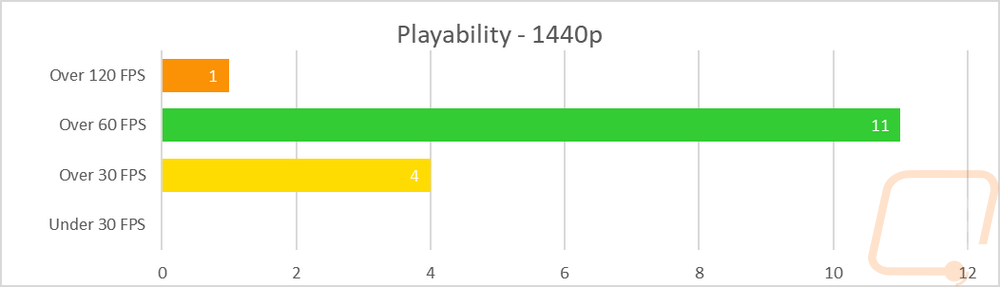
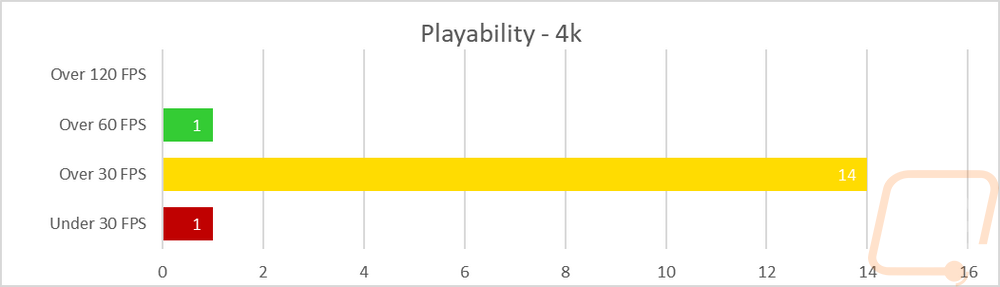
Now we finally get into the in game performance and that is the main reason people pick up a new video card. To test things out I ran through our new benchmark suite that tests 9 games at three different resolutions (1080p, 1440p, and 4k). Most of the games tested have been run at the highest detail setting and a mid-range detail setting to get a look at how turning things up hurts performance and to give an idea of if turning detail down from max will be beneficial for frame rates. In total, each video card is tested 48 times and that makes for a huge mess of results when you put them all together. To help with that I like to start off with these overall playability graphs that take all of the results and give an easier to read the result. I have one for each of the three resolutions and each is broken up into four FPS ranges. Under 30 FPS is considered unplayable, over 30 is playable but not ideal, over 60 is the sweet spot, and then over 120 FPS is for high refresh rate monitors.
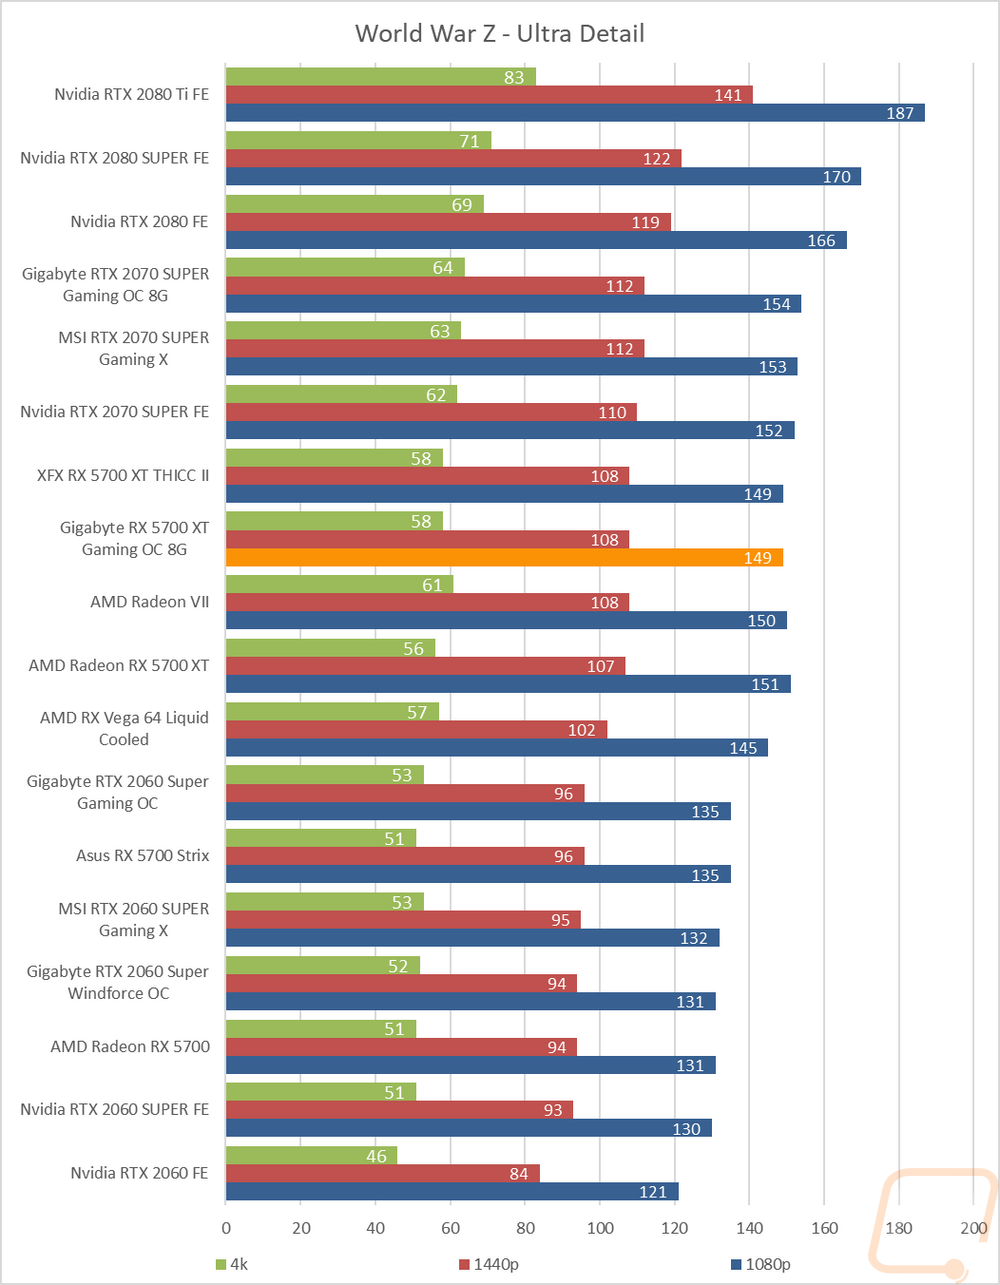
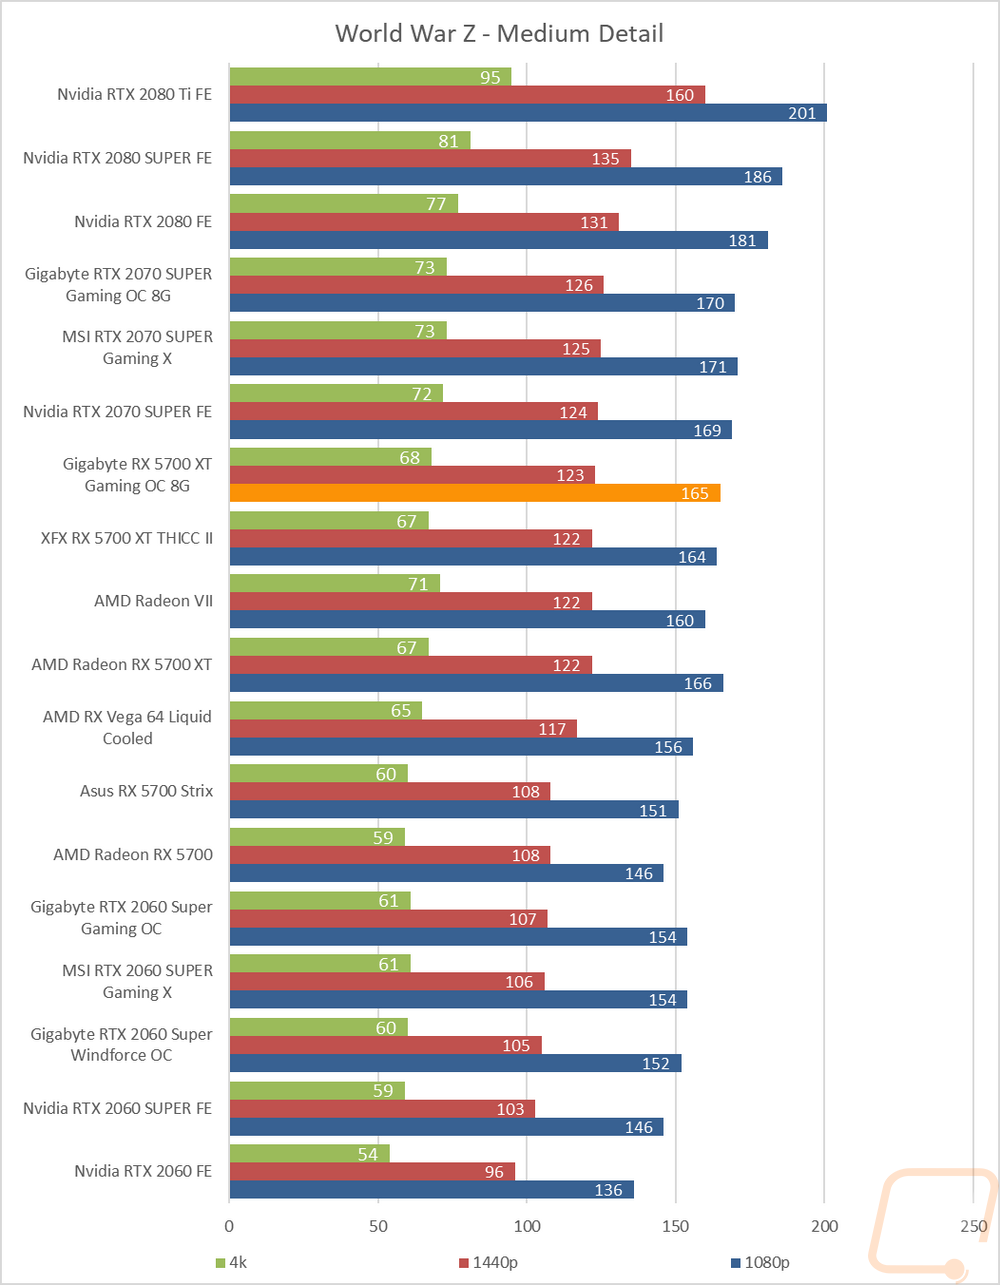
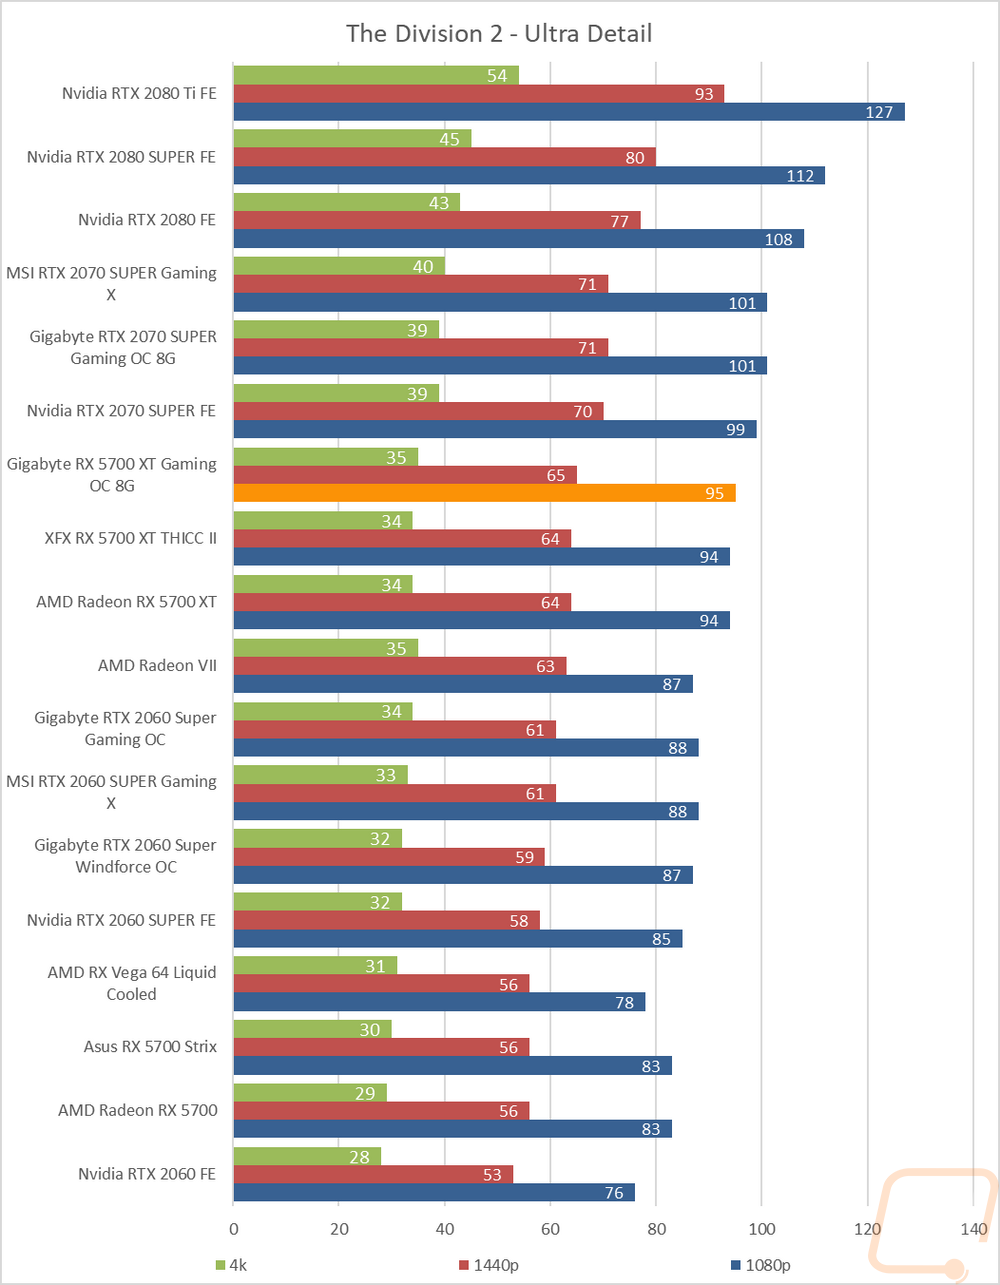
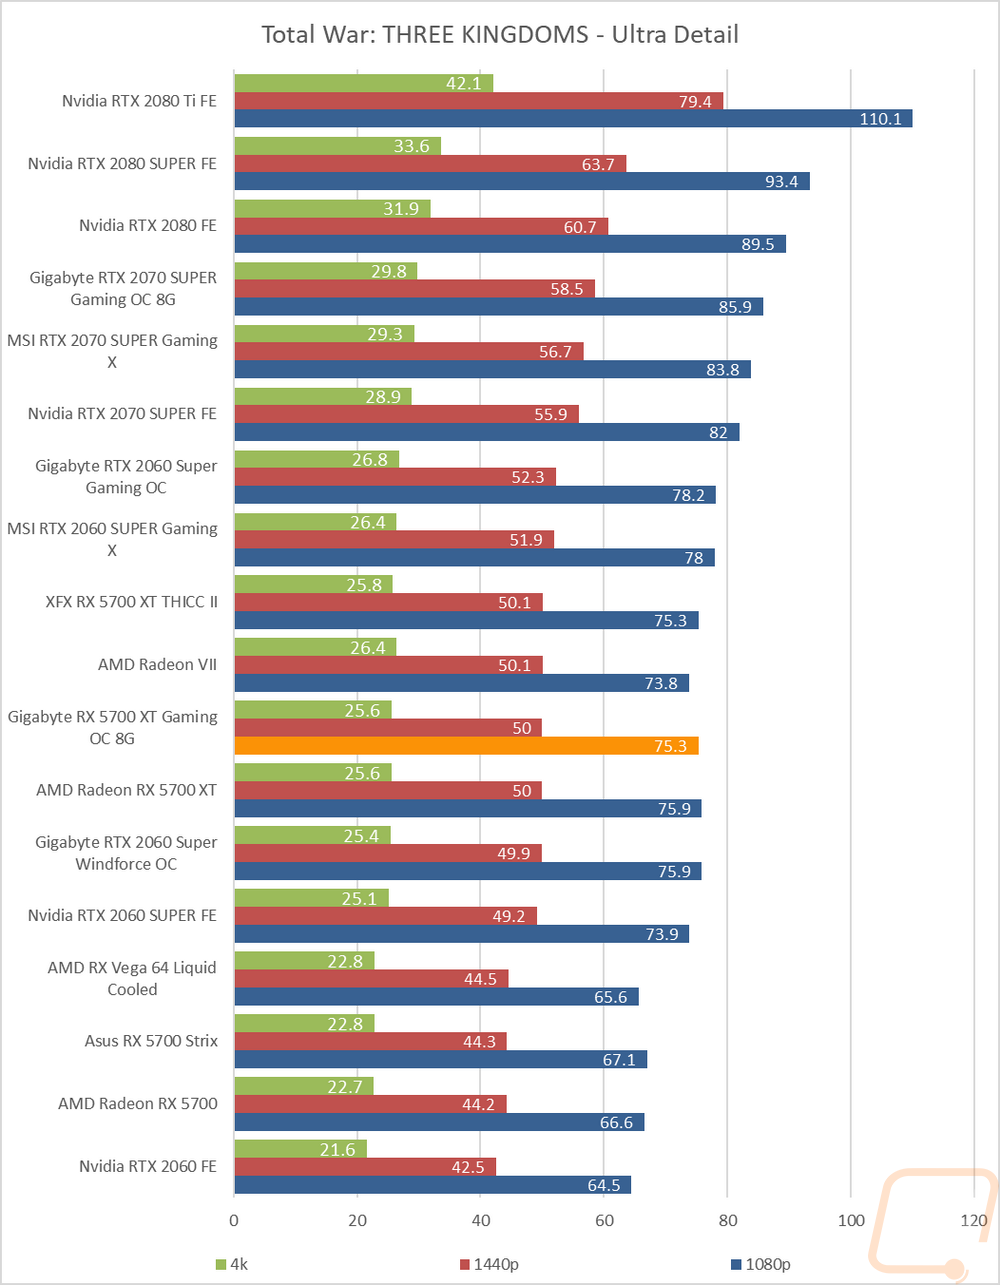
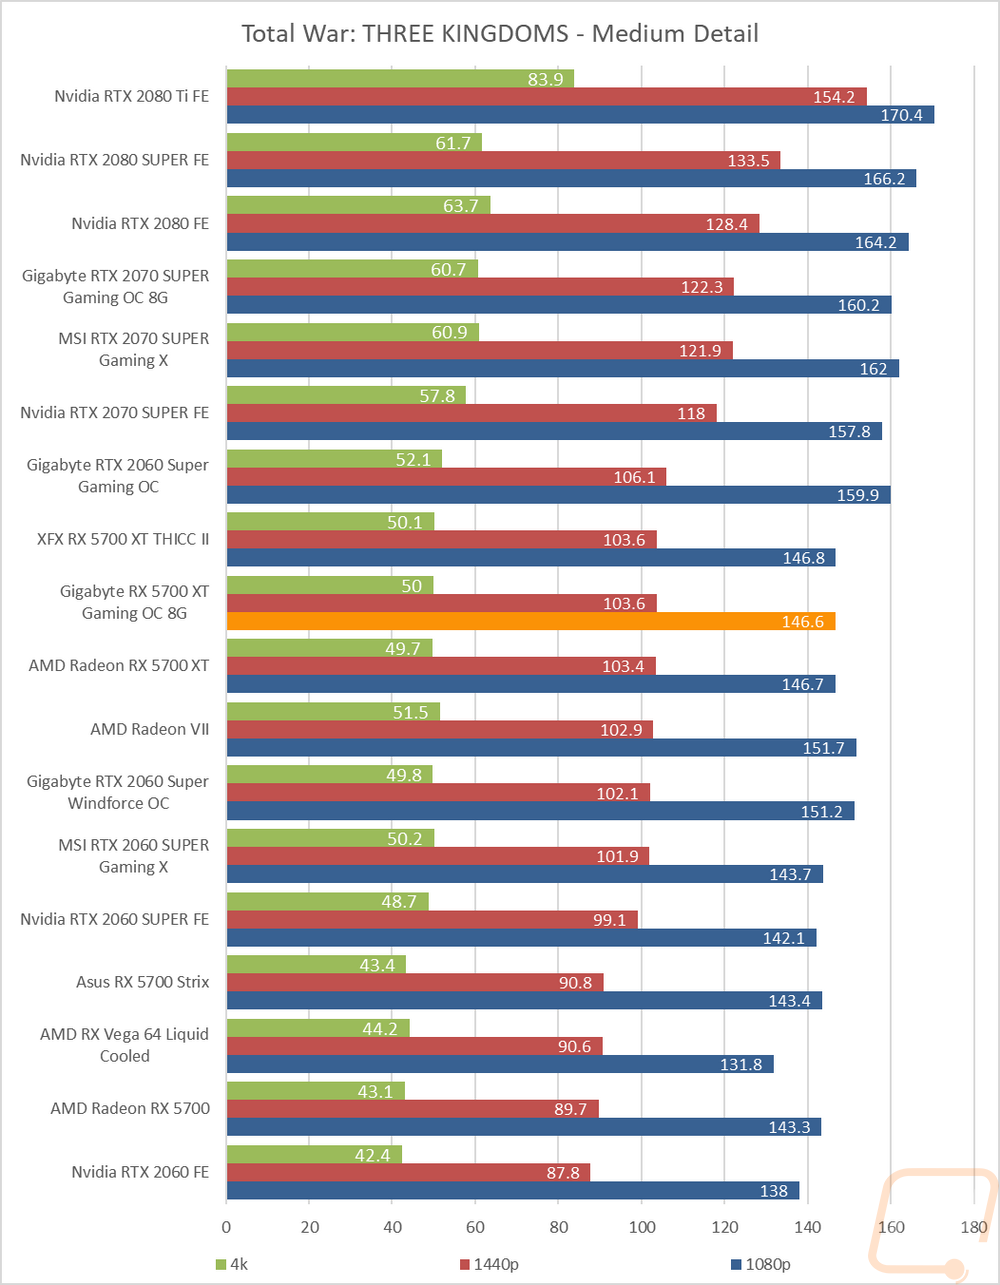
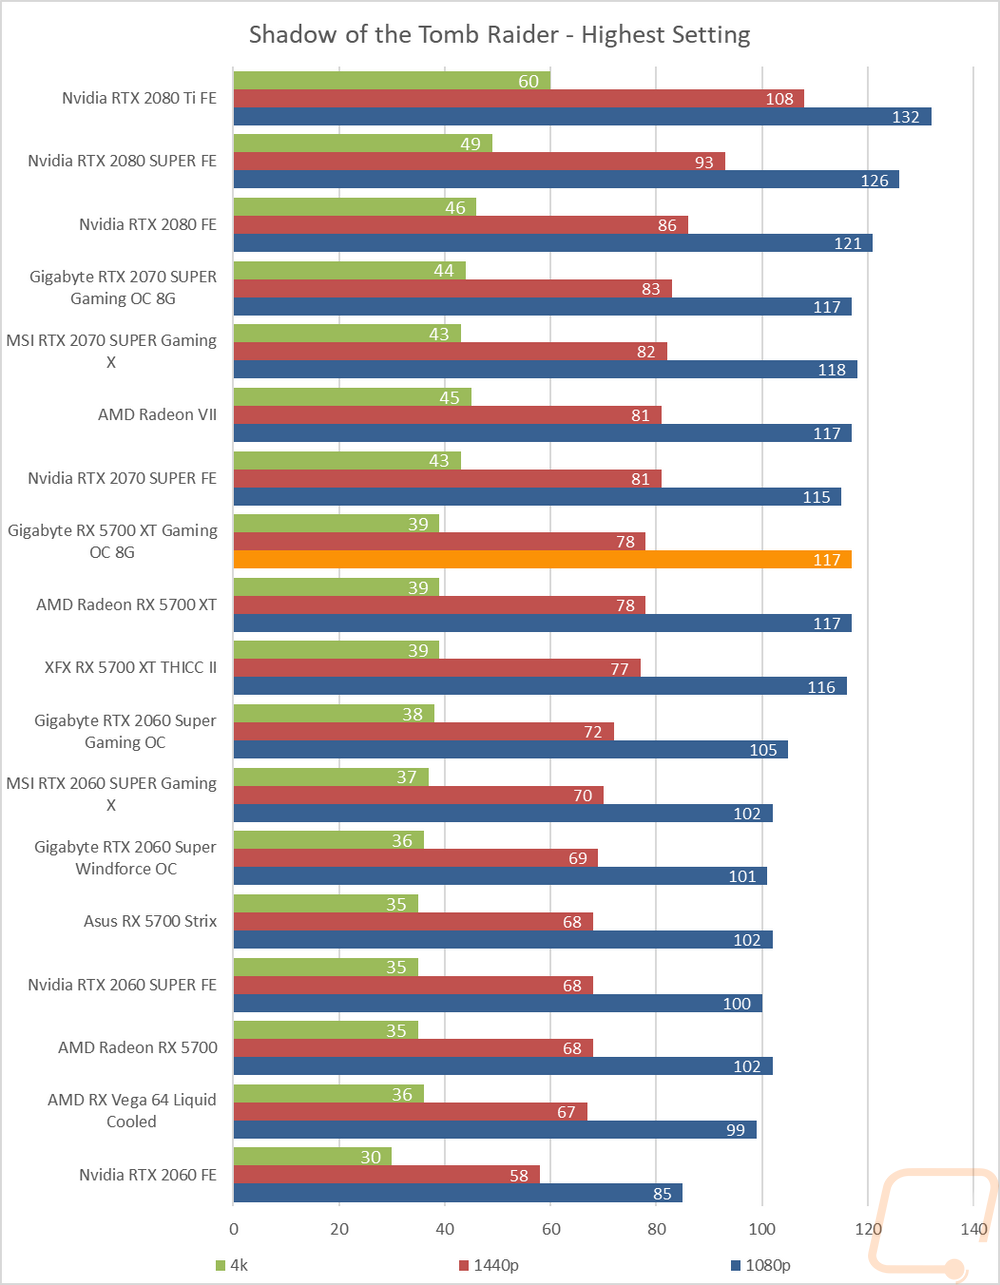
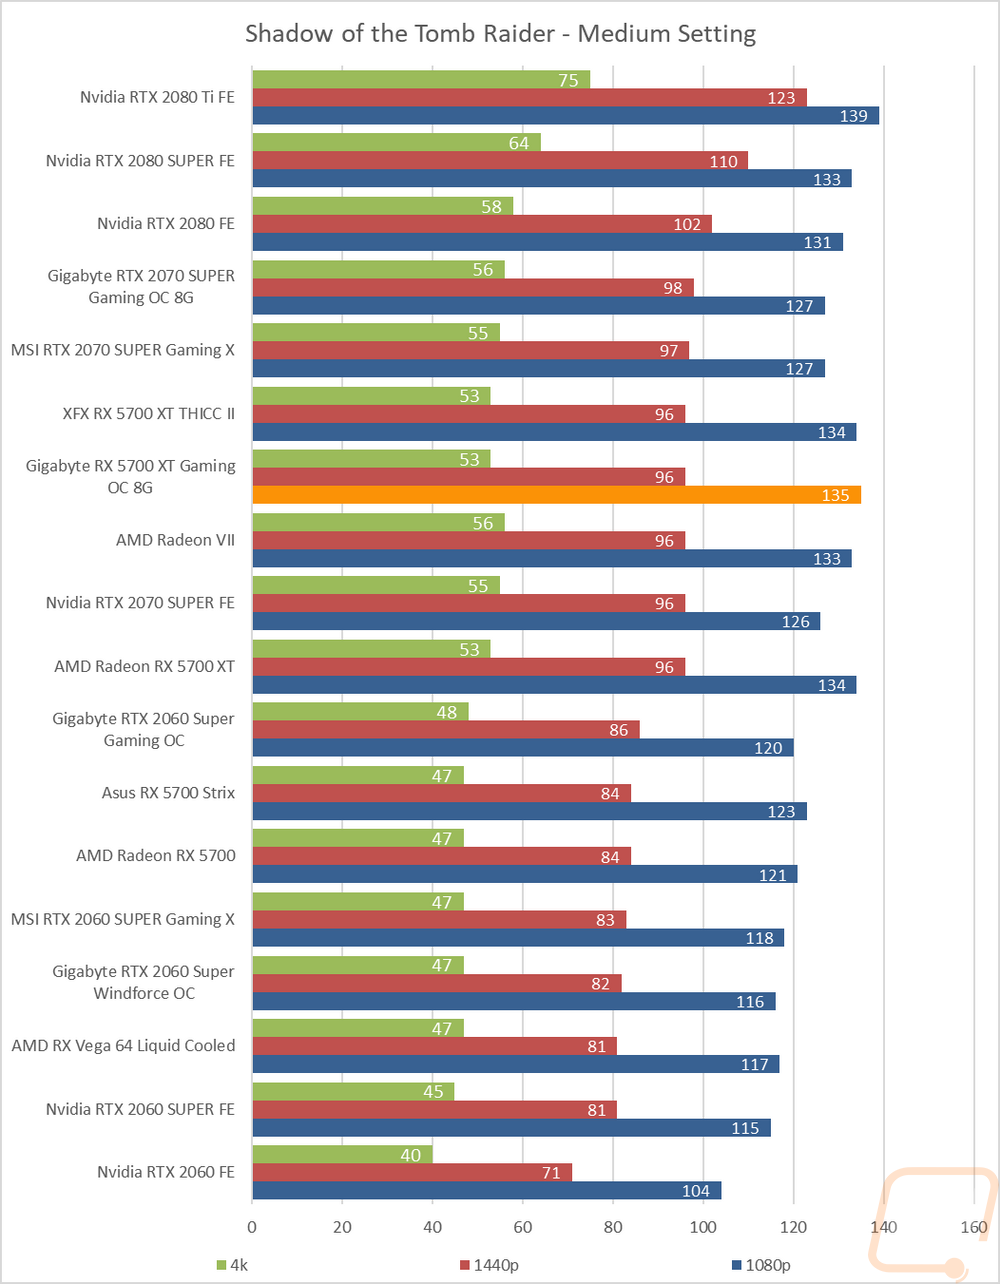
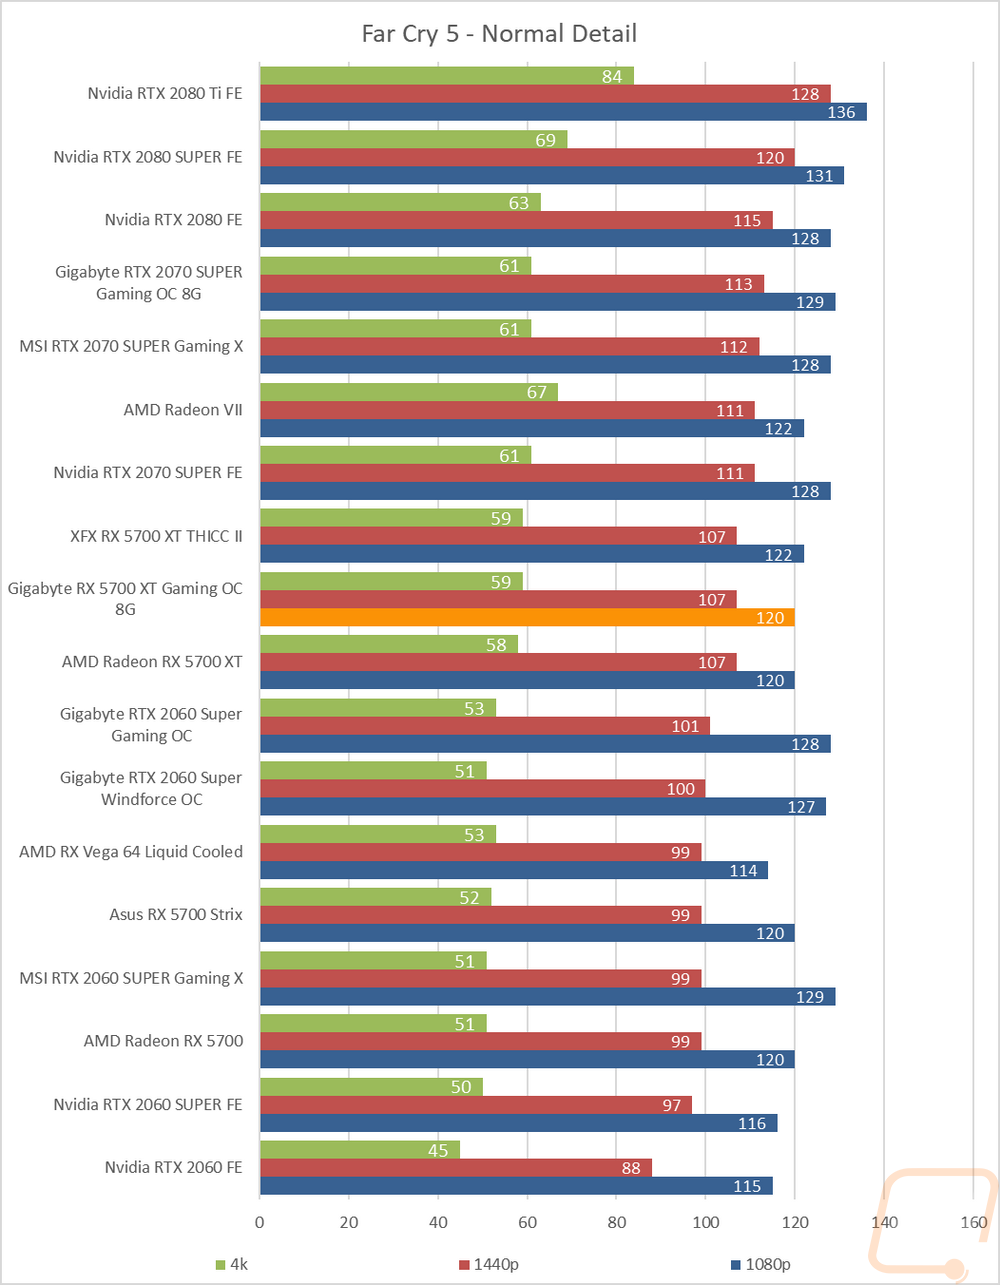
So how did the Gigabyte RX 5700 XT Gaming OC perform? Well at 1080p, as expected, there weren’t any results that wouldn’t be considered buttery smooth Given some of the tests are with modern titles with the settings cranked up and the games are a mix of AMD or Nvidia supported titles it is actually really hard to not have at least one slipping down below 60. The Gaming OC had 7 up over 120 FPS and the other 9 somewhere in between 60 and 119 FPS. At 1440p you can start to see some of those more demanding titles start to slow things down with 4 coming in below 60 FPS though I will say most of those are in the 55-59 FPS range, just like there are a lot of results up close to 120. But we have to draw a line somewhere. So at 1440p 1 is over 120 FPS and 11 not counting the 120 result were over 60 FPS. Then at 4k, the Gaming OC fell hard which wasn’t surprising considering how in the synthetic benchmarks the high detail results were hit hard. So at 4k 1 came in what I would consider unplayable (Total War: Three Kingdoms at ultra detail) . 14 were in the 30-59 FPS range and just one would be considered smooth. In other words, I wouldn’t plan on pushing 4k with the RX 5700 XT Gaming OC but 1440p or 1080p at high refresh rates would be expected.
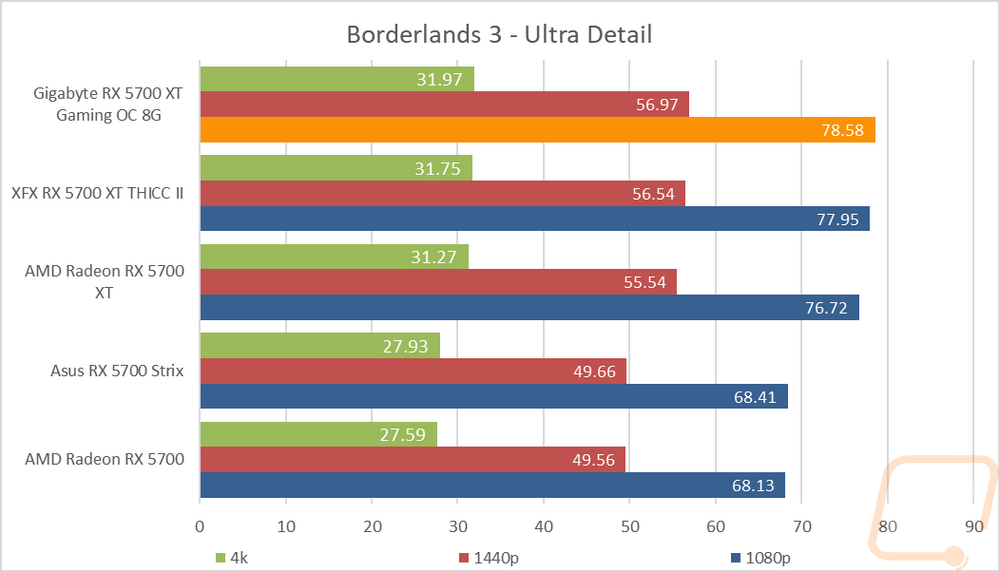
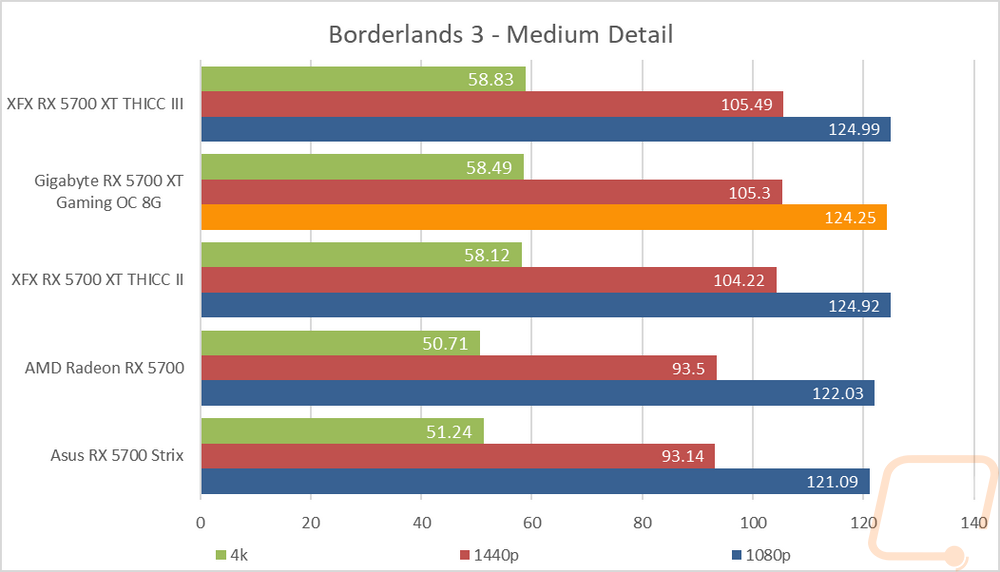
Of course, I have all of the results, not just the good bad and ugly charts above. With the retesting of our AMD RX 5700 cards I went ahead and added in a new benchmark for the recently launched Borderlands 3 and included those results. I will be filling that in more from the Nvidia side soon. In Borderlands 3 the Gaming OC topped the charts at the ultra detail and was just barely behind the Thicc II in the medium detail settings. For all of the game results I did change how they are sorted this time around after getting feedback from readers. Everything is sorted by their 1440p results which is the target for both the RX 5700 XT and the RTX 2060 SUPER. This also avoids some of the 1080p results which reach a point where they are CPU limited even on our 3900X system and 4K which doesn’t matter all that much when most of the results are lower than you would want.
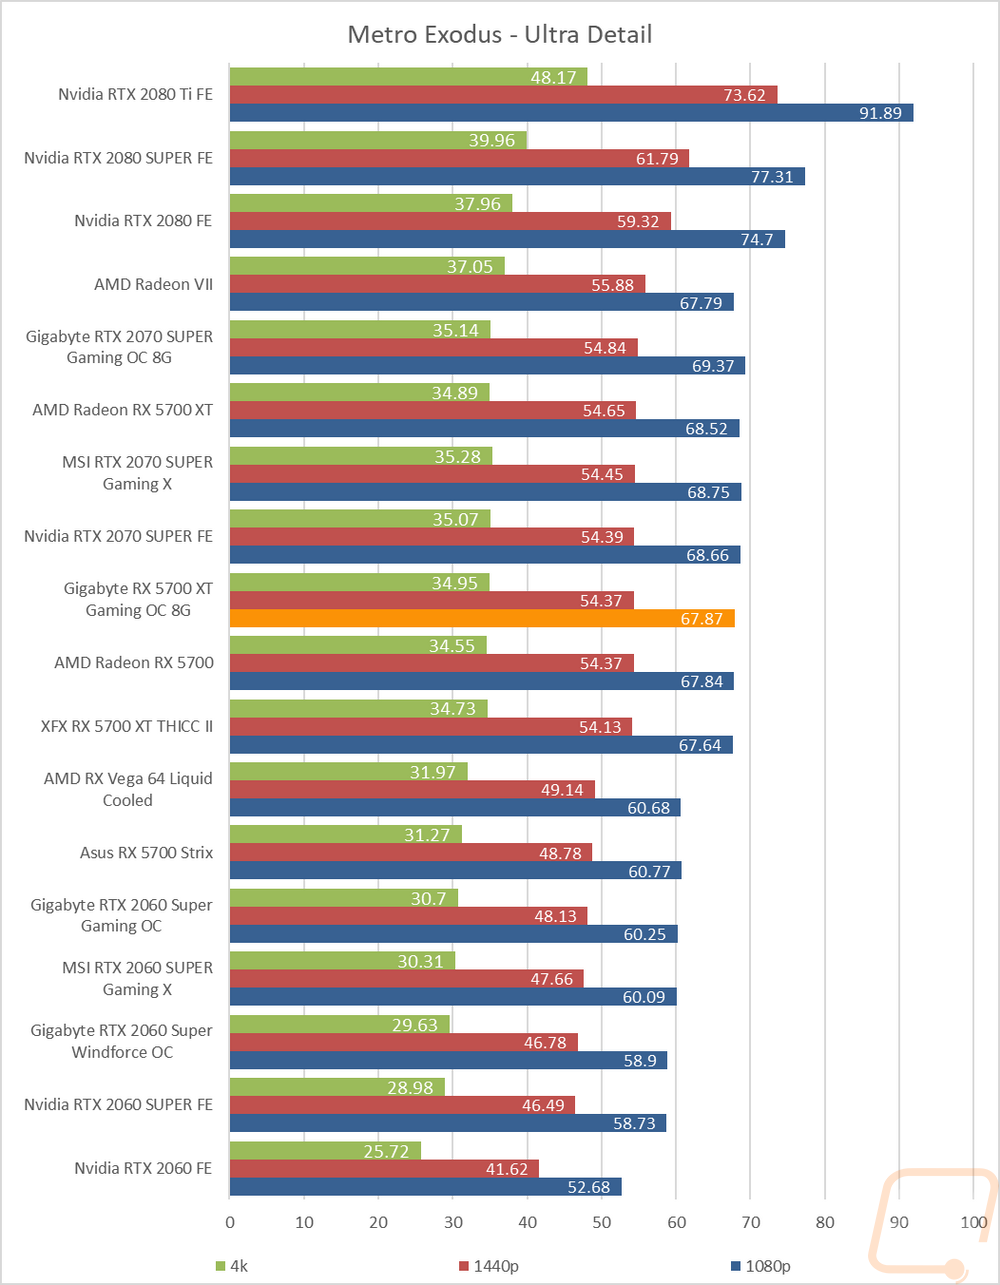
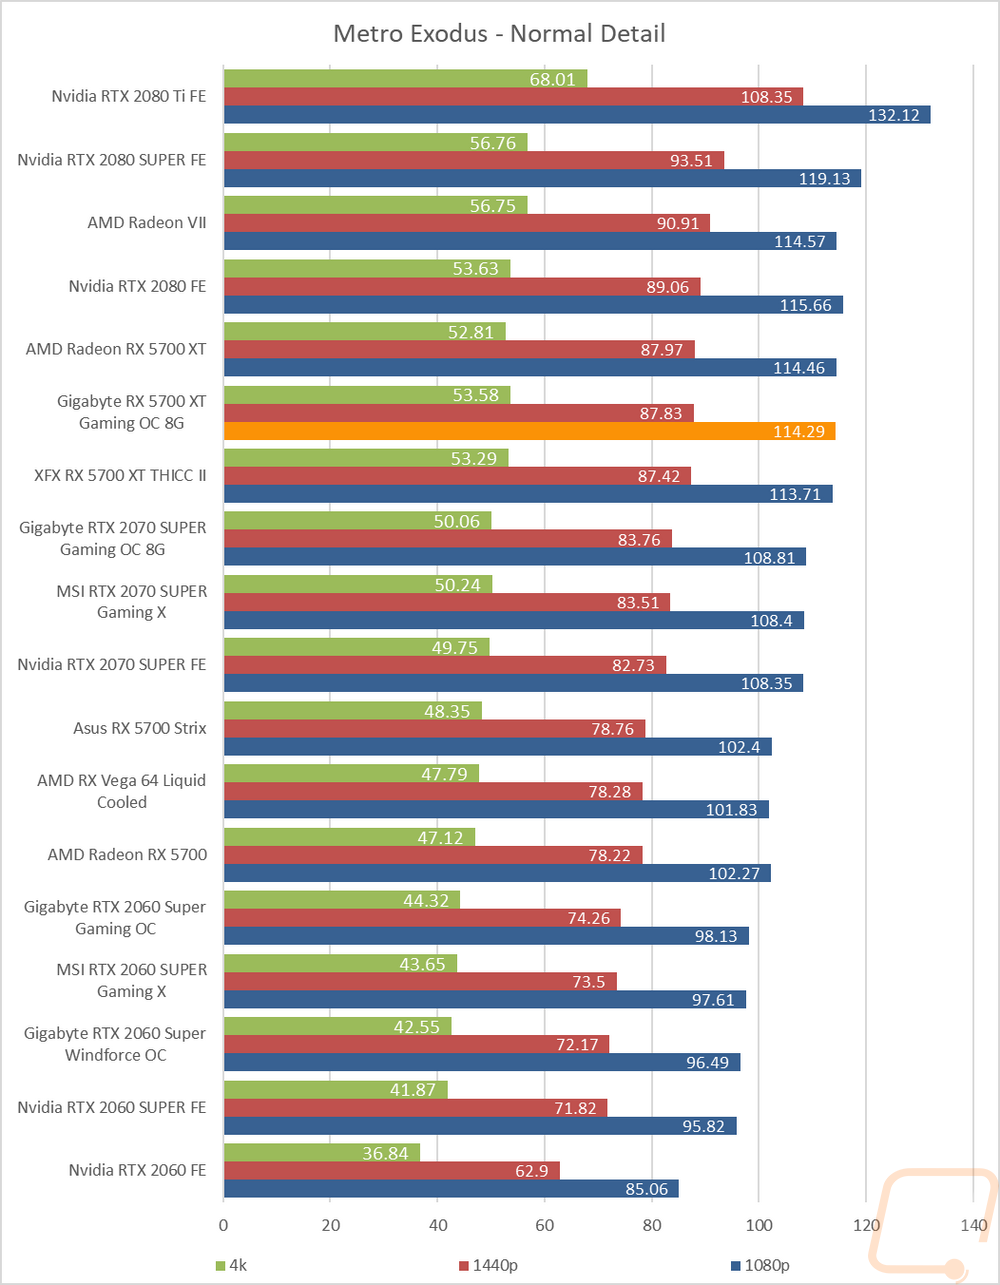
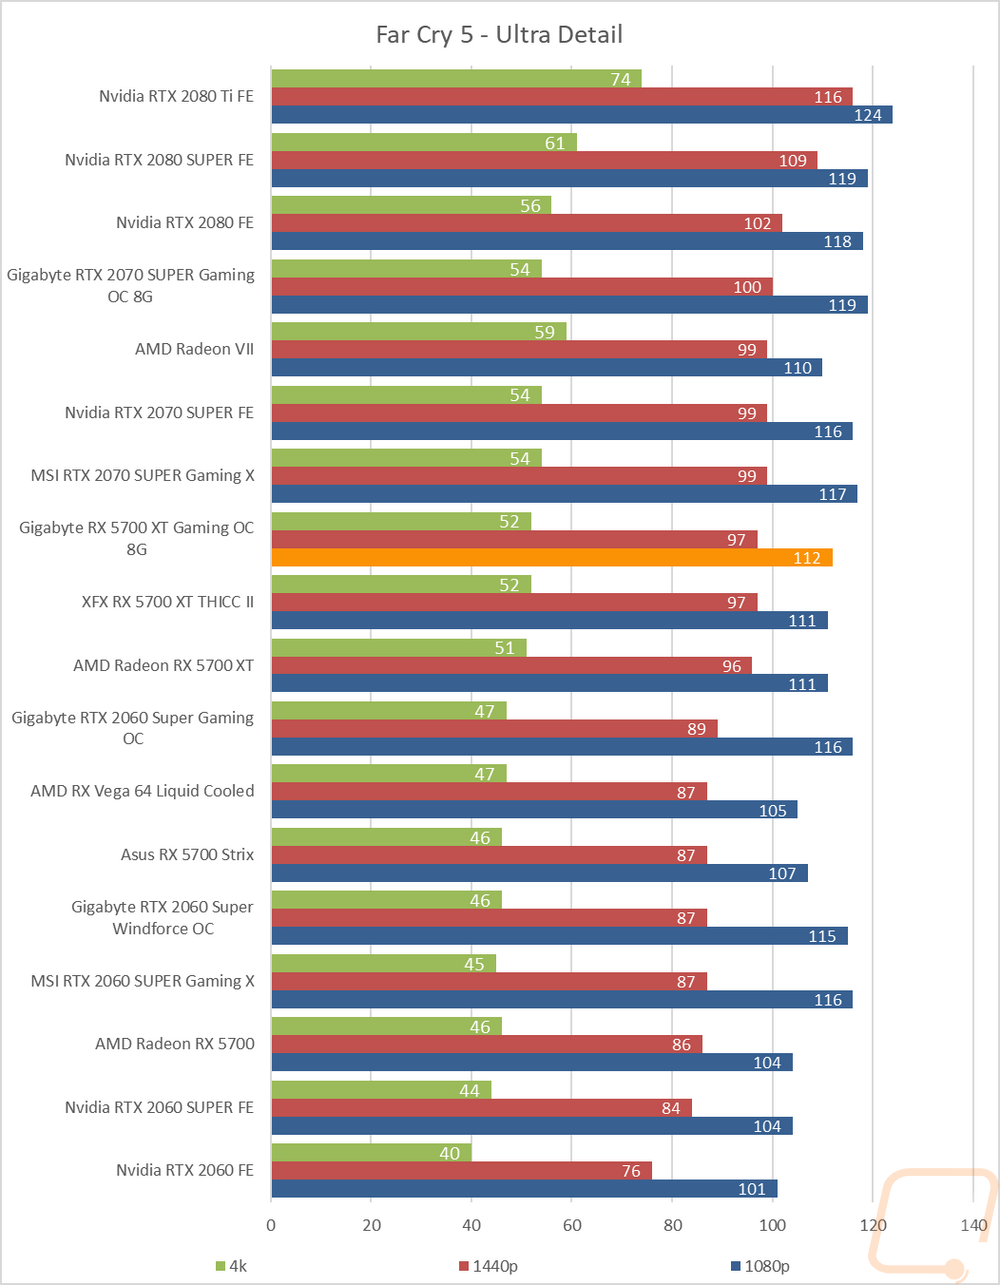
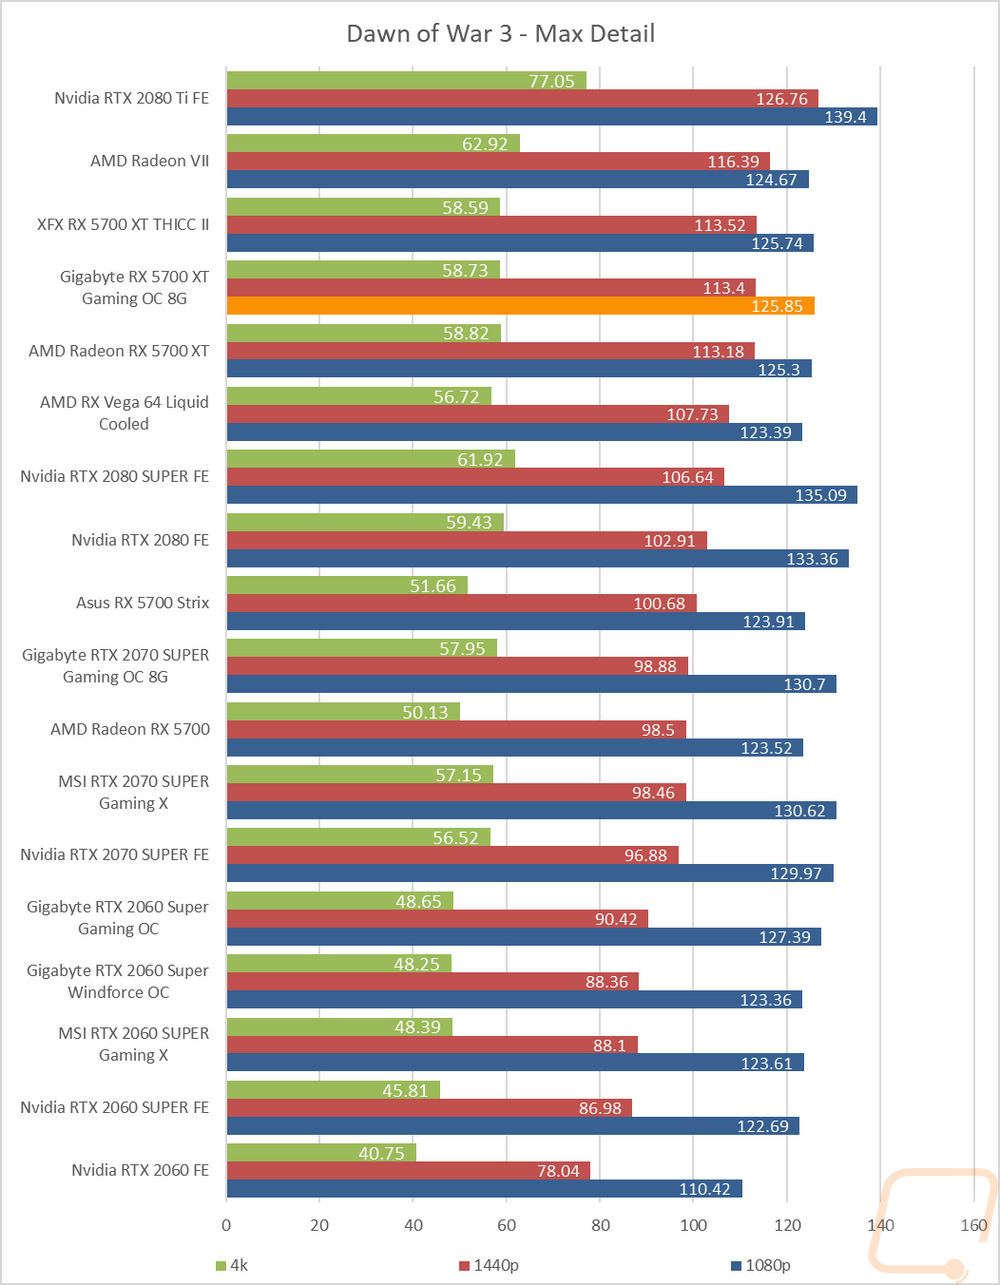
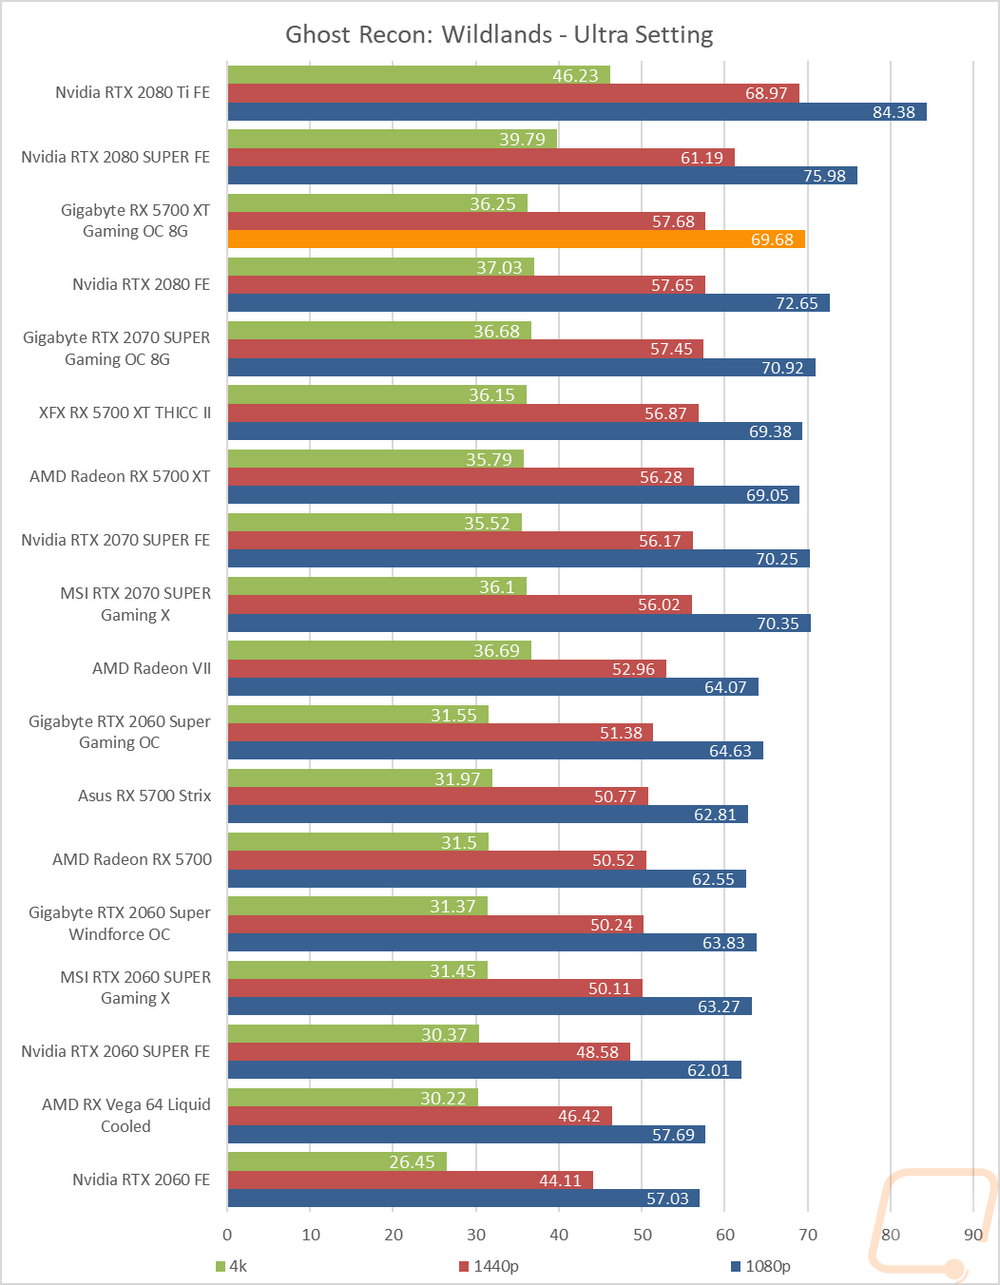
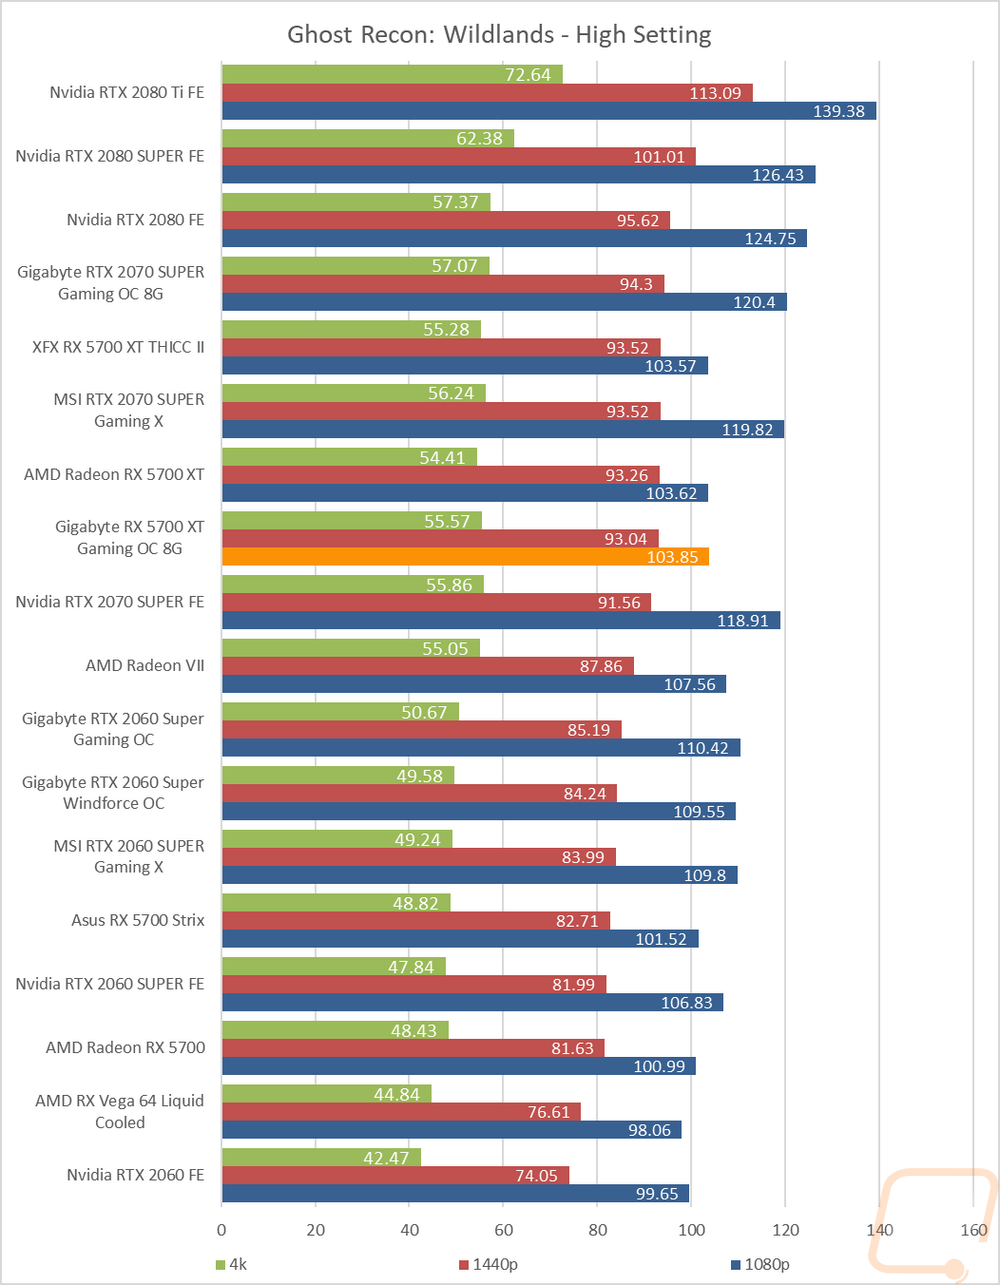
So how did the Gaming OC do when we look through the detailed results? Well in 7 of the 16 results it was the fastest of the three 5700 XT’s tested with both the reference card and the Thicc II sometimes taking that title. That isn’t too bad considering the Thicc II should be faster across the board given the boost overclock. There are a few outliers where the RX 5700 XT outperforms what it should and competes with the RTX 2080 at 1440p but in those you will notice both 4k and 1080p performance doesn’t compete. Ignoring those, and you have the RX5700 XT and the Gaming OC along with it competing with Nvidia’s RTX 2070 SUPER and RTX 2070 which are both more expensive cards. I was also really happy to see that even in the results that came in below 60 FPS like in Borderlands 3 at 1440p at ultra detail that they are very close. Same goes for 1080p at 120 FPS, there are at least 3 results that are in the 110-119 range. Overall the Gaming OC performed exactly how I expected it would against Nvidia and it traded blows with the Thicc II more than expected considering its overclock.