Synthetic Benchmarks
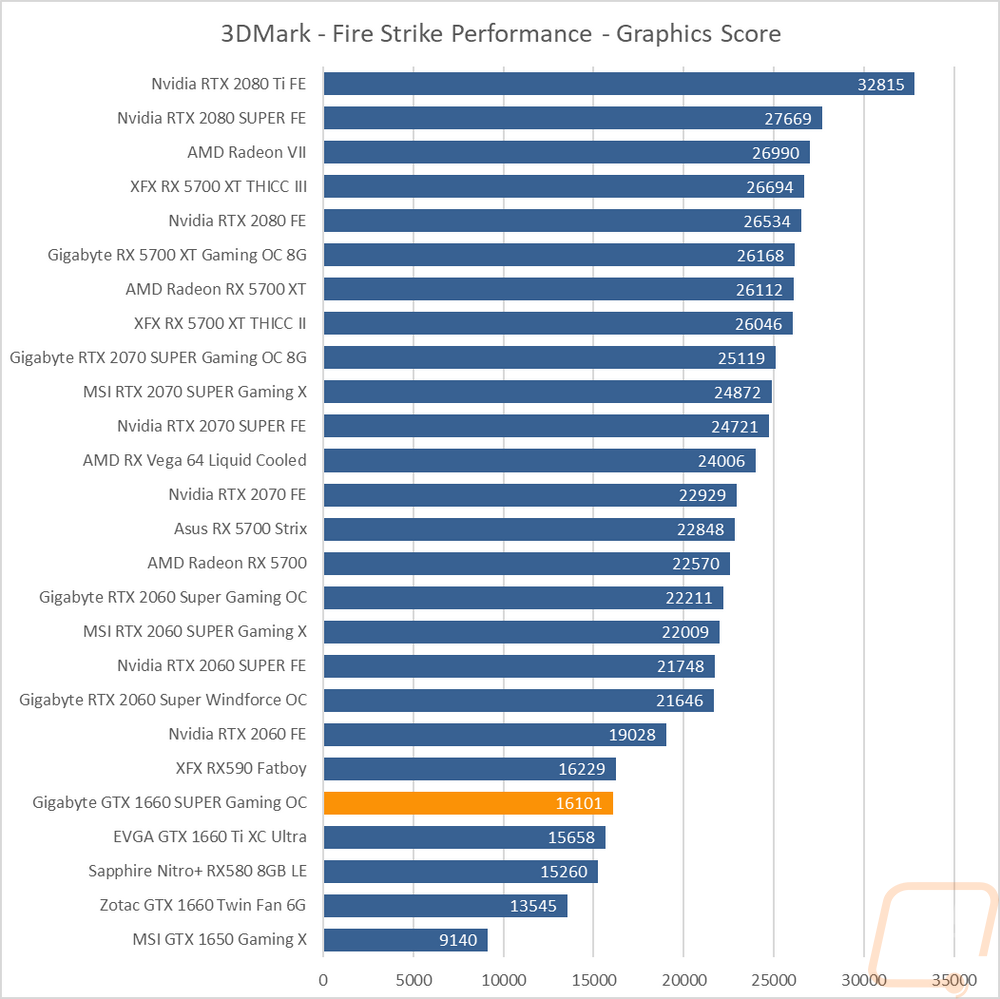
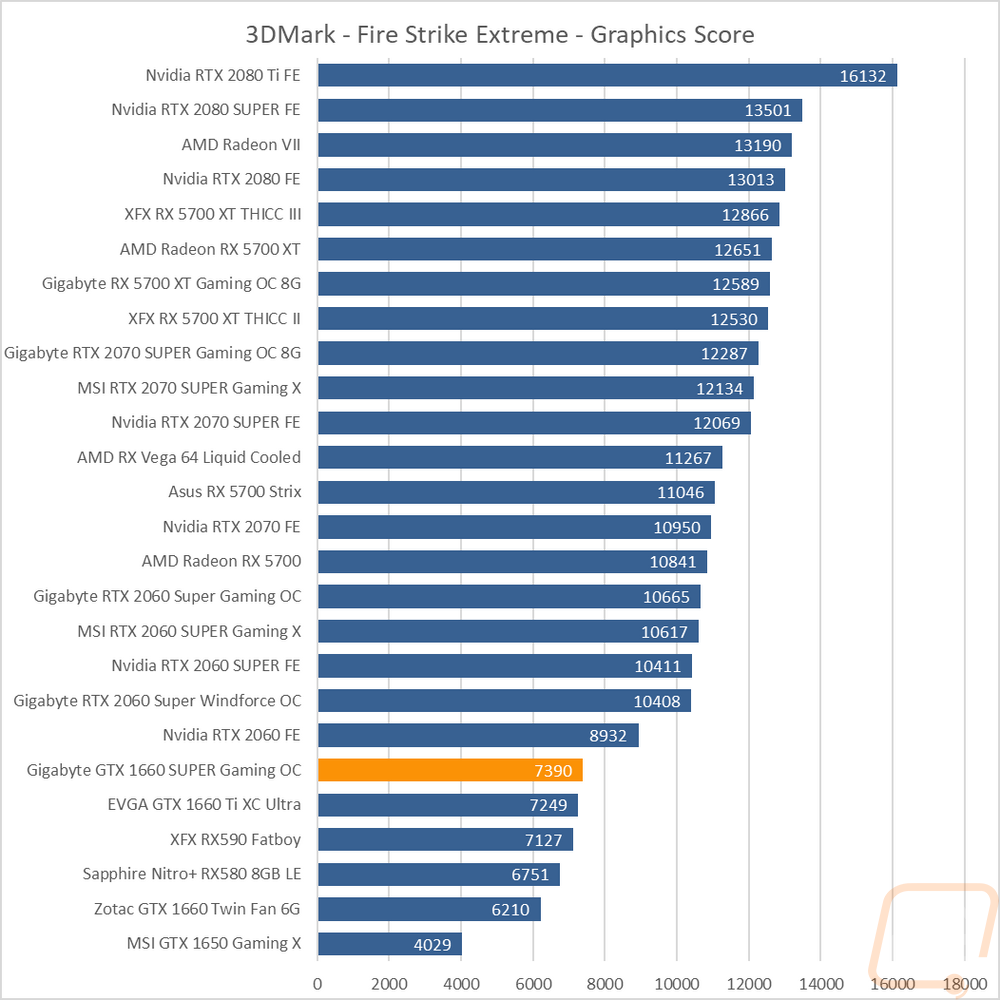
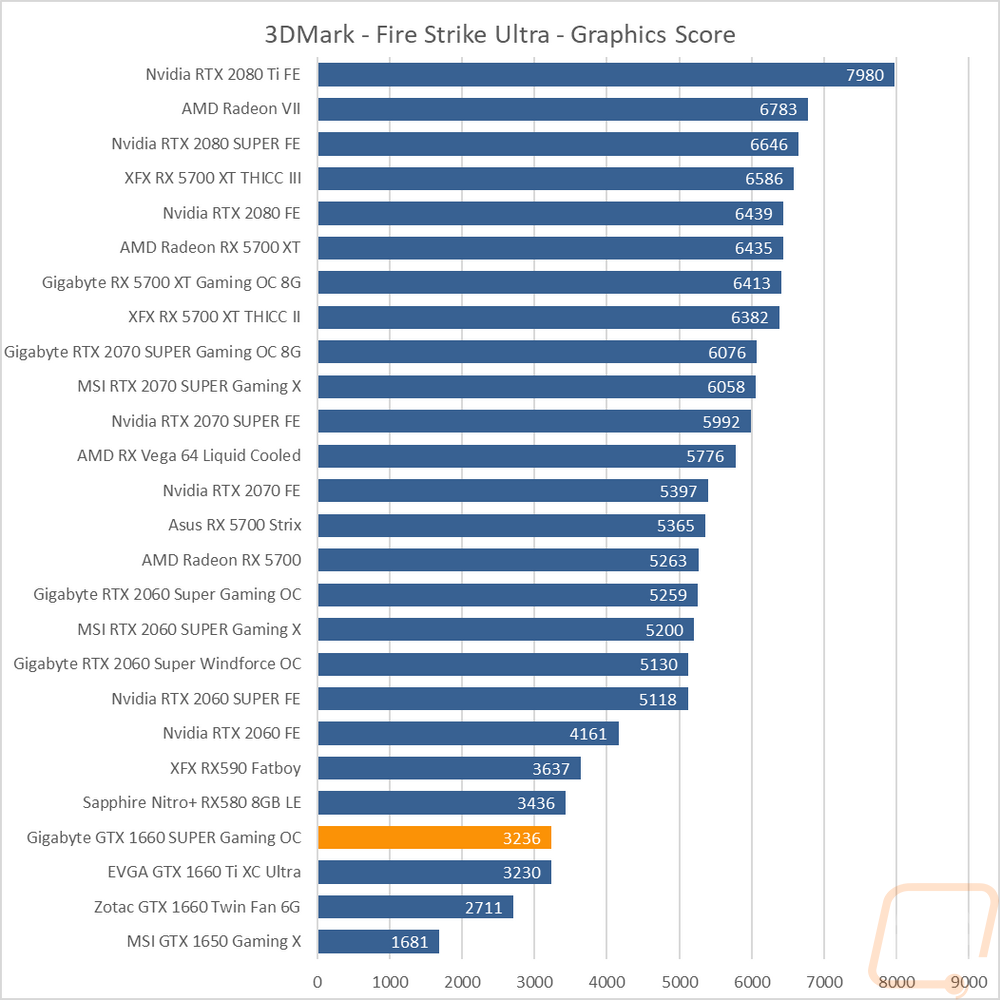
As always I like to start off my testing with a few synthetic benchmarks. 3DMark especially is one of my favorites because it is very optimized in both Nvidia and AMD drivers. It's nice to not have to worry about it being favored too much either way and the repeatability of the results makes it a nice chance to compare from card to card. So how did the GTX 1660 SUPER Gaming OC do? Well, my first test was using the older Fire Strike tests in 3DMark which are DX11 focused and it did well, really well. It actually ran with and in a few tests outperformed the GTX 1660 Ti and with the exception of the highest detail setting it ran with or outperformed the RX590 from AMD as well.
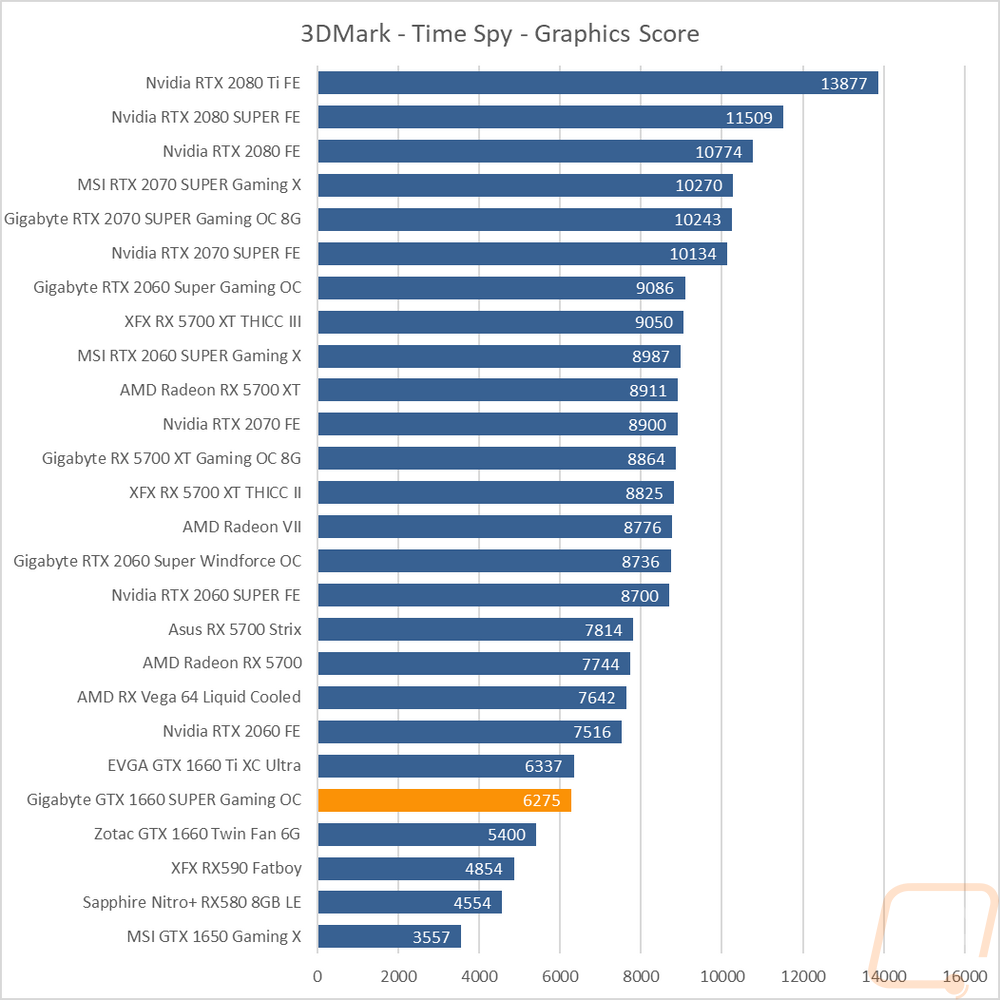
Sticking with 3DMark I then tested using the newer DX12 focused Time Spy test which has two detail settings. Here the 1660 Ti came out just slightly ahead and the RX590 dropped back in performance significantly. Nvidia’s Turing based cards like the 1660 SUPER have all performed better at DX12 tasks.
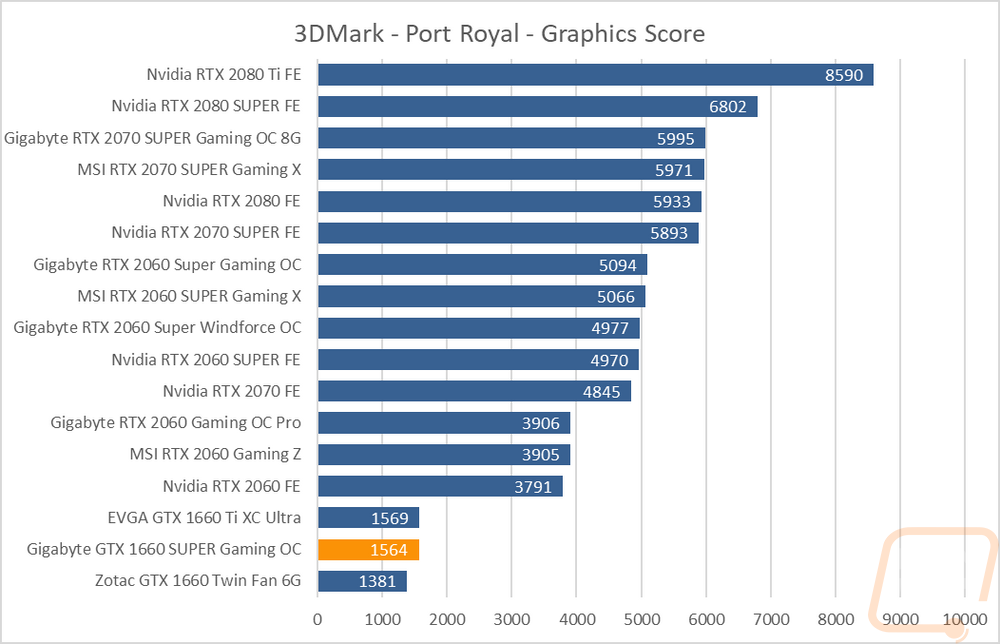
Next, I slipped in the Port Royal benchmark which takes a look at ray tracing performance now that Nvidia has extended that functionality out to some of their other models beyond the RTX lineup. No surprise though, without the RX cores that the RTX cards have the GTX 1660 SUPER didn’t handle it too well. It did however basically come in right with the 1660 Ti.
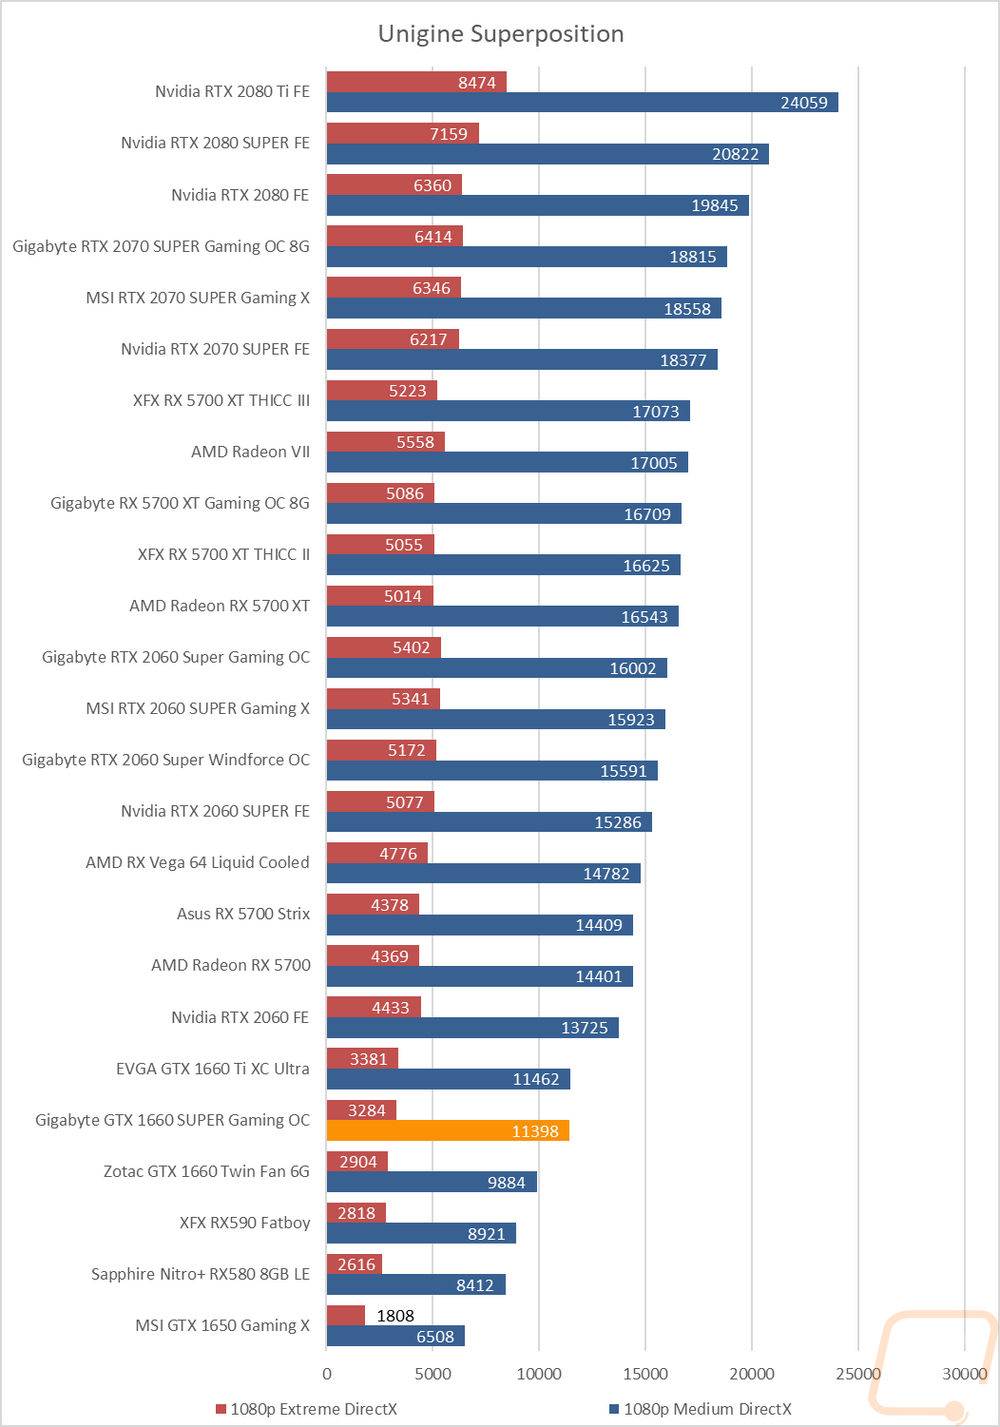
My last test was using Superposition which is built on the Unigine engine. Here I test twice at 1080p but once at medium detail and then again at an extreme detail. At the medium detail, the 1660 SUPER Gaming OC didn’t do bad, coming in just barely behind the 1660 Ti with the original 1660 being noticeably lower and the RX590 being even farther behind.