In-Game Benchmarks
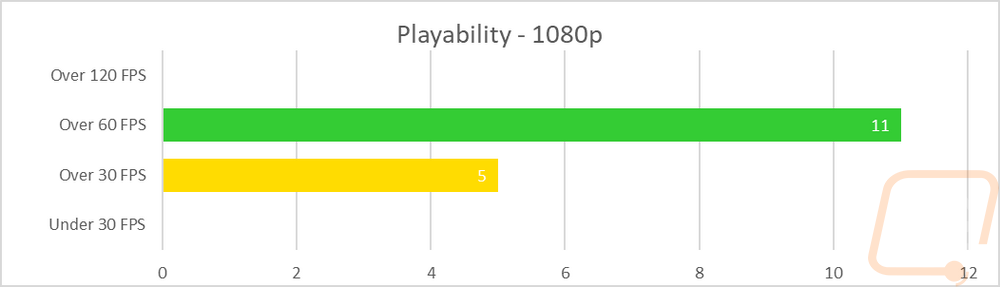
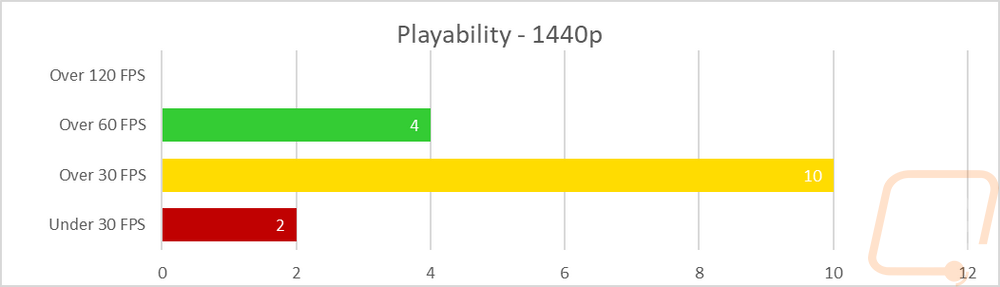
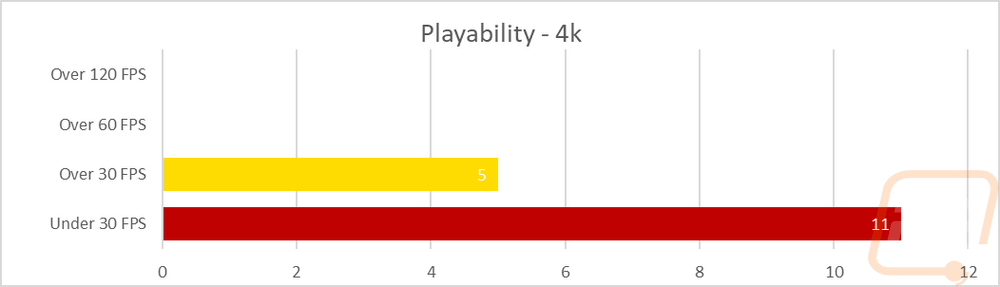
Now we finally get into the in game performance and that is the main reason people pick up a new video card. To test things out I ran through our new benchmark suite that tests 9 games at three different resolutions (1080p, 1440p, and 4k). Most of the games tested have been run at the highest detail setting and a mid-range detail setting to get a look at how turning things up hurts performance and to give an idea of if turning detail down from max will be beneficial for frame rates. In total, each video card is tested 48 times and that makes for a huge mess of results when you put them all together. To help with that I like to start off with these overall playability graphs that take all of the results and give an easier to read the result. I have one for each of the three resolutions and each is broken up into four FPS ranges. Under 30 FPS is considered unplayable, over 30 is playable but not ideal, over 60 is the sweet spot, and then over 120 FPS is for high refresh rate monitors.
So how did the PowerColor RX 5500 XT Red Dragon perform? Well like all of the cards in this same range, the 4k performance doesn’t leave anything to be desired with 11 tests coming in under 30 FPS and just 5 playable but not smooth but no surprises there at all. 1440p is better, just two results would be considered unplayable but only 4 I would call smooth, in other words, if needed you could play at 1440p but most games will need to be running medium or lower settings unless it is one of the lower demanding esport titles. Then at 1080p which is where AMD suggested the RX 5500 XT would be great is much better. 11 of the tests come in between 60 to 119 FPS which is great but there were still 5 that were in the playable but not smooth range. I just reviewed the GTX 1650 SUPER last week which is a little cheaper than the 8GB 5500 XT that I’m testing today and it has 7 over 60 and 7 in the 30-59 range showing that the 5500 XT is a big step up at that resolution.
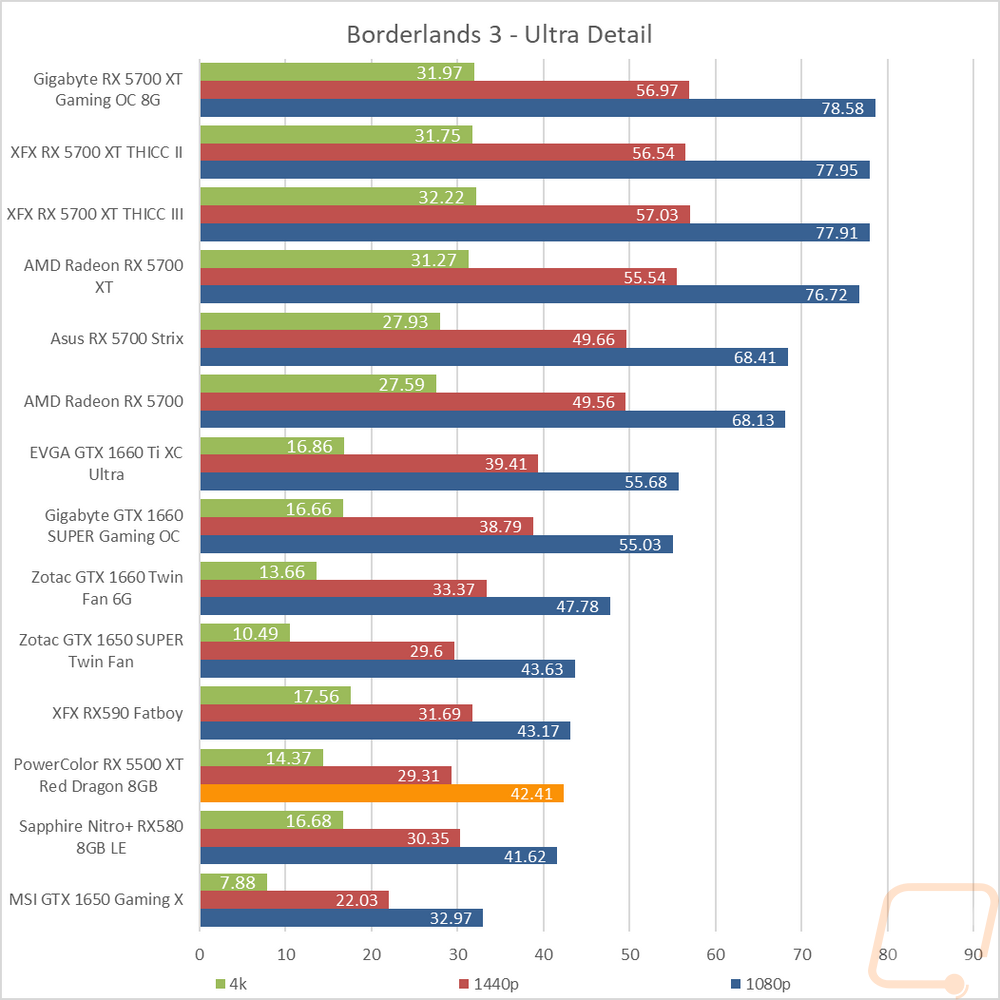
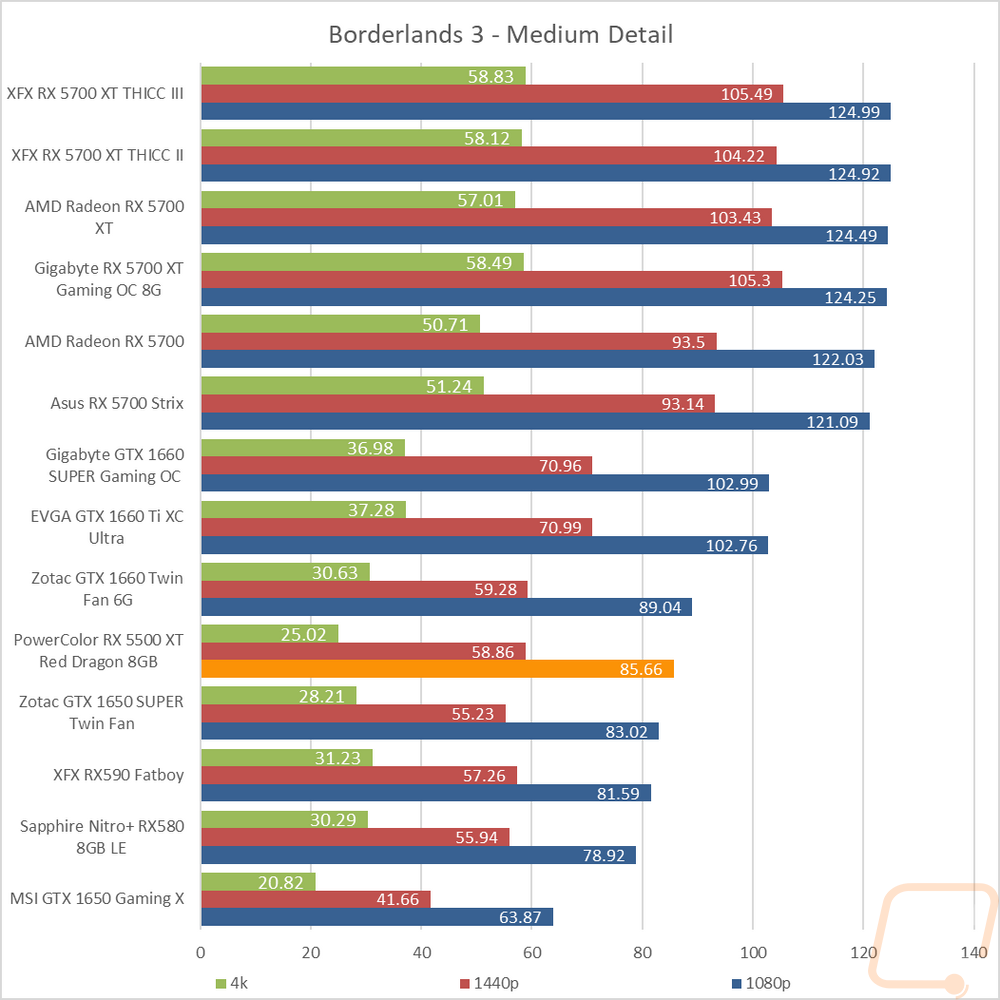
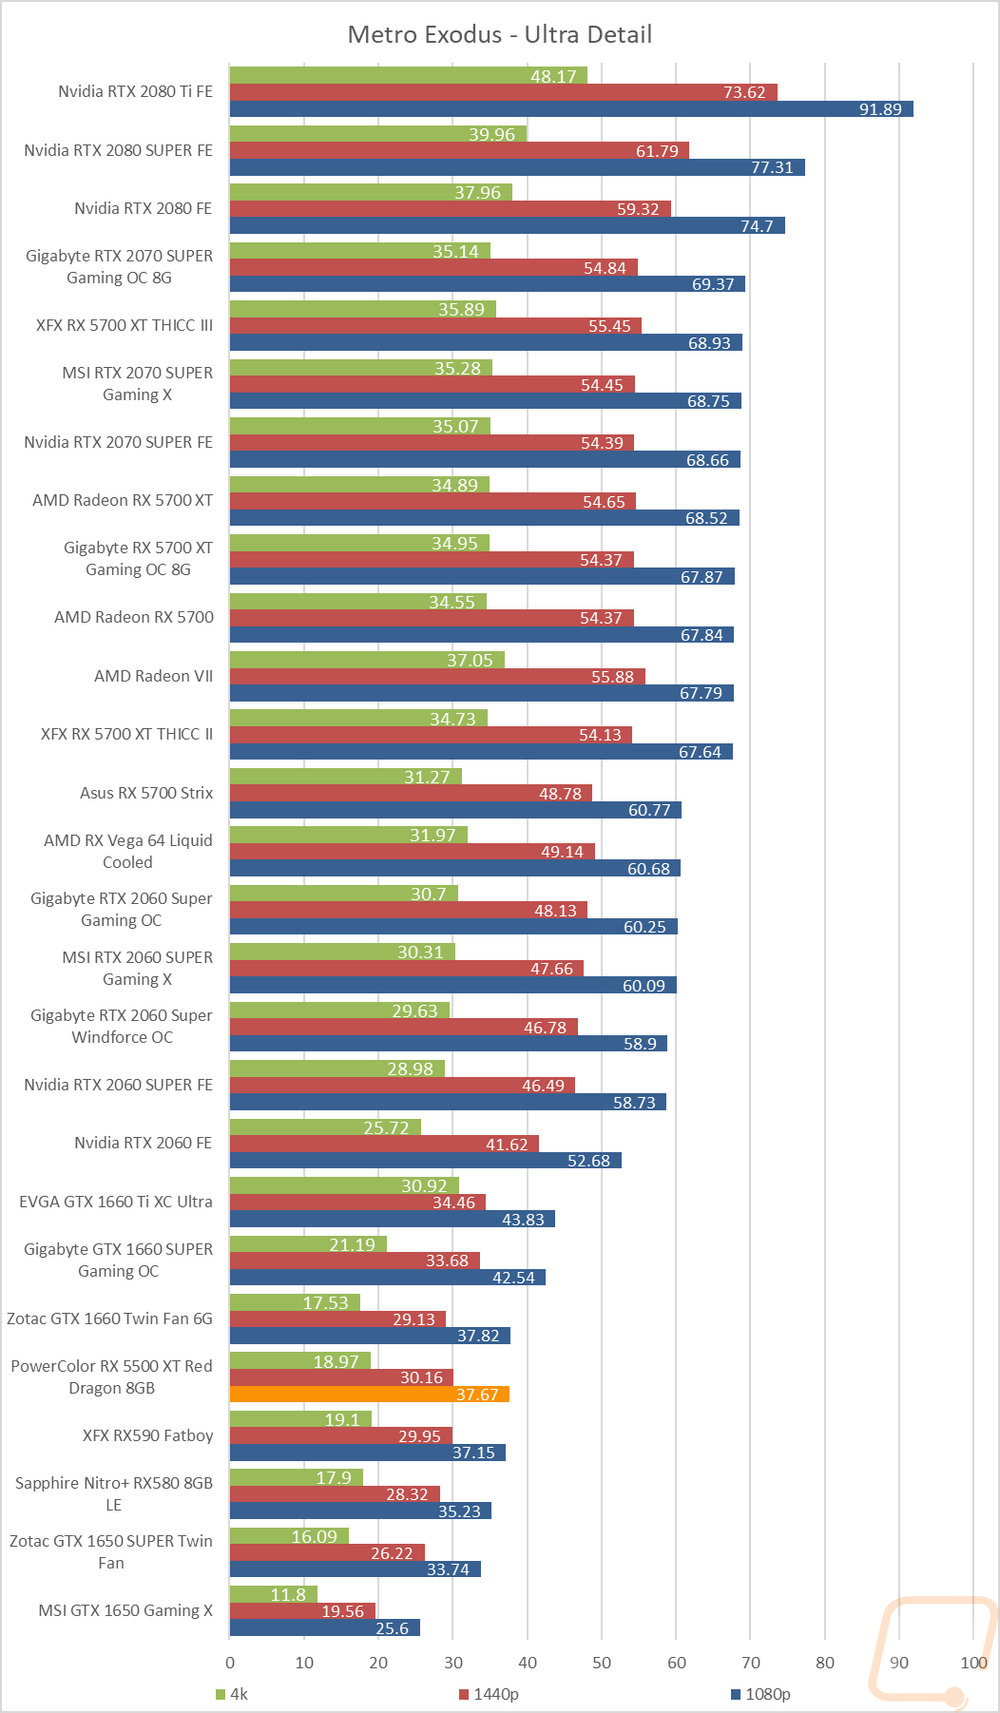
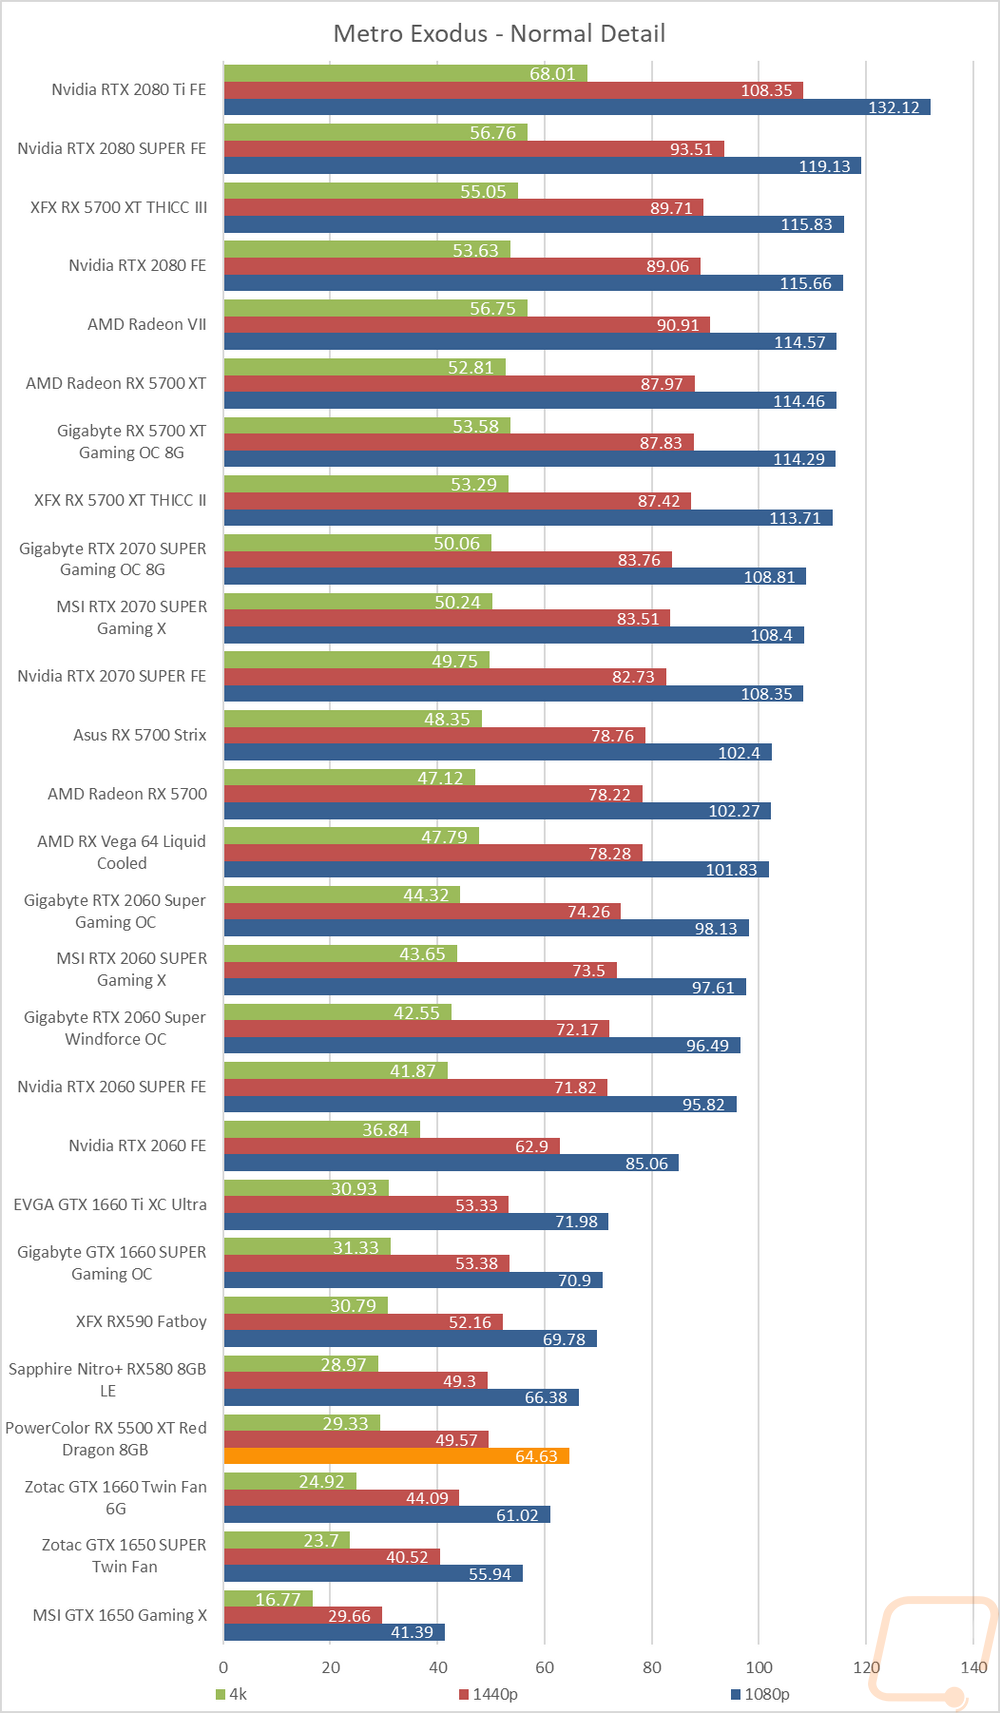
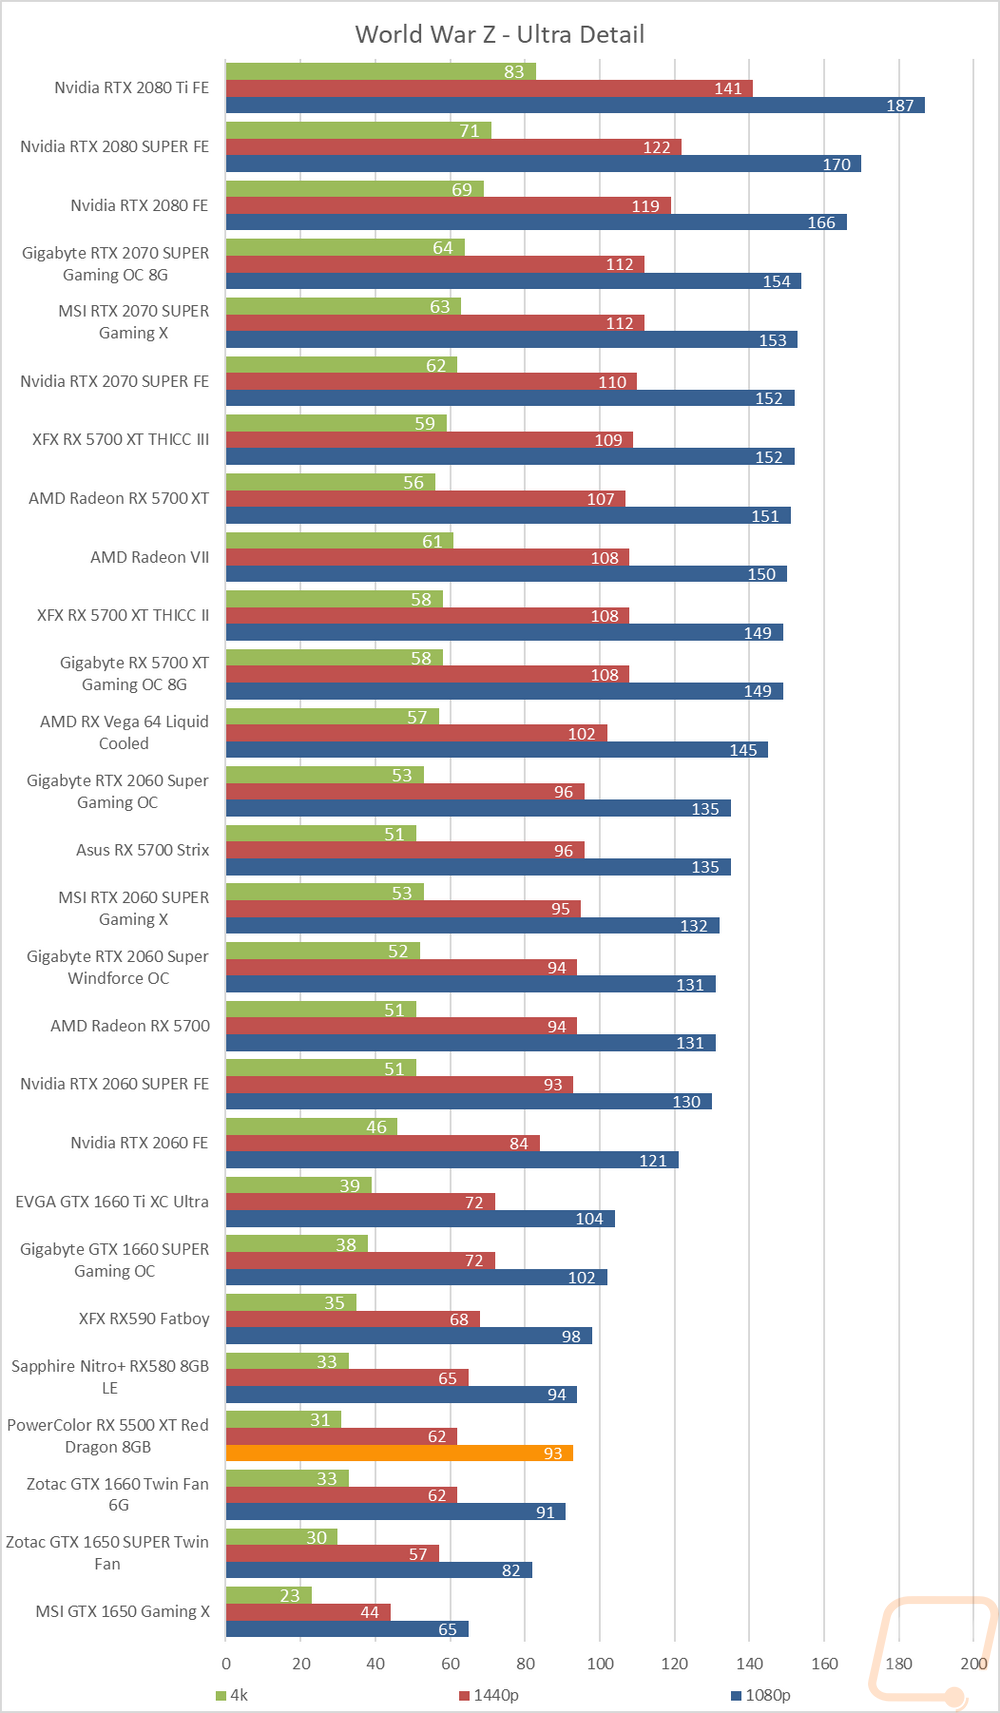
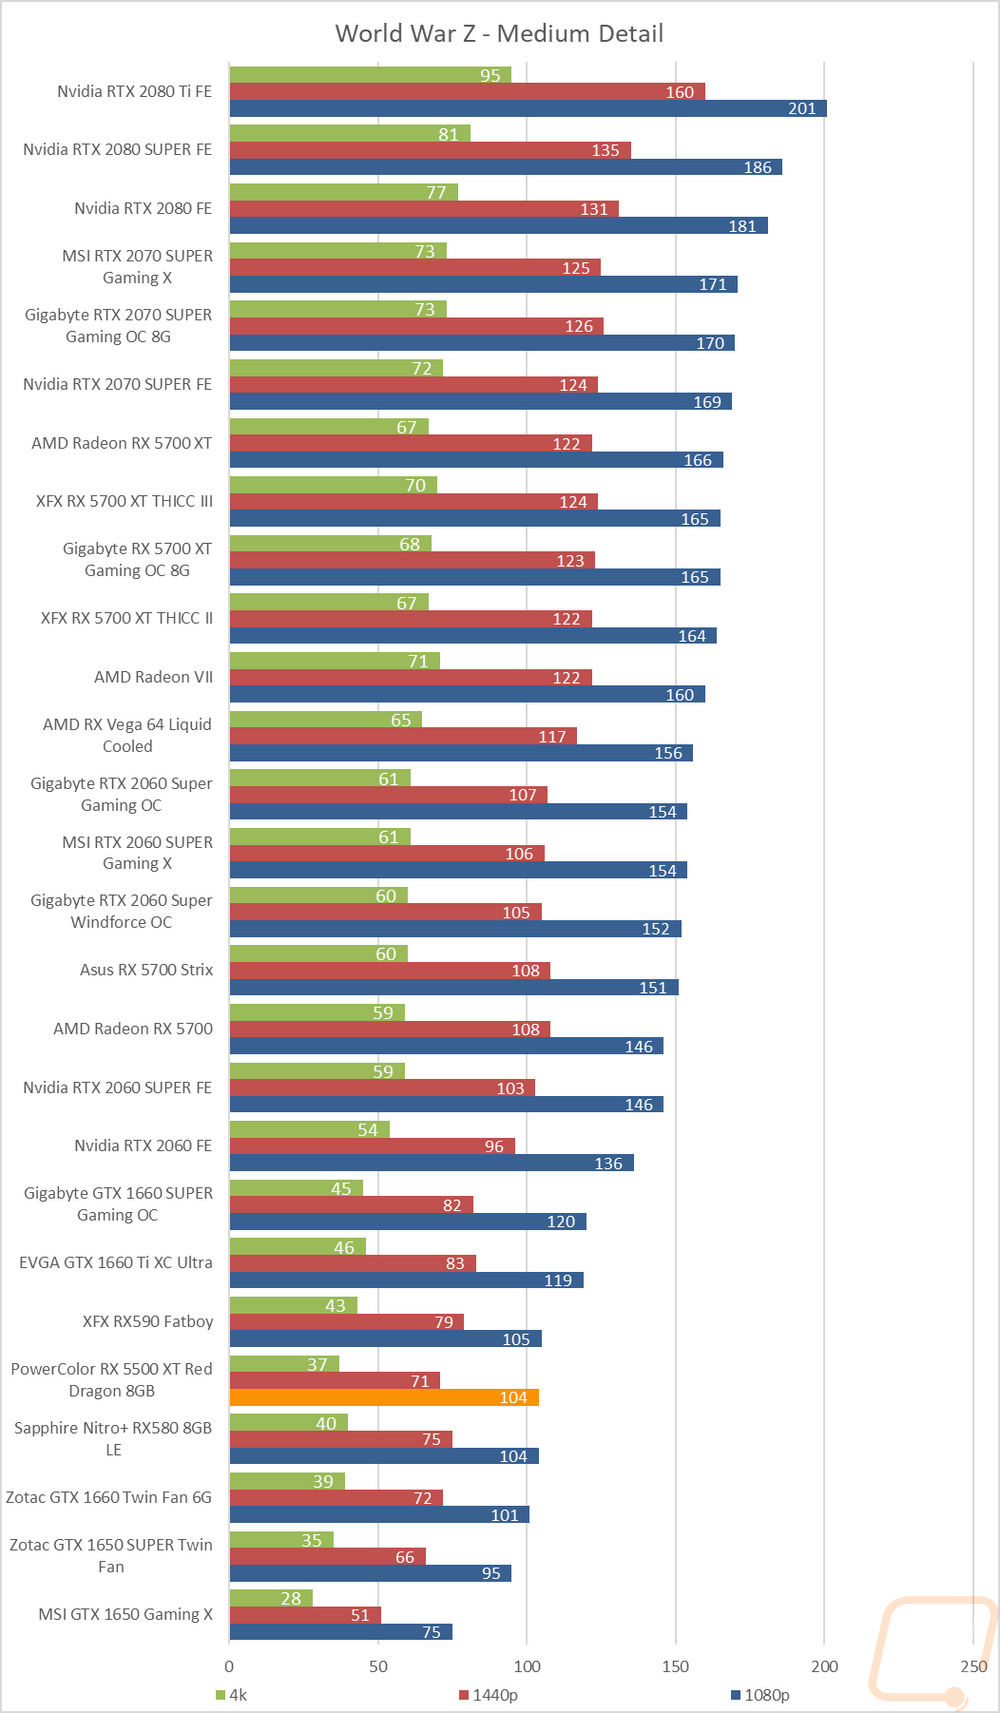
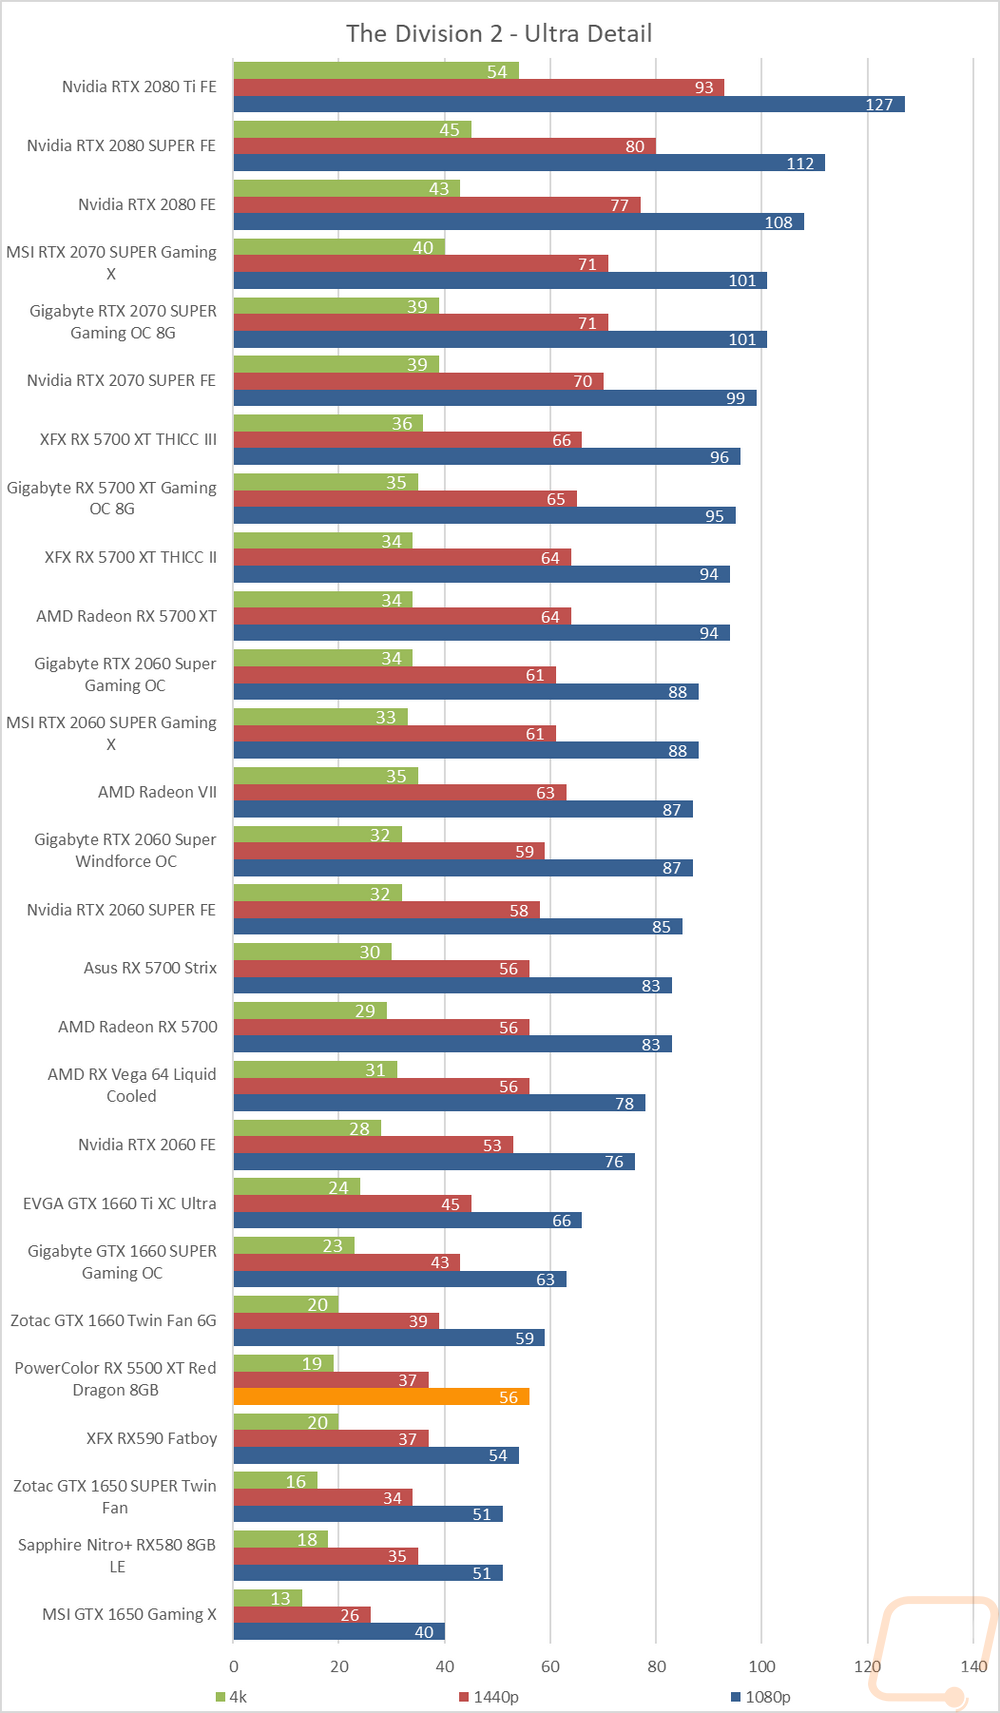
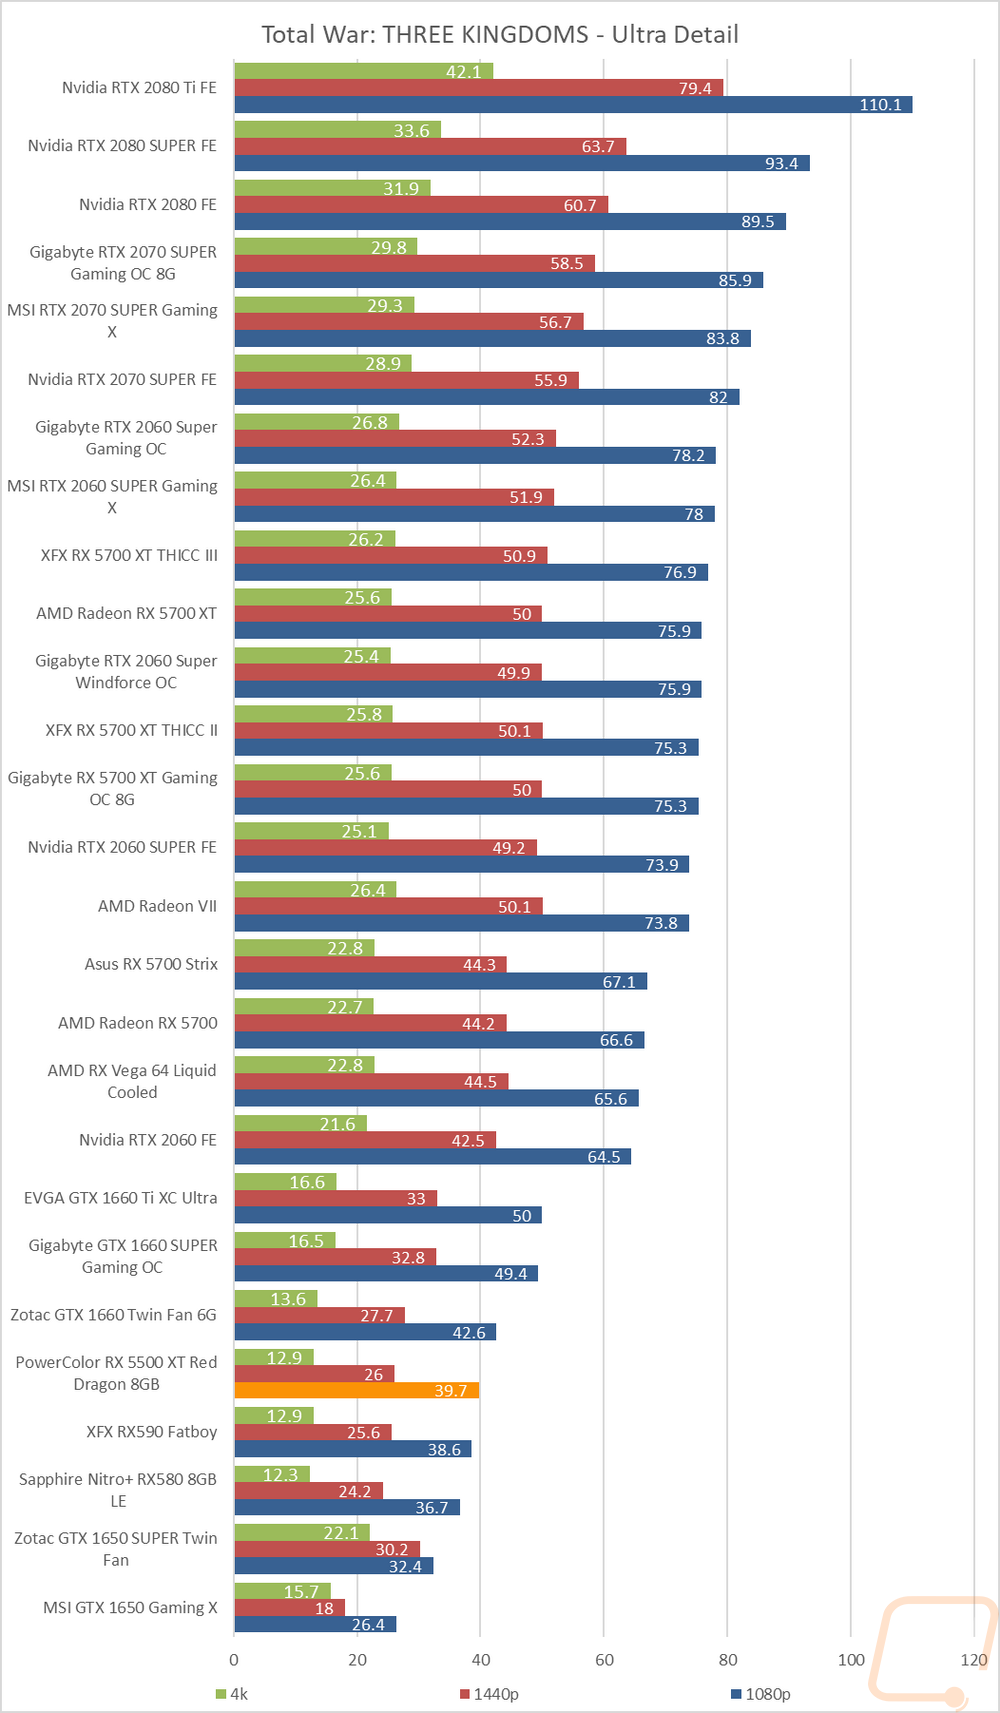
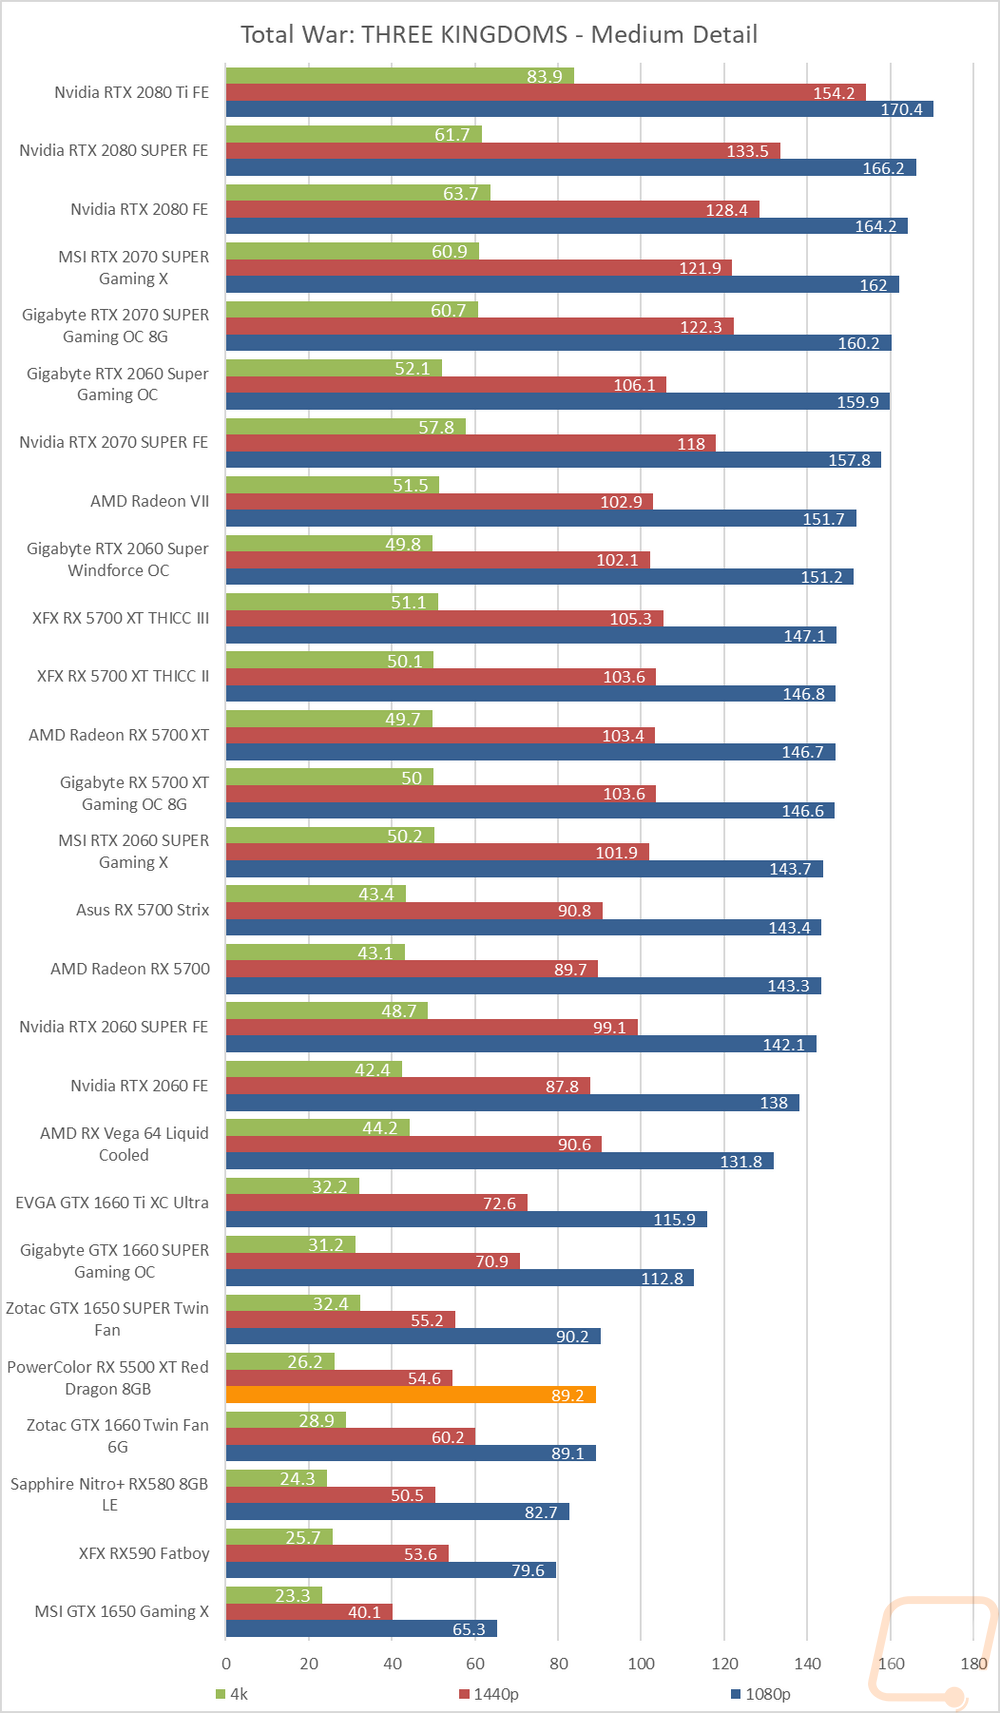
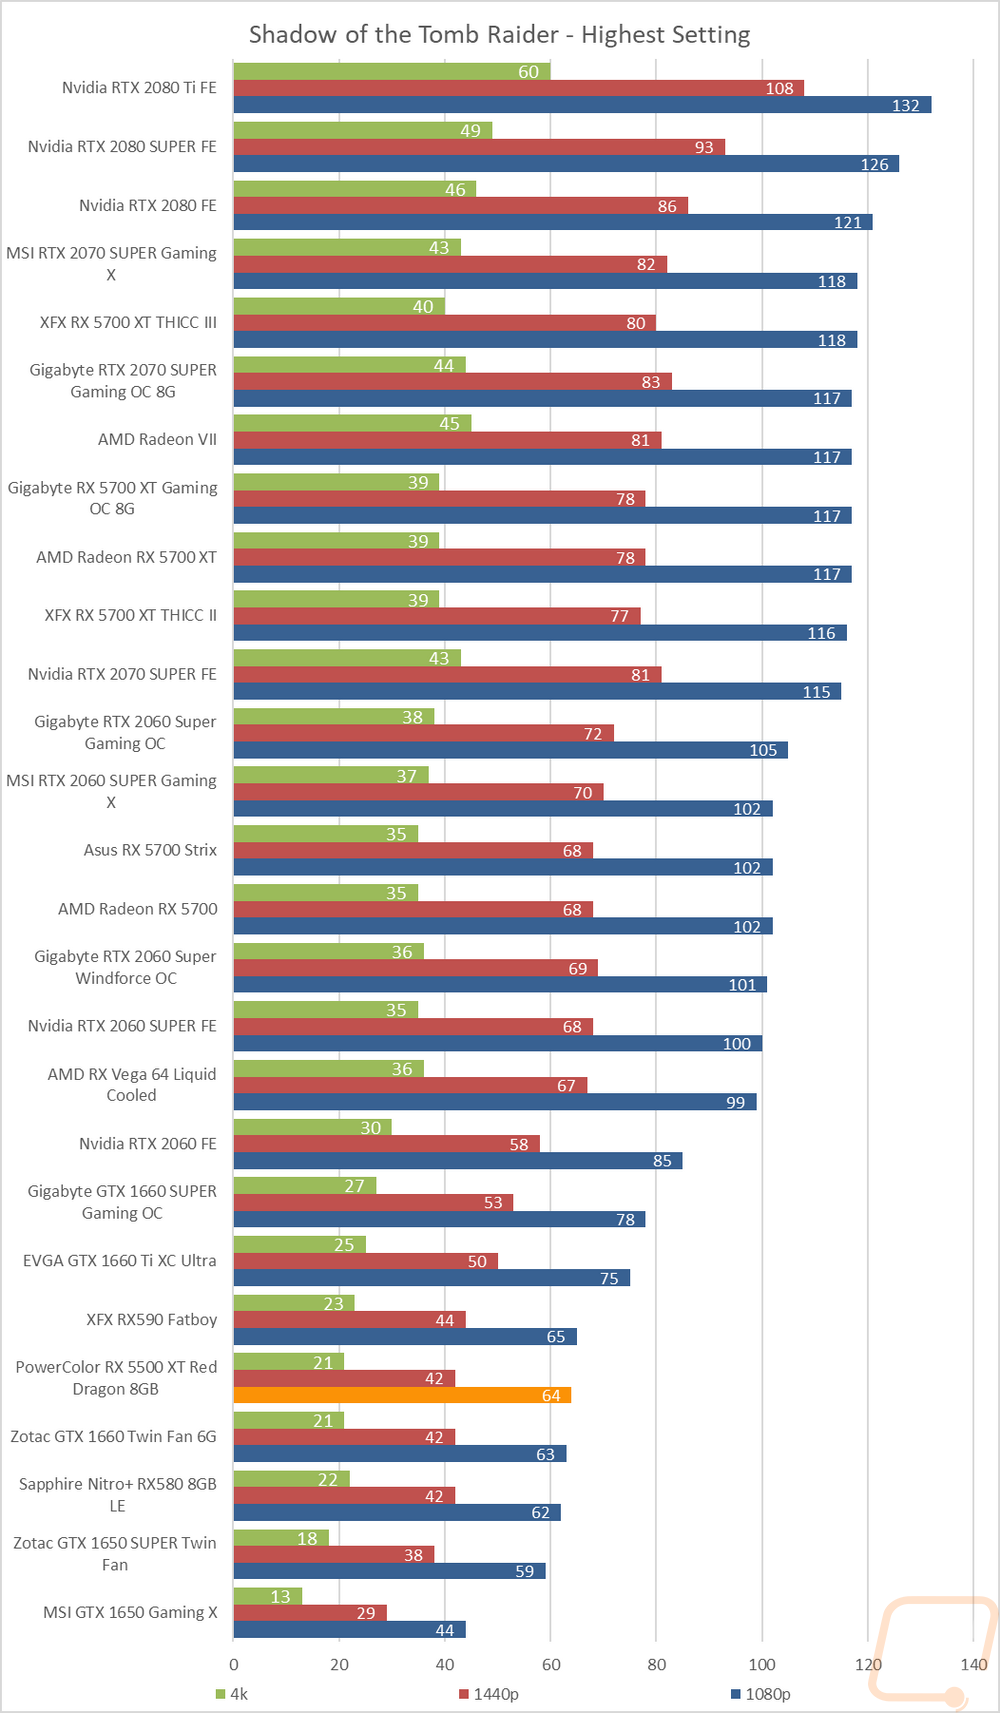
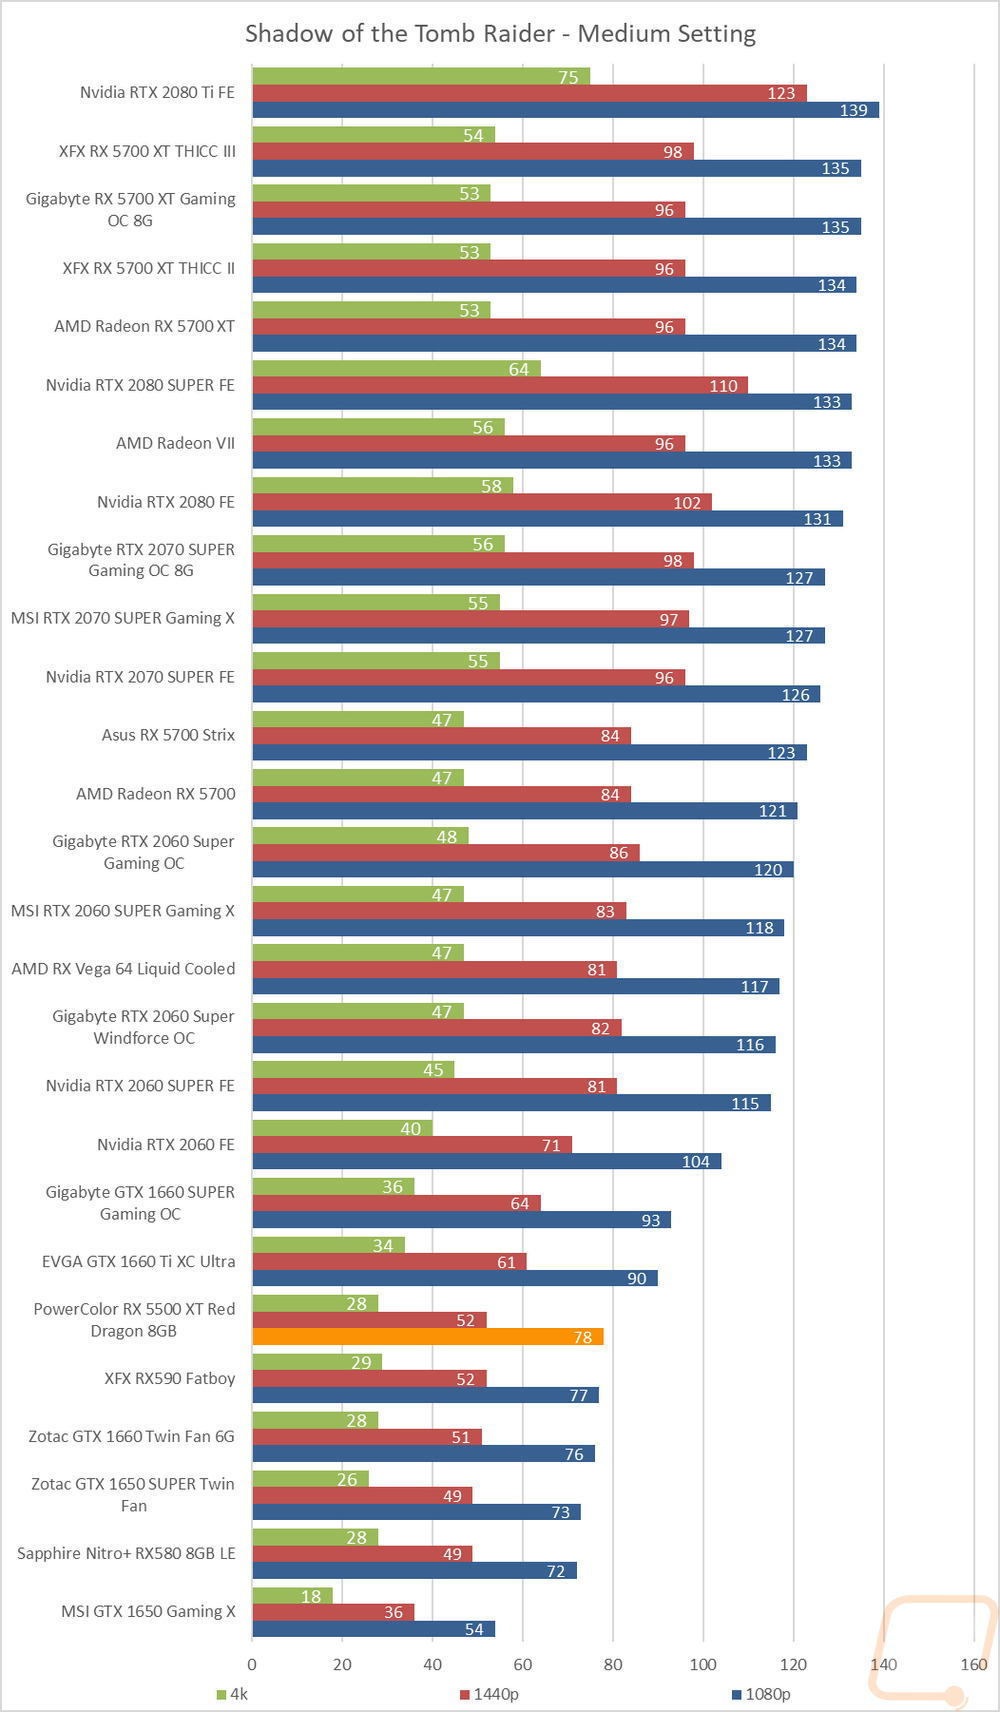
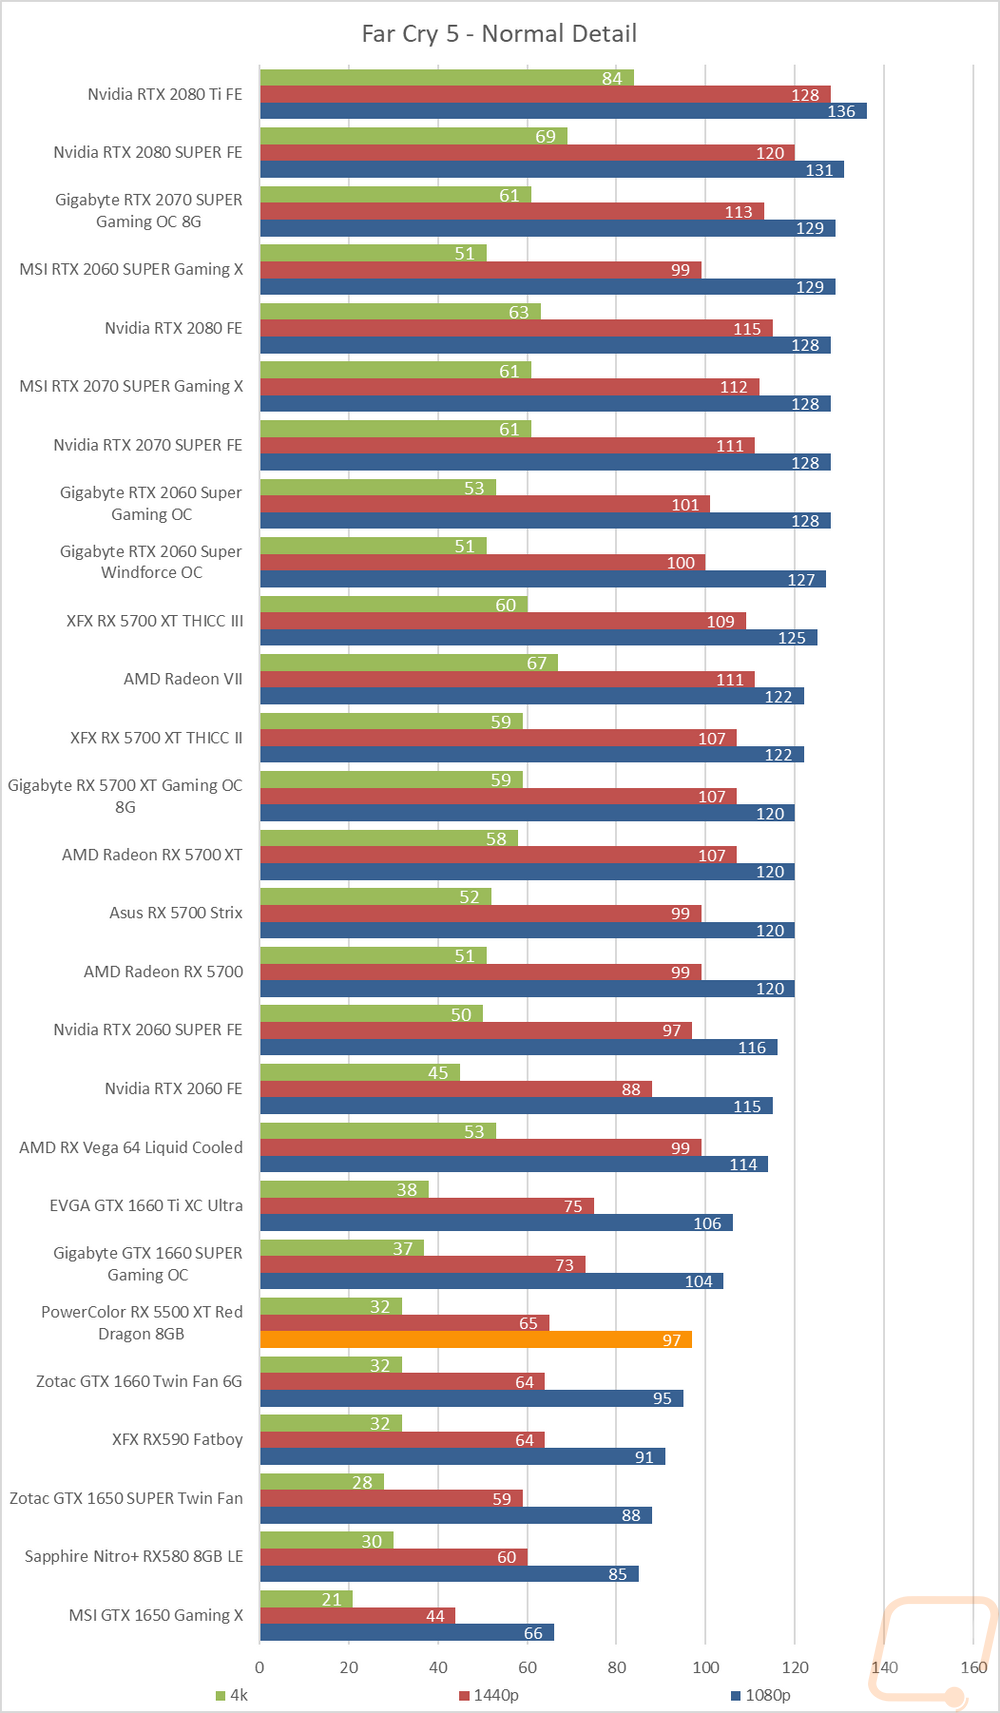
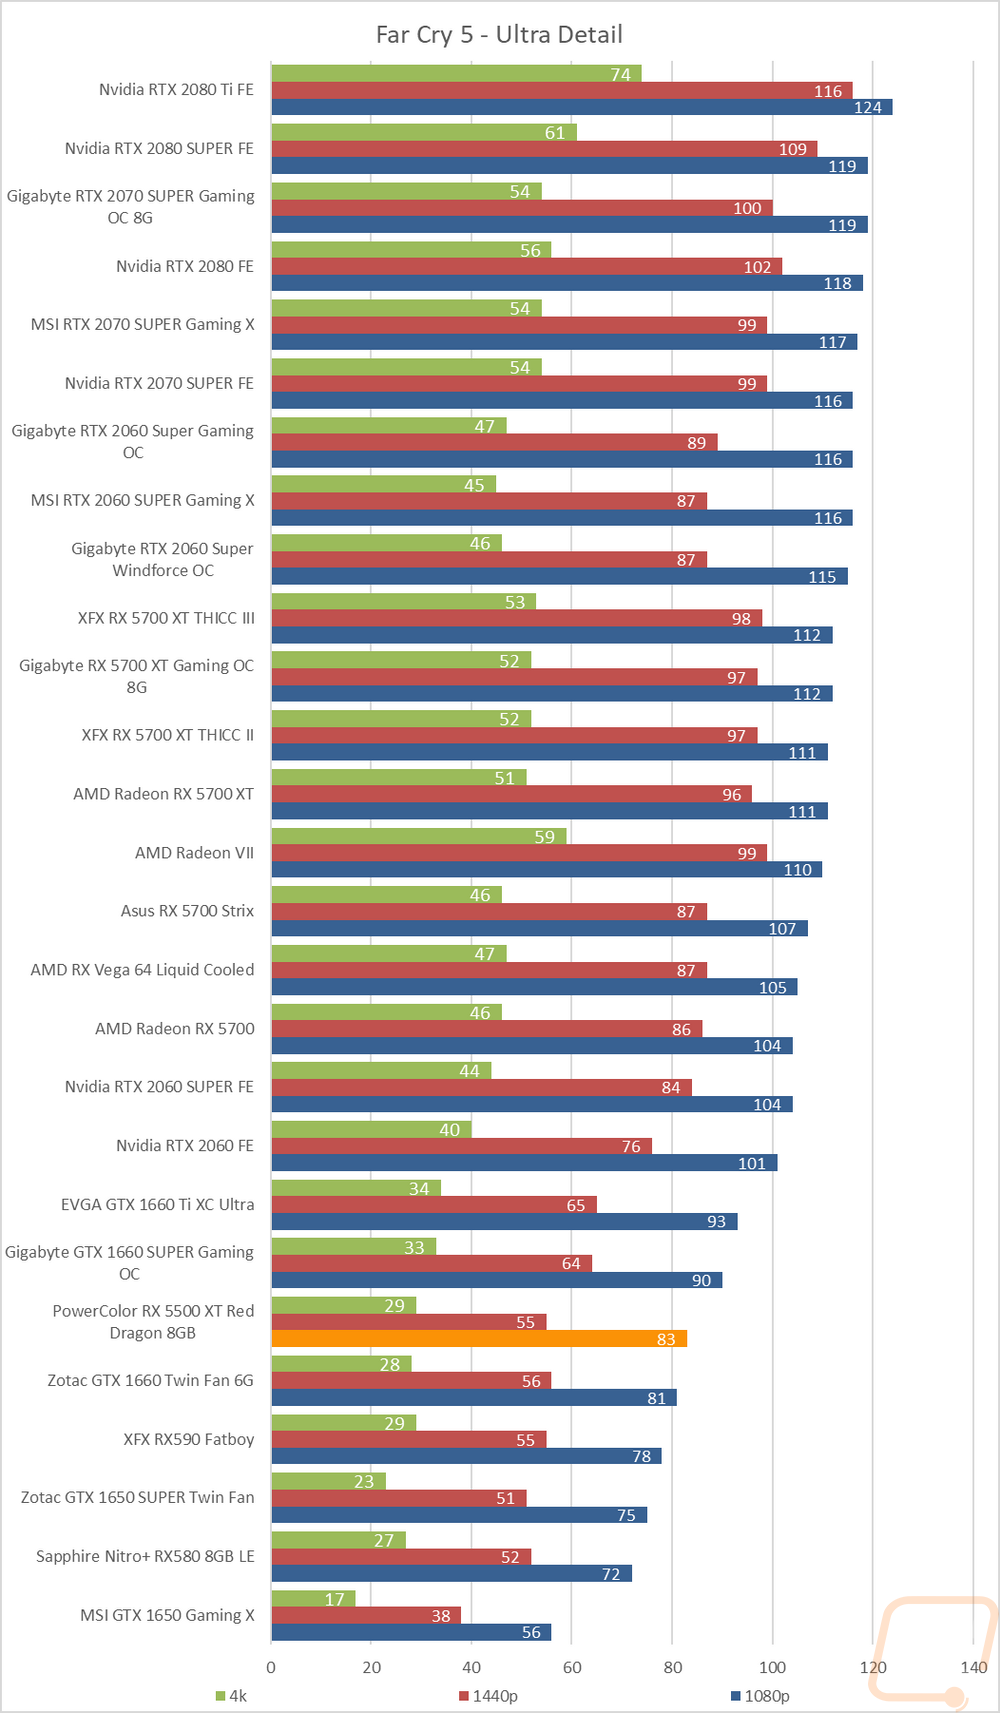
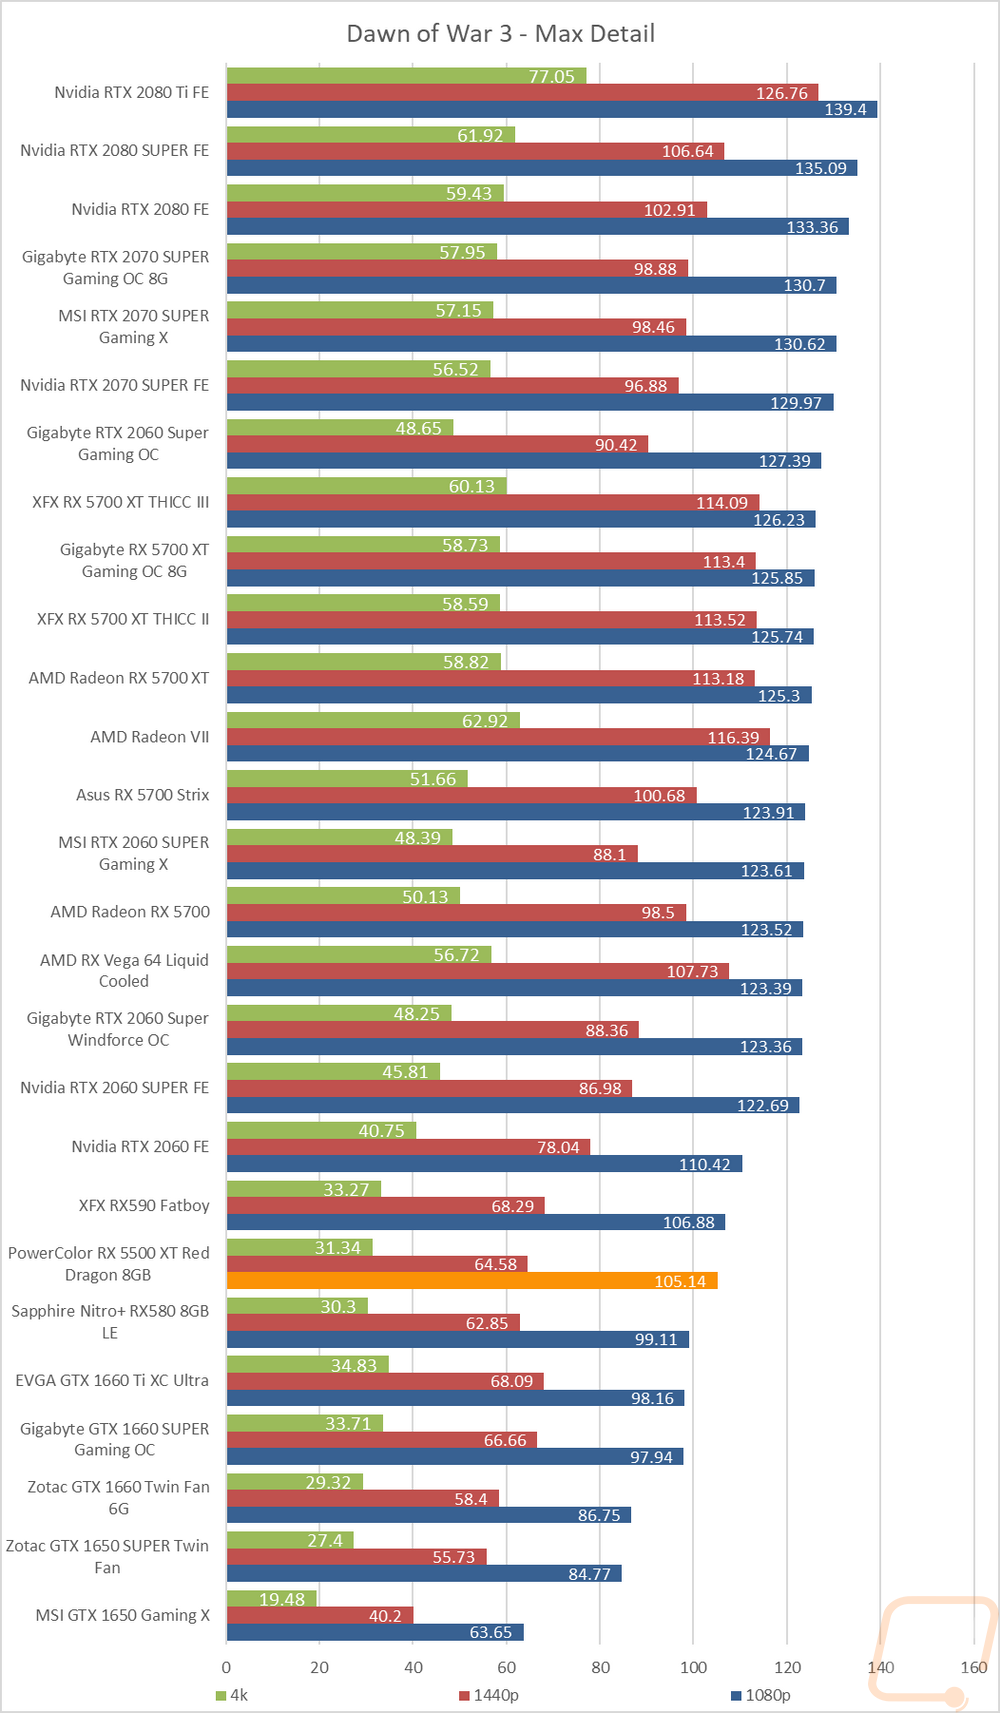
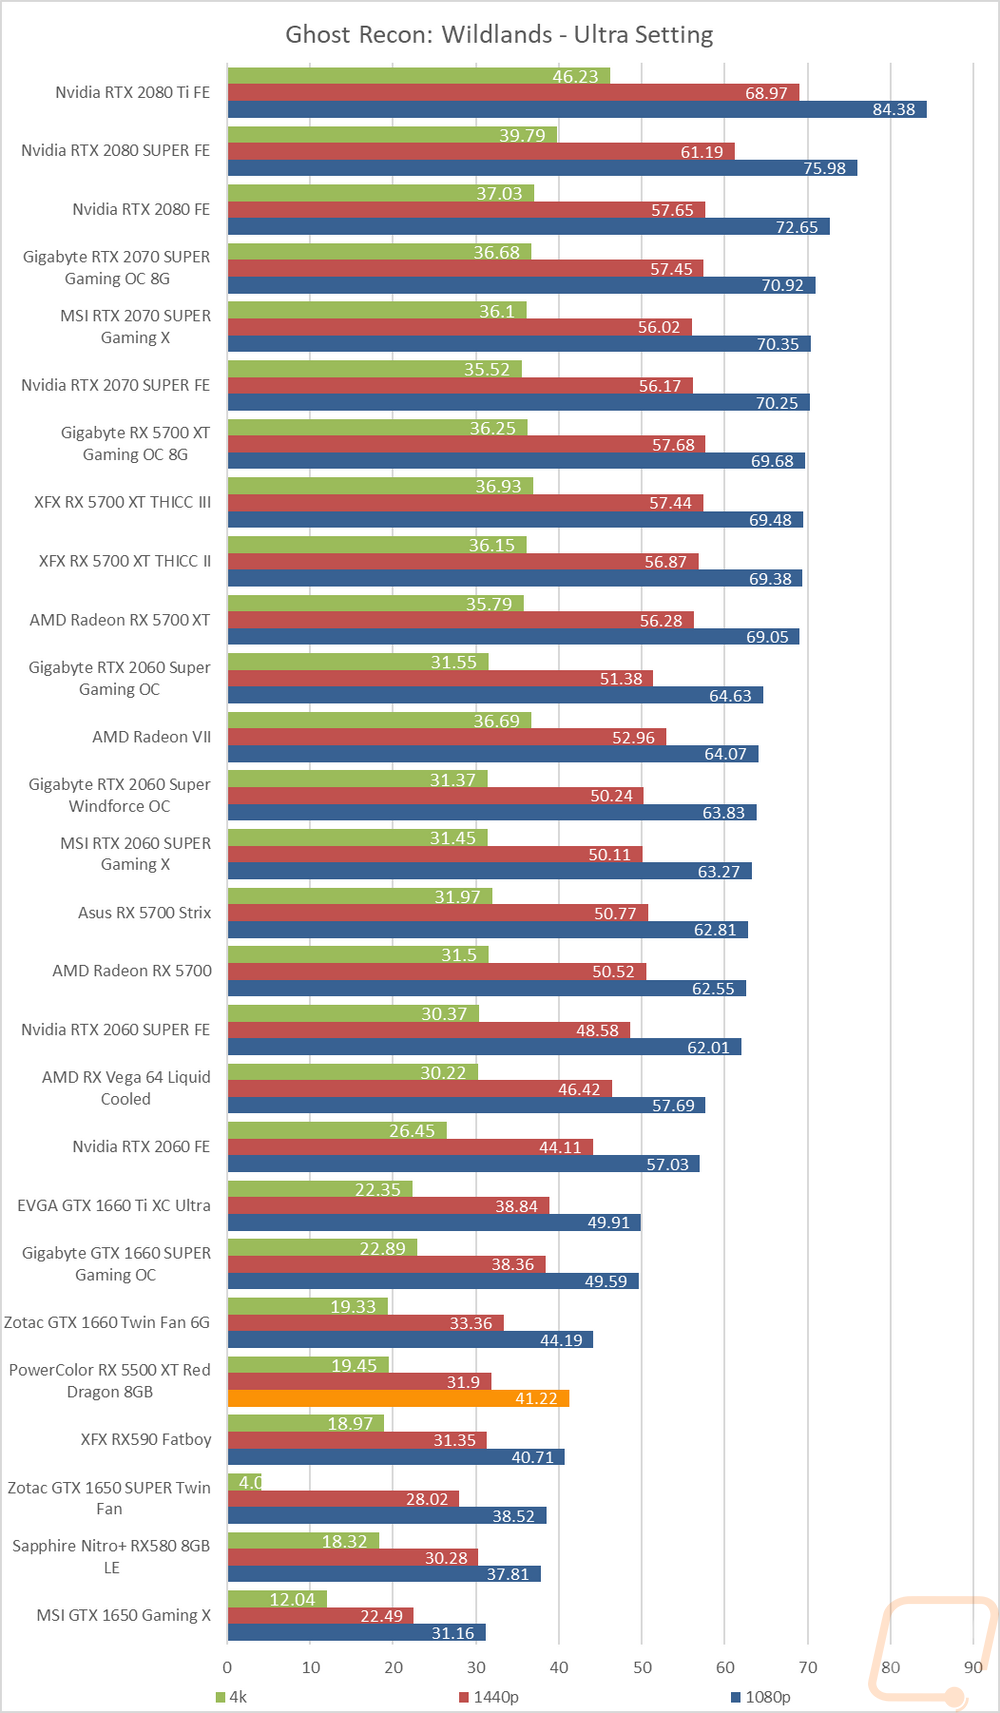
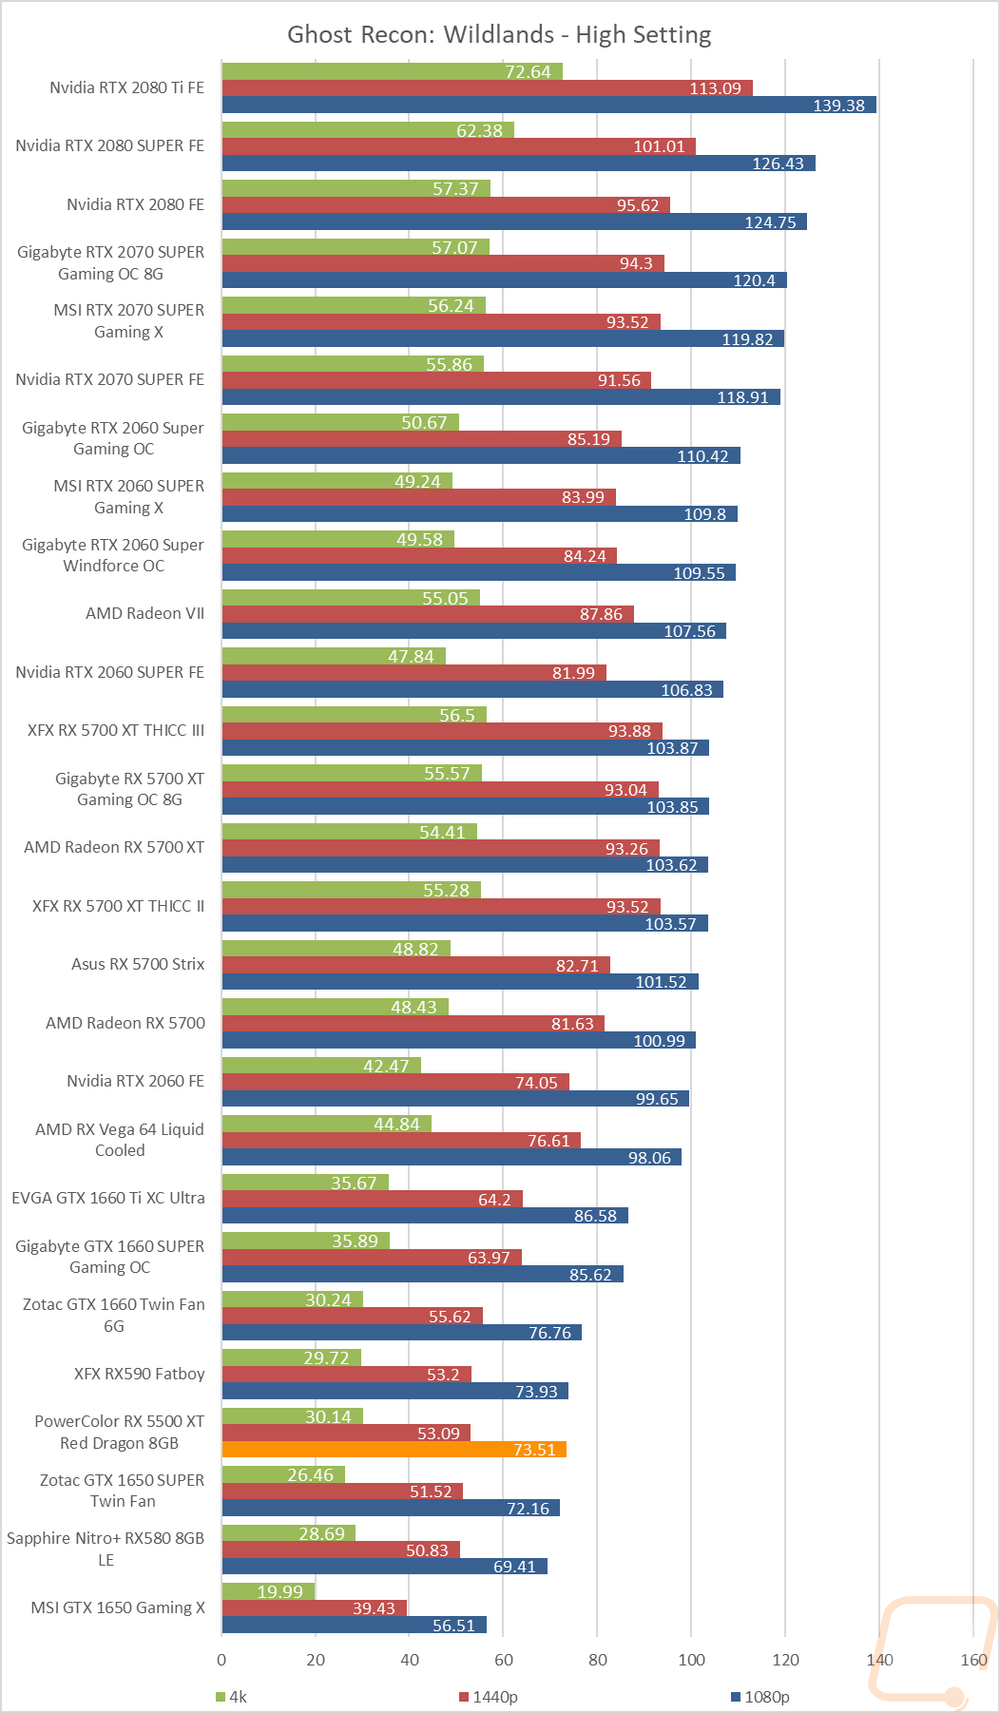
Don’t worry I look at the full results as well, there is just so much information that some people prefer the simple breakdown above. For the in game results, I have everything sorted by 1080p results because that is where you will most likely be using the RX 5500 XT Red Dragon. So like with the synthetic results, for the in game testing I was especially focused on how the RX 5500 XT compares with the GTX 1650 SUPER and GTX 1660 from Nvidia as well as the RX580 and RX590 from AMD for comparison with the older but still available GPUs. What I found is that the 5500 XT was faster than the GTX 1650 SUPER in all but 2 tests, but considering that the 5500 XT is a most expensive card that isn’t too big of a shocker. Comparing it with the RX590, on the other hand, had it ahead of the RX590 9 out of 16 results. Then with the GTX 1660, it was ahead in 9 out of 16 tests as well. That isn’t a huge lead, but I would consider the 5500 XT to be right in line with both the RX590 and the GTX 1660. The RX 5500 XT was surprisingly consistent in where it landed in all of the results so there weren’t many weird results but all of the AMD cards did perform really well at Dawn of War 3 where the 5500 XT even outperformed the GTX 1660 Ti. This was all with a stock clocked RX 5500 XT and most of the results it is compared with are overclocked cards so that does leave a little more room for improvement as well.