
Nvidia’s announcement of their new Ampere based RTX 3000 series of cards couldn’t have gone better for them. They ramped up the hype leading up to it for a month and even with countless leaks, they still managed to surprise everyone with both their performance estimates as well as the pricing. The combination almost instantly tanked the used card market as well, given estimates that put their RTX 3070 right with or above the RTX 2080 Ti which has been the top dog for gaming for two years now. Then you have the RTX 3080 and the RTX 3090 which show a big performance jump over the previous generation and for once pricing didn’t go way up. The RTX 3080 is coming out first and launches tomorrow, but before store availability, we get to take a look at the RTX 3080 Founders Edition and see why it is such a special card and put it through our test suite to see how it performs.
Product Name: Nvidia RTX 3080 Founders Edition
Review Sample Provided by: Nvidia
Written by: Wes Compton
Amazon Affiliate Link: HERE
Ampere
With Nvidia’s announcement, a LOT of information on Ampere has already been made available so there isn’t a huge need to deep dive things at this point. But for those of you who haven’t been paying attention I did want to do a short rundown on what Ampere is, a few of the software things Nvidia has announced, and where the RTX 3080 fits into the lineup as well as how it compares to past cards.
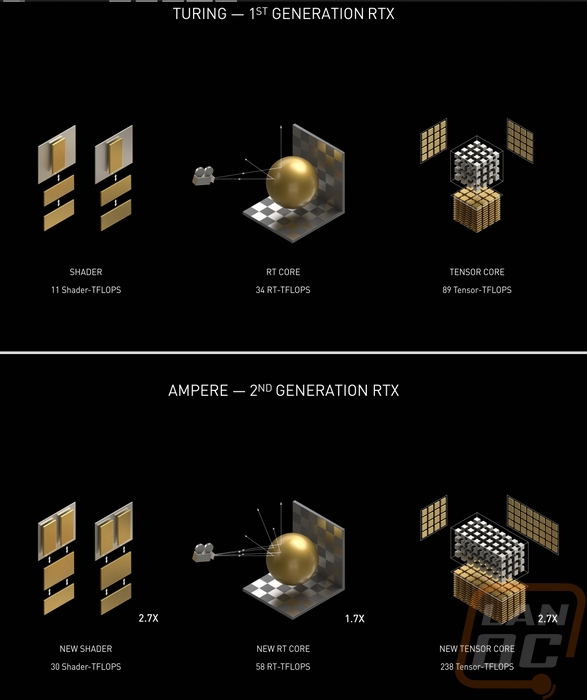
To start things off, Ampere is the name of Nvidia’s architecture used in the new 3000 series of cards and Ampere is the successor to Turing which was used in the 2000 series of cards. This isn’t just a die shrink, although it is built using a custom Samsung 8 nm process (for the GA102 at least) where Turing was built by TSMC at 12 nm. This is the second generation of RTX and the third generation of the Tensor core (it was used in Volta which didn’t have a gaming launch). With the new architecture, Nvidia has their new shaders getting 30 TFLOPS vs the first generation of RTX cards which were 11 shader TFLOPS. The ray-tracing core has similar increases by jumping up to 58 ray tracing TFLOPS vs 34 TFLOPS before. Then the tensor core which has even more of a performance jump, going from 89 TFLOPS to 238 TFLOPS.
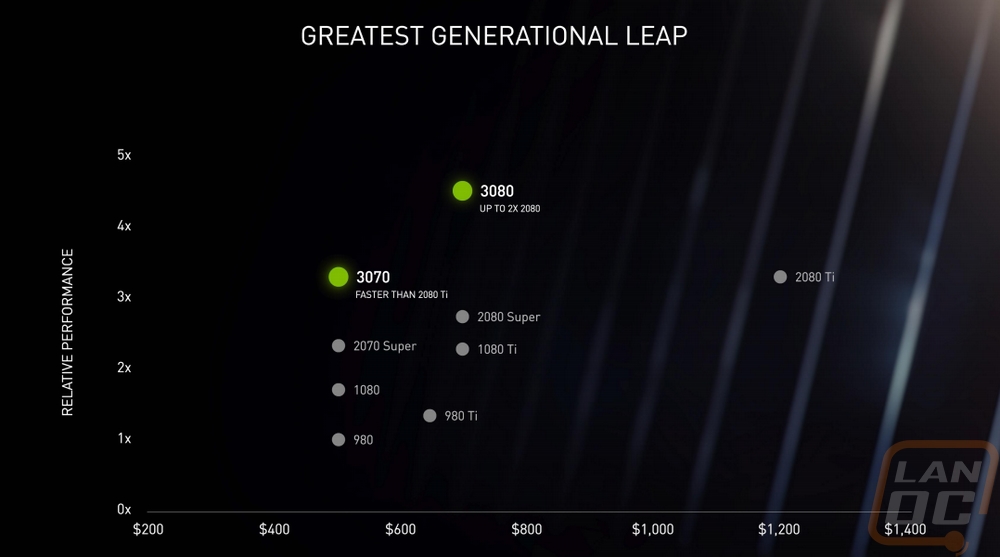
With these, Nvidia was excited to push just how big of a jump that the new cards are over the previous generations in both performance and pricing which in their presentation they used a nice price to performance graph to show using launch prices. The RTX 3080 that I will be looking at is priced right with the RTX 2080 SUPER and the GTX 1080 Ti but is significantly higher even anything from past generations including the RTX 2080 Ti.
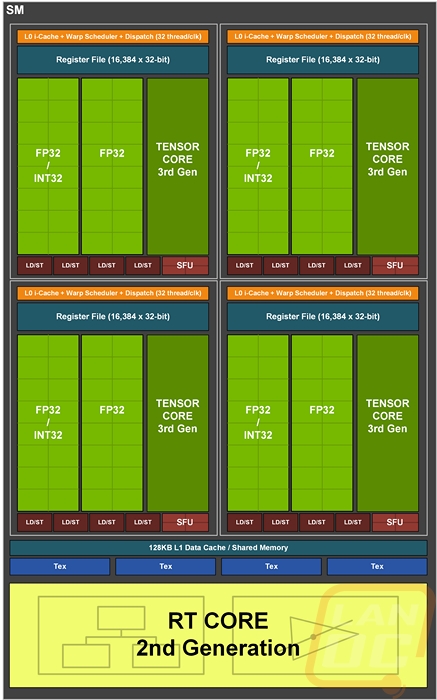
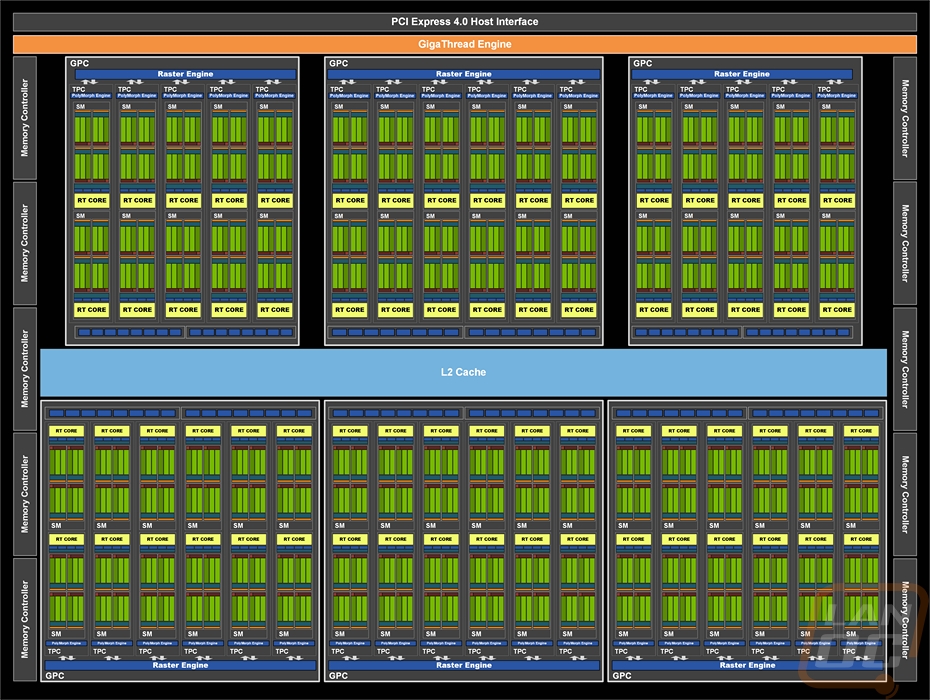
So the diagram below is a break down of a single Ampere SM which each of the new Ampere cards has multiple. You can see each SM has a new 2nd gen ray tracing core that takes up a lot of space on the die. Then everything else is split up into four partitions or processing blocks. These are broken up even farther now with one new 3rd gen Tensor core, one floating-point 32 datapath and one float point (FP32 or integer 32 datapath. This is a big change from Turing which had one data path for floating-point and then another for integers. Now floating point 32 can be handled at double the rate, which is what most 3D rendering uses. This is where they see that big jump in floating-point TFLOPS. A big improvement in ray tracing performance is seen now with each SM being able to process ray tracing and graphics/compute workloads to be able to work at the same time. The second picture is the full diagram of the RTX 3080 which has six GPCs that have 12 or 10 SMs inside.
So for specifications, I have included the RTX 3080 alongside of a few different Nvidia cards for comparison. I have the RTX 2080 Ti and the RTX 2080 SUPER from the last generation and I have also included the GTX 1080 Ti as well because I believe that a lot of die hard GTX 1080 Ti owners will be looking closely at the RTX 3080 to see how they compare. Running through them you can see that they all have the same GPC layout of 6 but the SM counts differ. The 2080 Ti is similar to the 3080 with its 68 SMs but just look at the jump in overall CUDA cores which has the RTX 3080 at 8704 which is double the RTX 2080 Ti. The number of tensor cores is down significantly from the RTX 2080 Ti and even the RTX 2080 SUPER so it will be interesting to see how the new improved tensor cores perform. Clock speeds for the RTX 3080 are higher than the 2080 TI with the boost clock running at 1710 MHz but the RTX 2080 SUPER was higher at 1815 MHz. The smaller manufacturing process has the overall transistor count WAY up as well with the RTX 3080 at 28.3 Billion with the RTX 2080 Ti at 18.6 Billion and 13.6 Billion for the RTX 2080 SUPER. But the overall die size is smaller than the RTX 2080 Ti.
On the memory side of things, the big change is the move from GDDR6 on the Turing cards to GDDR6X which uses less power and runs at a higher clock speed. Nvidia has the 3080 running at 19 Gbps compared to the 15.5 Gbps of the 2080 SUPER and 14 of the 2080 Ti. The 1080 Ti is looking especially slow with its GDDR5X running at 11 Gbps. The 320-bit memory interface is a little less than both of the Tis and more than the RTX 2080 SUPER. The memory capacity is also not a huge jump as well with the 2080Ti still having more as well as the 1080 Ti but 10GB is more than the 2080 SUPER had. Even without going up to a 352-bit memory interface the memory bandwidth with the faster memory Is up there at 760 GB/sec.
|
Specifications |
GeForce GTX 1080 Ti Founders Editon |
GeForce RTX 2080 Super Founders Edition |
GeForce RTX 2080 Ti Founders Edition |
GeForce RTX 3080 10 GB Founders Edition |
|
GPU Codename |
GP102 |
TU104 |
TU102 |
GA102 |
|
GPU Architecture |
Pascal |
Turing |
Turing |
Ampere |
|
GPCs |
6 |
6 |
6 |
6 |
|
TPCs |
28 |
24 |
36 |
34 |
|
SMs |
28 |
48 |
68 |
68 |
|
CUDA Cores / SM |
128 |
64 |
64 |
128 |
|
CUDA Cores / GPU |
3584 |
3072 |
4352 |
8704 |
|
Tensor Cores / SM |
N/A |
8 (2nd Gen) |
8 (2nd Gen) |
4 (3rd Gen) |
|
Tensor Cores / GPU |
N/A |
384 (2nd Gen) |
544 (2nd Gen) |
272 (3rd Gen) |
|
RT Cores |
N/A |
48 (1st Gen) |
68 (1st Gen) |
68 (2nd Gen) |
|
GPU Boost Clock (MHz) |
1582 |
1815 |
1545 |
1710 |
|
Frame Buffer Memory Size and Type |
11264 MB GDDR5X |
8192 MB GDDR6 |
11264 MB GDDR6 |
10240 MB GDDR6X |
|
Memory Interface |
352-bit |
256-bit |
352-bit |
320-bit |
|
Memory Clock (Data Rate) |
11 Gbps |
15.5 Gbps |
14 Gbps |
19 Gbps |
|
Memory Bandwidth |
484 GB/sec |
496 GB/sec |
616 GB/sec |
760 GB/sec |
|
ROPs |
88 |
64 |
88 |
96 |
|
Texture Units |
224 |
192 |
272 |
272 |
|
L2 Cache Size |
2816 KB |
4096 KB |
5632 KB |
5120 KB |
|
Register File Size |
7168 KB |
12288 KB |
17408 KB |
17408 KB |
|
TGP (Total Graphics Power) |
250W |
250 W |
260 W |
320W |
|
Transistor Count |
12 Billion |
13.6 Billion |
18.6 Billion |
28.3 Billion |
|
Die Size |
471mm2 |
545 mm2 |
754 mm² |
628.4 mm2 |
|
Manufacturing Process |
TSMC 16nm |
TSMC 12 nm FFN (FinFET NVIDIA) |
TSMC 12 nm FFN (FinFET NVIDIA) |
Samsung 8 nm 8N NVIDIA Custom Process |
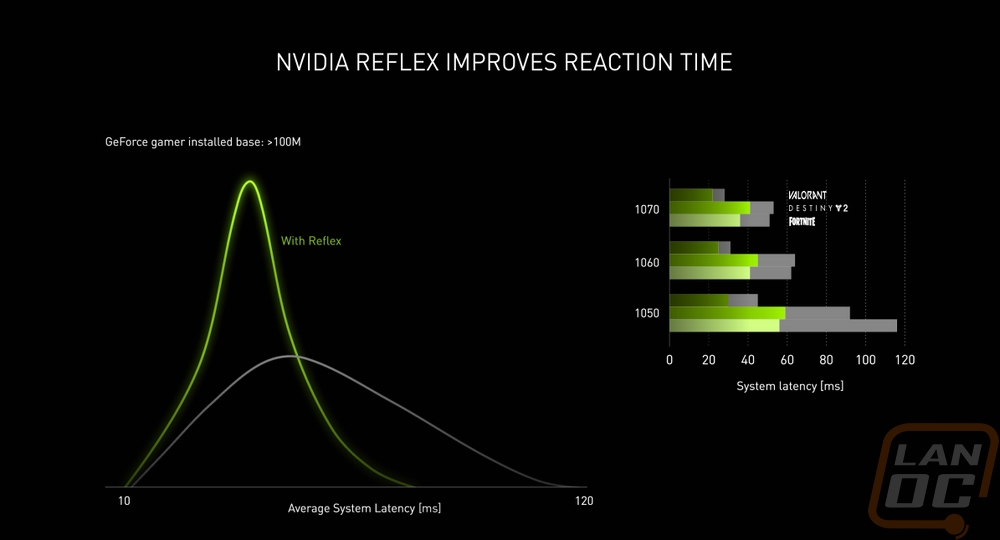
Beyond the architecture changes and the new cards that Nvidia announced. They also paired those up with a few software and driver level changes that they were excited to talk about. The first was what they call Nvidia Reflex which Nvidia isn’t the first to focus on. Basically, in esport titles especially latency is important. Which is part of the reason for the big push for high refresh rate monitors. Nvidia has combined their G-Sync technology along with high refresh rate monitors as well as a few other software tweaks to focus on cutting down latency in these titles. They showed off the amount of difference they see by comparing with the average system latency. They have opened up an API for games to be able to measure rendering latency and to lower the render queue. The end result is a big improvement in specific games where latency is more important than in others.
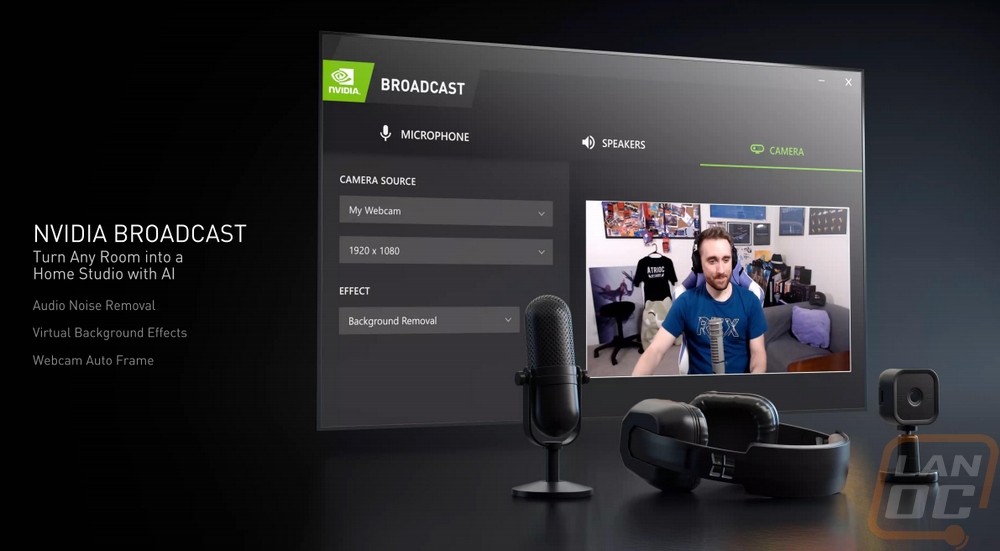
The next addition was Nvidia Broadcast and this is one that plays a role in my current setup. I have been using Nvidias RTX Voice to cut out background noise when using my desktop microphone and it does an amazing job, even though it does have a few big bugs. Well, Nvidia has expanded on that idea to tie in AI-powered broadcasting help all into one program. The microphone and speaker audio noise removal is still there. But they now also have added video support. A lot of streamers use software to cut out backgrounds but the idea here is to use the built-in Tensor cores in the RTX video cards to take the load off your CPU. In addition, because it is AI they can do more detailed predictive effects. It can also be used to auto frame you as well for when you move around. Nvidia is trying to help streamers and now with COVID is also can help with people working or learning from home.
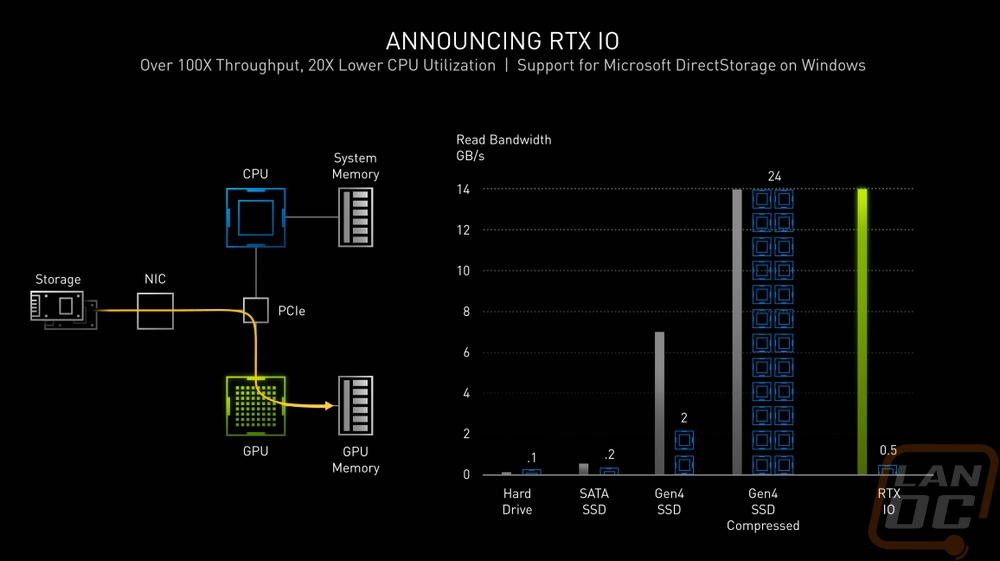
RTX IO is one of those announcements that real geeks were foaming at the mouth for, but the average gamer or user isn’t going to know what is so exciting about it. Ironically this is similar to one of the big features for the upcoming PS5. RTX IO is basically leveraging the power of your GPU to help speed up file transfers and loading. This again cuts more work away from your CPU and it also allows for a more direct path for data to go right into the GPU memory rather than through the CPU then back out to the GPU. Maps can load faster and they are using a lossless decompression that can also lower game sizes in general. Right now RTX IO is capable of decompressing even faster than the limits of Gen4 SSDs. This isn’t coming just yet, Microsoft will be bringing DirectStorage out next year and at that time RTX IO will be available.
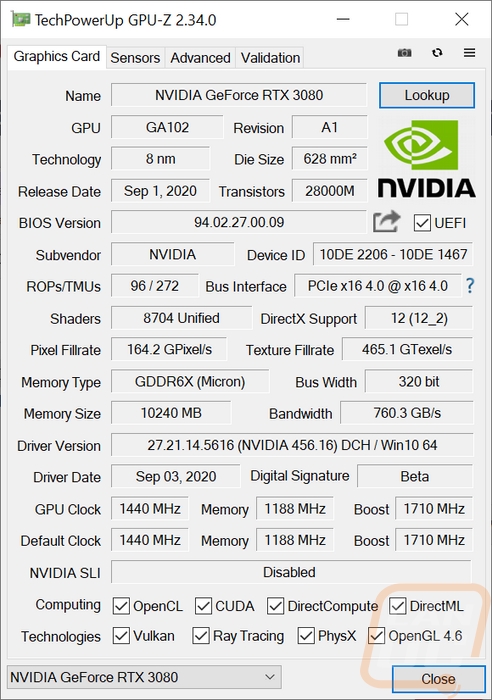
Lastly, before diving into the RTX 3080 itself I wanted to include a copy of our GPUz which shows which firmware that we are running at and confirms that nothing weird was going on for card spec. This is especially important when it comes to pre-launch samples like this. You can also see which driver I tested on, which was the pre-launch press driver.
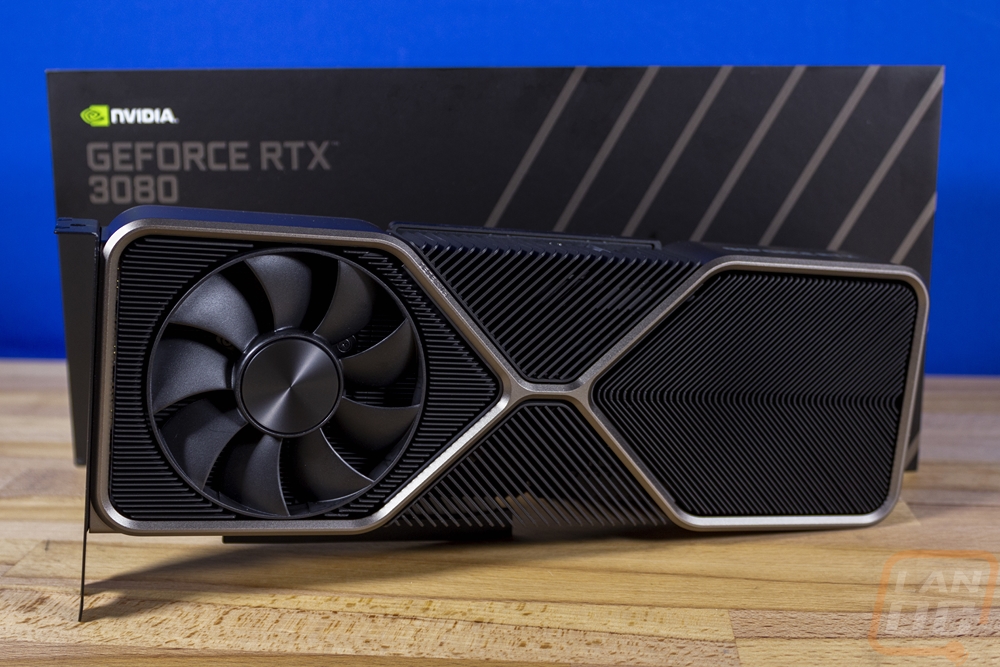
Packaging
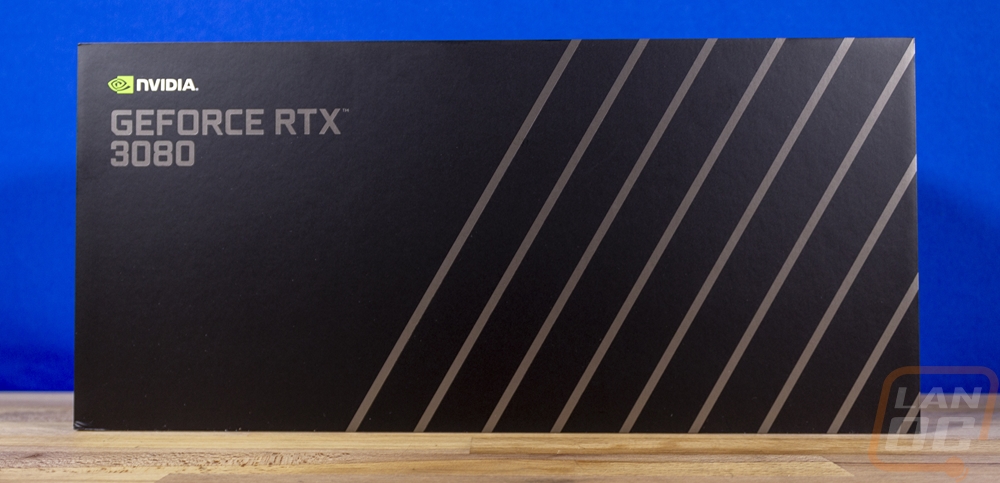
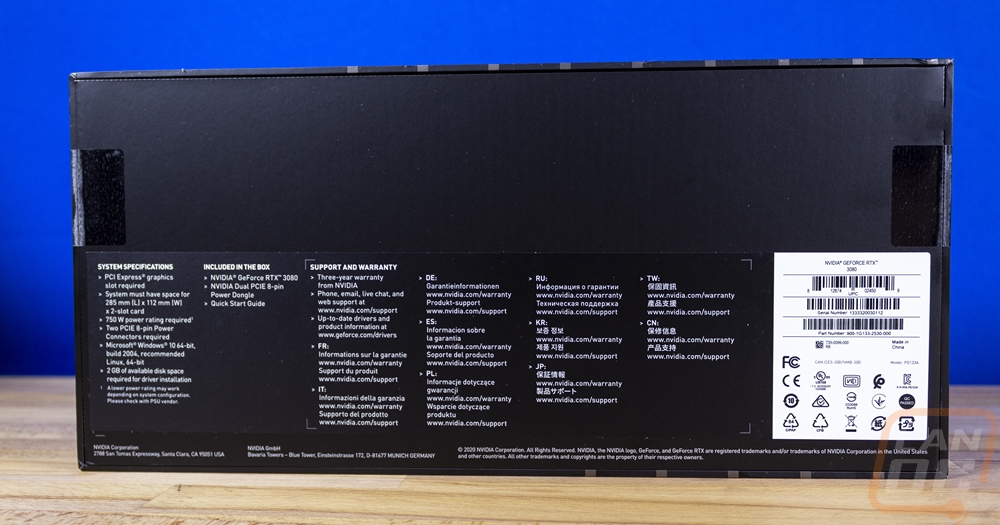
On first glance, the box for Nvidia s Founders Edition RTX 3080 looks basically like all of their past cards, only with new outside artwork like they did with the 2000 series. But as you will see in a minute the box design is completely different as far as how it opens up. As for the art, they kept things very simple with a small Nvidia logo and then the GeForce RTX 3080 in the top left corner. Then the rest of the front just has silver stripes on it. They didn’t even include a green wrap-around with the model info on it like normal. Then around on the back, you have a white sticker with the bar codes for the UPC and even serial numbers. There is a basic specification listing that mostly just covers how much space you need to use the card, the power needed, and what version of windows. They also list out what you will find inside. The rest is just the 3-year warranty and support info being repeated across 11 different languages.
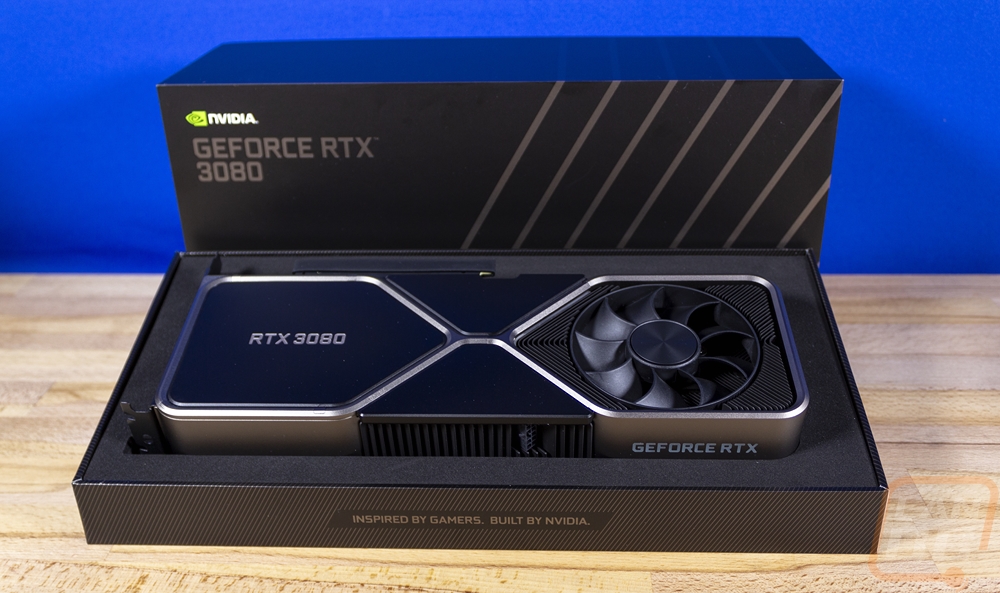
So past boxes have the top of the box slide up and off but this time around you have to lay it down flat then pull the top off. Inside they have the same foam tray that holds everything in place and keeps it safe as well as foam in the lid as well. But it's not sitting vertically like normal. They have the card laying flat, in fact, if you look you can see the PCI bracket is flipped, this is the video of the top of the card when it is installed in a traditional case. There is a note, which was on past boxes as well, “Inspired by Gamers, Built by Nvidia”. I love that there isn’t a static protective bag and when you open things up you get that wow factor being able to see the card. The box is also extremely thick, along with the padding which I think is a lot more protective than some of the aftermarket cards.
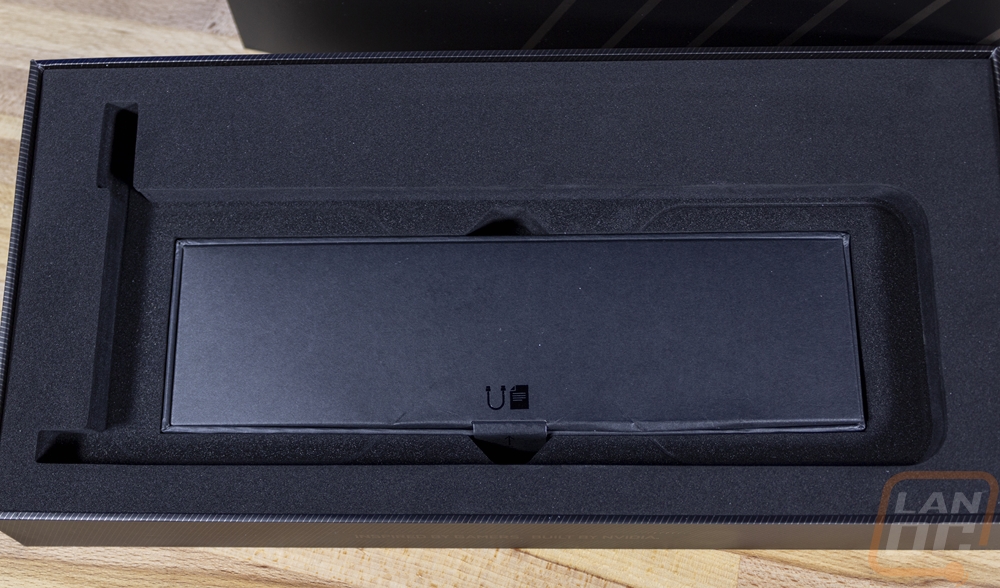
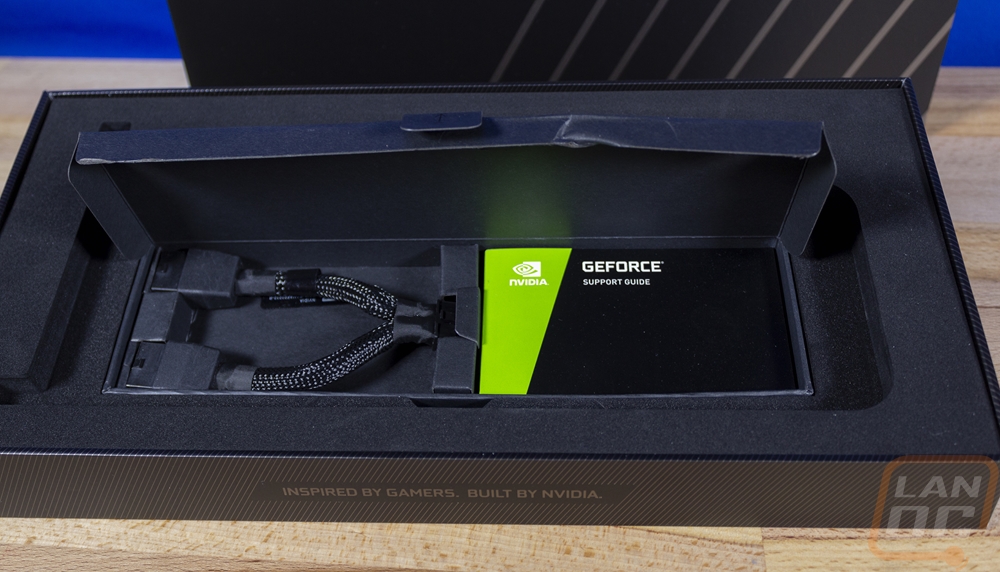
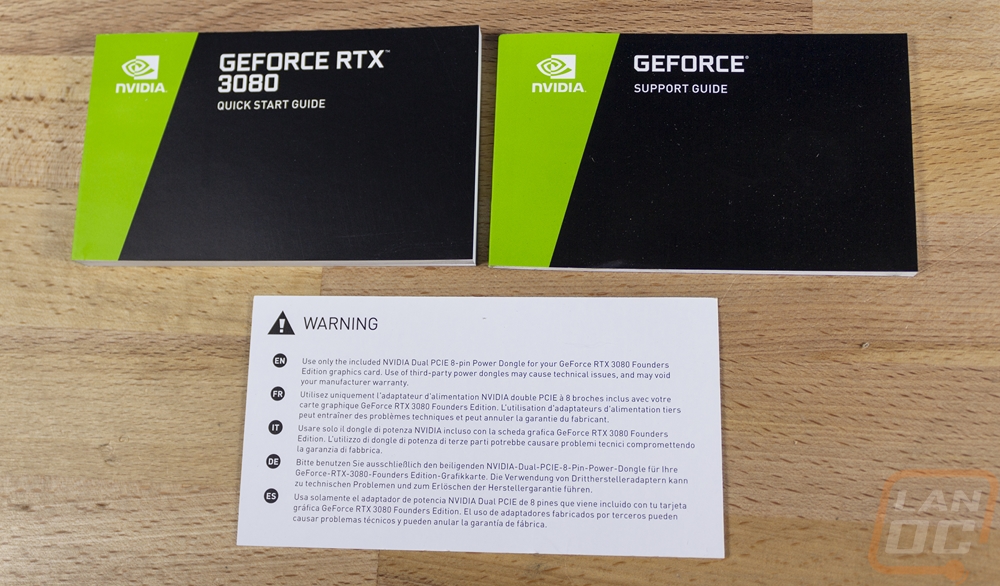
Once you pull the card out, up under it in the foam is a box tucked away in its own hidden cutout. The top has a pull tab to open it and two symbols that show that there is an adapter cable and documents inside. Which is what you find when you pull the top open. The new adapter cable which I will talk about in a second has its spot on the left and then a support guide, quick start guide, and a warning to only use the included 8-pin power dongle. That one caught my eye because they even warn that not using it could potentially void your warranty. I have a feeling that one is going to be an issue in the future given everyone’s initial response to the adapter was already talking about replacing it as quickly as they can.
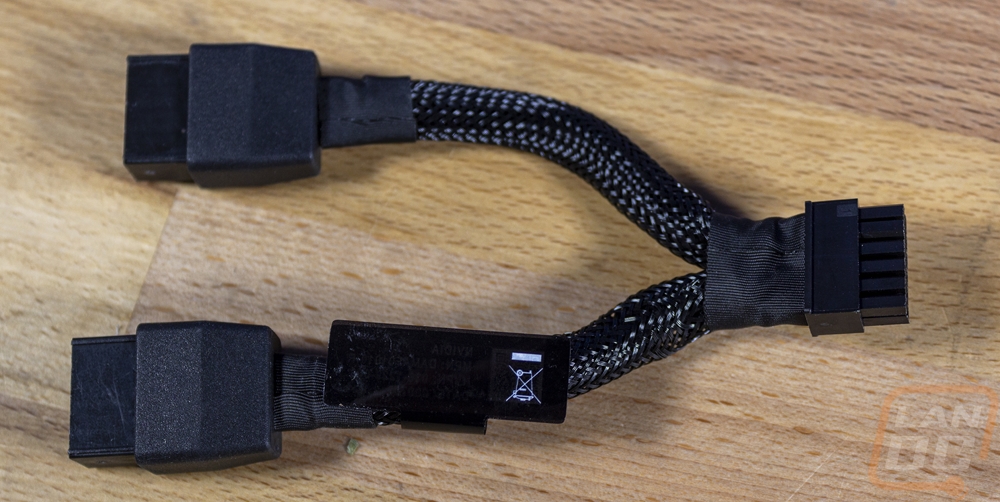
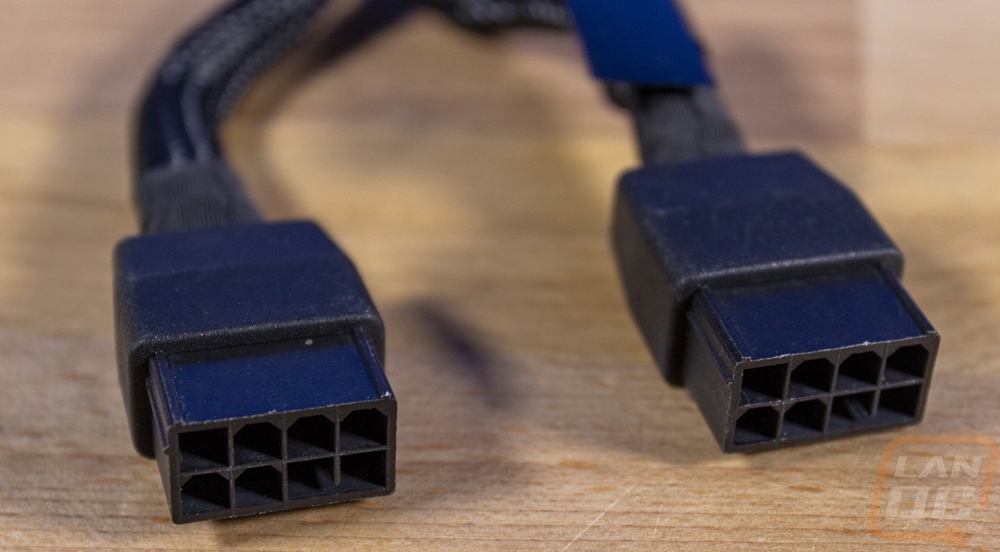
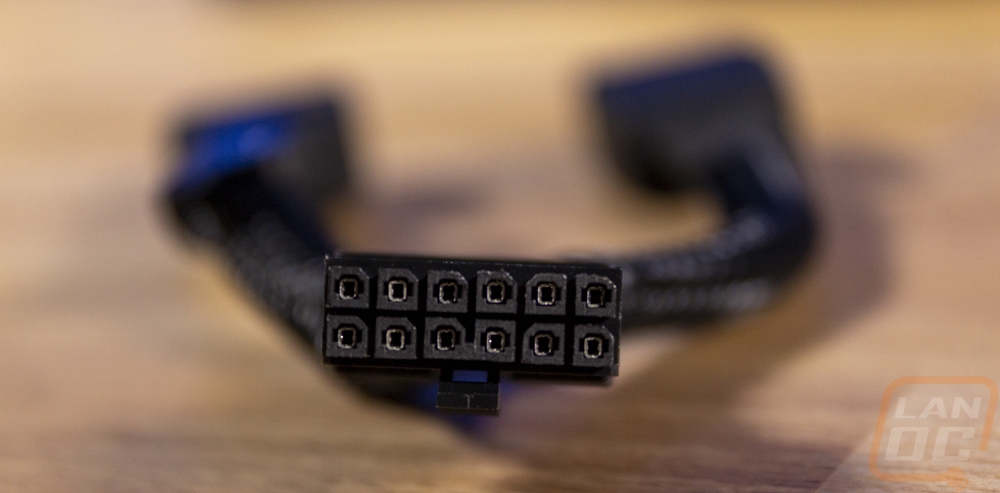
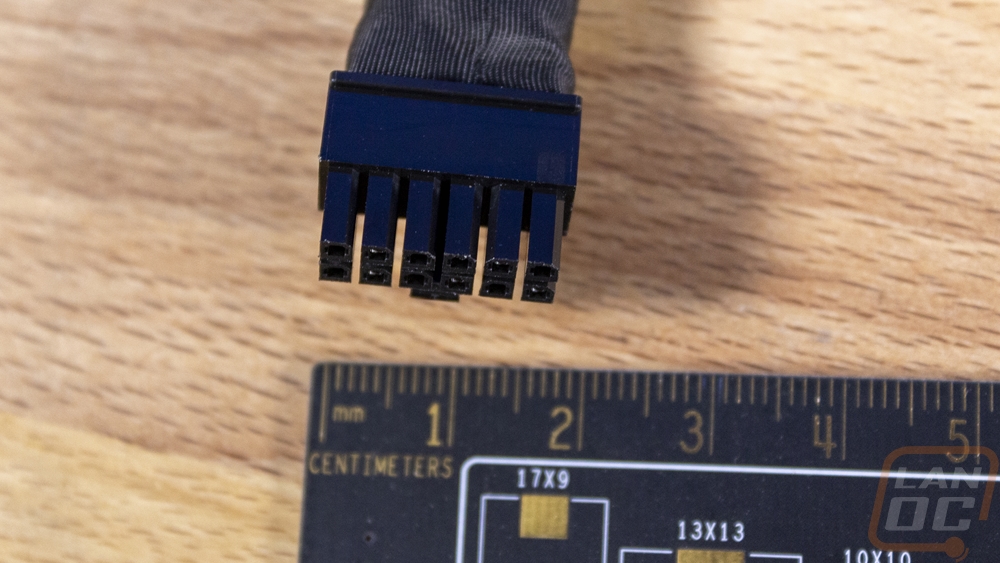
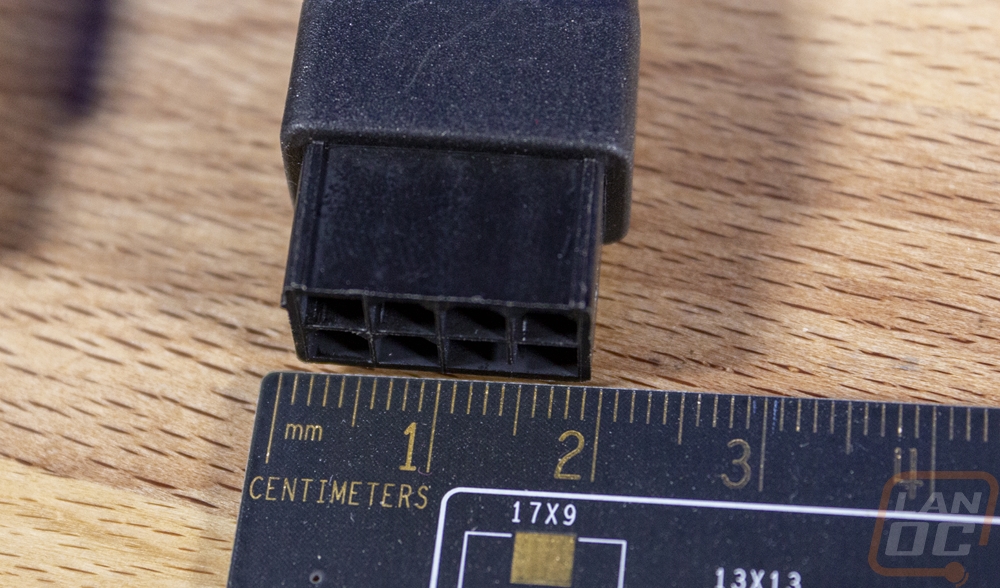
So here is the infamous power adapter and it has been a long time since the last time I have seen a power adapter be important. The last few generations of cards have even stopped including those sometimes dangerous Molex to PCI power adapters that started early on when most PSUs didn’t have the PCI connector. What's the story with this one? Well, Nvidia has switched to a new plug. This is a 12 pin connection. They have the old 8-pins running doubled up to power this new one because it does support more power. Or at least it will once we start to see the cable coming directly from the power supply because it uses a thicker gauge wire. It also saves space by being smaller. The older PCIe plug has big gaps between connections where this one is tighter. In fact in the pictures below you can see the new plug takes up the same space as the old 8-pin. This is important because we have been seeing high-end cards now using three 8-pin connections at times, so combining things into one connection is great.
Card Layout and Photos
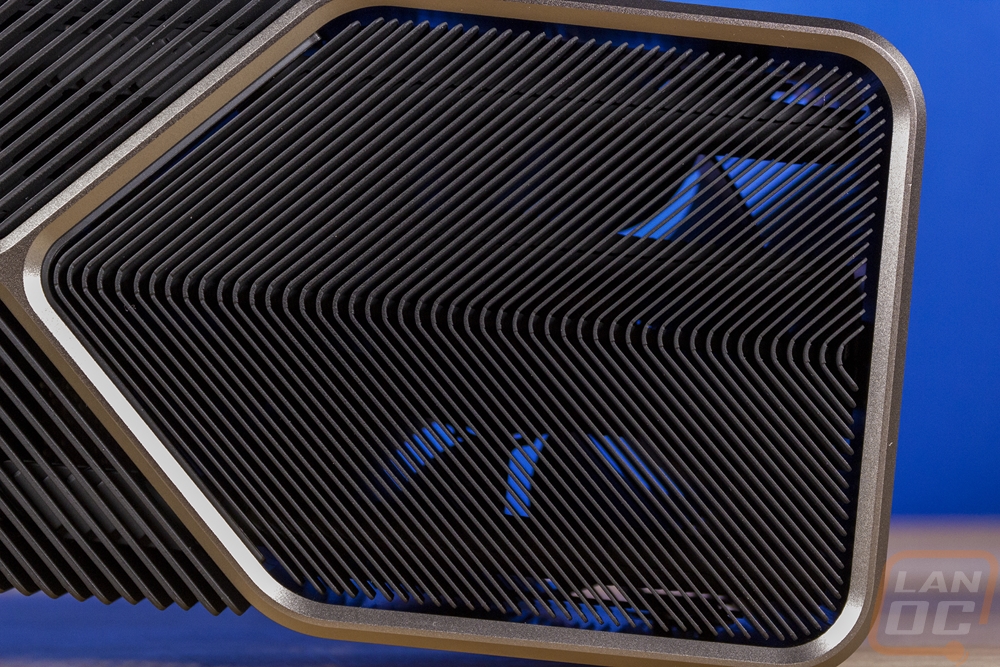
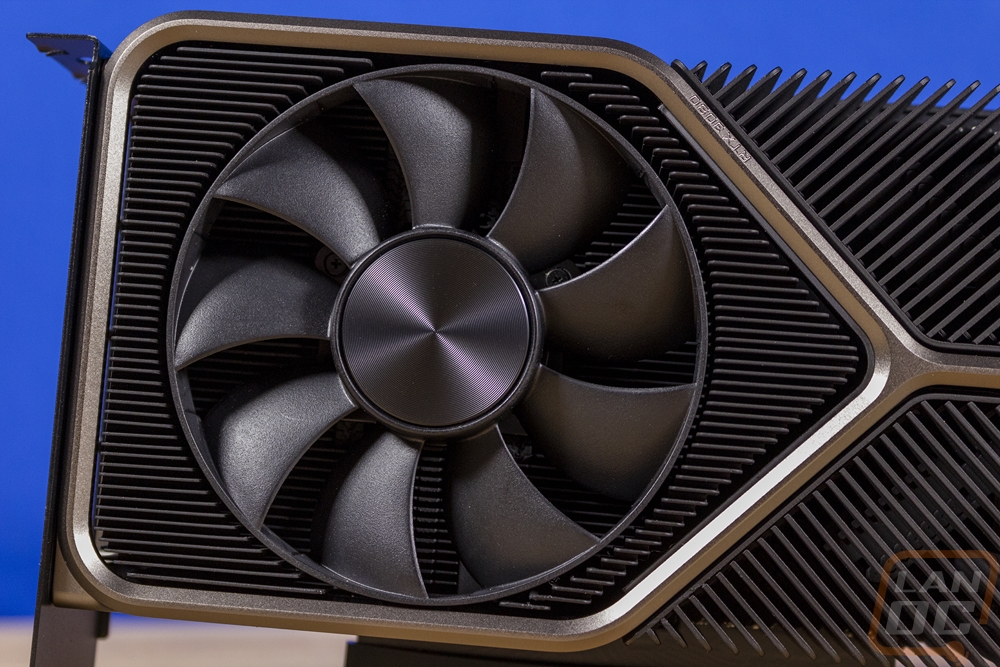
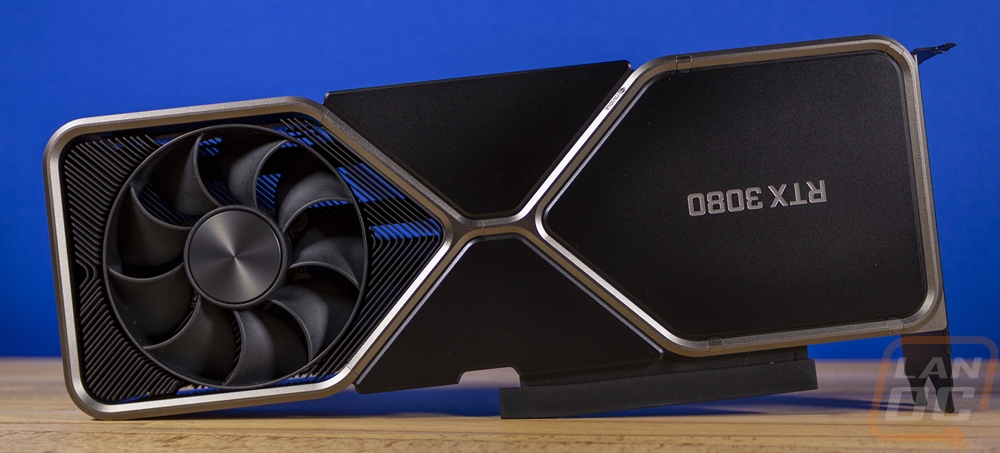
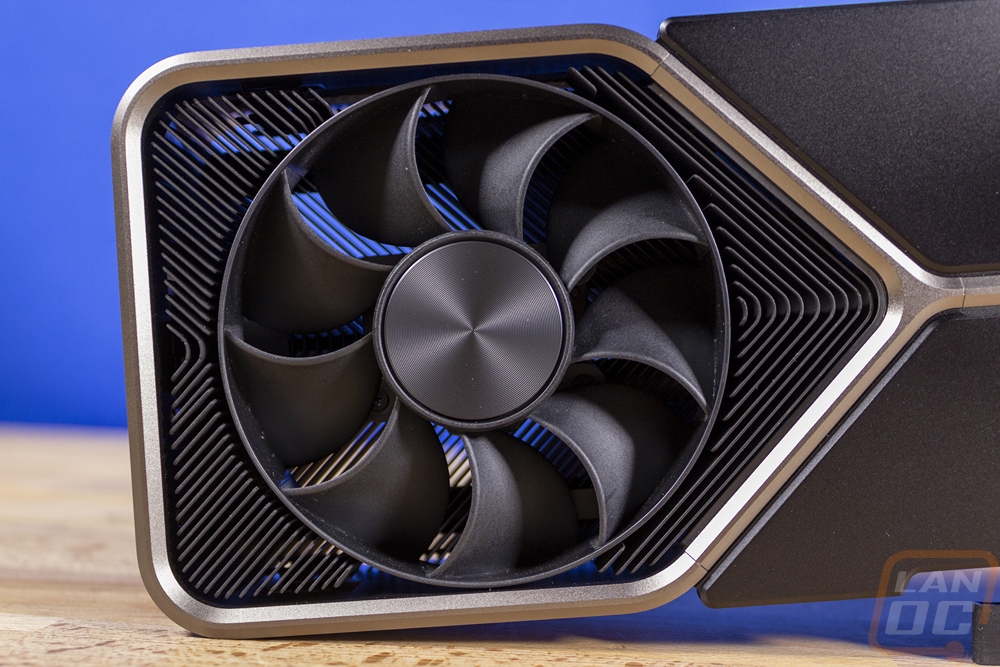
Finally, we can take a look at the RTX 3080. Nvidia has been breaking down barriers and changing things around when it comes to their Founders Edition designs. Up until the 2000 series, they stuck with the same blower design that they have always used for their reference cards and even the first few generations of Founders Edition cards. With the RTX 2000 series launch, they finally dropped the blower design and went with a two fan axial design, which is similar to what aftermarket cards have been doing for a long time. This took away some of the edge that the aftermarket cards have and I still think the Founders Edition is still one of the best looking cards out there. Part of that is Nvidia’s use of a metal casing which gives the card a more solid construction and more quality feel. This time around they did stick with the axial fans and even two fans, but the design is nothing like anything else ever made. They did stick with the black and silver theme which is nice, but this time around there is a lot less of the silver finish and a lot more black. There aren’t any acrylic windows like on the 780-1080 cards. There also isn’t any chrome to be found like on the SUPER cards launched last year. In fact when looking at the main side which is normally what you would call the cooler side with the back being the backplate. There is only one fan visible even though I have already said it has two. The design has an X shape made out of the silver metal trim and then on the left, we have a mostly normal black axial fan that blows down against the PCB. Around it though, what would normally be a cooler fan shroud is all heatsink. They have fins everywhere and they all are orientated in different ways. On the right, the fins even have a V shape.
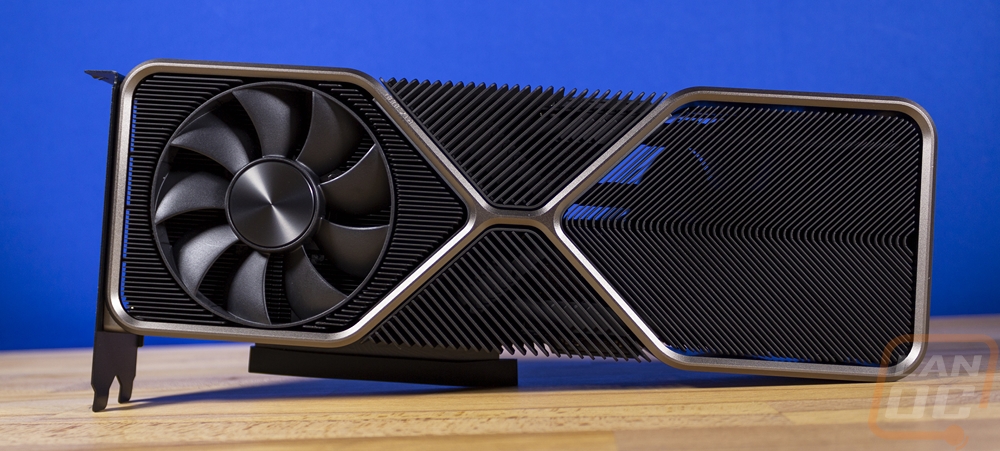
When you start looking a little closer there are a few different things that can be noticed. For one they normally have the model name branded in big letters on this side but with this design that isn’t possible. They did still slip it in though in the thin silver X shape just above the fan on this side. Also on the right portion of the card, you can see through the fins and see some of our background as well as a shape that looks like a fan. That’s right, the PCB doesn’t go the full length of the card, it runs short and allows part of the cooler to have full flow through air.
Flipping the card around, you might almost think I didn’t change anything at all if you didn’t spot the PCIe bracket that is now on the right side. Which speaking of, I was happy to see at least with this card that Nvidia mostly stuck to the standard height though they did push it as far as they can. This side does still end up having a backplate like a traditional card. You can see the solid panels on the right and middle where they also included a more visible RTX 3080 logo in silver. But the left has the unusual fan. It isn’t the same fan as on the other side as you might first thing. But the blades have been flipped around for it to spin in a different direction. This is designed to pull cool air in on the same side as the other fan but to blow it up and through where the main fan blows against the PCB then out the PCIe bracket like Nvidia’s older blower designs.
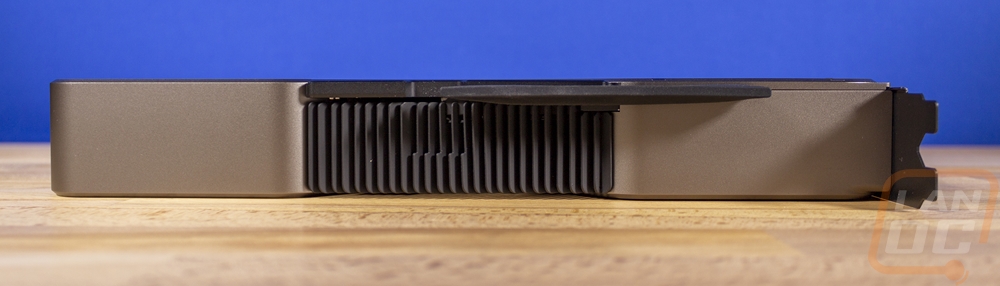
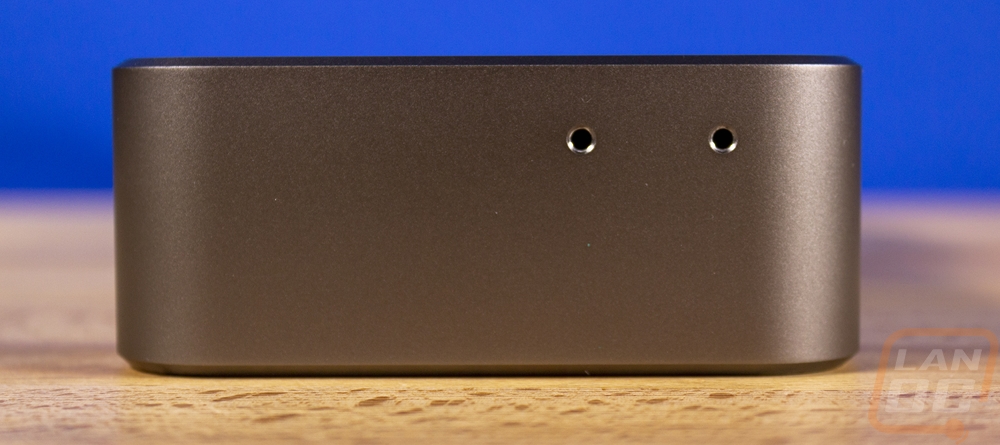
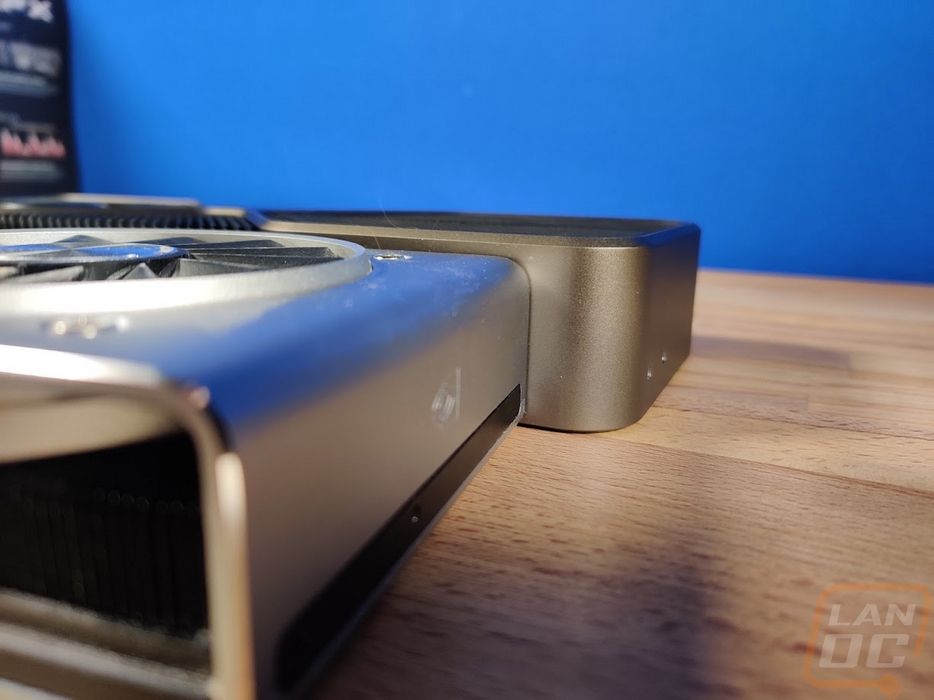
The RTX 3080 is a total of 285 mm long or 11.2 inches, 4.4 inches tall or 112 mm tall, and is a two-slot card which is a relief given the aftermarket cards that are all going to thicker 2.5 or even 3 slot designs. Not to mention the flexibility in even what is considered a slot width which I think everyone should need to list actual width as well but that is just me. Laying the RTX 3080 on its side gives us a good look at the thick cast construction that makes up that V frame design. It covers the cards in 2/3 of the top and bottom as well as the end completely. In the center you can see the fins from the center heatsink and in that area on top they also slipped in the power connection but I will cover that more in a minute. There is also a GeForce RTX logo like on past cards, but this one doesn’t light up in bright green it is now white. Unlike aftermarket cards, the design doesn’t have air blowing out against your motherboard as well which is nice. The end of the card does still have the mounting holes for anti-sag devices in OEM designs which have been on all of Nvidias designs.
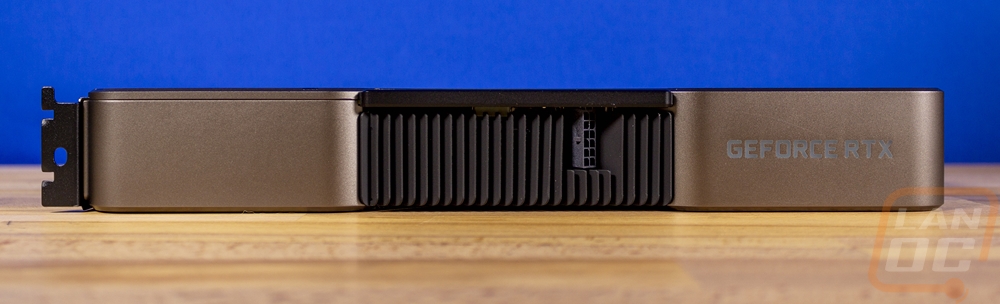
Now back to that power connection. The 12-pin power that I already talked about doesn’t sit flat on the PCB like they normally do. TO save space they have it sitting against the PCB on its side and sitting at an angle back in the center of the top of that card. It is a weird location, to say the least. The reason for this is because this is near the end of the PCB, the blow-through design requires the PCB to be shorter which doesn’t leave room for the plug at the end of the card unless they do an internal pigtail like they did on a few of their older x60 cards. But given the 320-watt TDP, I imagine keeping the connection short is best. So not only do you need to use an adapter unless you get a power supply with this cable (which I imagine will be coming soon). You have to use the Y shaped cable and it is split around the backlit logo so you can still see that.
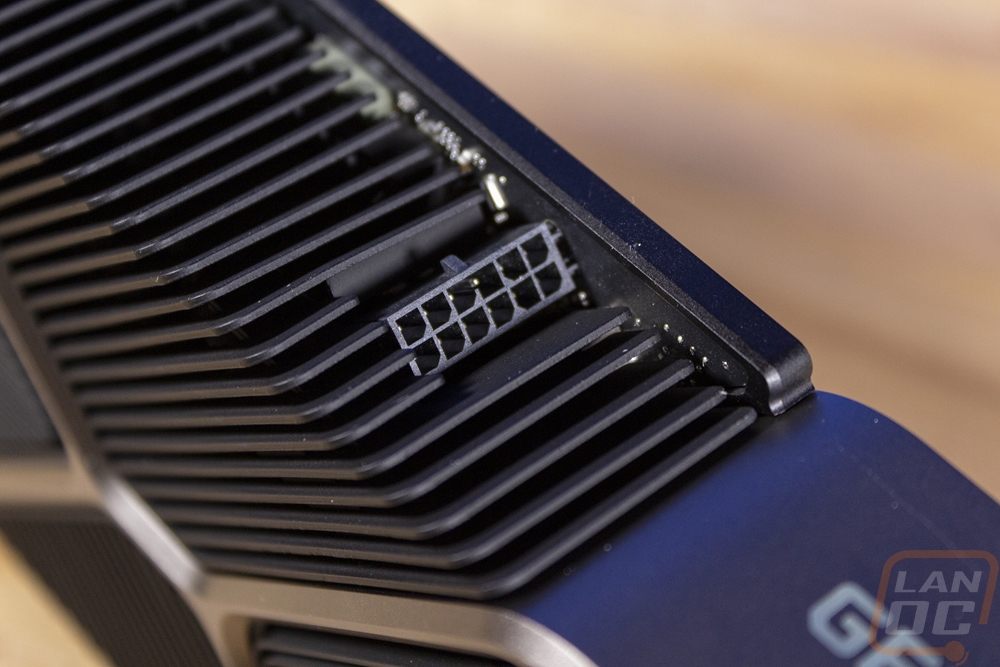
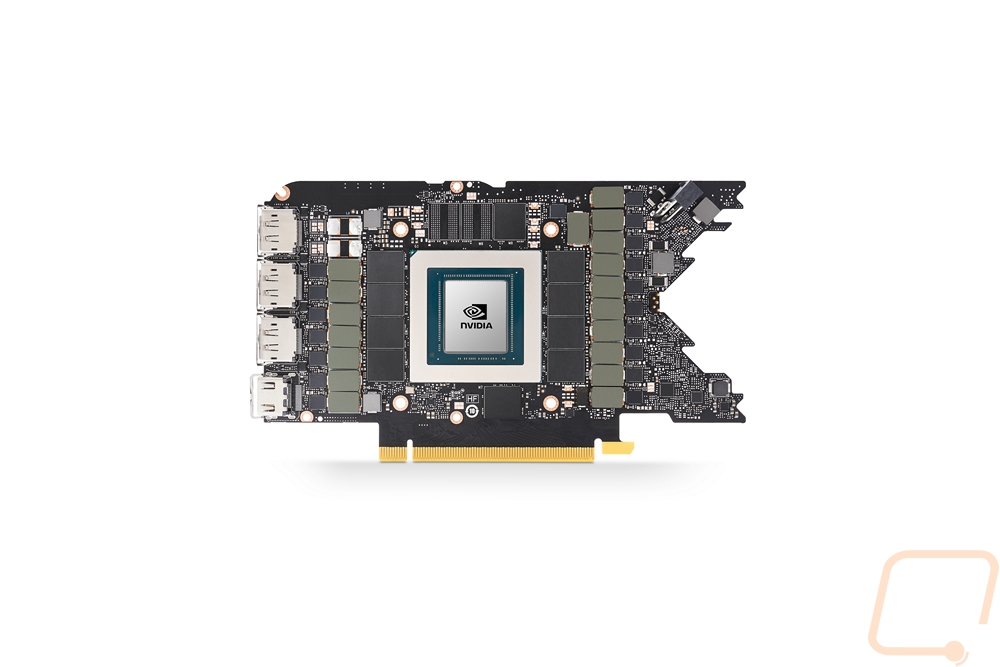
Here is a look at the full PCB of the RTX 3080 as well. Nvidia did a great job of packing a lot into a little space here. You can see the GPU in the middle is flanked with the memory around it then on both sides VRMs. From there they just have enough space on the left for the display connection, the PCI 4.0 slot on the bottom, then on the right up top, you can see that angled 12-pin power connection. The V shape end helps use every bit of space while still fitting the heatsink and fan down at the end of the card.
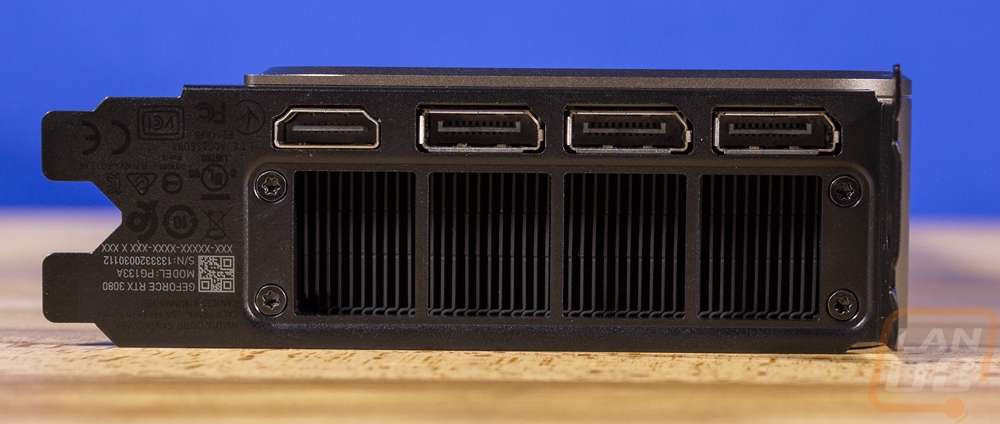
Speaking of display connections, the big change for this generation is that the HDMI port is now officially and finally 2.1. This means 8K support with the new 48 Gbps connection. There are then three full-sized DisplayPort connections running at DP 1.4a which supports 8K at 60Hz or 4K at 120Hz. But it isn’t the connection options that made the end of the card stand out. For one Nvidia hid all of their certification branding down here as well as your serial number. I like the serial number because you might be able to spot it without pulling your PC back apart. The other big thing are the HUGE holes for ventilation. In the past, Nvidia has been extremely conservative with the bracket ventilation holes so this was a surprise. But they do have the left half of the cooler blowing out this end so it is important.
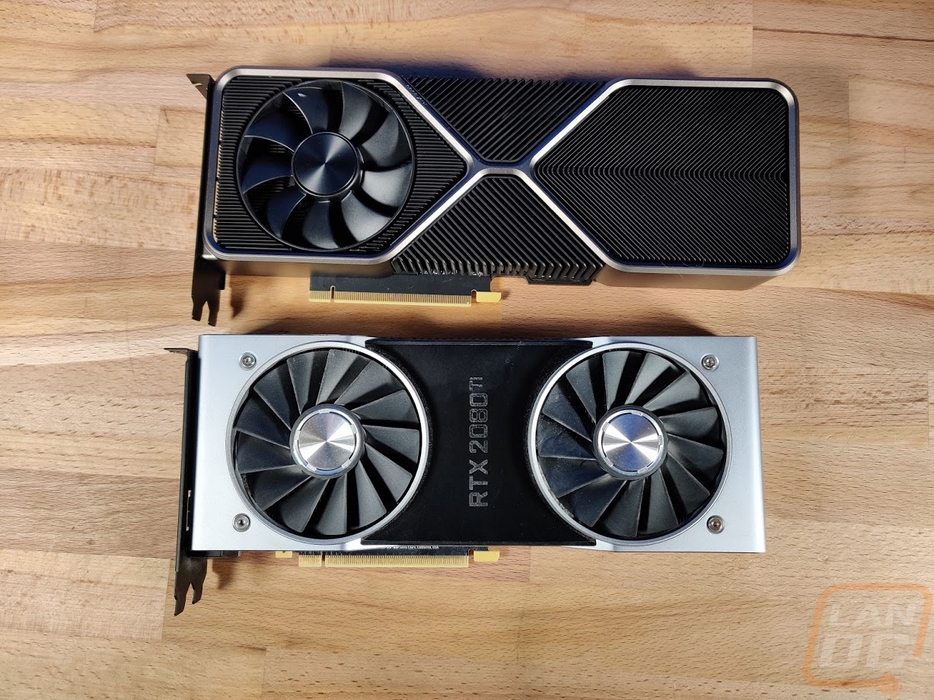
Before jumping into testing I did get out our RTX 2080 Ti which I have been keeping safe in my PC while playing Microsoft Flight Sim 2020 to compare its size to the RTX 3080. You can see that the 3080 is noticeably longer, which is going to be closer to what the 2080 Ti aftermarket cards were in size. As for thickness, once you add in how the 2080 Ti’s fans stuck out you are about the same in thickness which should be at least one good thing for SFF fans.
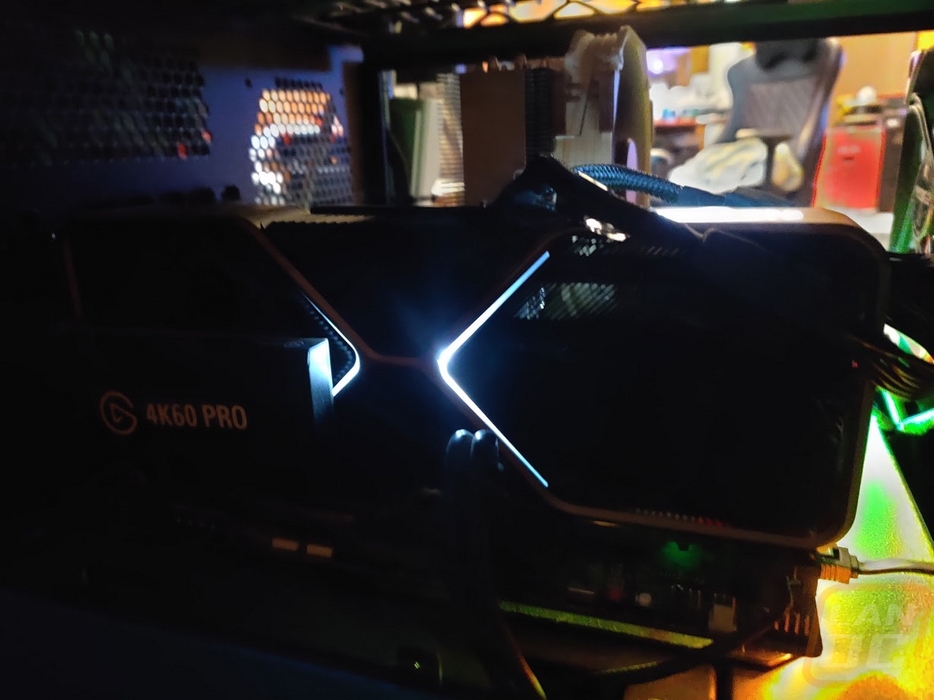
On top of the white backlit logo up on the top edge, Nvidia did also slip in lighting behind the X shape in the middle of the main side of the card which looks good when up and running. This is more like a feature you would find on an aftermarket card than a Founders Edition, but I welcome it!
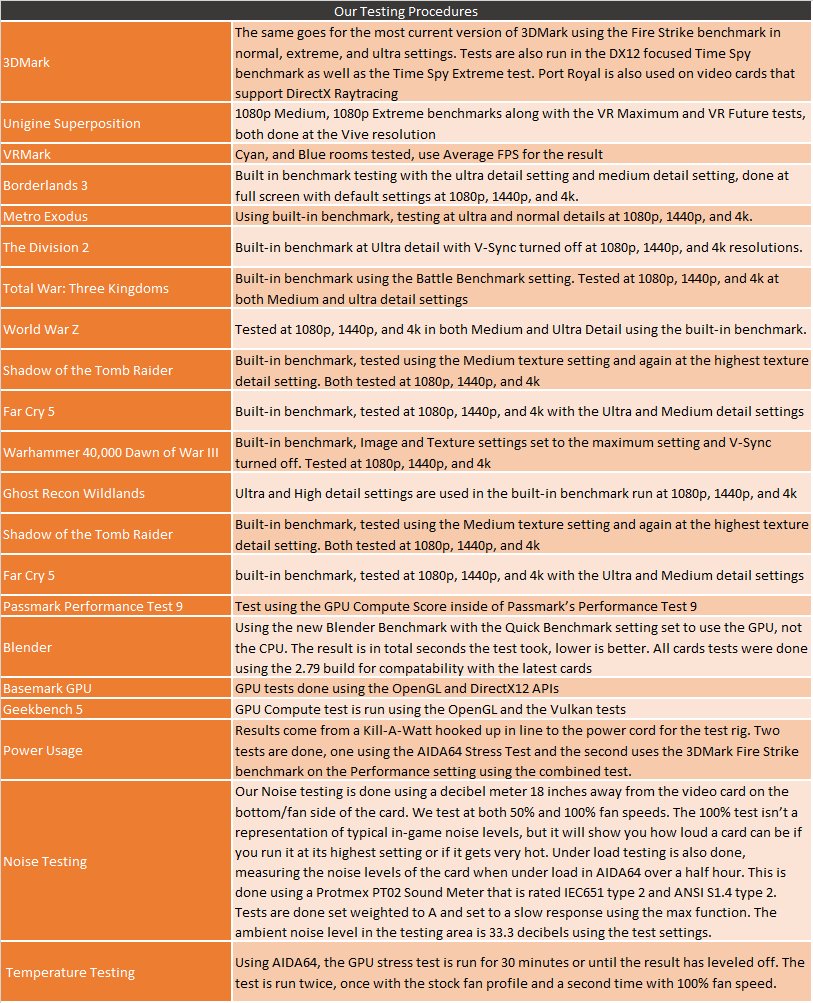
Test Rig and Procedures
Test Rig
CPU: AMD Ryzen 3900X
Motherboard: Asus Crosshair VIII HERO WiFi
Memory: G.Skill Trident Z Royal 3600MHz 16-16-16-36
Storage: Corsair MP600 2TB
Cooling - Noctua NH-U12S
Power Supply - Corsair AX1200w
Case - Primochill Wetbench
Synthetic Benchmarks
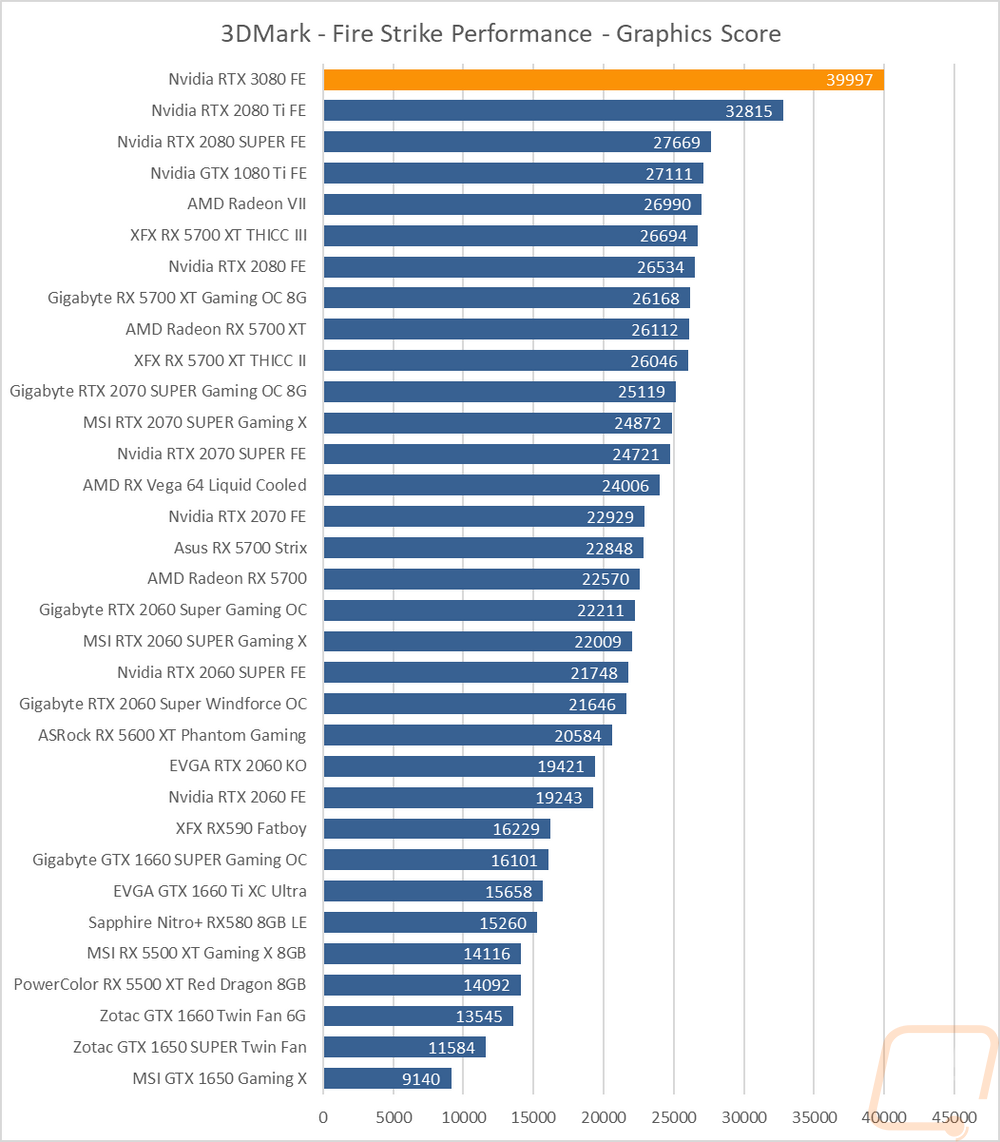
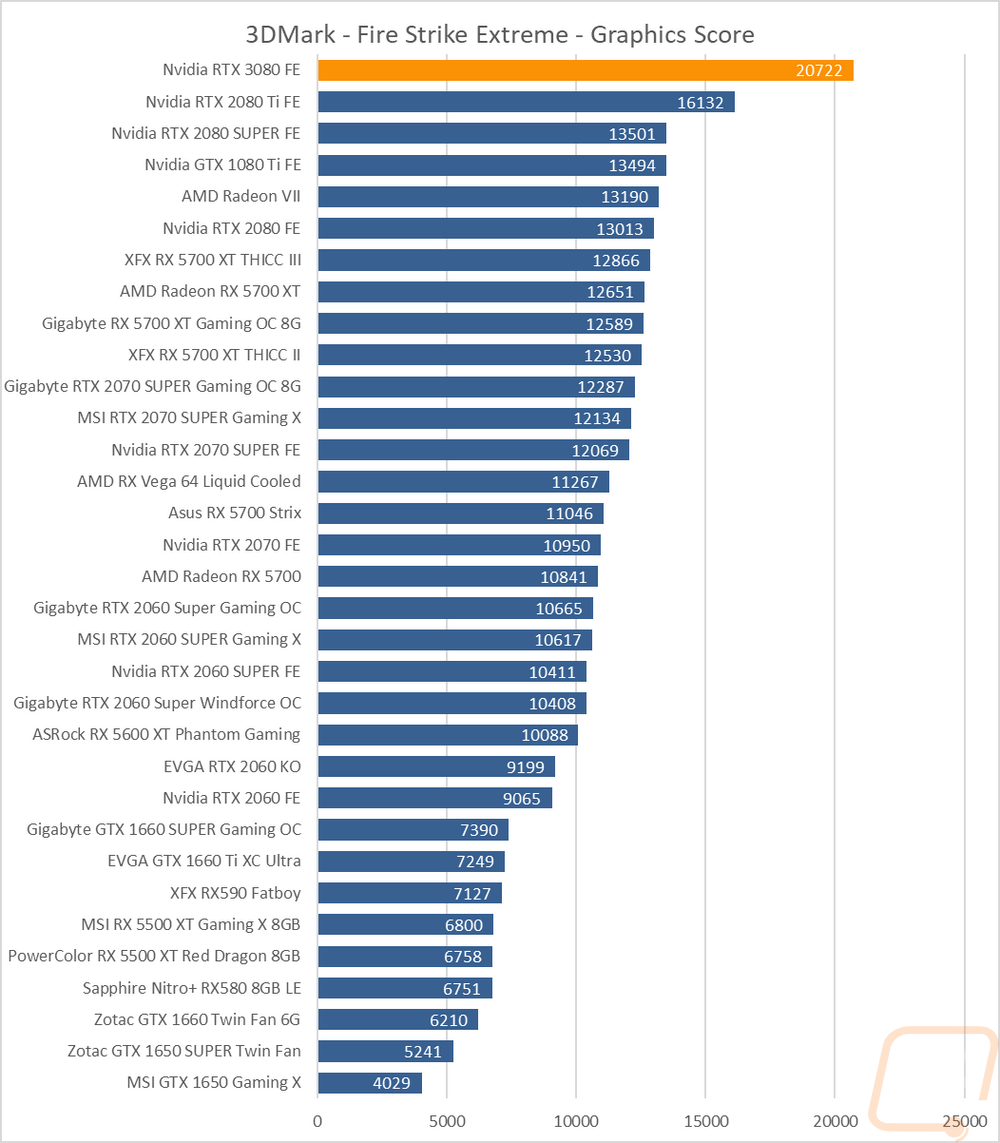
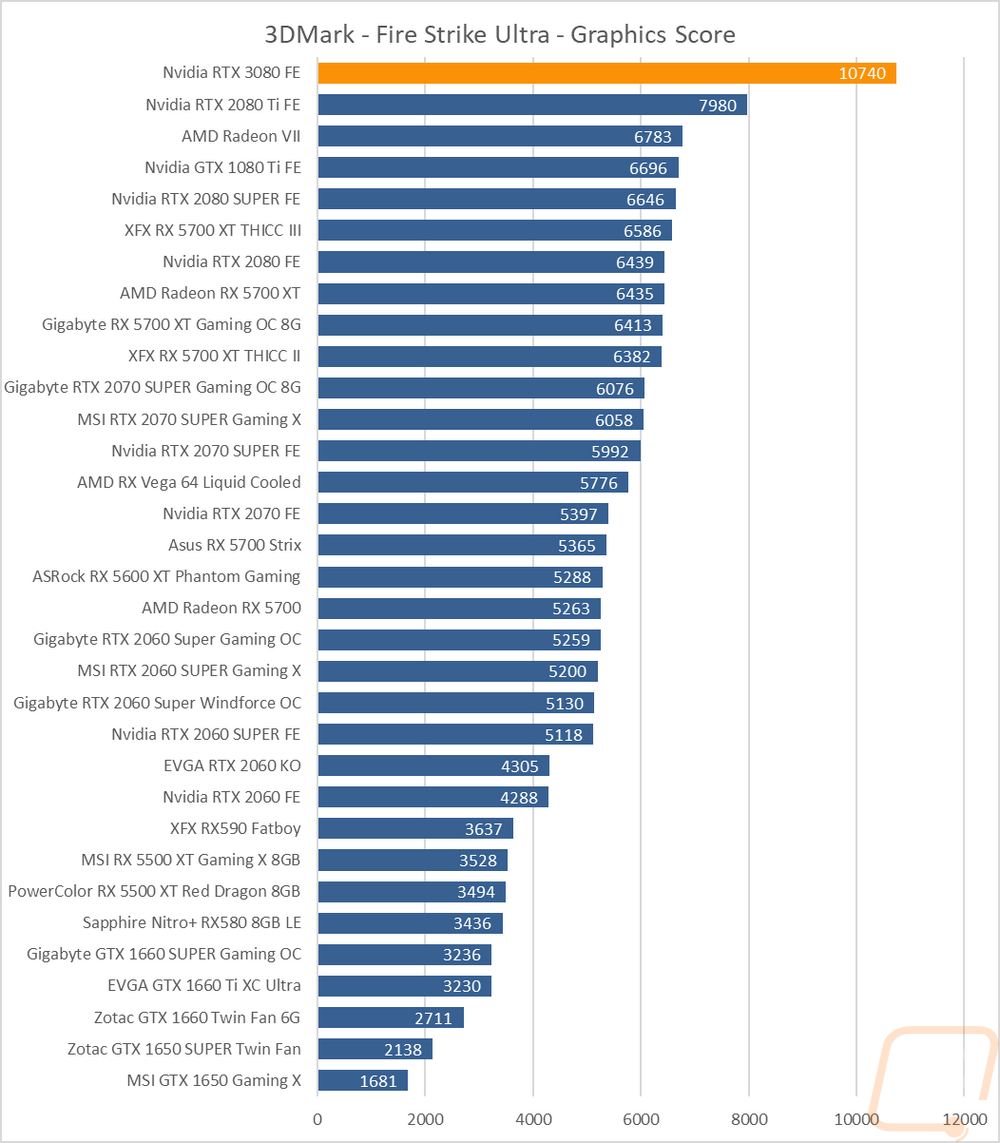
As always I like to start my testing with a few synthetic benchmarks. 3DMark especially is one of my favorites because it is very optimized in both Nvidia and AMD drivers. It's nice to not have to worry about it being favored too much either way and the repeatability of the results makes it a nice chance to compare from card to card. It also gives us our first looks at the performance of the RTX 3080 and Ampere as a whole. It isn’t a surprise that the RTX 3080 is at the top of the charts in all three of the Fire Strike tests, but the gap between it and the other cards is a surprise. For my testing, along with including our past testing I went through and retested the GTX 1080 Ti as well so I could have its results alongside the 2080 SUPER, RTX 2080 Ti, and the RTX 3080 which are the cards I feel are the most important to compare. The 1080 Ti is important because I feel a lot of its owners who wanted the biggest and best back then are now looking to see what is available now that pricing is a little better and the performance gap is larger. The 1080 Ti is of course right with the 2080 SUPER but with it getting 6696 vs 10740 in the Fire Strike Ultra test you can see just how big the gap is now.
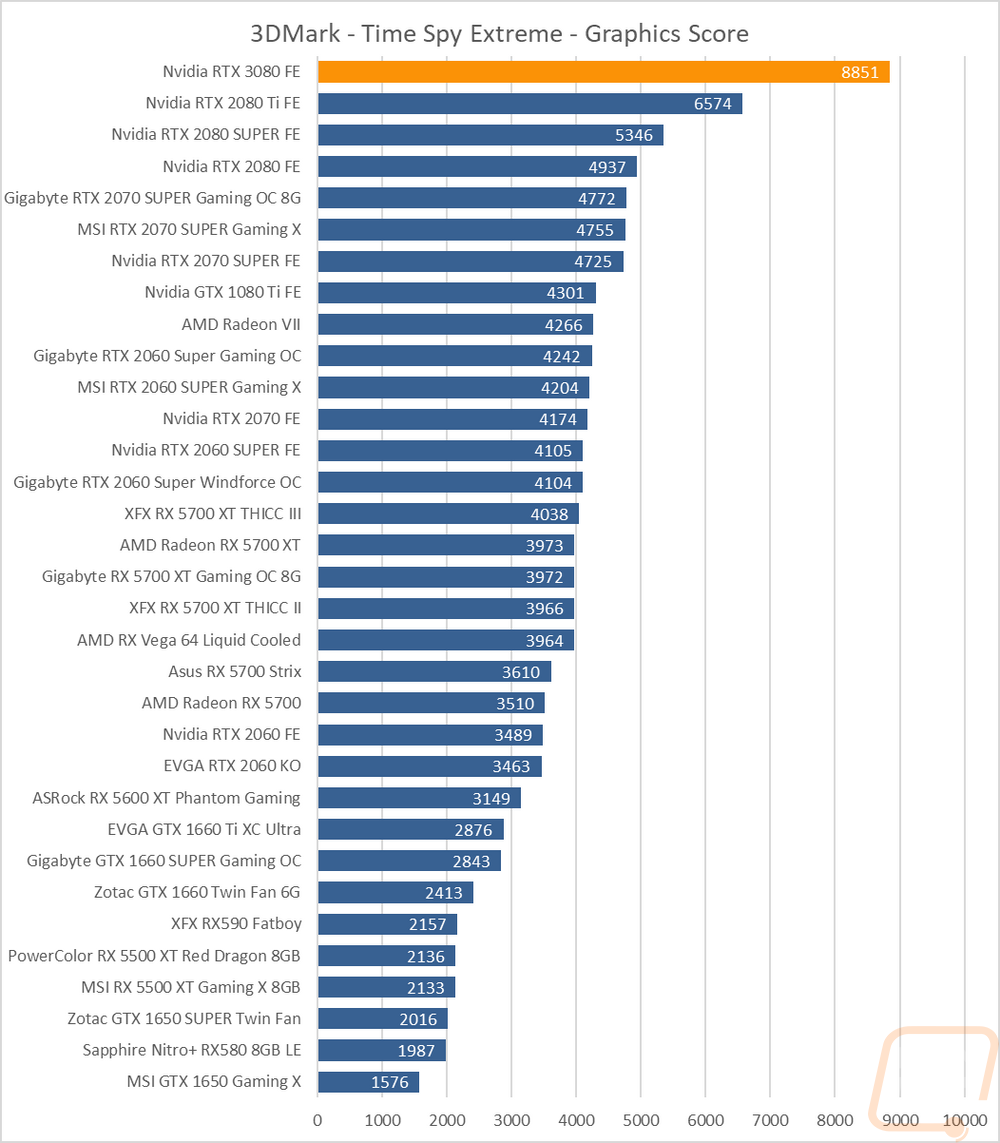
Now Time Spy is another 3DMark test, but this time it tests DX12 which the RTX cards have been known to be a lot better with. The GTX 1080 Ti drops way behind here with even the RTX 2070 out ahead. But the RTX 3080 is once again just in its own world compared to even the 2080 Ti.

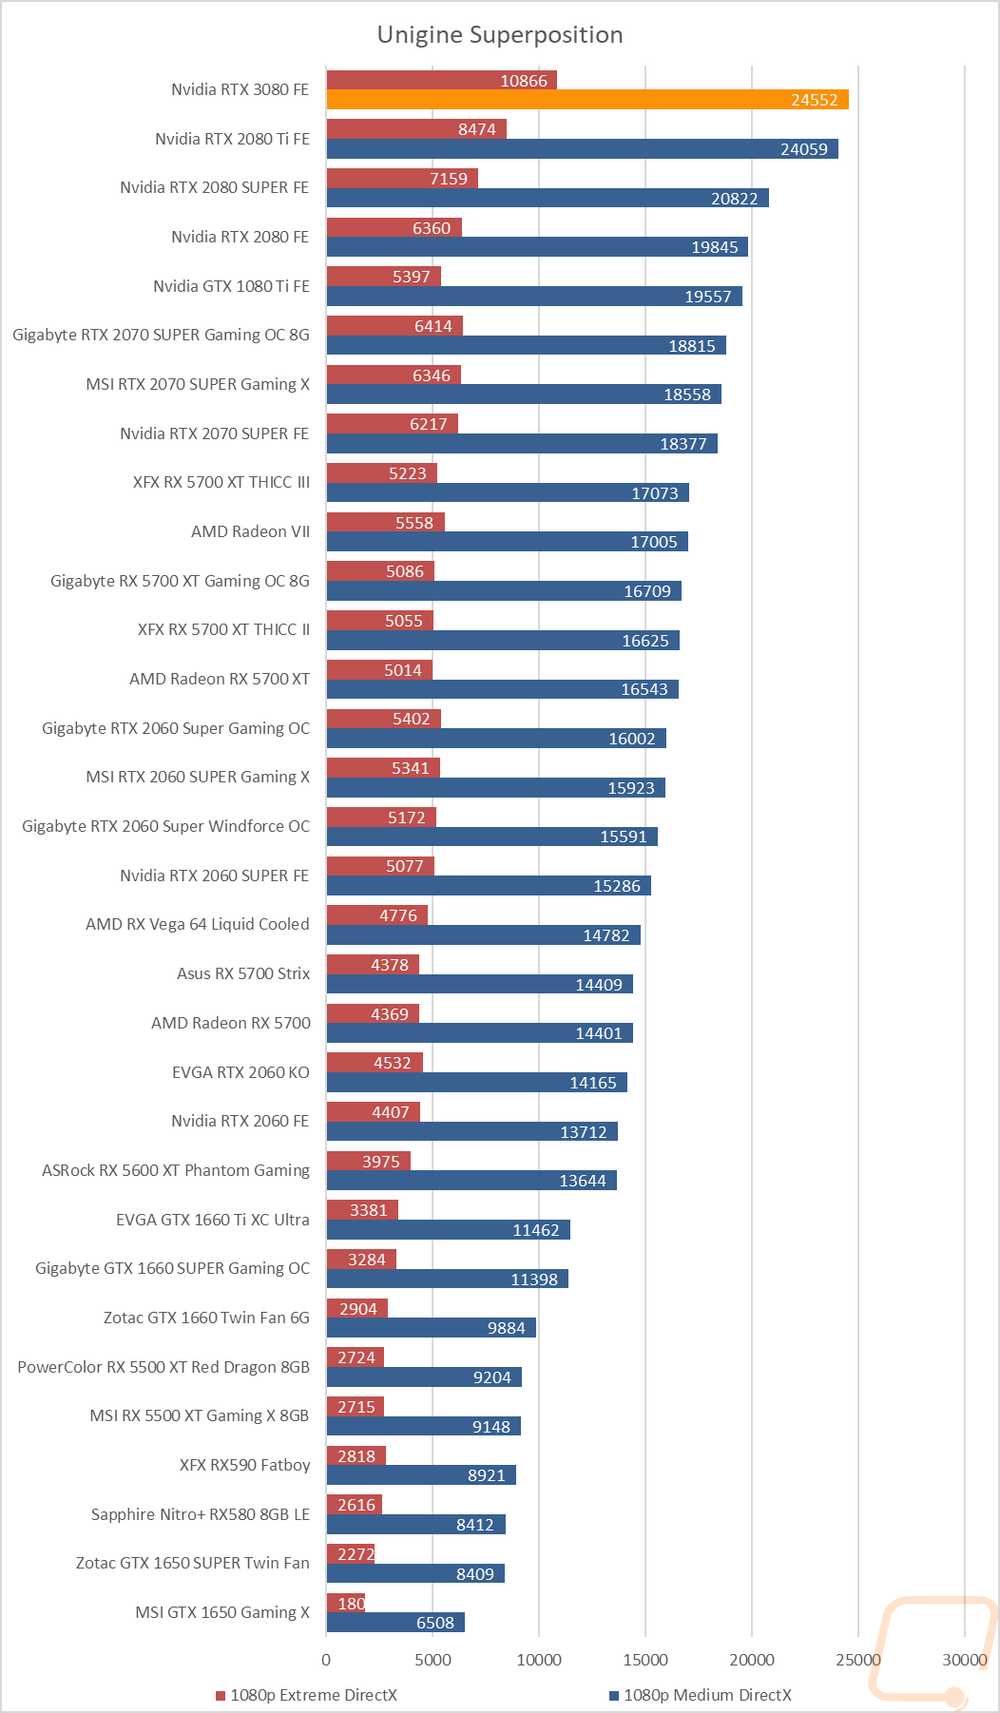
My last synthetic tests were using the Unigine based superposition benchmark. Specifically, the 1080 medium and extreme tests which the medium test isn’t designed for these higher-end cards. You can see that we start to see no gap between the highest-end cards but with the extreme results again the 3080 is just in its own world ahead of the 2080 Ti and almost exactly double the score of the GTX 1080 Ti.
VR Benchmarks
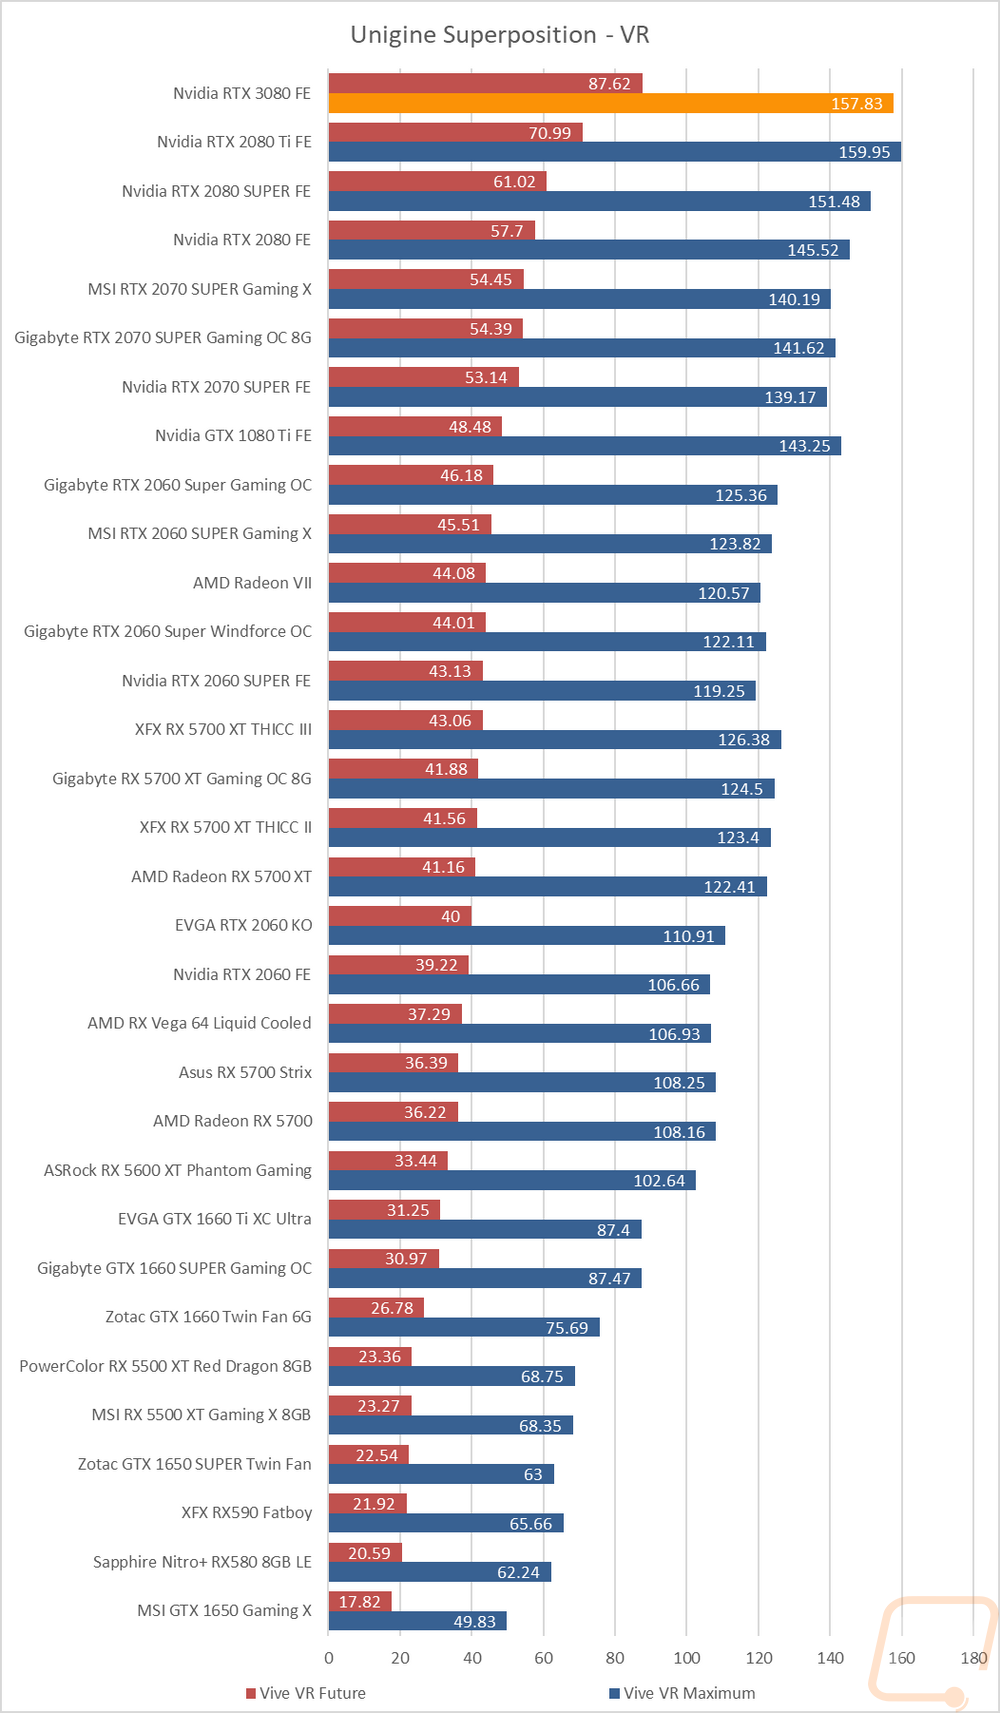
As for Virtual Reality, I love it but it is more demanding than traditional gaming. This is partially because of the resolutions needed to render for two eyes and because they render more than what is immediately visible. But also because of post effects to get the proper “fisheye” effect for it to look proper in your eyes with the HMD. You also have to have much higher expectations for frame rates in VR, skipping frames or lower FPS can cause motion sickness in VR. Because of that, I ran a few tests.
My first test was again in Superposition. This time I tested the VR Maximum and VR Future tests using the Vive resolution. Like in the other Superposition test I tested at an extreme detail which this time is the VR Future test and a more reasonable detail which is the VR Maximum test. Crazy enough, we have finally reached a point where the maximum test is starting to become CPU limited and our 2080 TI ran a little faster. But when we get into the VR Future test, the gap that I saw in the synthetic tests is there once again with the 3080 17 FPS higher than the 2080 Ti.
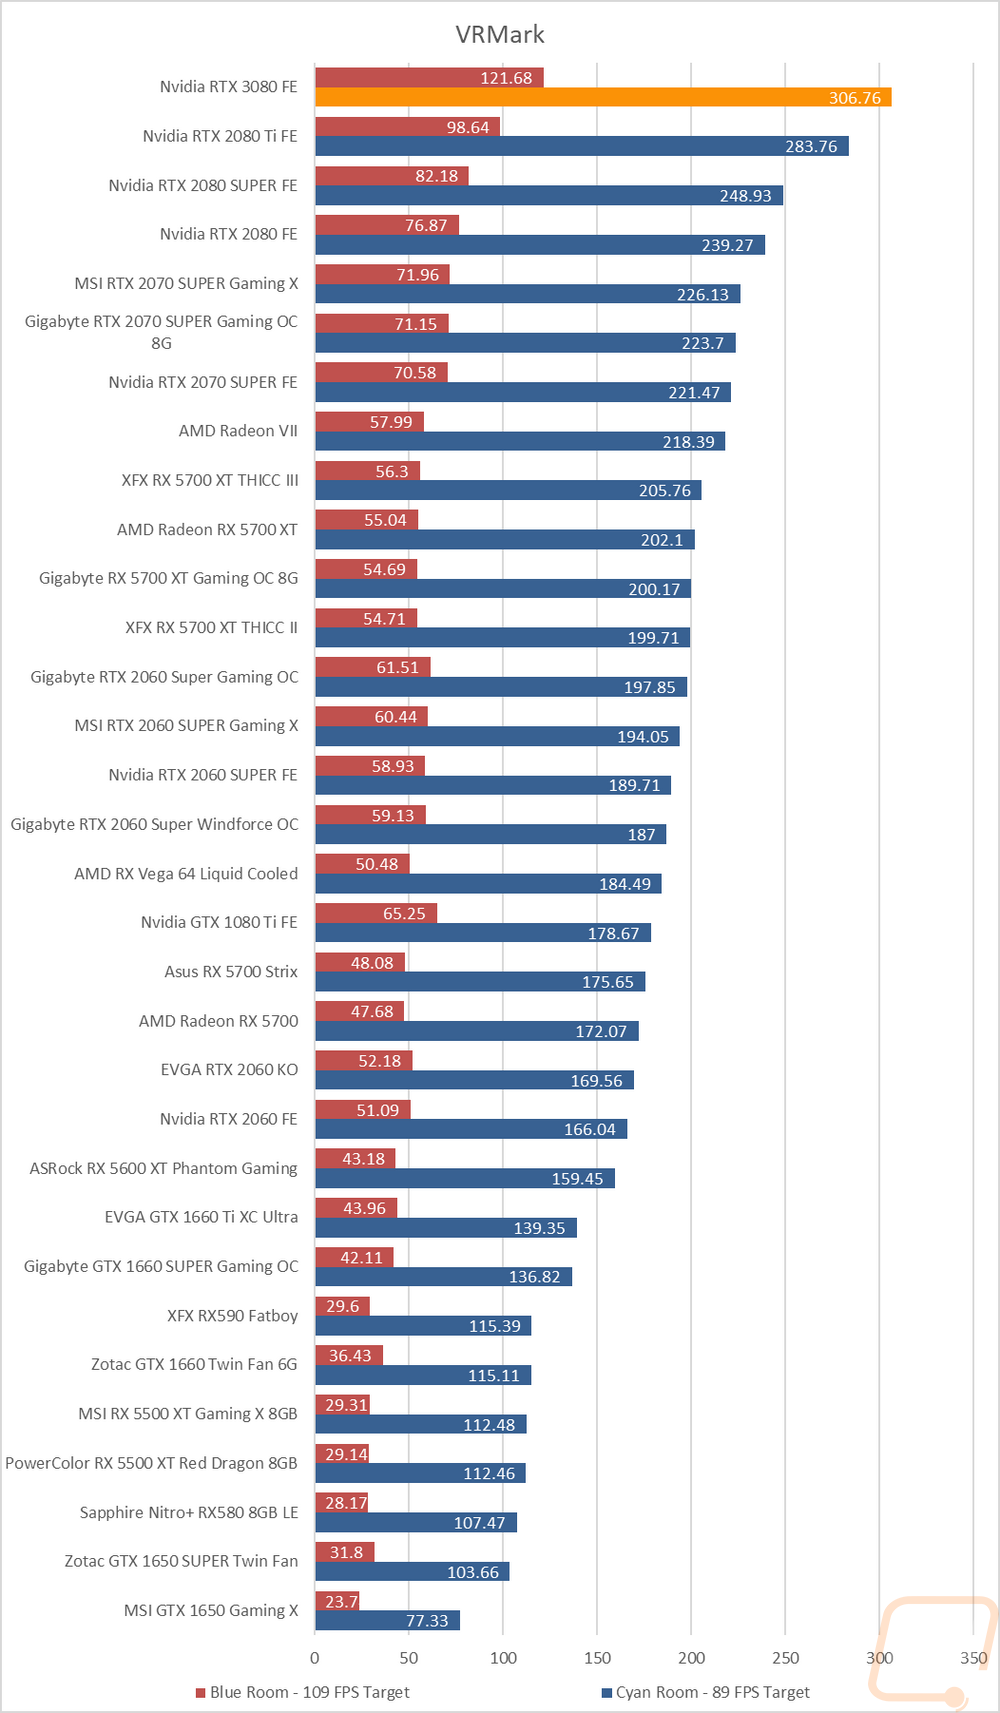
In VR Mark the RTX 3080 dominates once again. This time in the Cyan Room test it breaks 300 FPS which is crazy. But the best part is seeing the Blue Room test finally have a card that outperformed the 109 FPS target and it broke that by a good margin.
In-Game Benchmarks
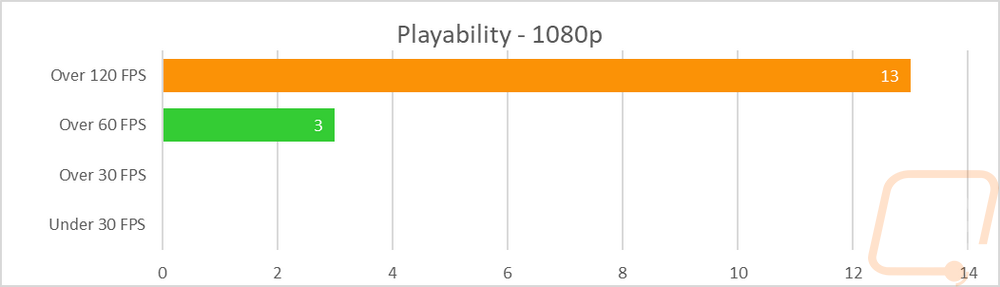
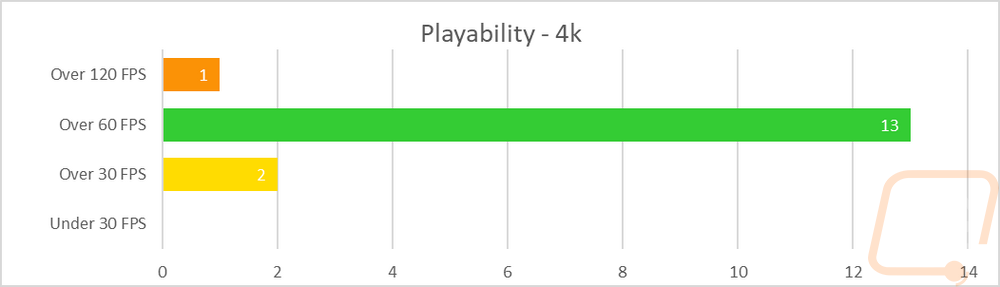
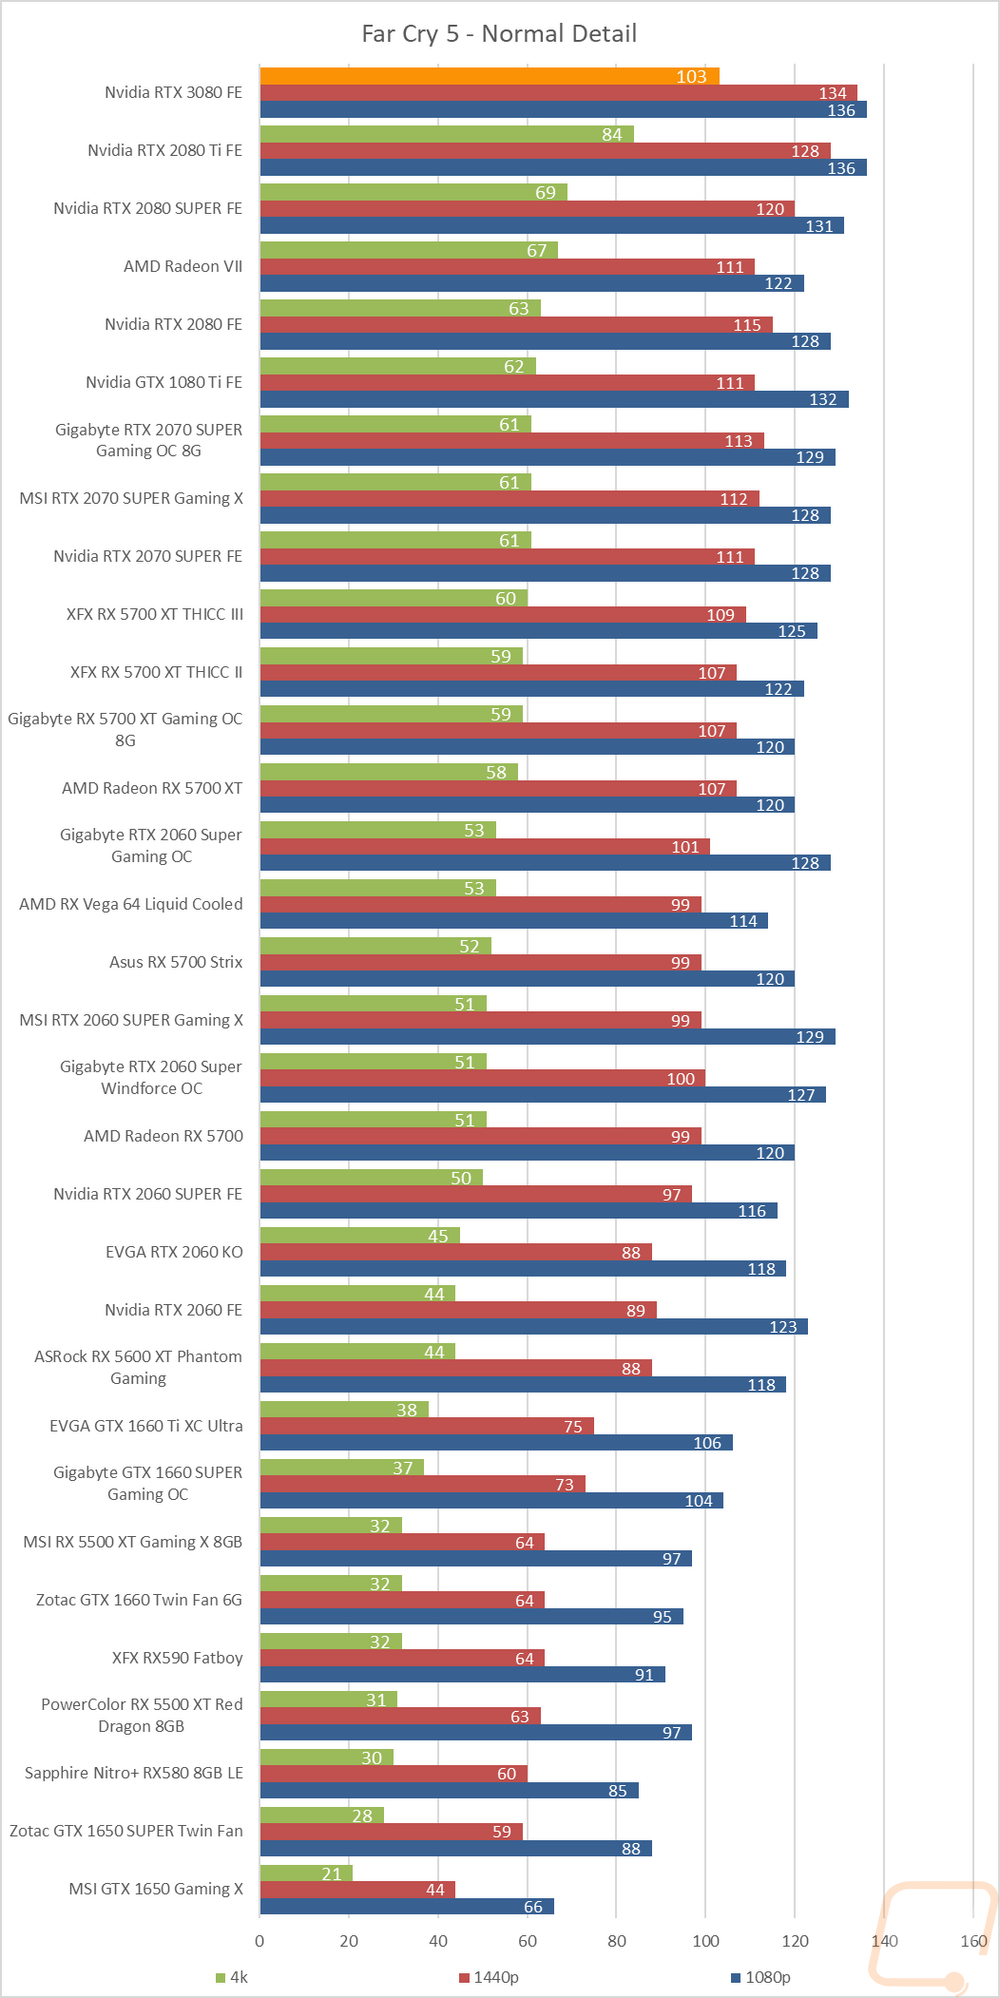
Now we finally get into the in game performance and that is the main reason people pick up a new video card. To test things out I ran through our new benchmark suite that tests 9 games at three different resolutions (1080p, 1440p, and 4k). Most of the games tested have been run at the highest detail setting and a mid-range detail setting to get a look at how turning things up hurts performance and to give an idea of if turning detail down from max will be beneficial for frame rates. In total, each video card is tested 48 times and that makes for a huge mess of results when you put them all together. To help with that I like to start off with these overall playability graphs that take all of the results and give an easier to read the result. I have one for each of the three resolutions and each is broken up into four FPS ranges. Under 30 FPS is considered unplayable, over 30 is playable but not ideal, over 60 is the sweet spot, and then over 120 FPS is for high refresh rate monitors.
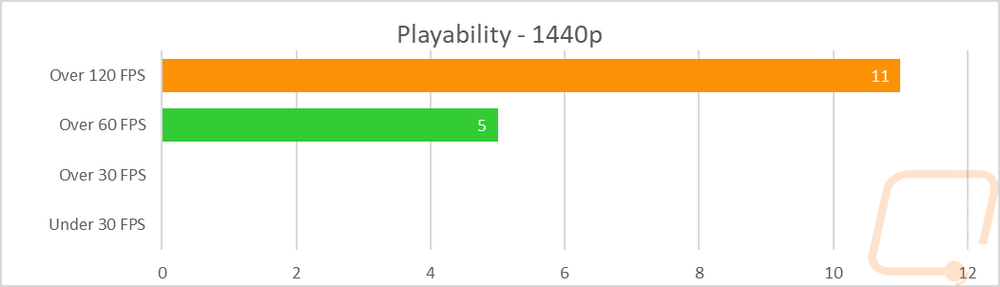
So how did the Nvidia GeForce RTX 3080 perform? Well frankly for all of the RTX 3080 I have been focused on 4k. But breaking things down by resolution lets us also just double check 1080p and 1440p performance as well. So at 1080p, 13 of the 16 results came in over 120 with just three under that in the 60-119 FPS range. 1440p wasn’t far off from that as well with 11 over 120 and 5 in the 60-119 range. Both not having any results that wouldn’t be considered silky smooth. This is surprising because even past high-end cards have had one or two results that were a little low given that I am testing all of the games at their highest possible settings. Then we finally get into the card killer, 4k, and those 120+ FPS results are nearly gone, but with 13 over 60 FPS and just two that came in under this is a very solid 4K card.
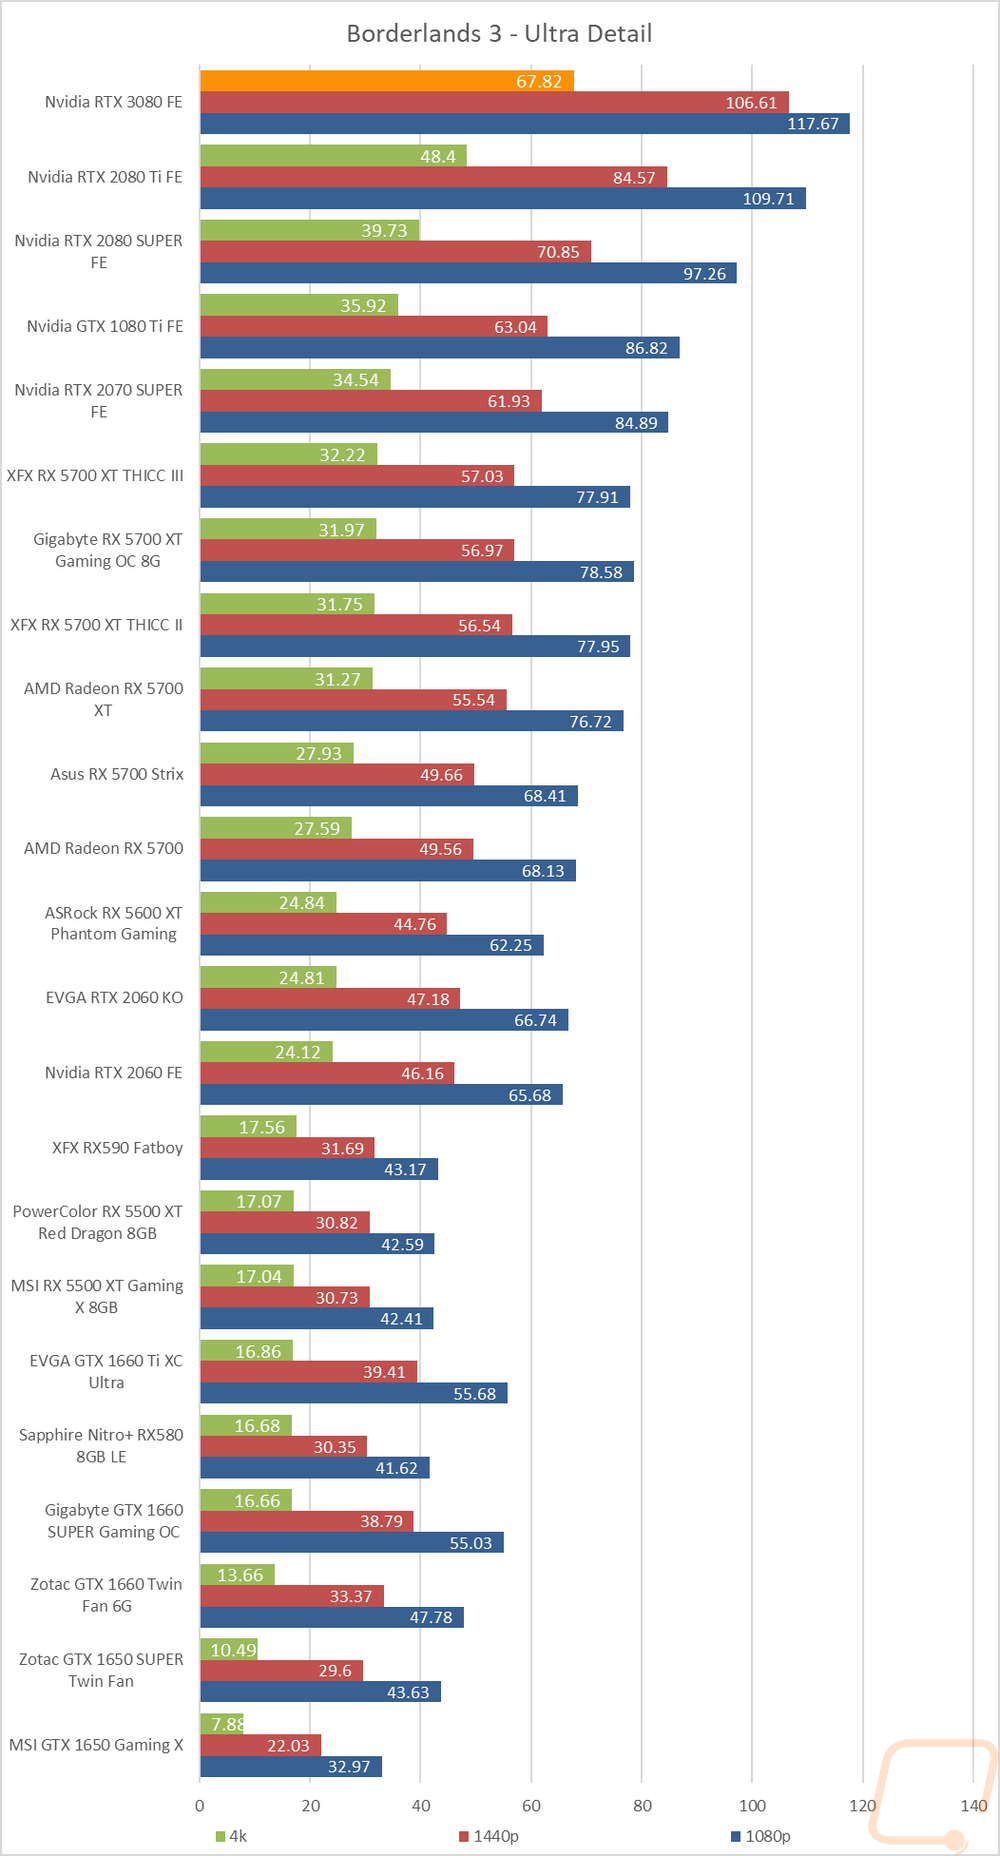
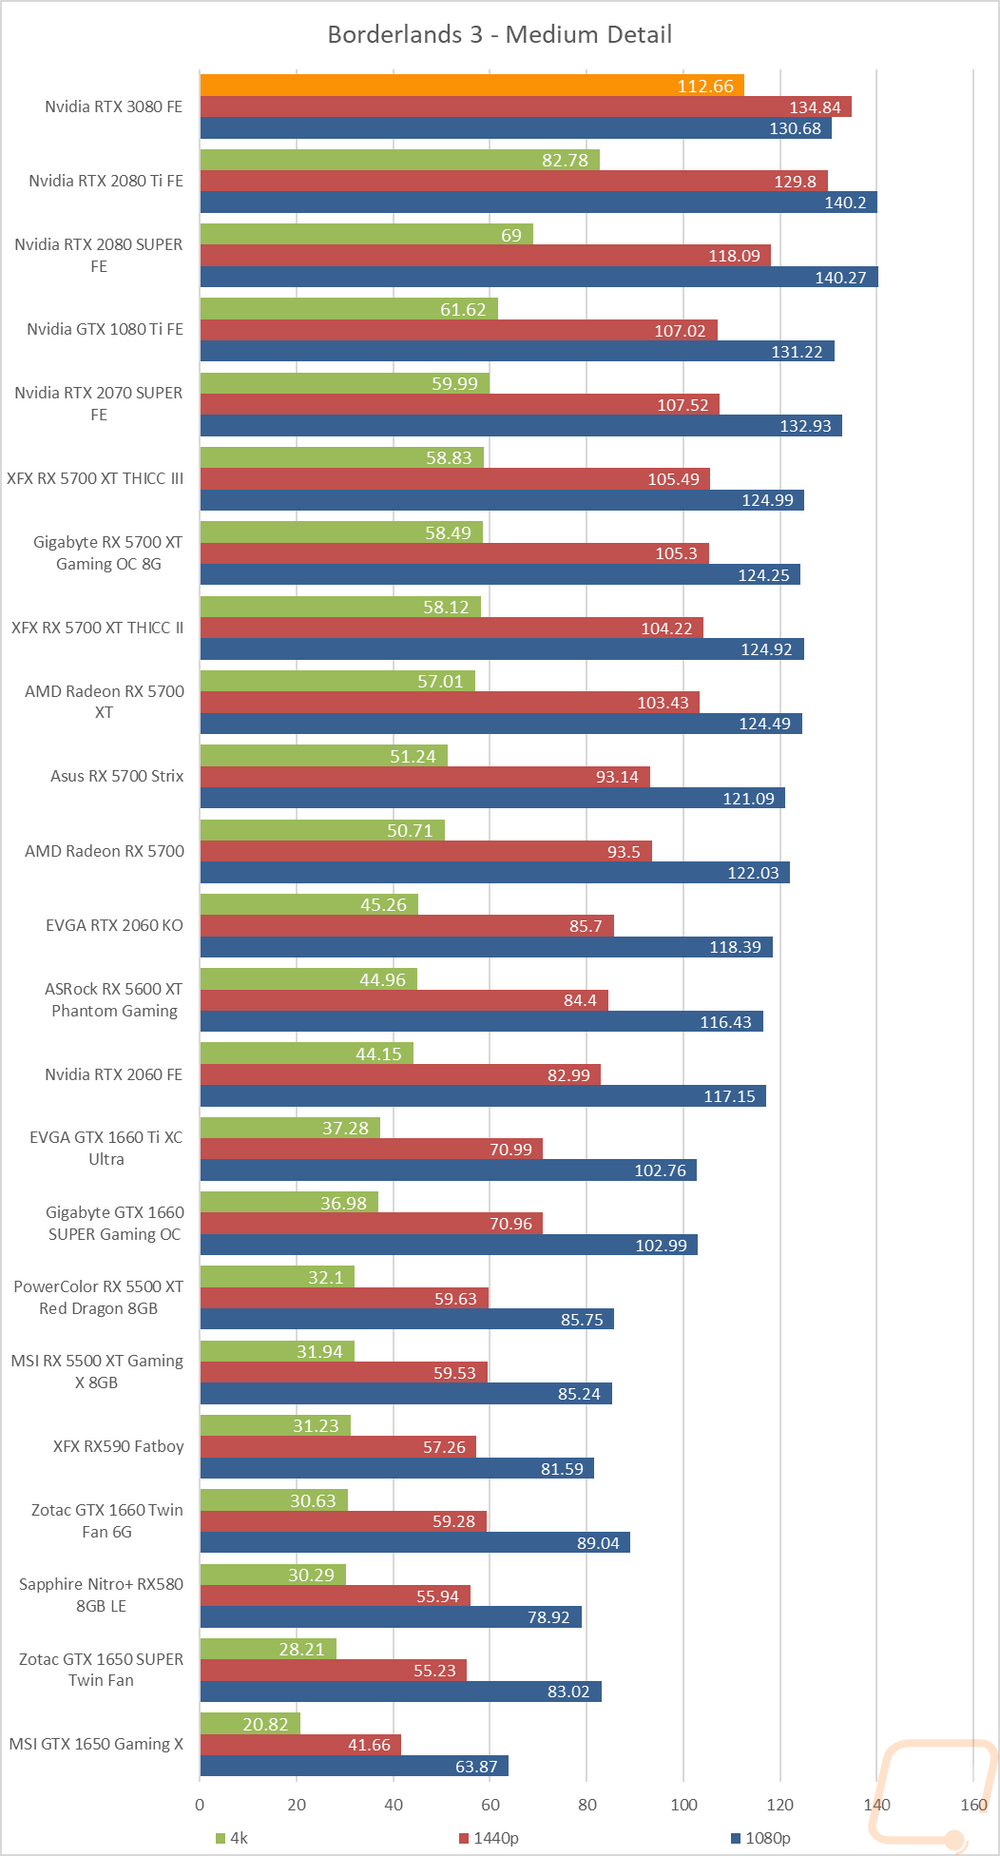
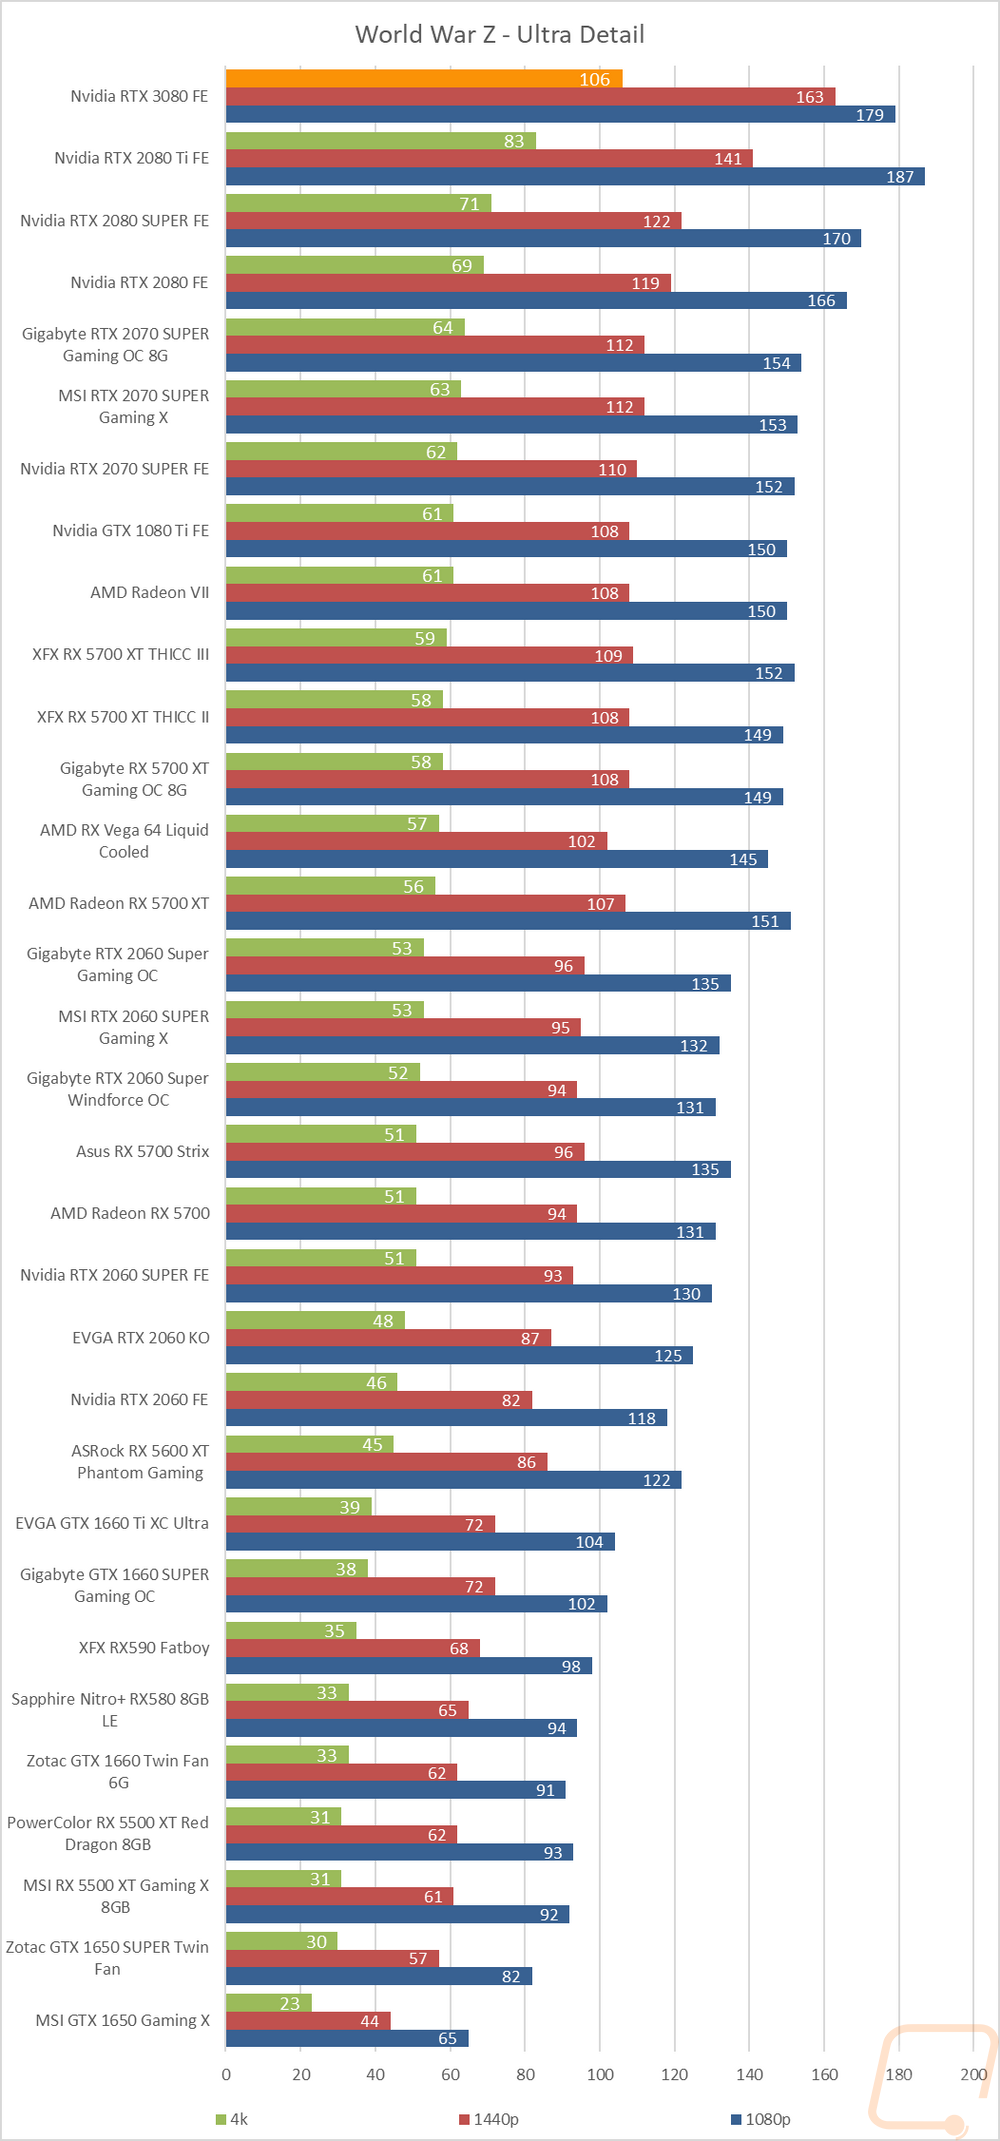
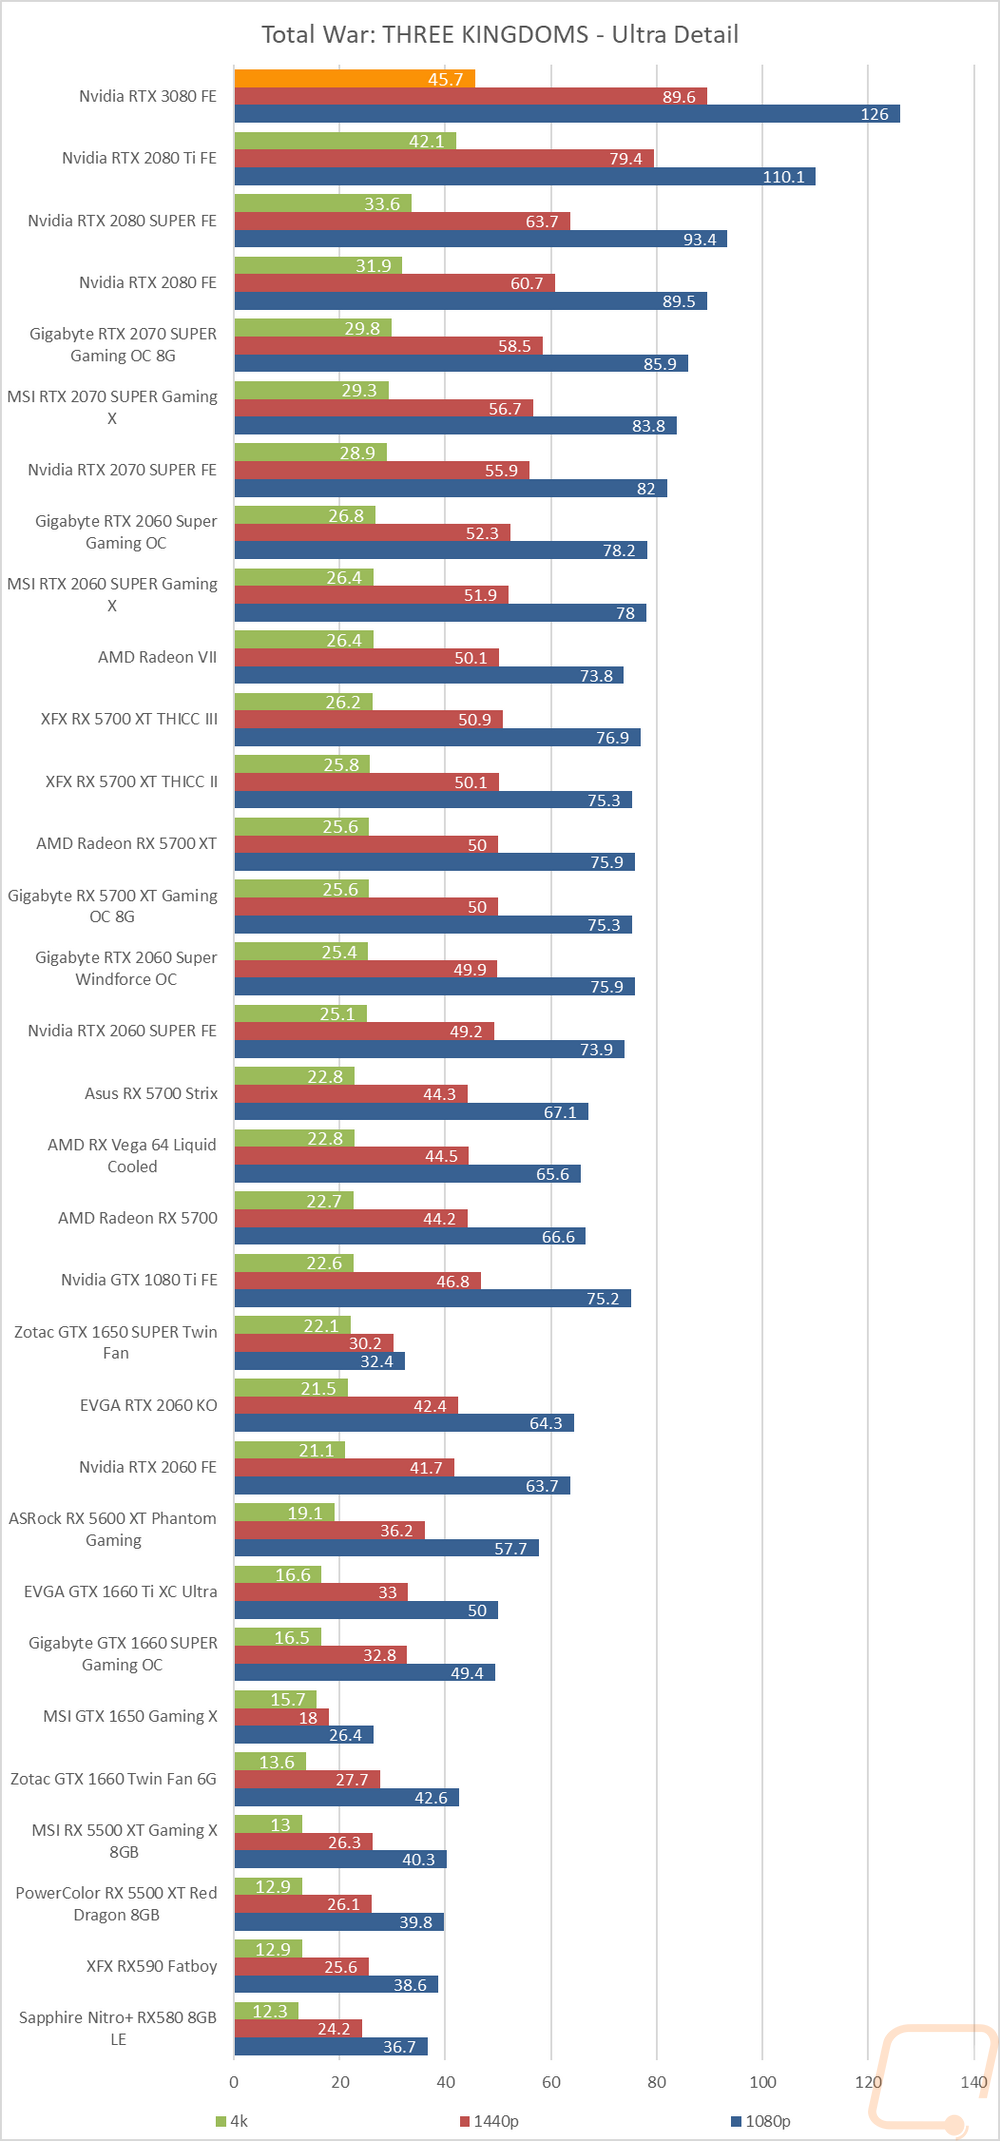
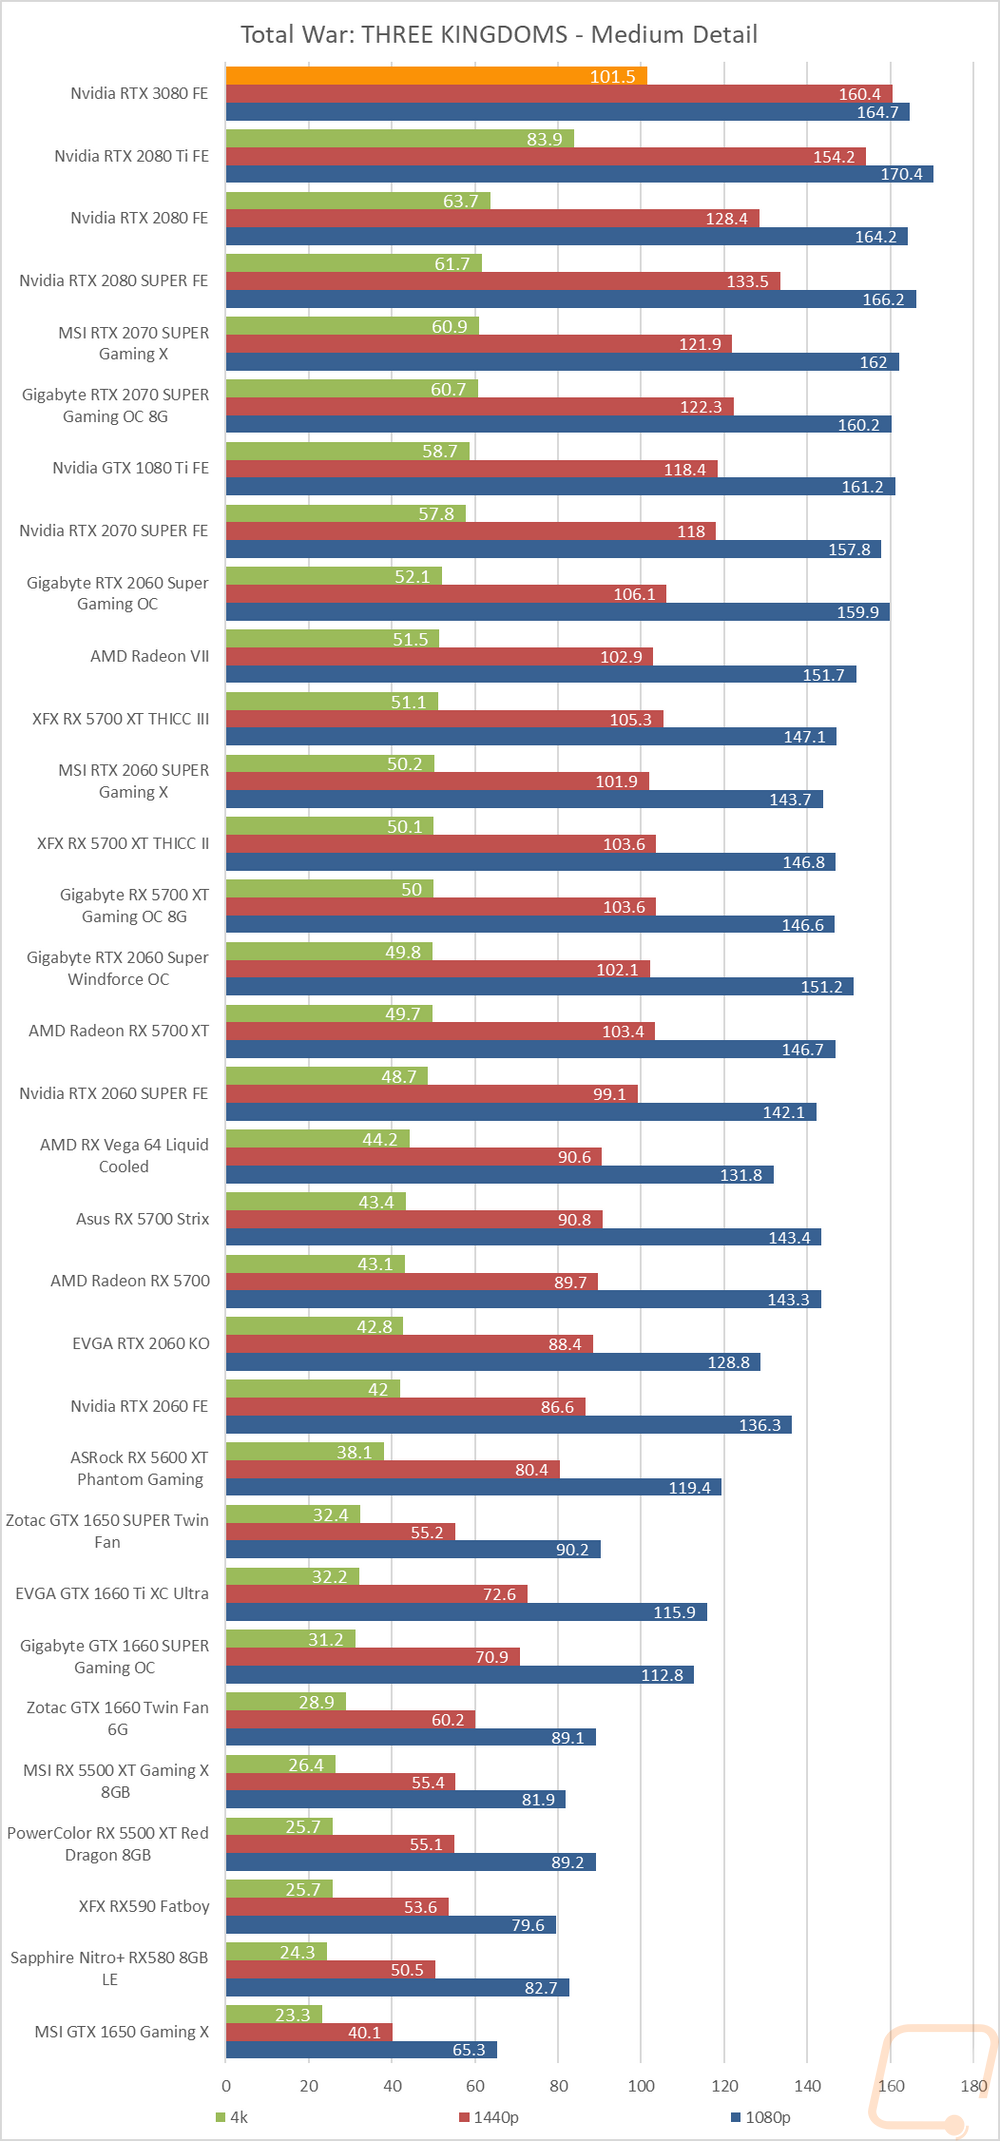
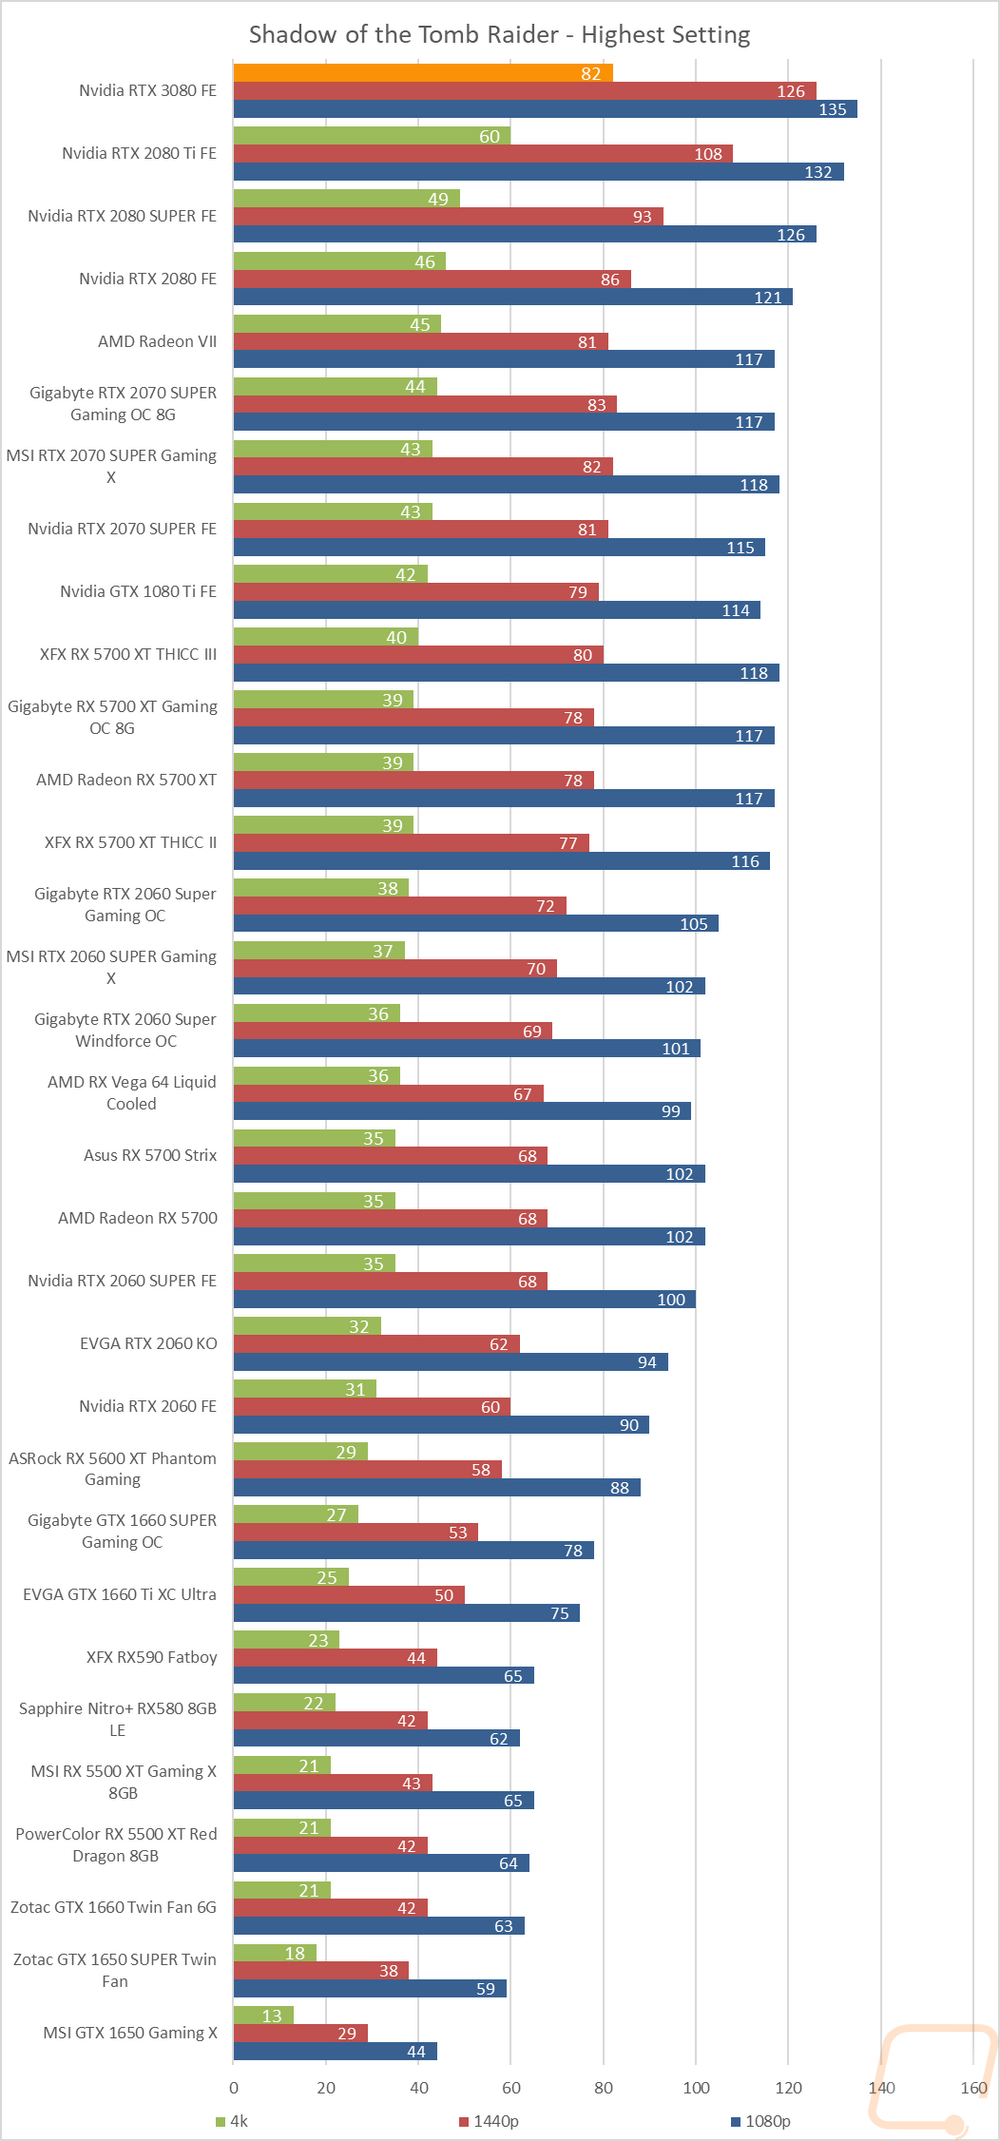
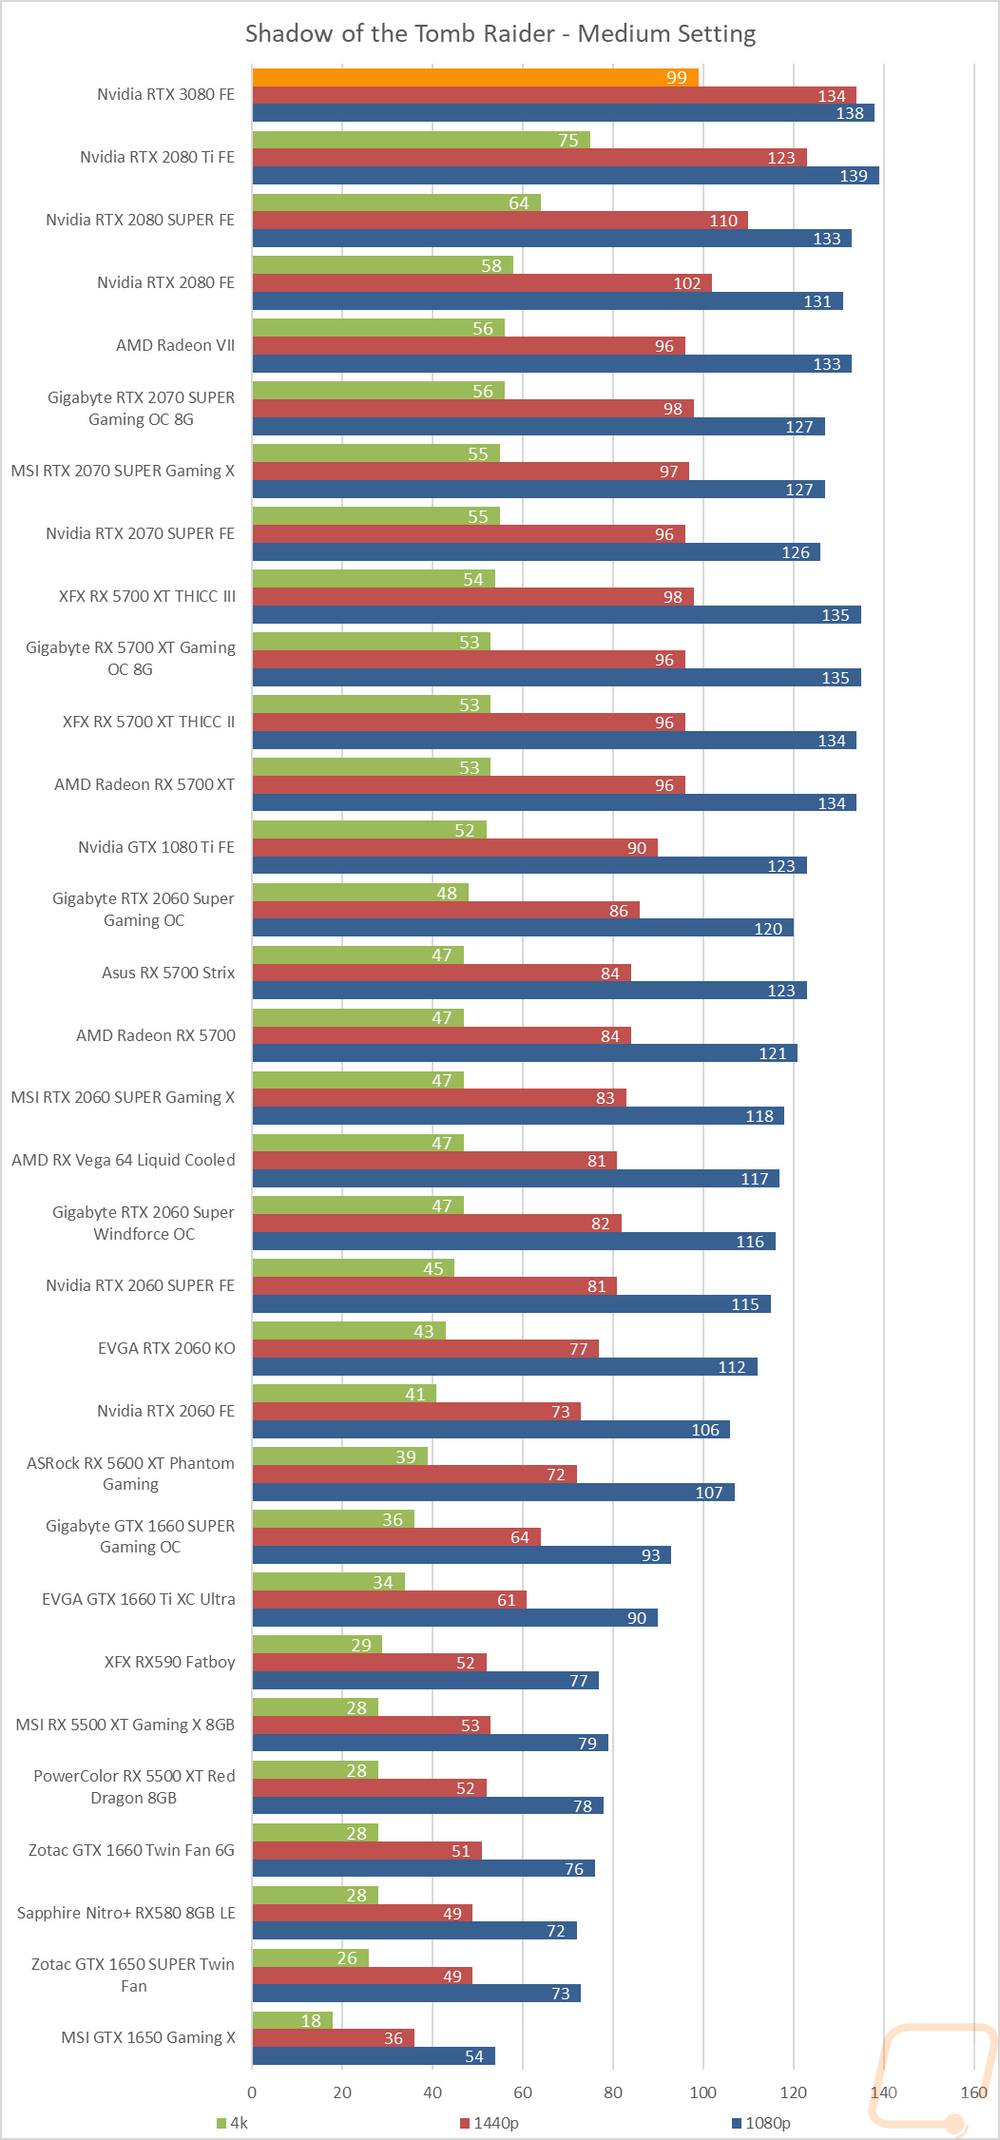
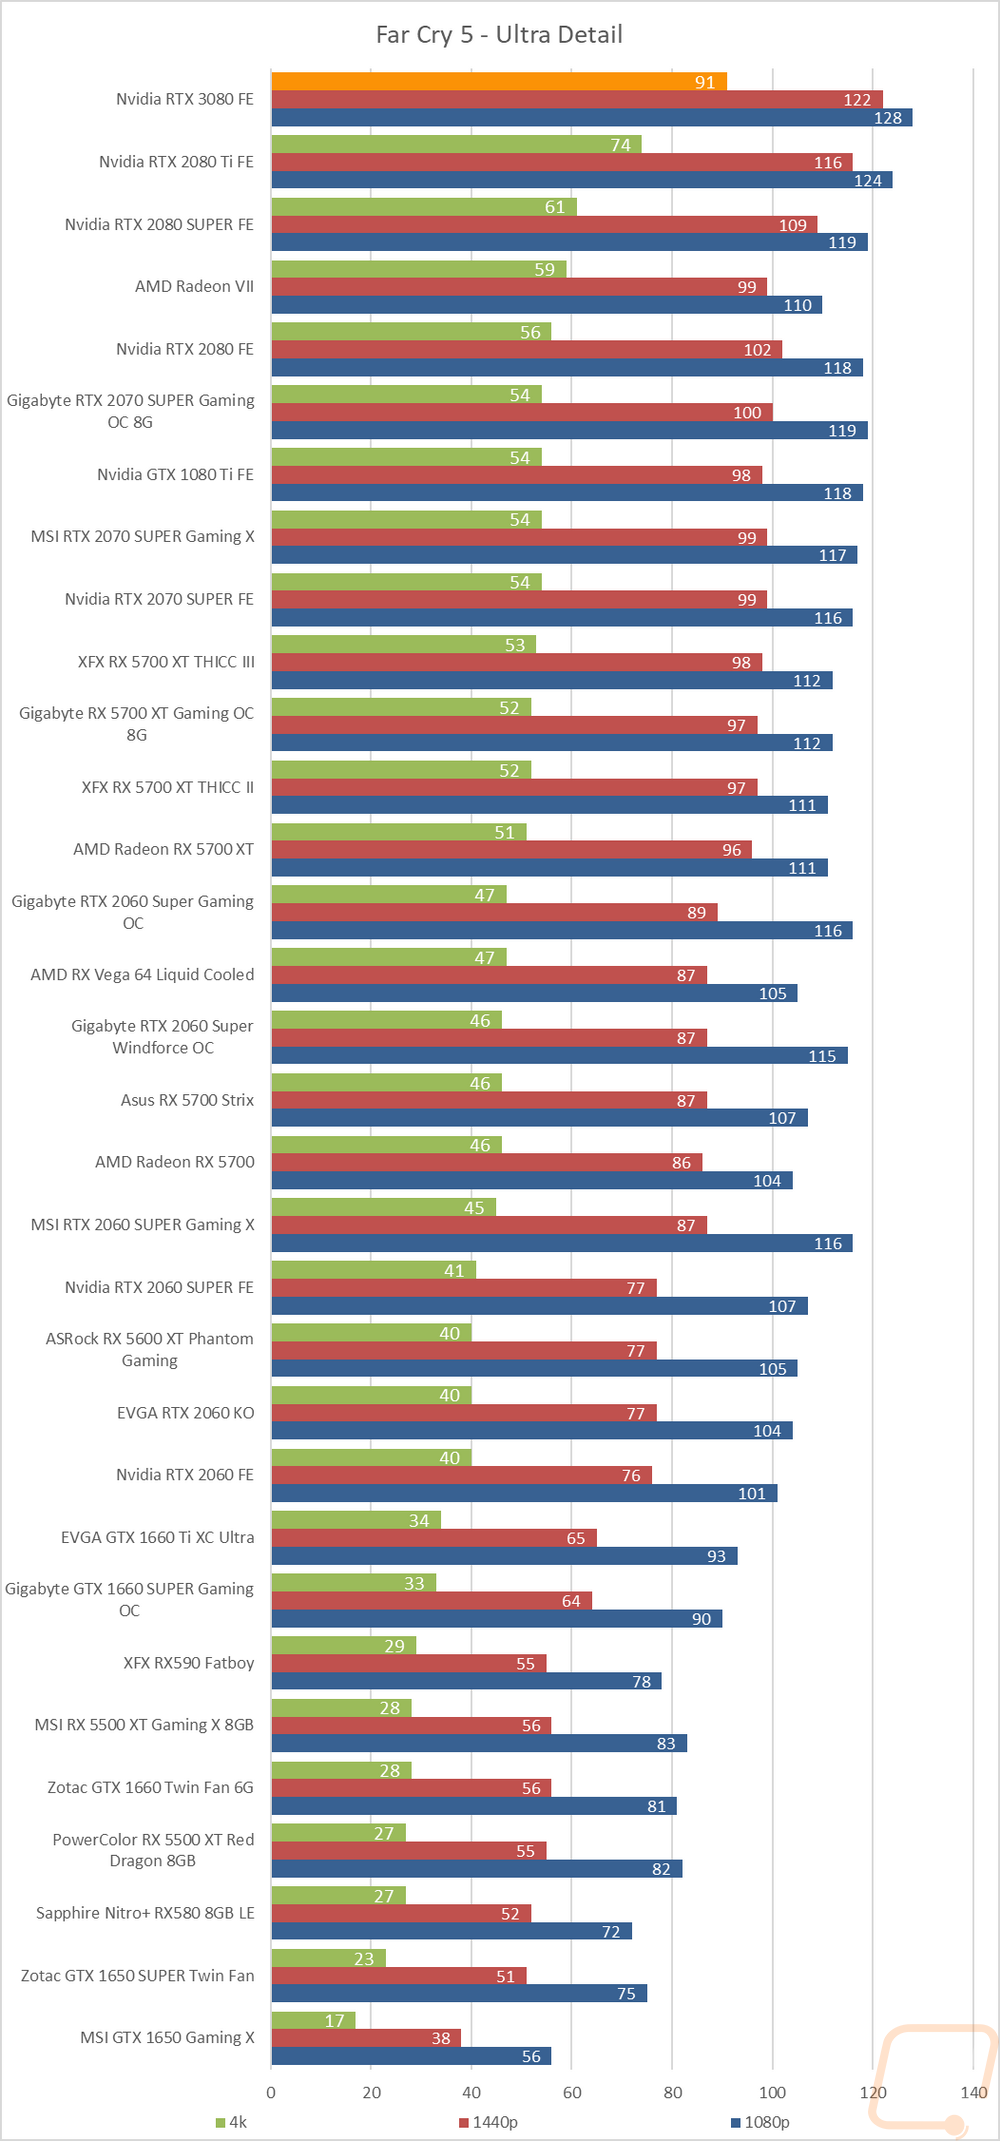
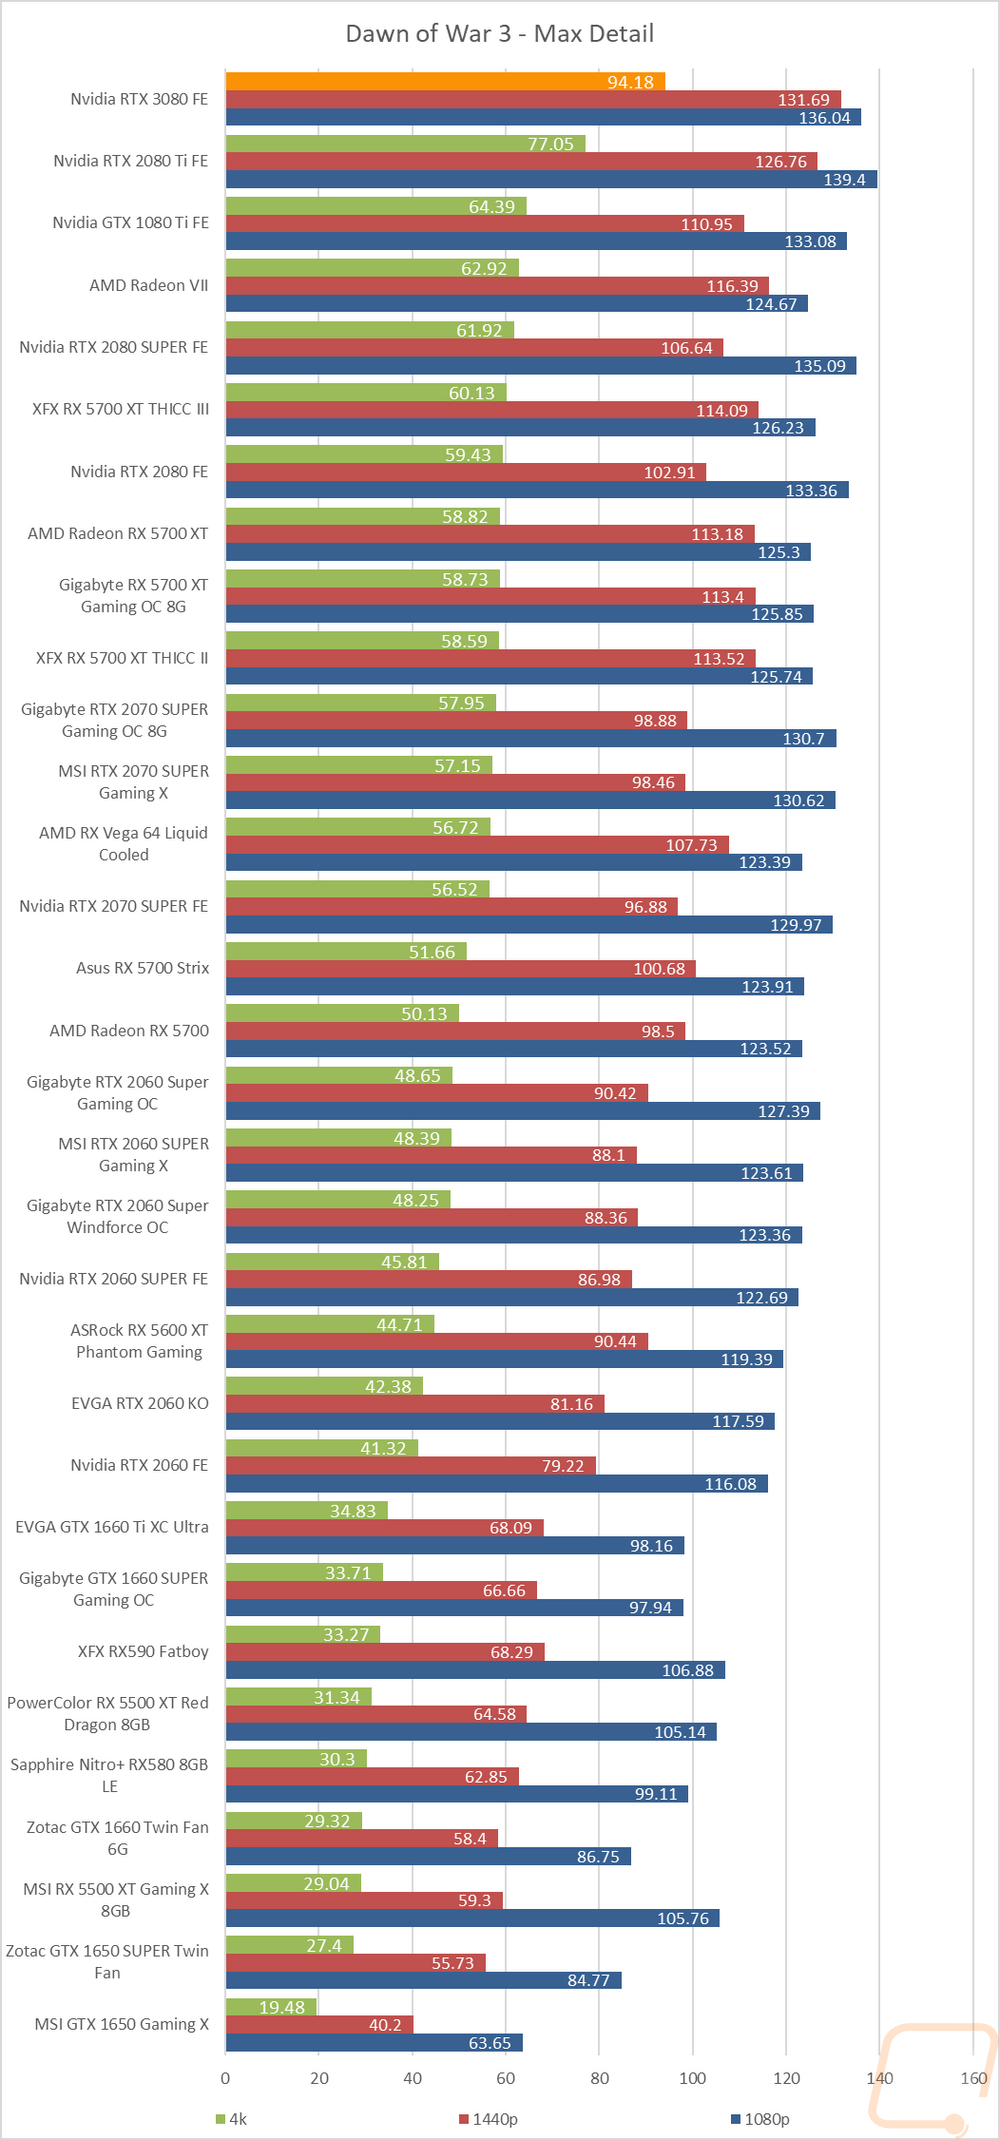
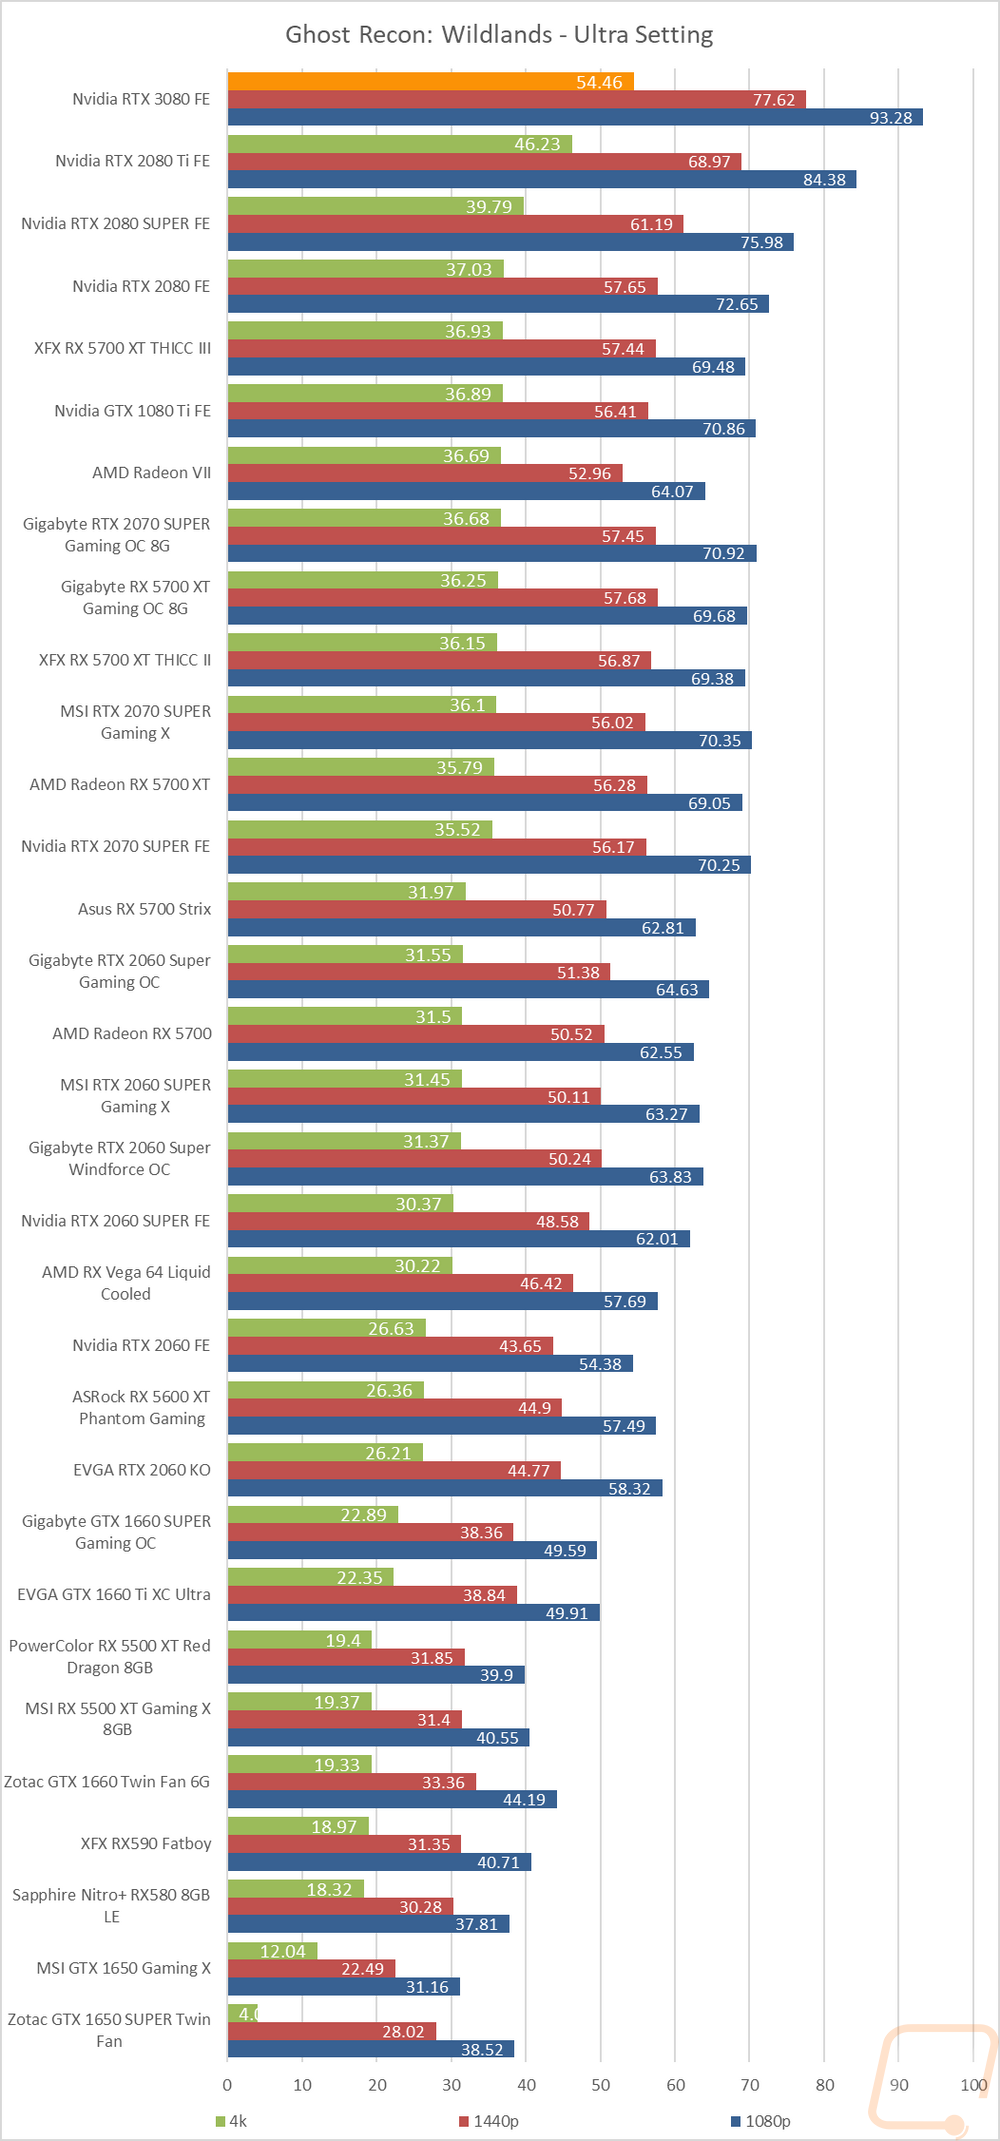
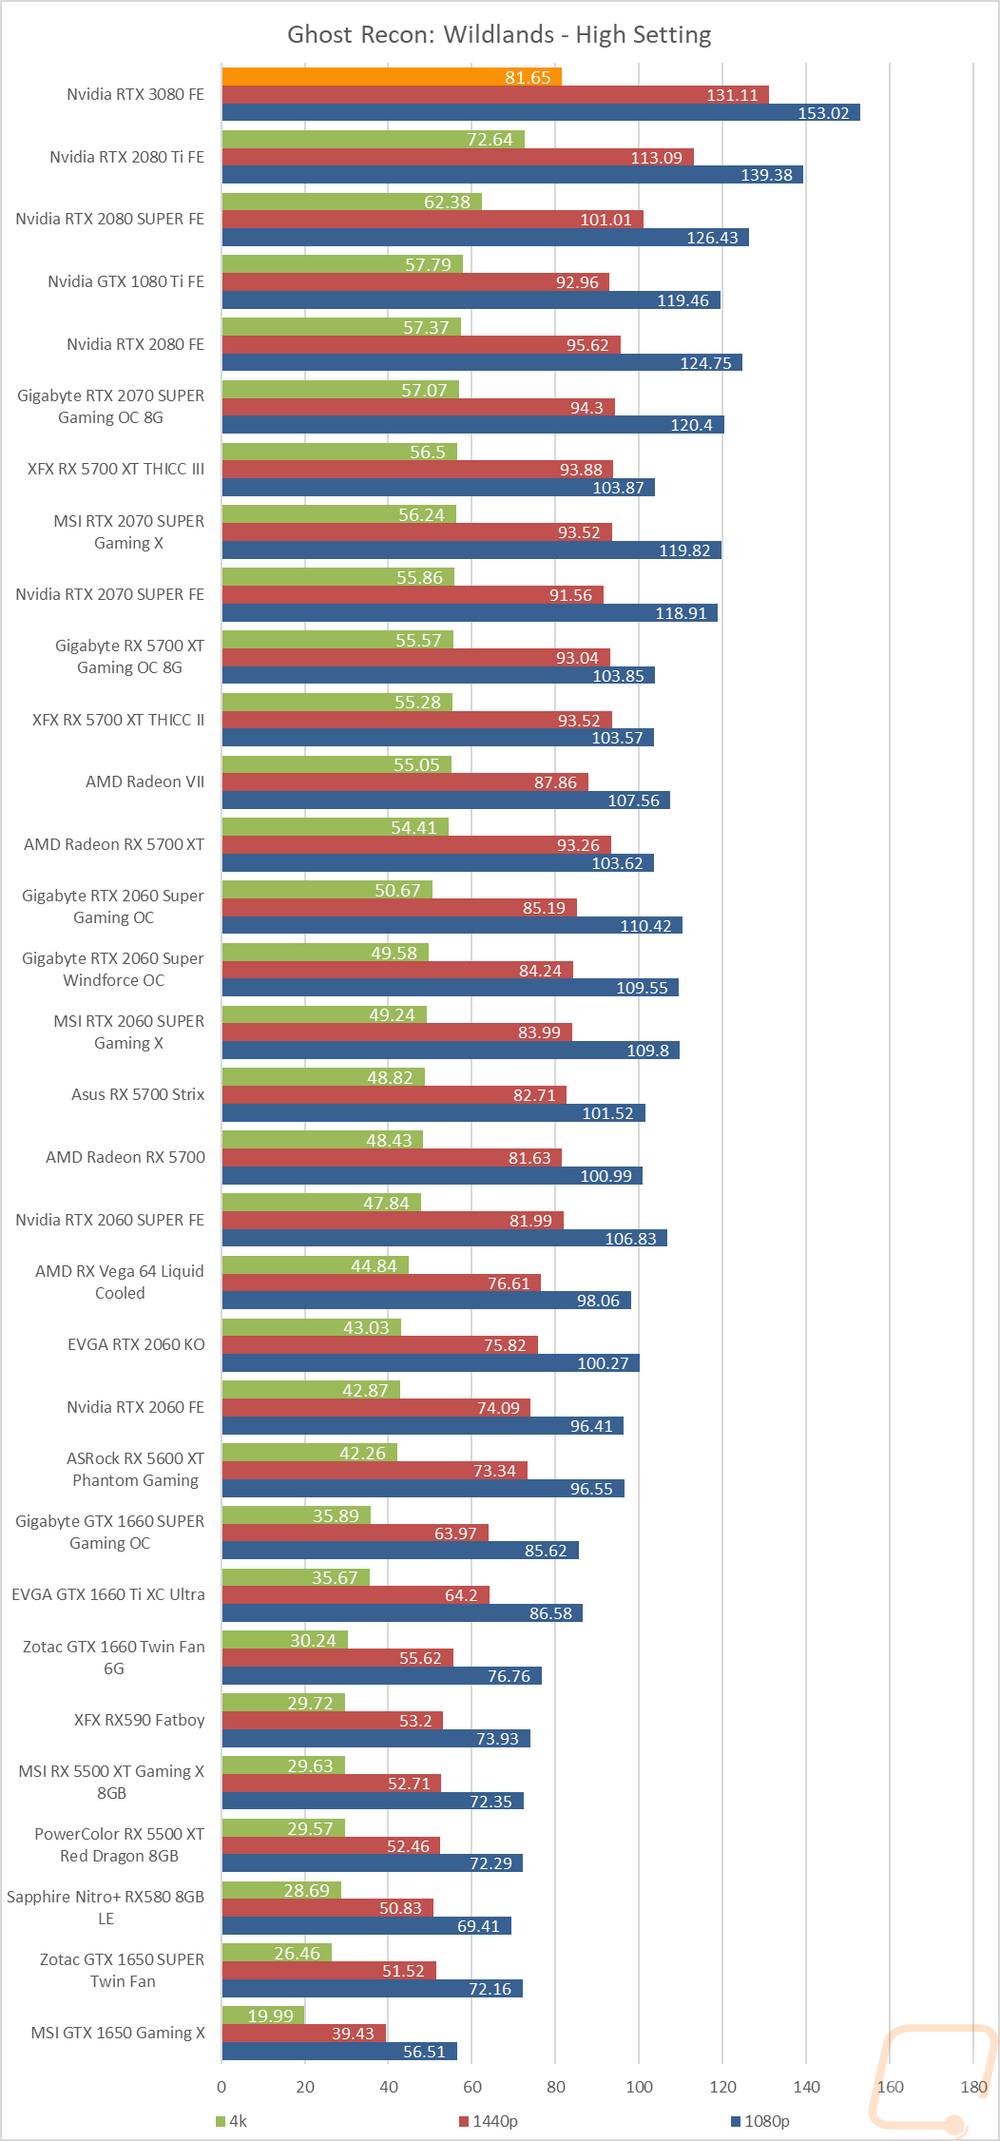
Taking a closer look at the results, the most obvious thing is that the RTX 3080 is at the top of the charts in every single one of our tests, especially in the 4K results which I was focusing on. Like in the synthetic testing, the gap between it and even the next fastest is huge as well. Like in Borderlands the 2080 Ti pulled 48.4 FPS on ultra detail but the 3080 did 67.82. It’s especially interesting to look through and compare the 1080 Ti, 2080 SUPER, 2080 Ti, and the 3080. The 2080 SUPER and the 1080 Ti are basically on par in a lot of the games and the 2080 Ti does stand out from them but the gap between the 2080 Ti and the 1080 Ti is small compared to the 2080 Ti and the 3080. Of the games that didn’t reach 60 FPS at 4K, Total War: Three Kingdoms at ultra detail wasn’t a surprise as it is extremely demanding. Ghost Recon: Wildlands also didn’t make the cut but was a lot closer to 60. Beyond that most of the 60-119, range results were on the higher side at around 90 FPS which leaves a little more room for margin.
Compute Benchmarks
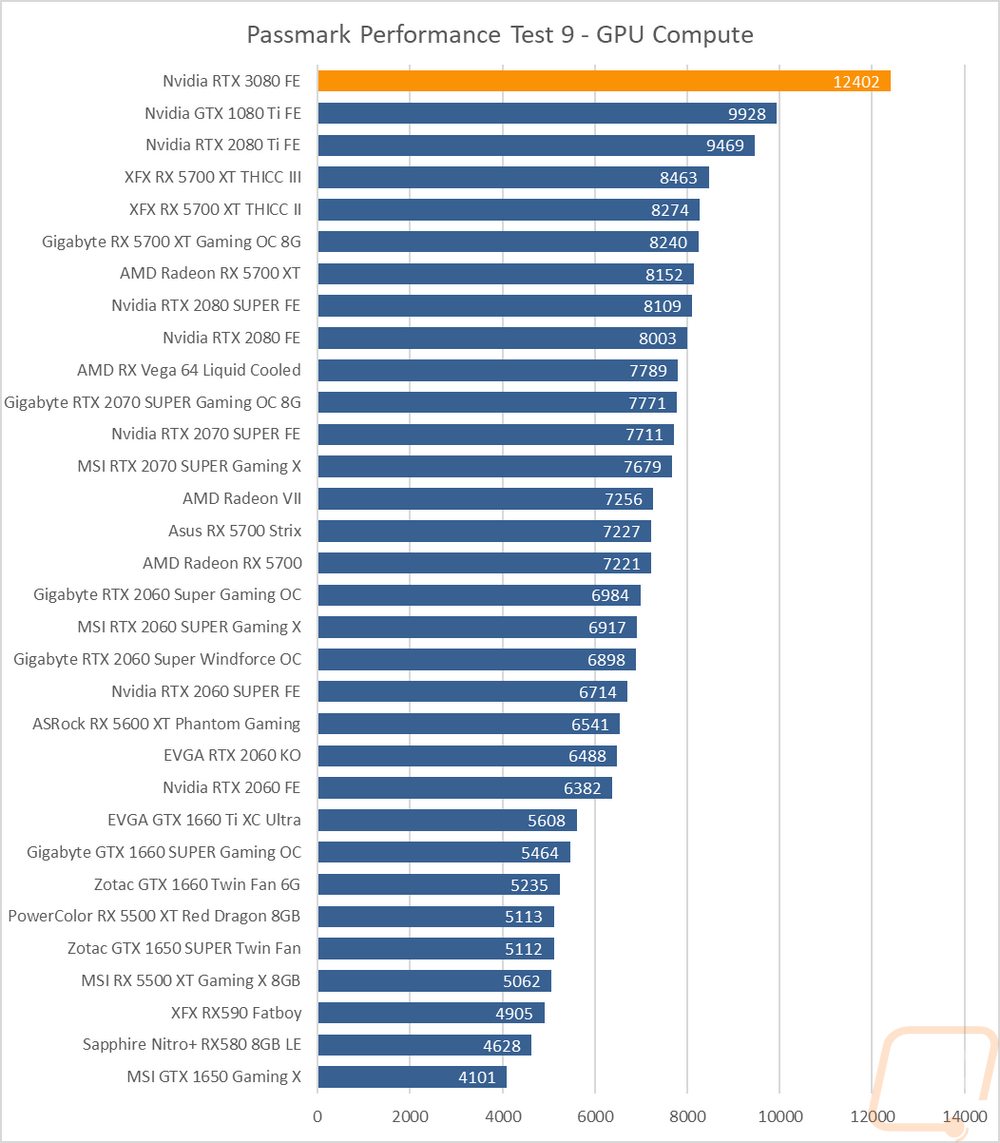
Now some people don’t need a video card for gaming, they need the processing power for rendering or 2D/3D production, or in some cases people who game also do work on the side. So it is also important to check out the compute performance on all of the video cards that come in. That includes doing a few different tests. My first test was a simple GPU Compute benchmark using Passmark’s Performance Test 9 and the RTX 3080 is surprise surprise at the top of the chart. The GTX 1080 Ti was still a great performer here and came in second but the 3000 point gap between the 2080 Ti and the 3080 here is a big step up and might even have coin miners taking notice.
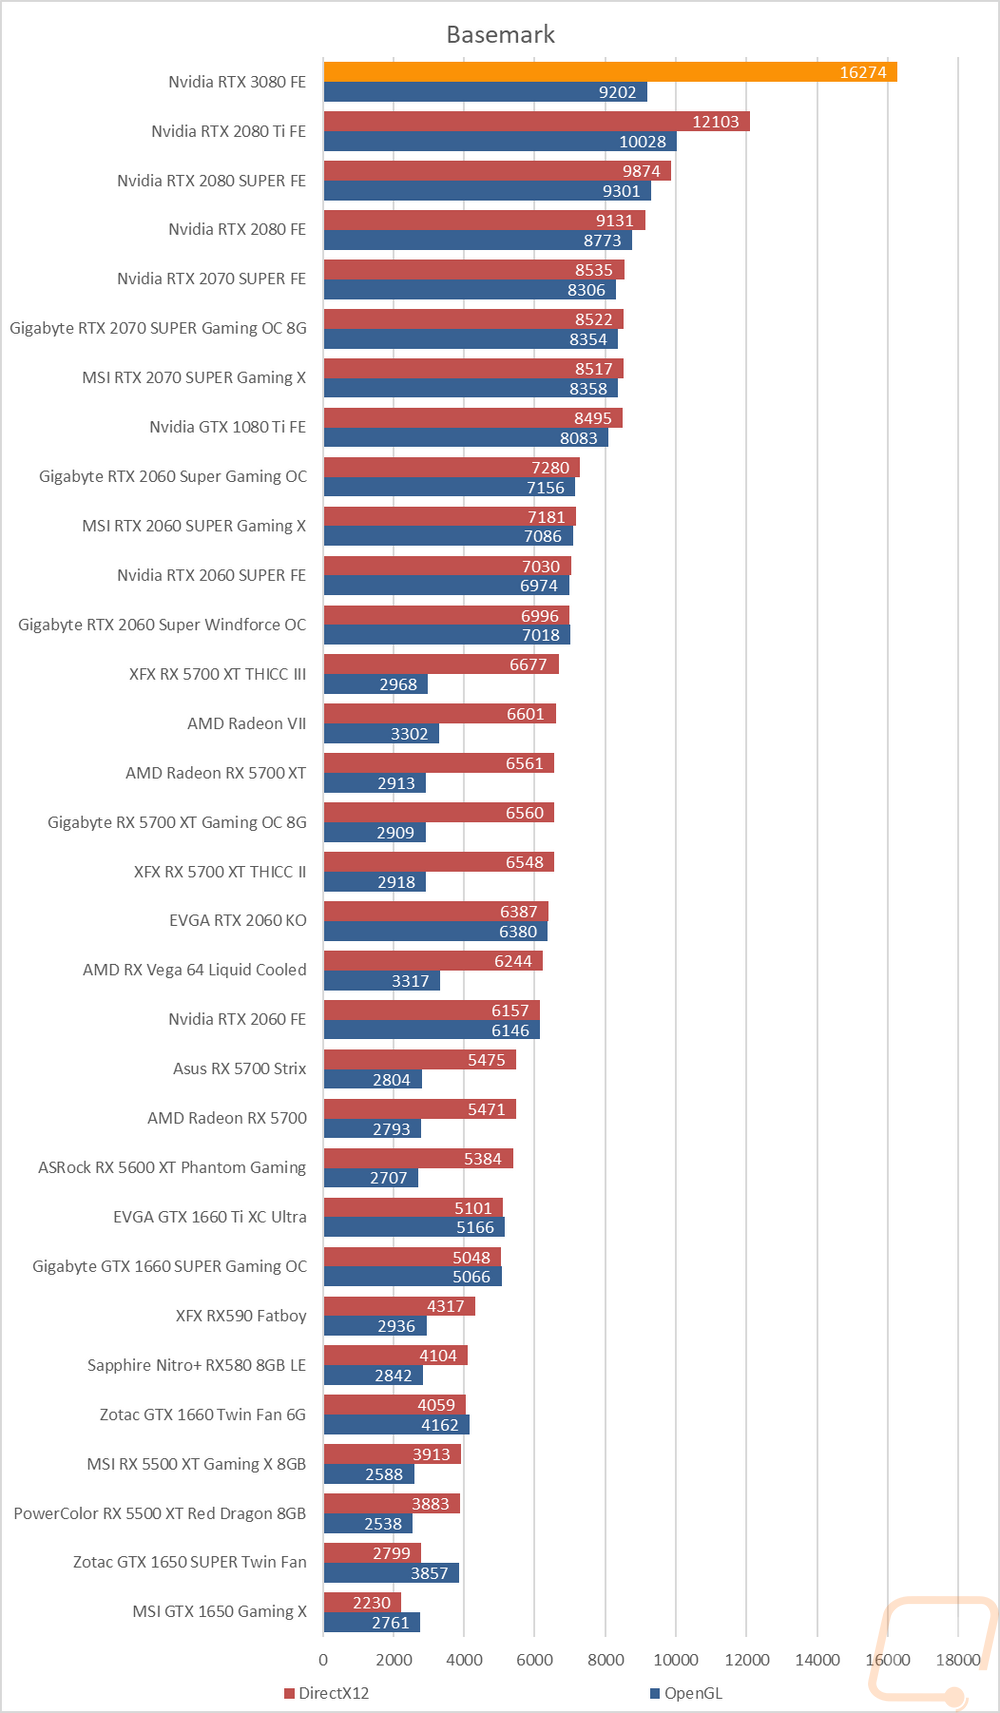
Next, I took a look at performance using Basemark. With this test, I took a look at DirectX12 and OpenGL performance. The DirextX12 performance for the 3080 was enough to nearly break our chart but its OpenGL performance wasn’t even enough to pass the 2080 SUPER surprisingly.
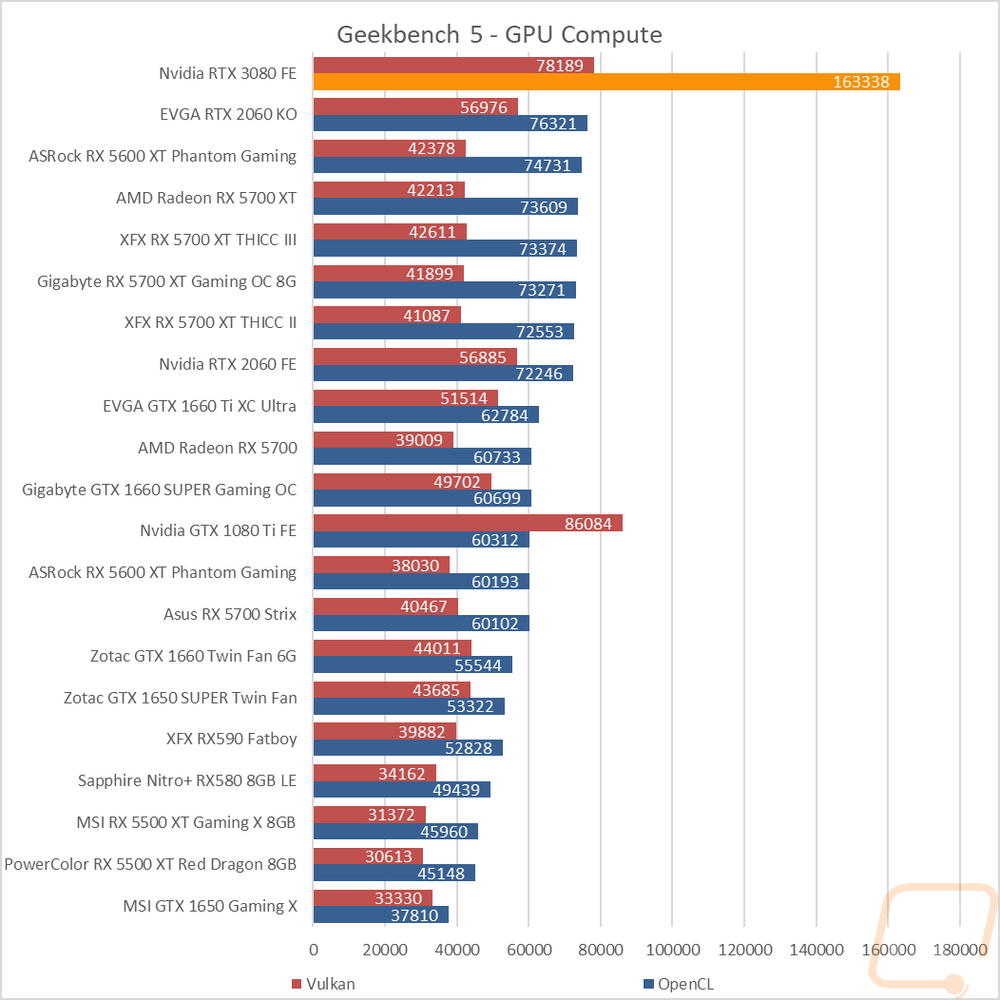
For Geekbench 5 I took a look at Vulkan and OpenCL and both are impressive though with Vulkan the 1080 Ti was still faster. But in OpenCL nothing came close, in fact, the 3080 was over twice as fast as everything else.
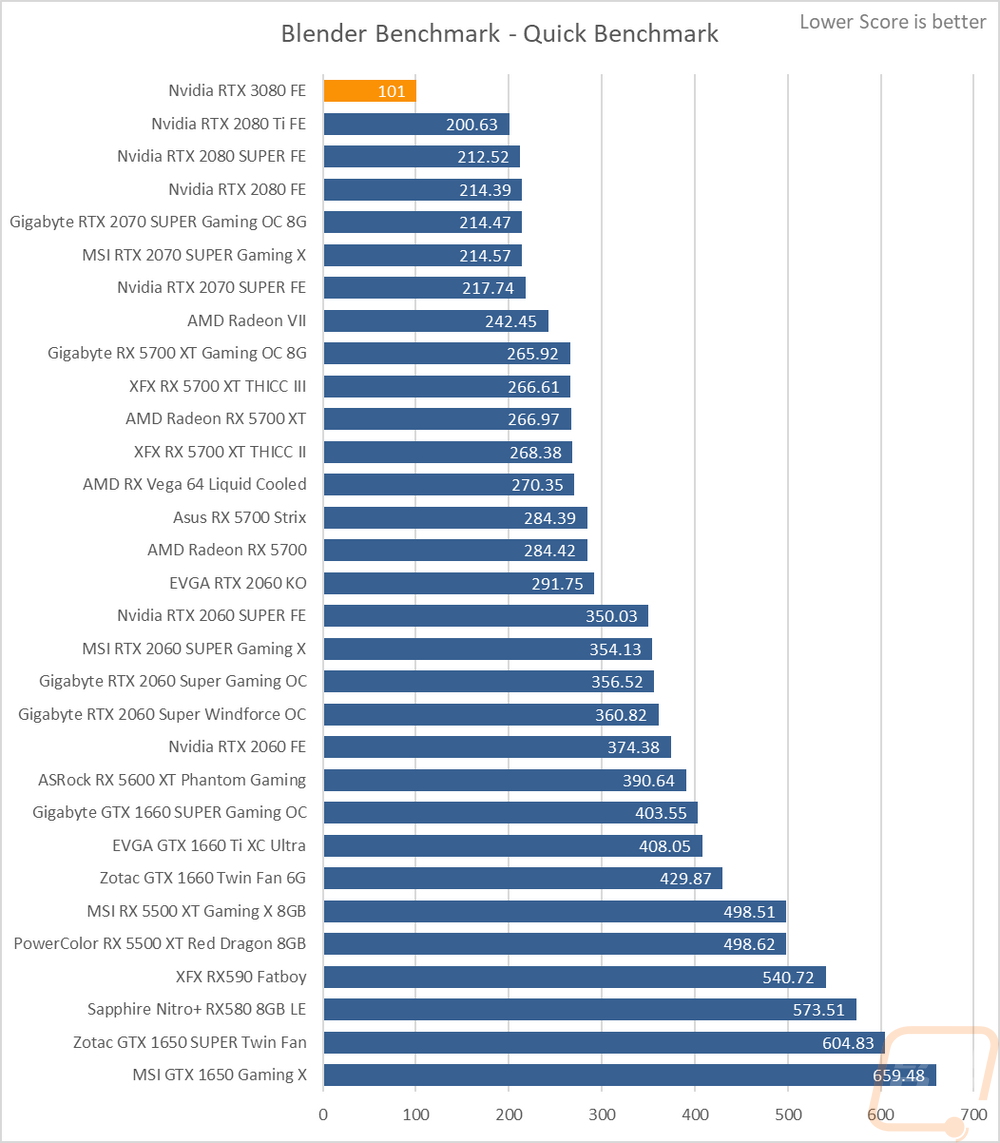
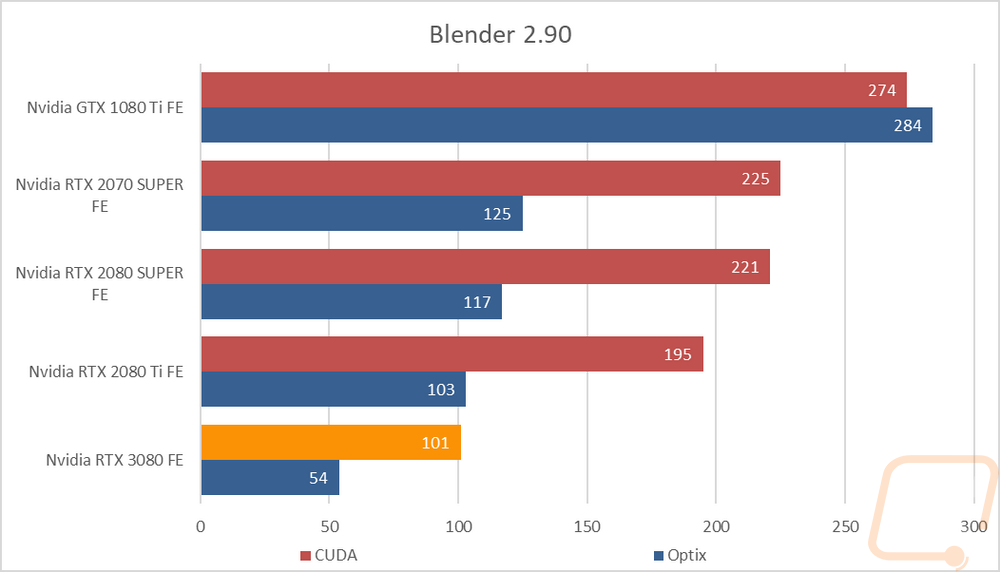
Then for my favorite compute test Blender I ran a few tests. Comparing with our past results, the 3080 was nearly twice as fast as the RTX 2080 Ti which is crazy. But I wanted to also check out the addition of Optix rendering which uses Nvidia’s ray tracing engine and API to render things. I tested this with the RTX 3080, RTX 2080 Ti, RTX 2080 SUPER, RTX 2070 SUPER, and I have the GTX 1080 Ti for reference as well. The 1080 Ti was slower than the 2070 SUPER in the CUDA test and when rendering using ray tracing it still performed okay but the result was a little slower. All of the RTX cards on the other hand saw a big-time improvement using Optix which is awesome in itself and a great way to leverage those ray-tracing cores even if you don’t plan on gaming. But even using CUDA the RTX 3080 was fast at 101 seconds which was faster than the 2080 Ti even with Optix. The 3080 using Optix then nearly cut that in half at 54 seconds.
RTX and DLSS
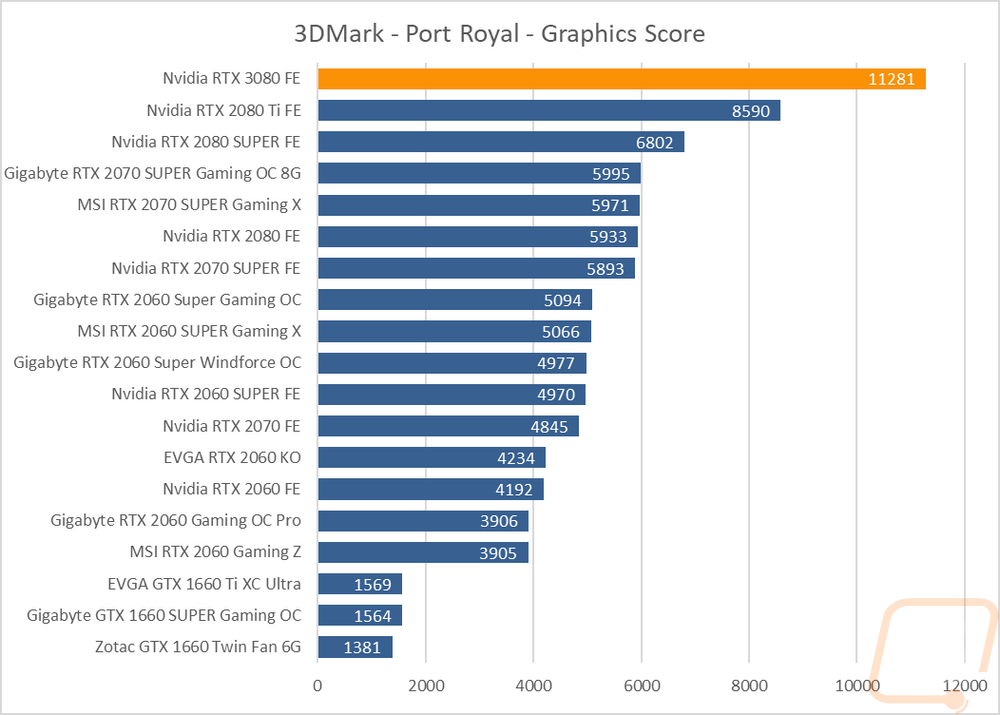
Because of Nvidia’s continued push to improve both the RT and Tensor cores on their RTX lineup I did want to do a little more testing on what you can expect to see performance-wise when you get the option to use them. For the Ray Tracing cores this means turning on RTX and for the Tensor cores, the best example of this is DLSS or DLSS 2.0. We have a few tests to look at these starting with the 3DMark Port Royal benchmark that takes a look at ray tracing performance. The RTX 3080 tops this chart with 11281 points over the RTX 2080 Ti at 8590. Below that you can see how other cards are all in groups like with the RTX 2070 SUPER and the RTX 2080, RTX 2070, and the RTX 2060 SUPER, and so on.
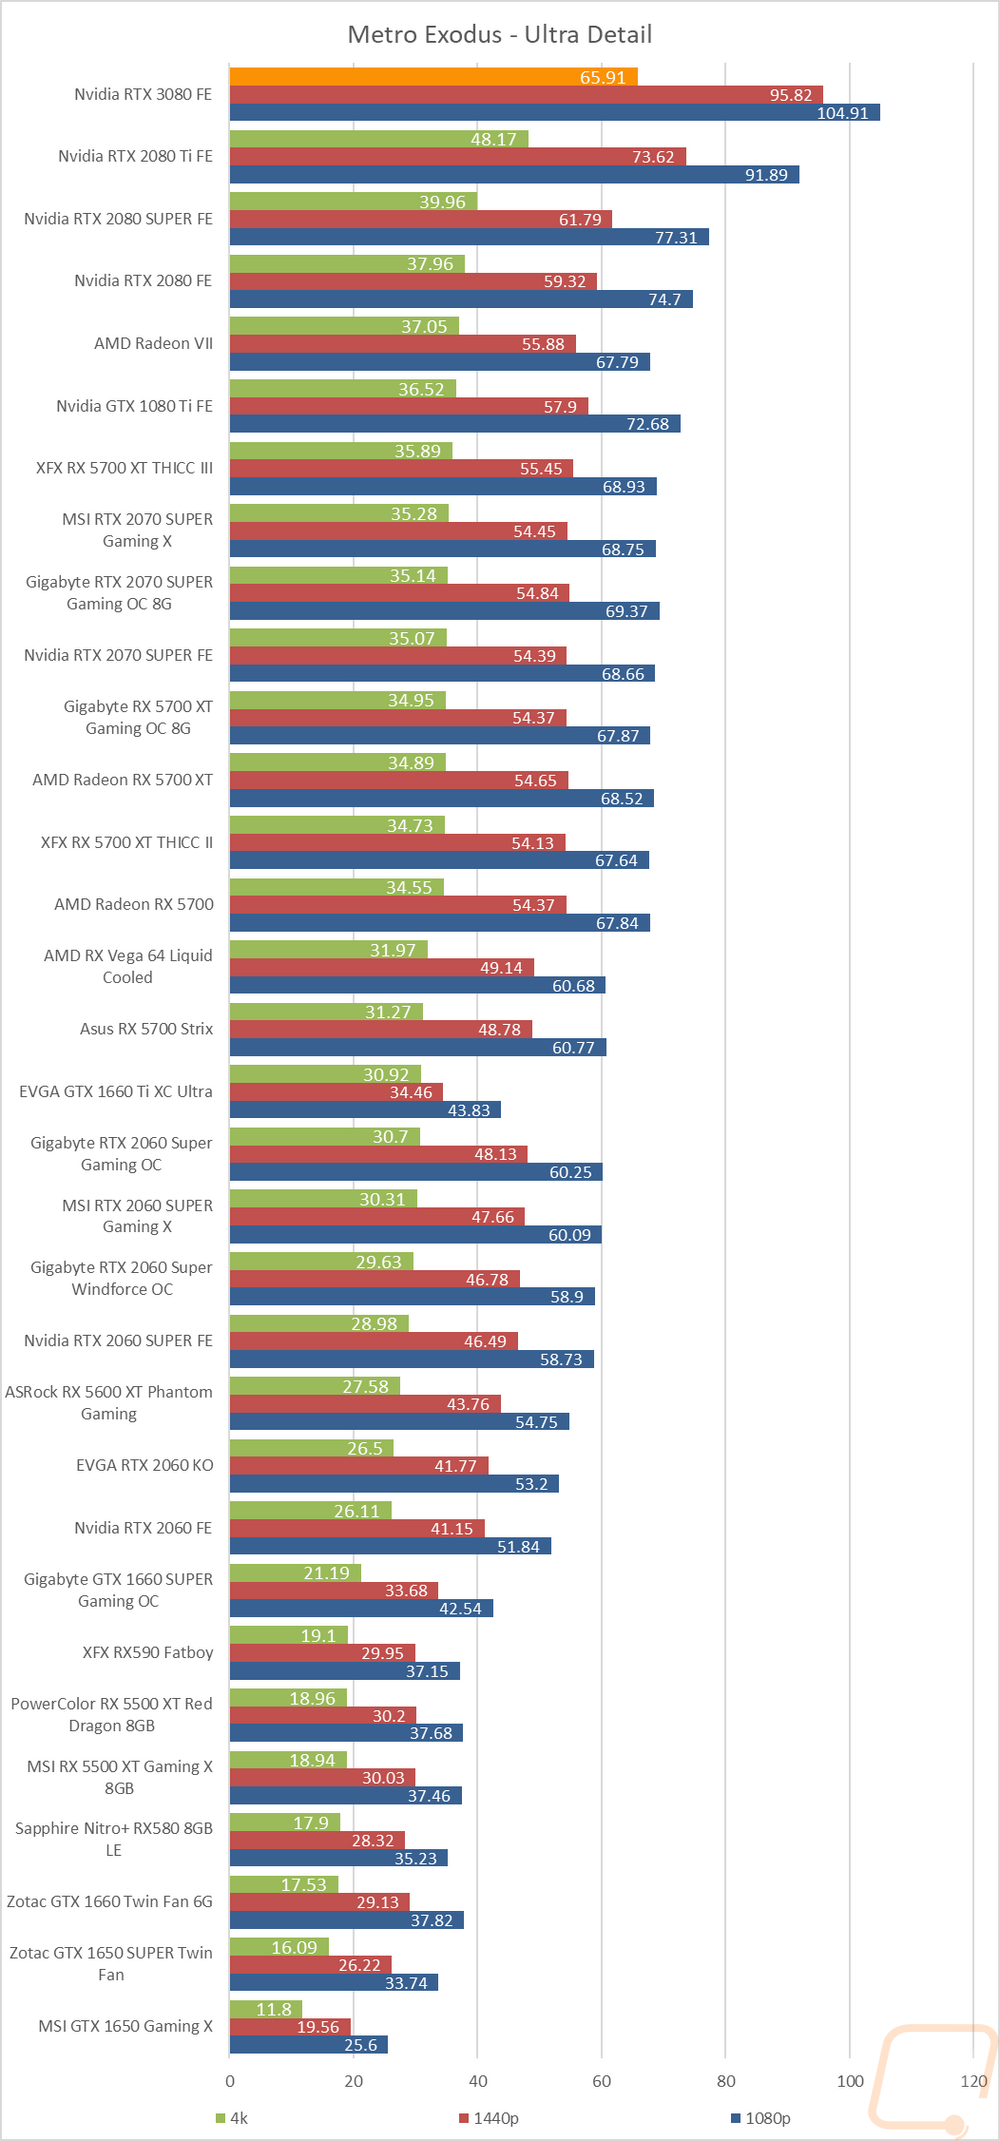
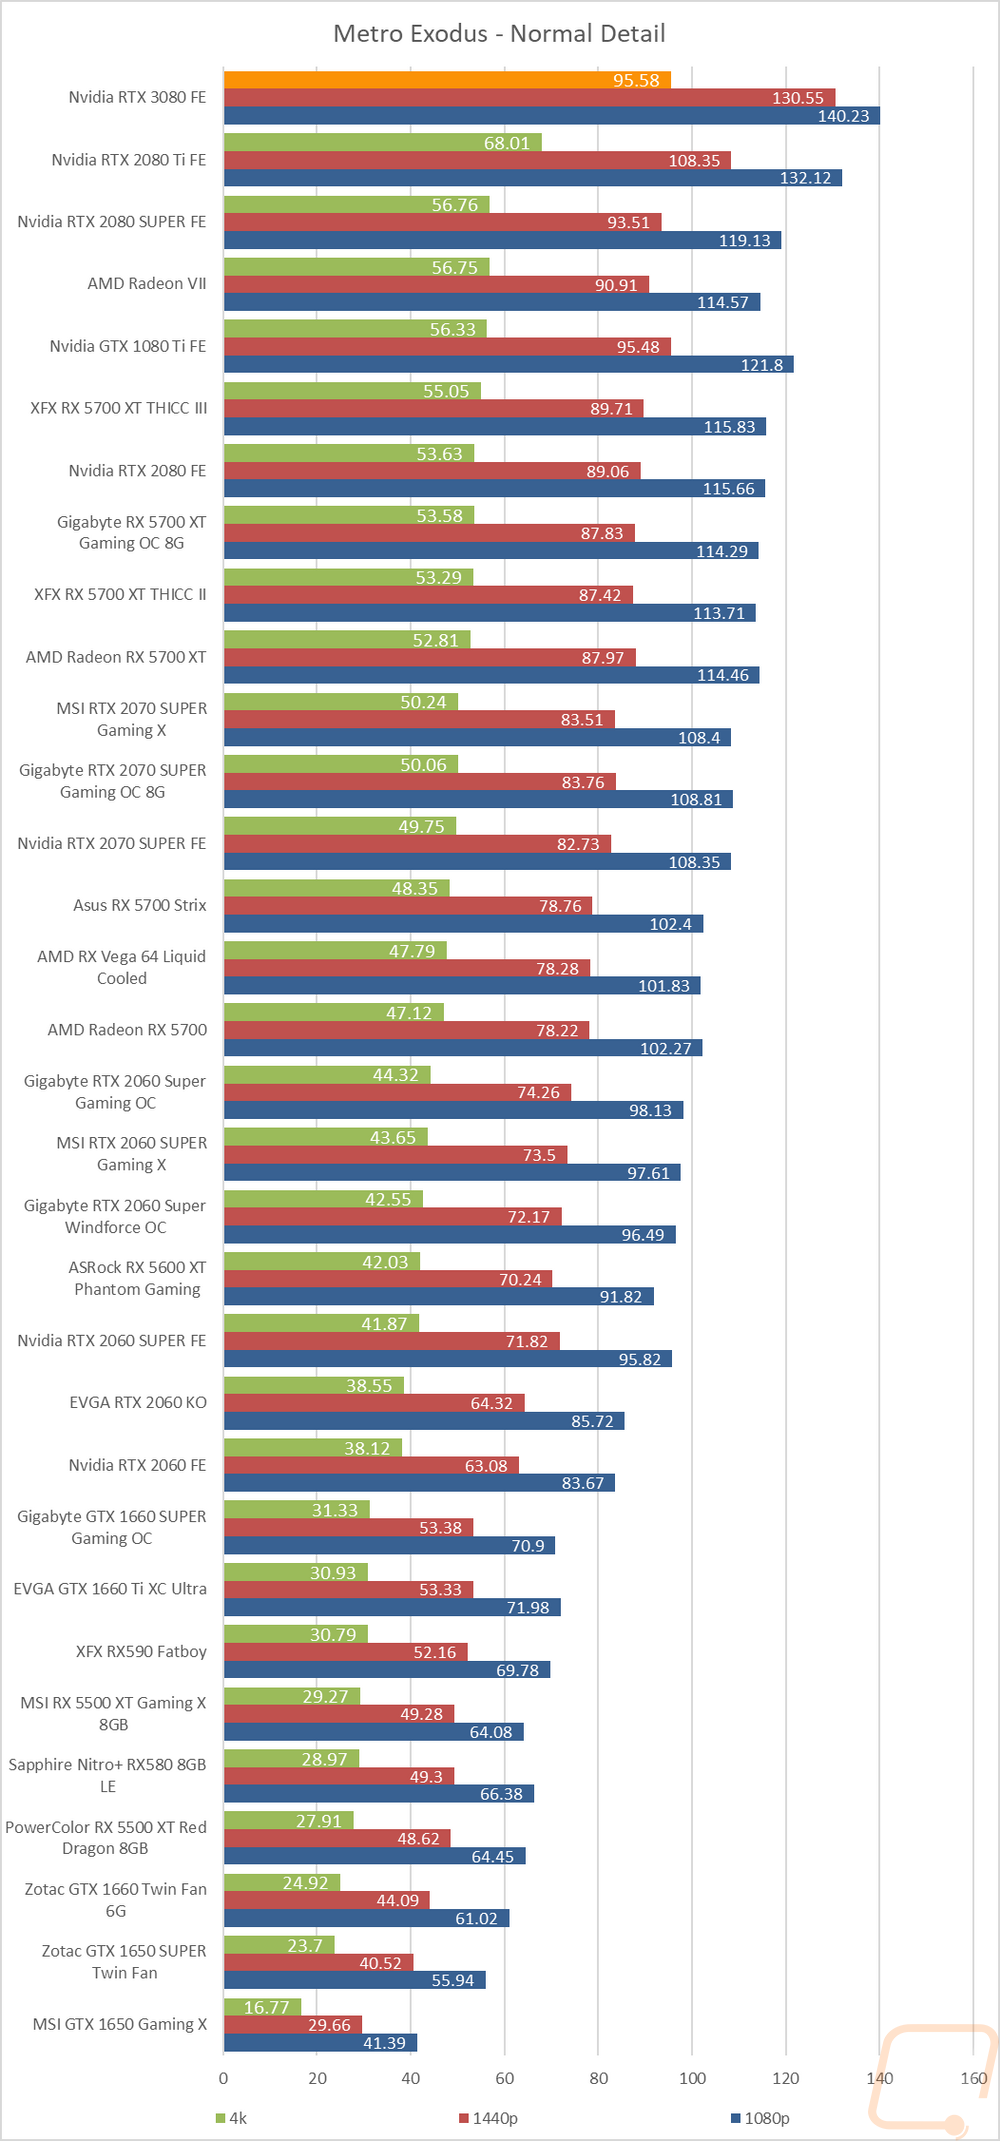
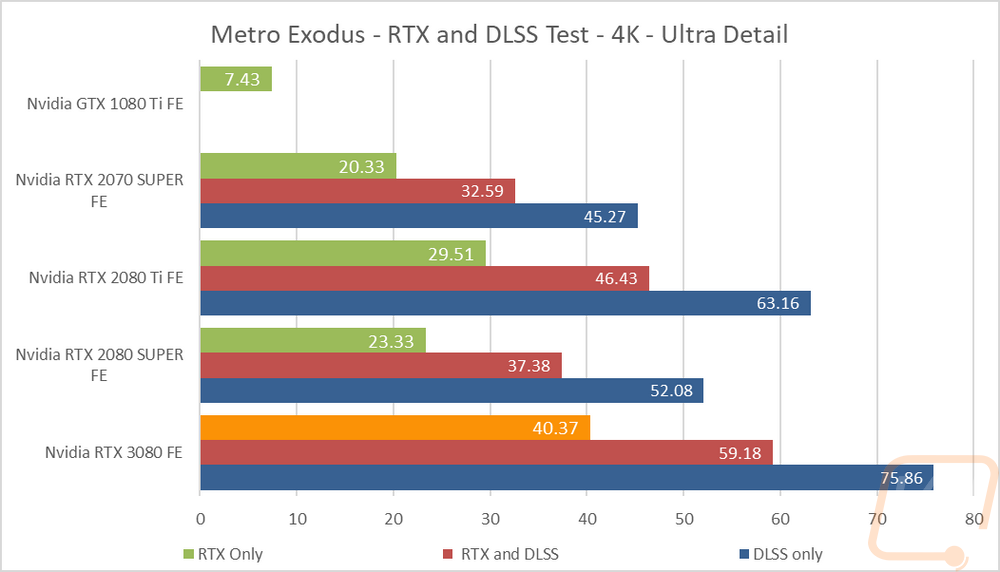
One of our in-game tests is Metro Exodus and while doing that testing I ventured out of our normal benchmarks when retesting the RTX 2080 Ti, RTX 2080 SUPER, RTX 2070 SUPER, and even the GTX 1080 Ti along with the RTX 3080. The GTX 1080 Ti doesn’t support DLSS at all so the only result I have for it is the one RTX only test but I wanted to include it to show just how much of an improvement the RTX cards have over the fastest card available without ray tracing cores. Even the 2070 SUPER is three times as fast. But the RTX 3080 is the only one playable with that high of detail and ray tracing on. Turning on DLSS shows a big frame rate improvement while still having RTX on and the RTX 3080 nearly reaches a smooth 60 FPS. Even on the 2070 SUPER, you can see turning it on helps bring the ray tracing up to an FPS that is playable. Then I also tested with the ray-tracing off and DLSS still on to see how fast the performance was and the 2080 jumped up to 75 FPS.
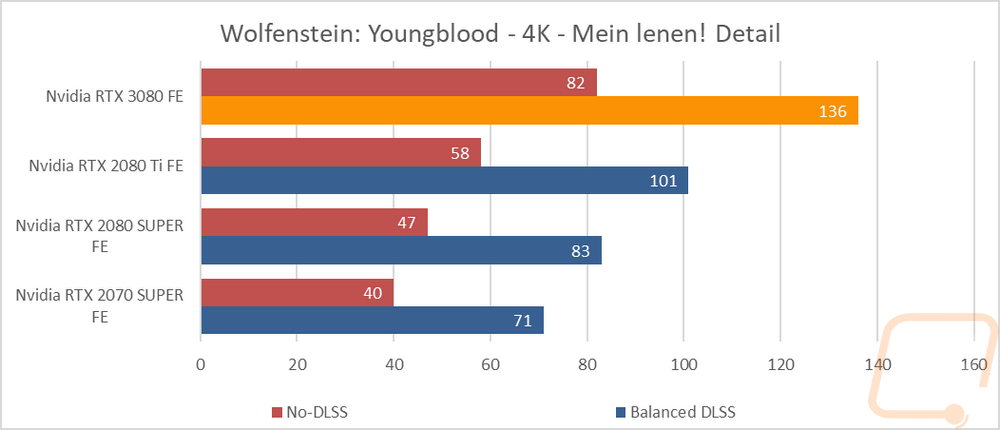
In the new Wolfenstein: Youngblood I tested performance at 4k on the highest detail setting which they call Mein Lenen!. For this I tested with DLSS turned off then again with it on. They have quality, balanced, and performance settings for the DLSS and I ran the in the middle balanced setting. You can see the RTX 3080 jump from 82 FPS which is still good up to an amazing 136 FPS when running DLSS. The RTX 2080 Ti was similar, going from just under 60 FPS up to 101. Then on the two SUPER cards, you can see it took them from a playable but not smooth 40 and 47 FPS up into the smooth range at 71 and 83 FPS. Being able to go from playable but not smooth to smooth is huge
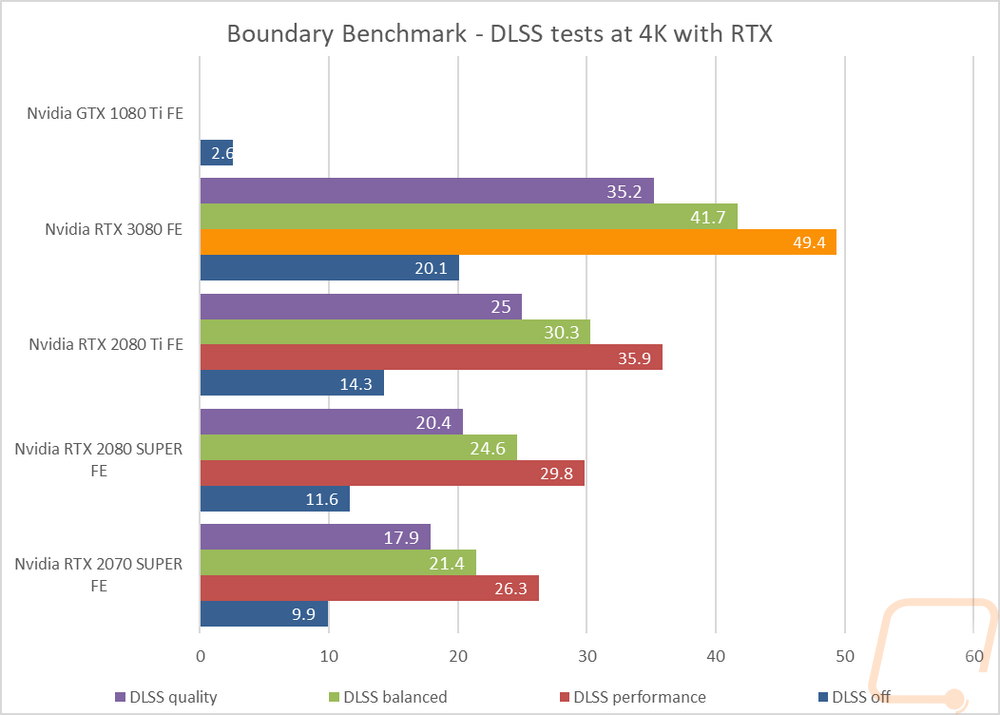
There are a few other benchmarks available that Nvidia clued us into which are based on games. The game Boundary has one which is a space shooter. For this one, I wanted to see the differences in performance when switching between different DLSS quality settings. It had three levels, just like Wolfenstein. I tested this without DLSS on, then using the performance setting, balanced, setting, and quality setting. I included that single 2080 Ti result once again on the one test that it could run which was DLSS off just to put the other results into perspective. All of the tests were run at 4k and with RTX turned on. The result between the different detail settings was around 5 FPS each but was more on the RTX 3080 with it being 35.2 on quality and 49.4 on performance. Not running DLSS at all made all of them unplayable with even the 3080 running at just 20.1 FPS. For the 280 Ti and the 2080 SUPER, the performance setting was the only thing that could get them into or close to the playable range of 30 FPS but on the RTX 3080 all of the quality settings were an option but running performance pushed it up a lot closer to 60 FPS.
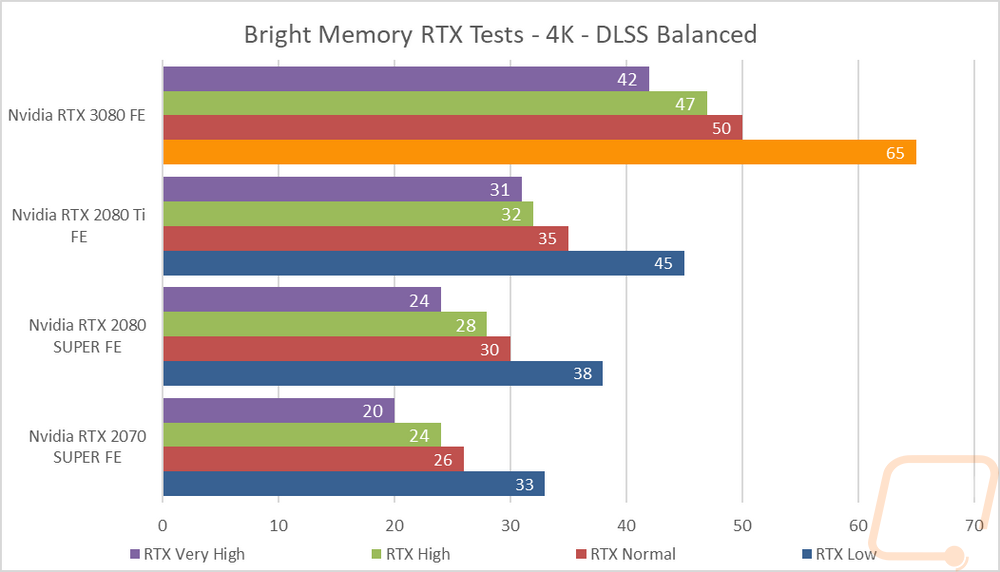
The last tests were using a standalone benchmark based on the game Bright Memory: Infinite. This time around I wanted to test the difference in performance between the different RTX settings as well as see how each of the cards tested handled RTX as a whole. DLSS was on for all of the tests set at the Balanced setting and everything was run at 4K. The performance gap between RTX low and very high was a lot bigger than I thought and the performance gap between the RTX 2080 Ti and the RTX 3080 was just like I saw in previous tests, only here it was the difference between smooth gameplay and playable gameplay when running at RTX low. Even at the very high setting though the 3080 was able to handle things with its lowest FPS being 42 where the 2080 Ti was the only other card that was playable at that setting.
Cooling, Noise, and Power
The RTX 3080 Founders Edition is without a doubt a monster of a card when it comes to in-game, synthetic, and even compute performance. But there are a few other aspects of video cards that get forgotten sometimes. Power usage, noise, and cooling performance are all important as well. These are also areas where different models of cards with the same GPU can have differing results depending on their overclock and cooler design.
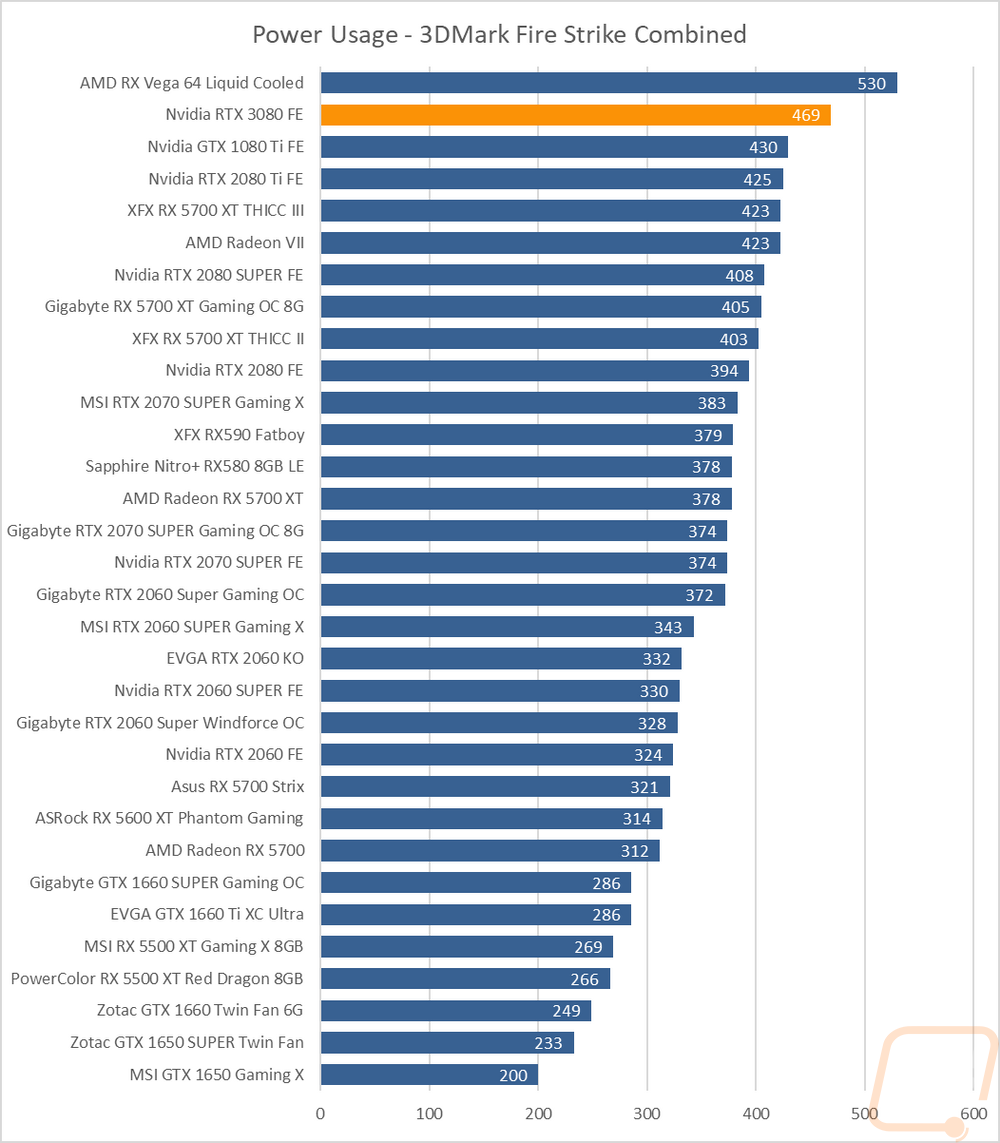
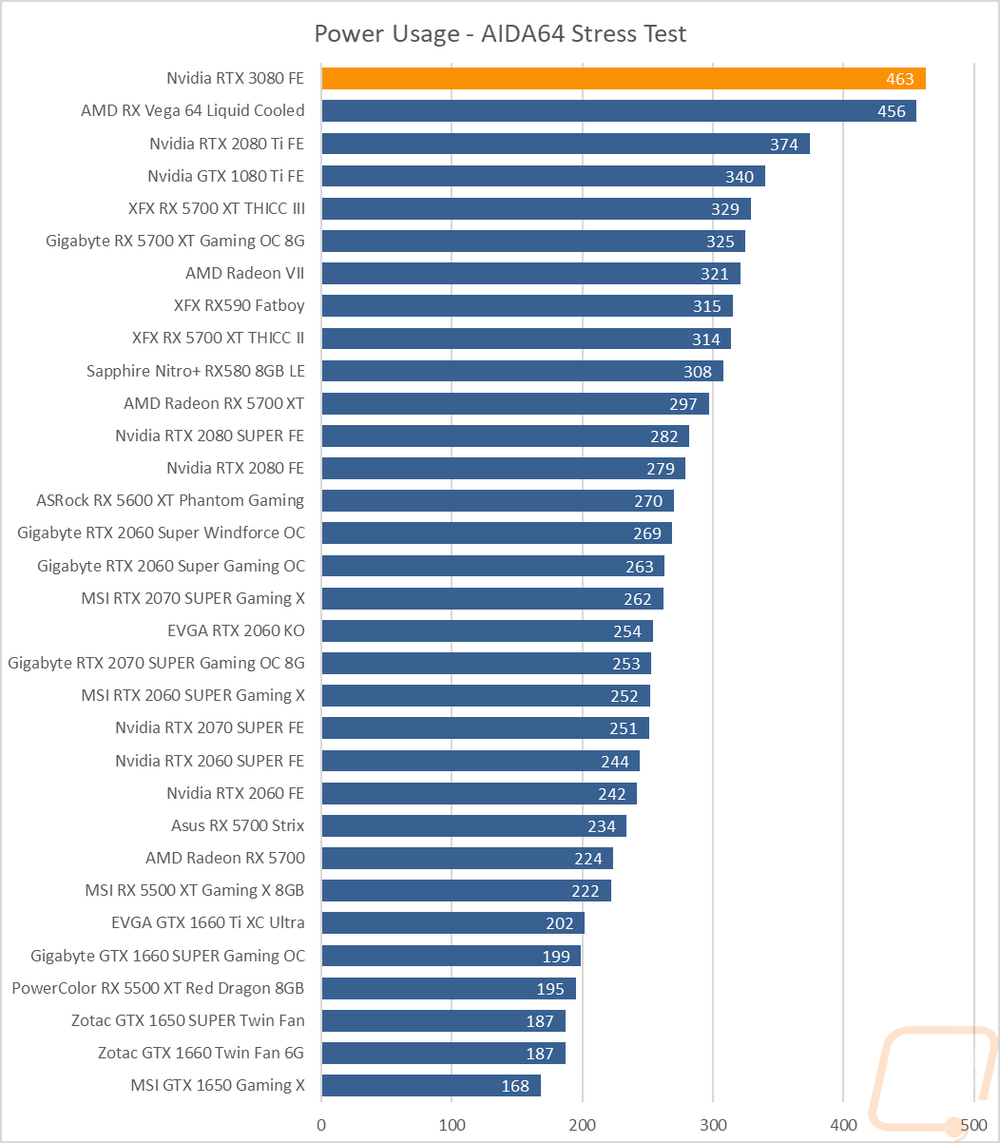
With a 320 watt TDP, I expected the RTX 3080 Founders Edition to be a power-hungry card and my tests just confirmed that. Our 3DMark test which uses the older Fire Strike benchmark on the combined test that loads both the CPU and GPU up had our test system pulling 469 watts in total when watching the kill-a-watt. Sadly we don’t have the fancy Nvidia test kit which can let us get a better look at the direct power draw of the card only. But this was only higher with the Vega 64 liquid-cooled and was 39 watts higher than the 1080 Ti. Using AIDA64’s stress test I ran the GPU stress test, this time without the CPU being loaded as well for a mode demanding look at the GPU power draw and here the RTX 3080 FE pulled 463 which was up at the top of the chart 89 watts above our 2080 Ti Founders Edition.
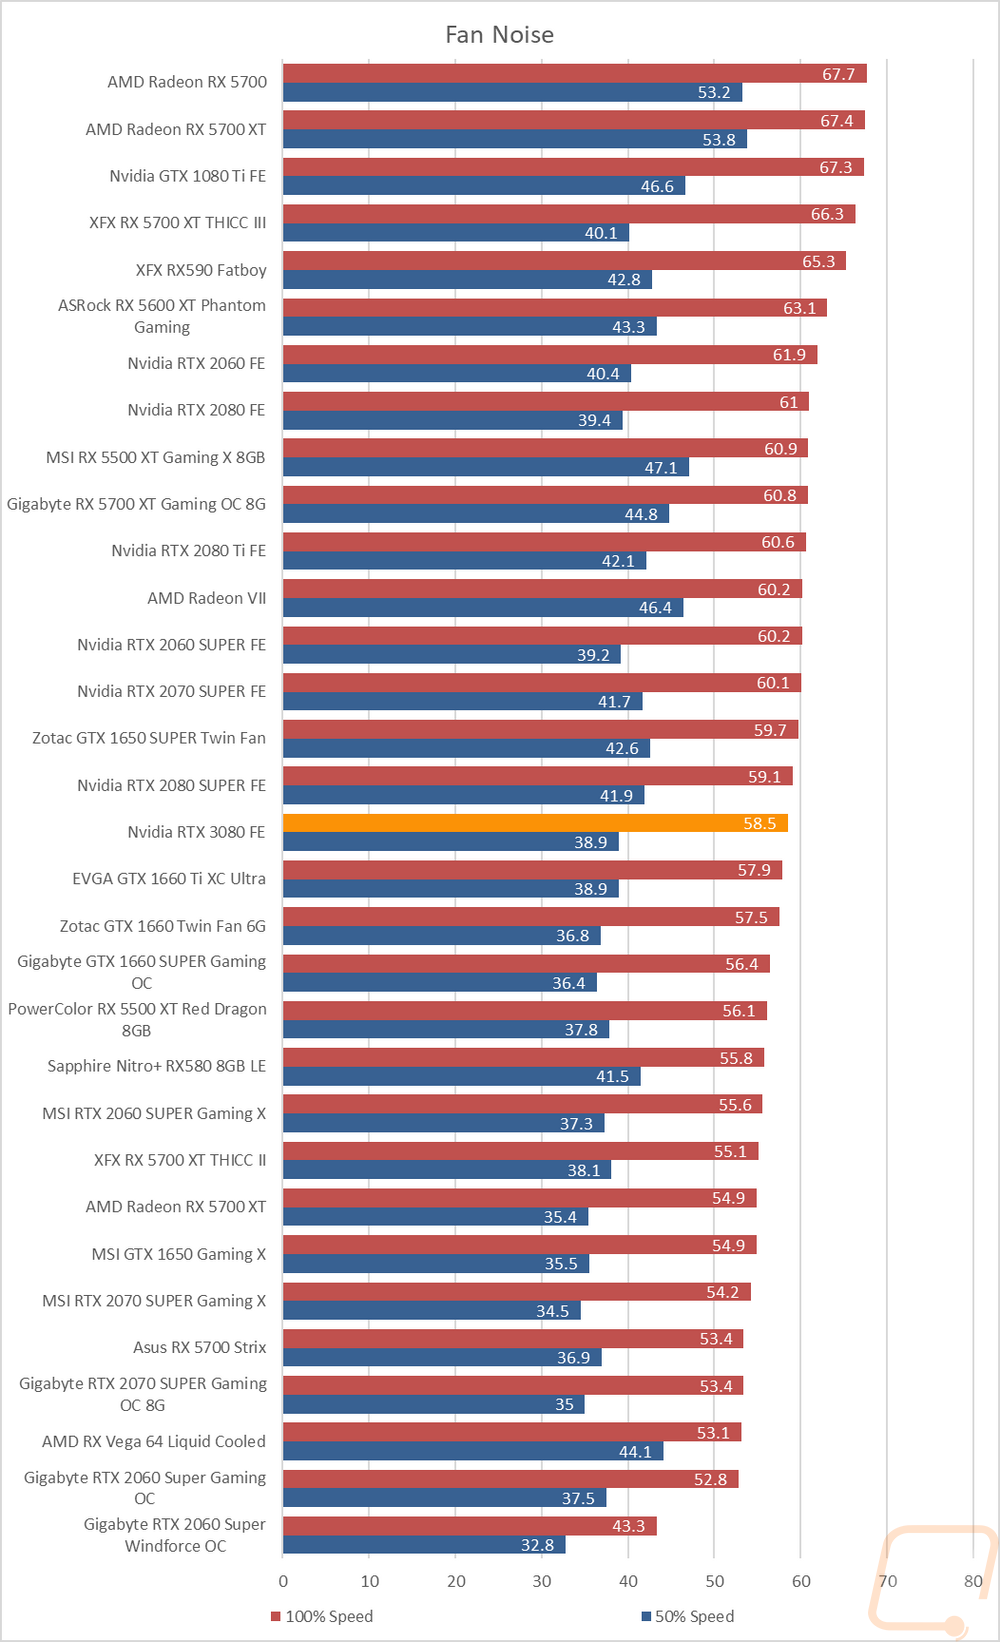
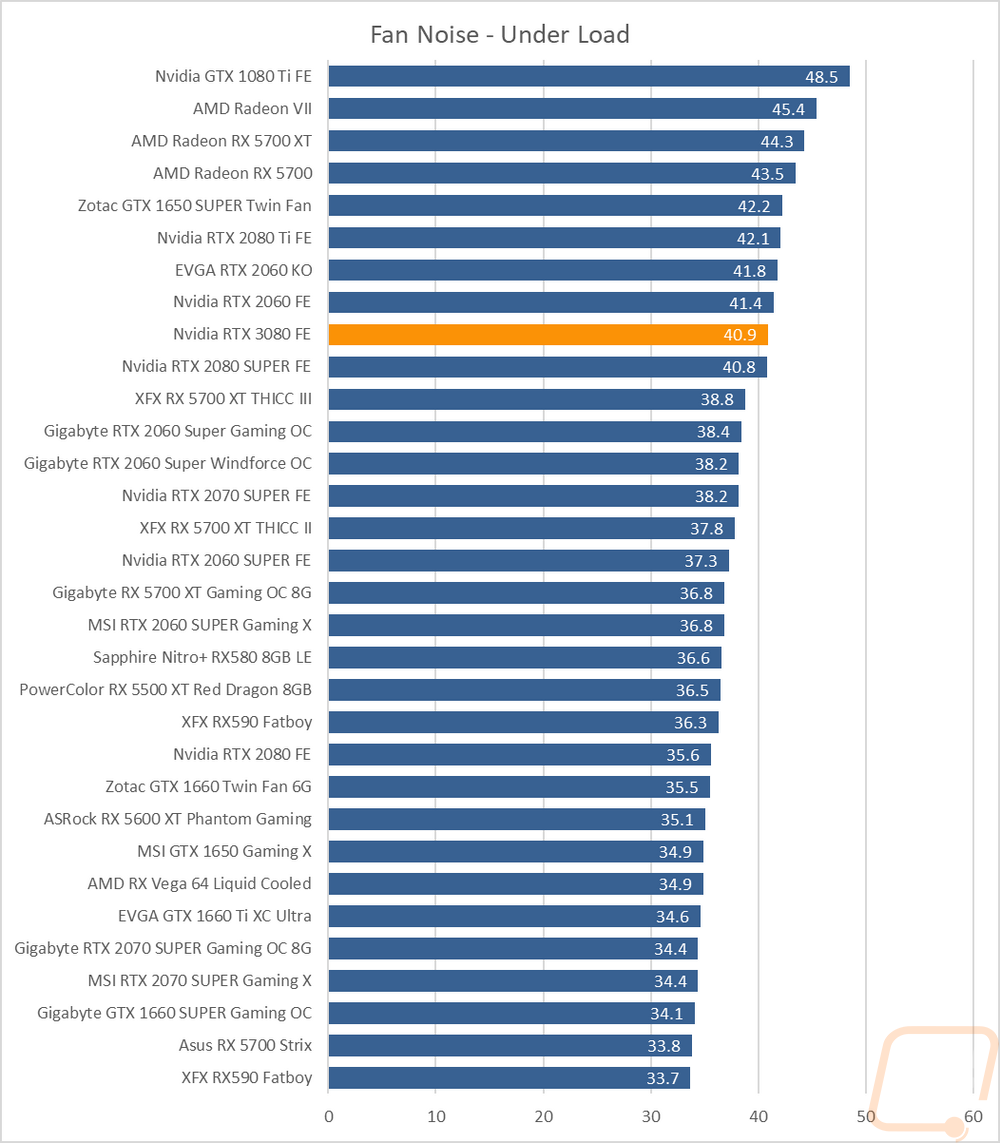
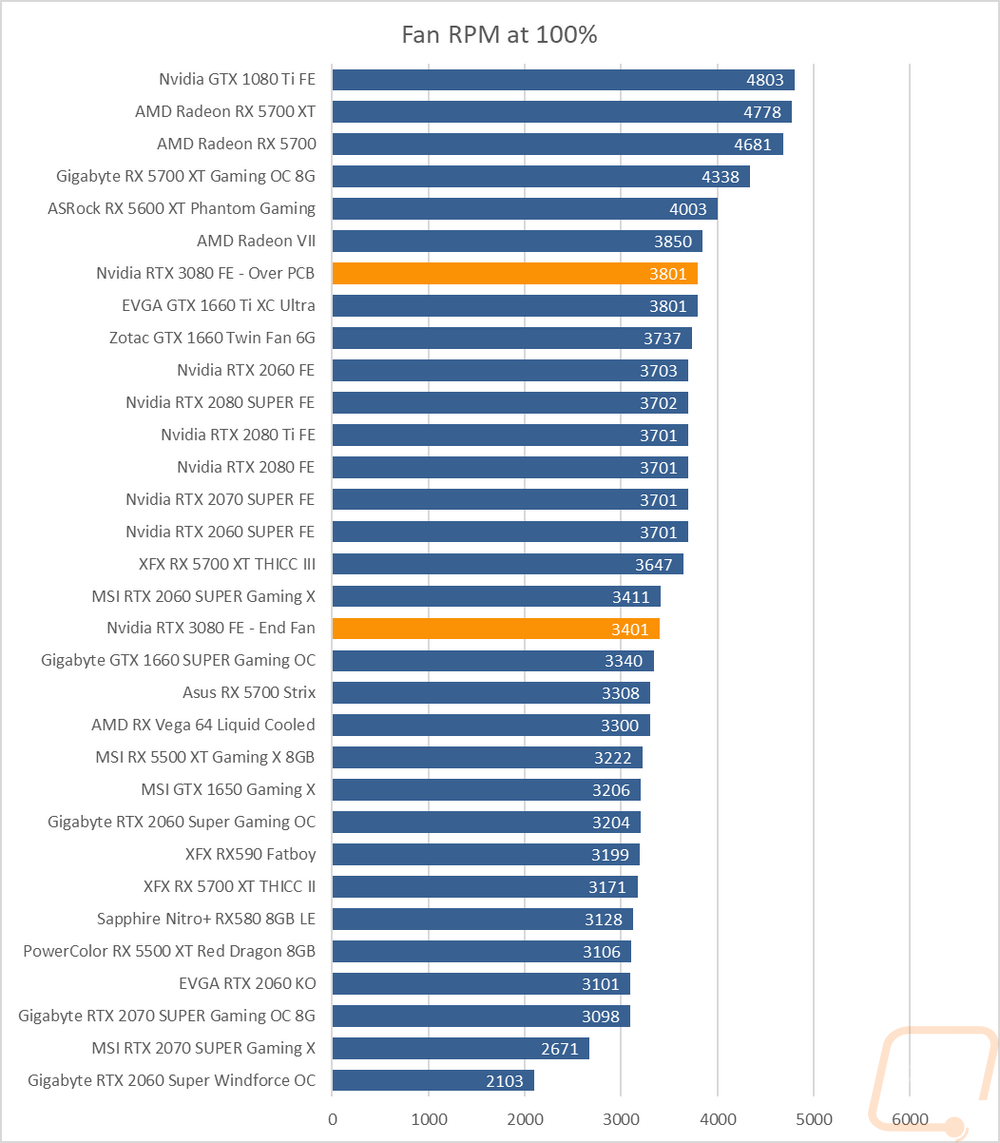
For noise testing, I wanted to take a look at a few different aspects. I used our decibel meter setup 18 inches away from our test bench and tested both 50% and 100% fan speeds just to get an idea of the noise range you can expect from the cooler. I was really curious what the unique fan layout would mean for noise, especially compared to the 2080 Ti with its dual fans and the older blower Founders Edition cards as well. With the fans cranked up to 100% the RTX 3080 Founders Edition did well, coming in in the idle of the chart at 58.5 decibels. The 2000 series dual-fan cards were a touch higher and the old blower cards can be found up at the top. The 50% fan speed result was good as well at 38.9 decibels. Taking a look at the fan RPM chart you will notice one interesting thing. Unlike last generations' dual-fan Founders Edition cards, this new design runs the fans at two different speeds at full tilt. The fan over the PCB runs at 3801 RPM which is 100 RPM faster than the RTX 2080 Ti FE had both of its fan running. Then the unrestricted end fan that blows through is turned down to 3401 RPM. My last noise test was when I had the RTX 3080 in AIDA64 under the stress test running for over a half-hour. I tested the noise level of the card on the stock fan profile under a heavy extended load and you can see that it is significantly quieter than the 100% fan speed results but a touch above the 50% which put the card up above almost all of the aftermarket cards but well below the blower cards like the RX 5700 and XT as well as the GTX 1080 Ti FE. The 2080 Ti FE was also a little louder here at 42.1 dB as well.
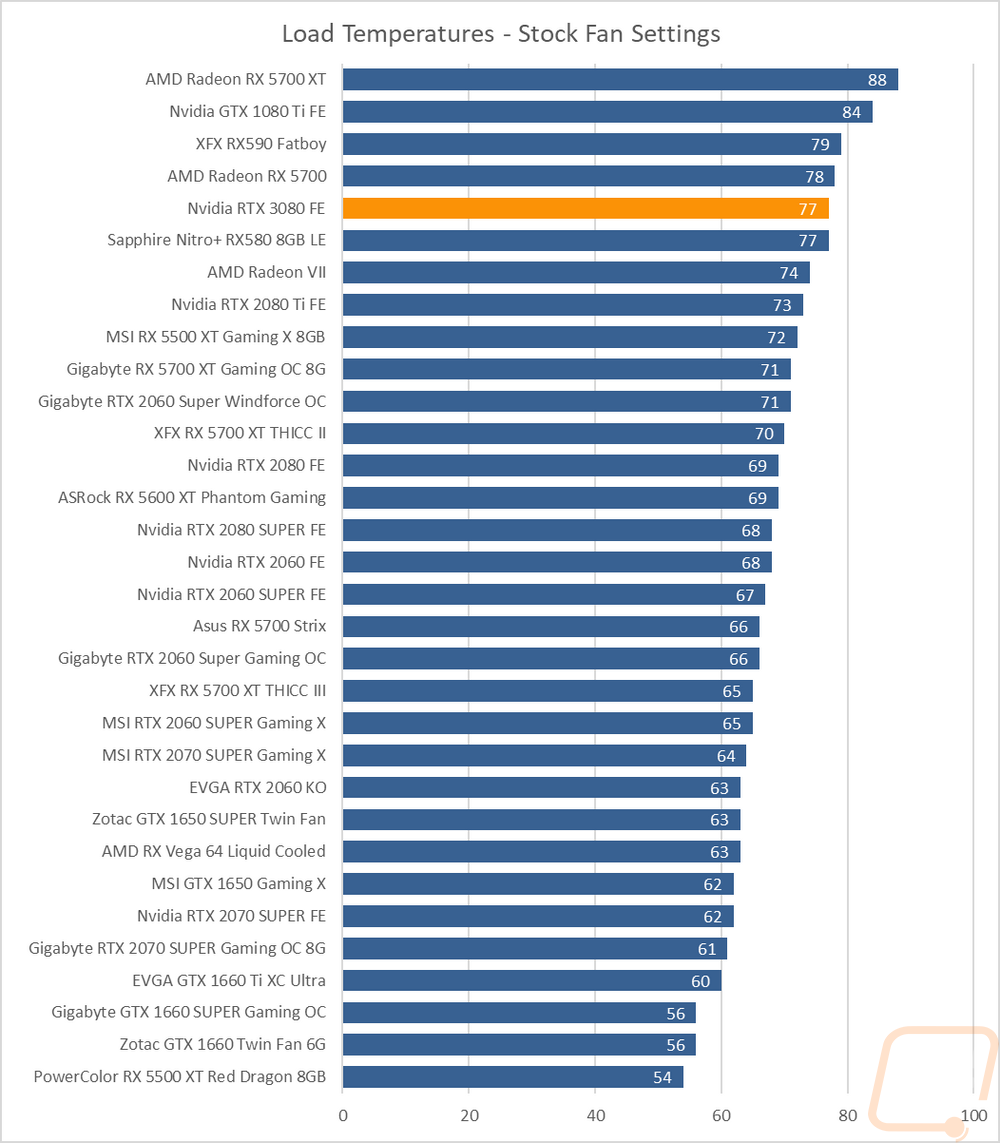
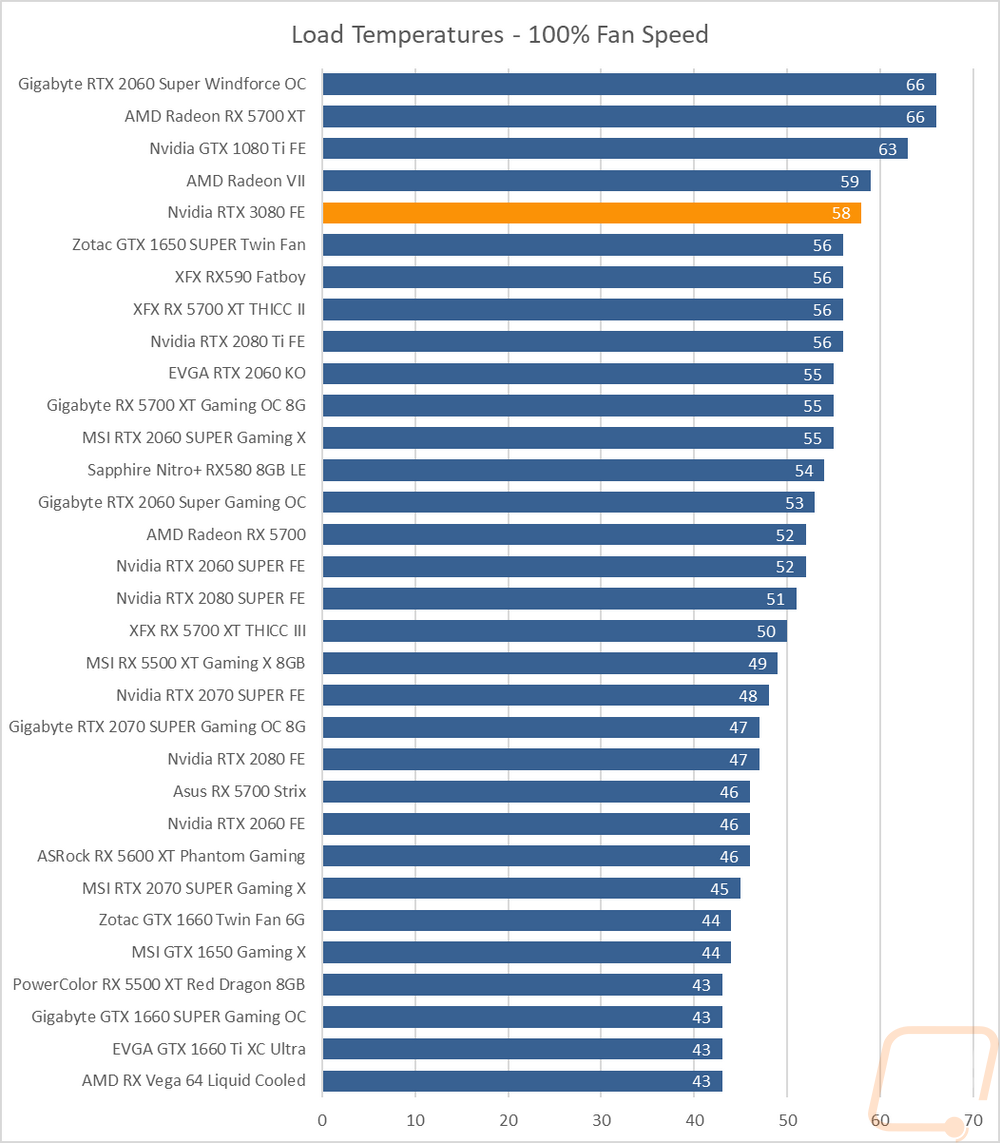
The last round of testing is of course the most important in my opinion. I wanted to check out the cooling performance of that unique cooler design combined with what has to be a high thermal load given the RTX 3080’s power usage. For this, I ran AIDA64’s stress test on the GPU for over a half-hour until temperatures leveled off to document the recorded temperature at the GPU. I did this twice, once with the stock fan profile, and then again with the fan at 100% fan speed to get an idea of the delta between the stock profile and the coolers potential to see how much room is left in it as well. The stock fan profile wasn’t a huge surprise, it was running at 77c which is up in the normal range that Nvidia has their cards set to run, although the last generation of cards did run a little cooler as you can see with the 2080 Ti FE running at 73c in the same test. With the fan cranked up temperatures were a lot better with the end result being 58c. This isn’t as low as a lot of the aftermarket cards tested landed but we will have to see what the aftermarket versions of the RTX 3080 do here in the future. But the delta between that 77c stock profile result and the 58c 100% is a good amount which is at least good to know if you do some overclocking the stock cooler does have some headroom.
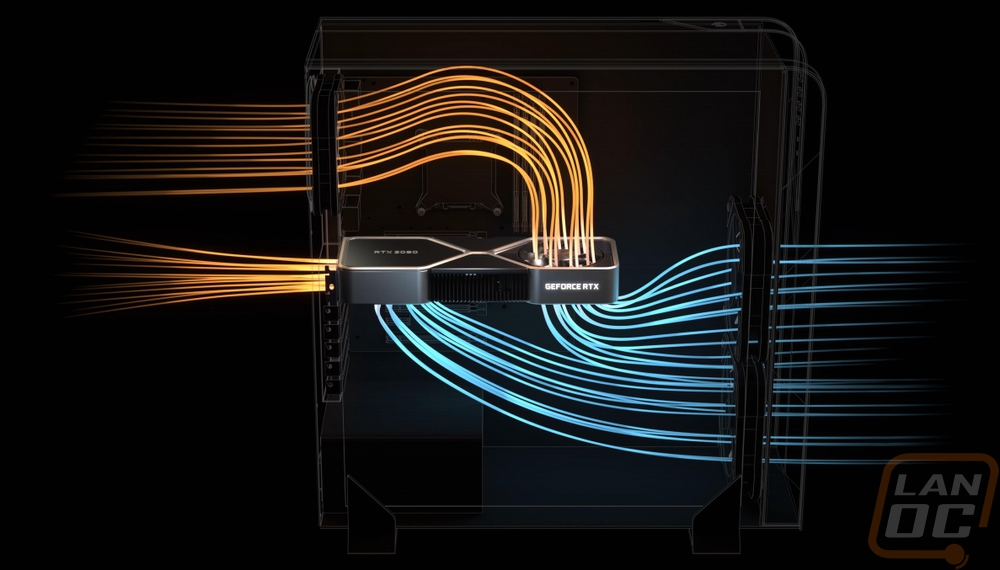
So this picture is actually from Nvidia’s original presentation and a lot of you may have seen it., But I did want to include it here because there is one aspect of the unique cooler design that people will need to keep in mind. I love that they have half of the card blowing out the back PCIe bracket to keep that extra hot air out of the case and with aftermarket cards and even last generations Founders Edition cards we have gotten used to having most of the hot air from a card blowing into your case. This design even completely avoids that hotspot that ends up on the motherboard where a lot of cards blow down on to it. But if you are running air cooling, you need to remember that your GPU is going to be blowing up right into the airflow for your CPU as you can see below. The 3080 Founders Edition works better in a case layout that is running an AIO or custom water cooling where that airflow is free to go out the top or back. So keep that in mind when layout out your PC.
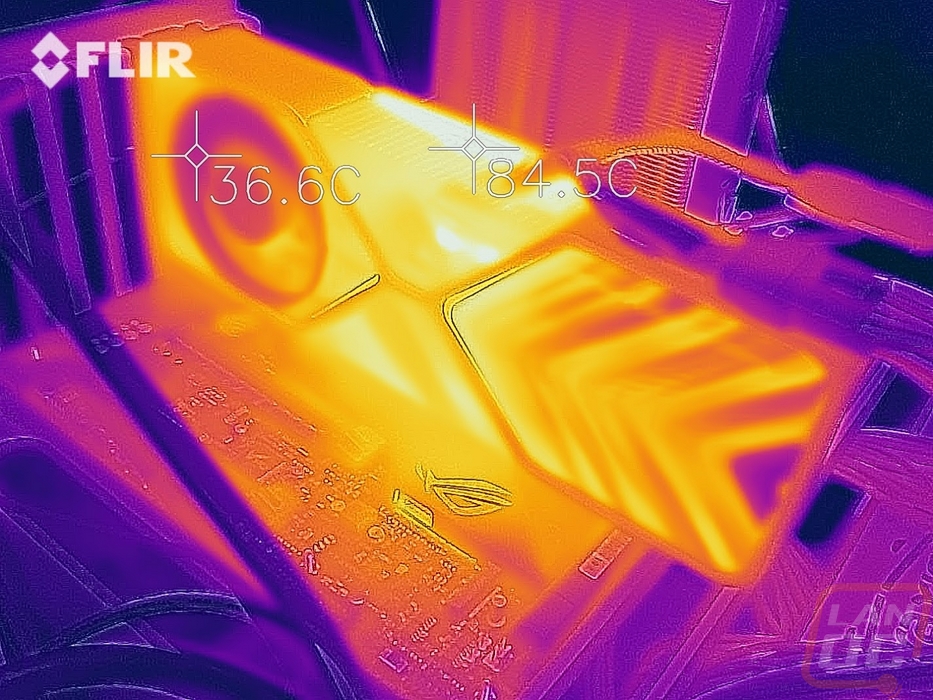
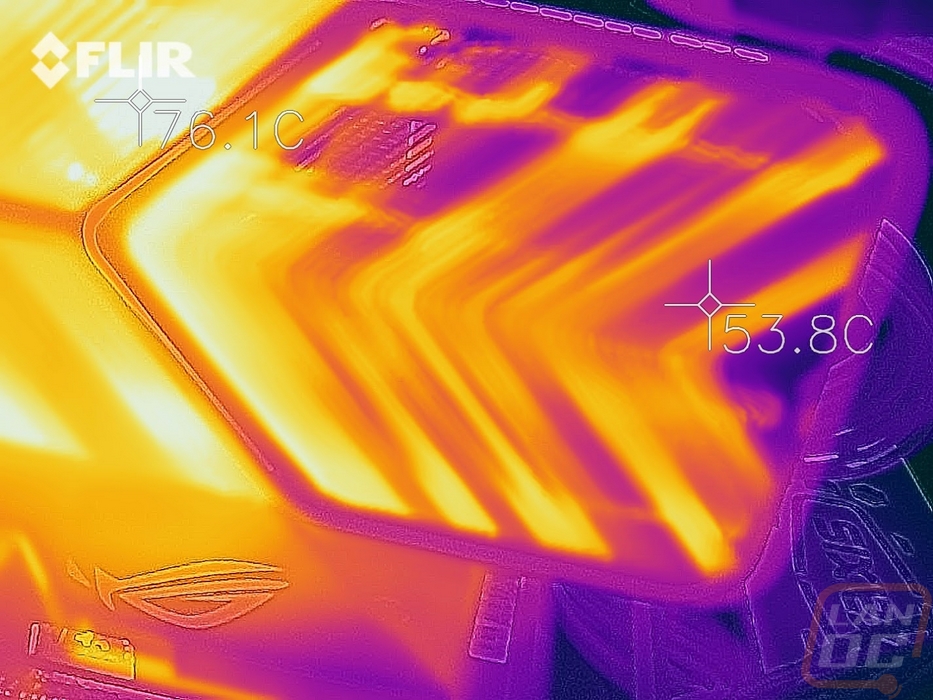
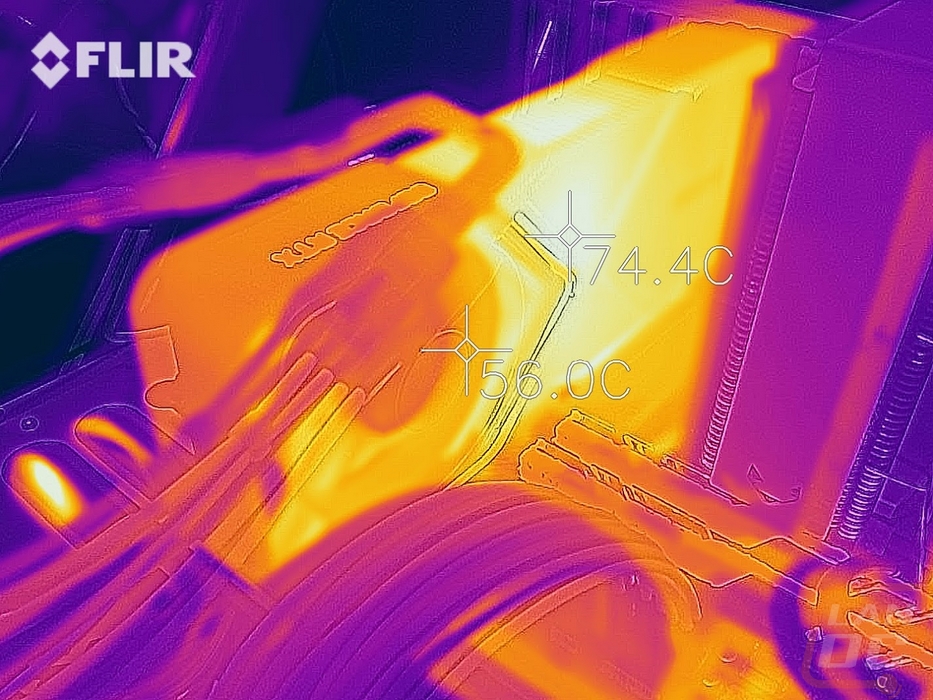
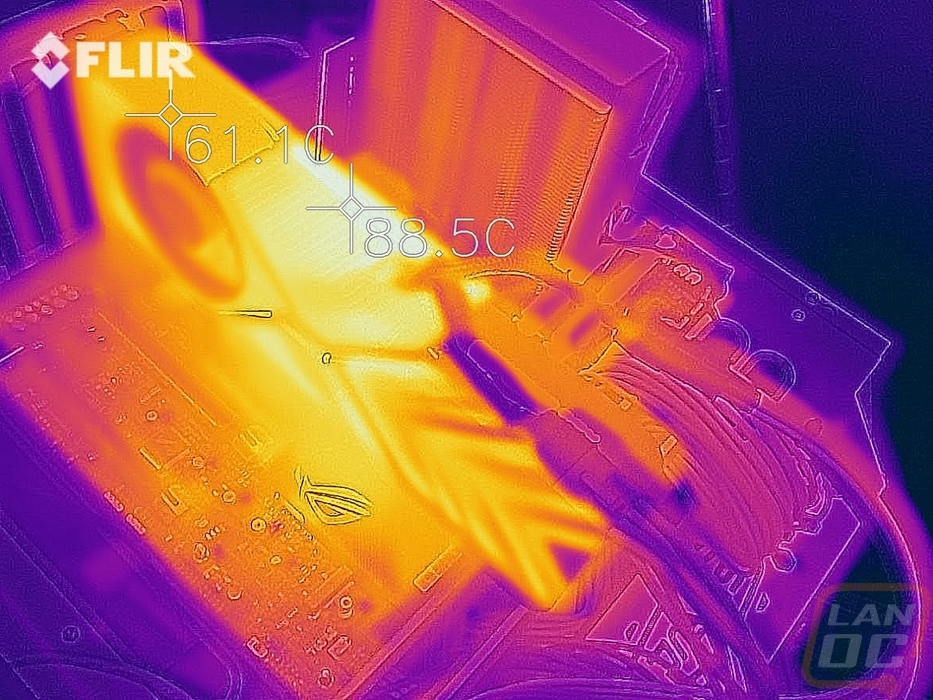
I did also get some thermal images of the RTX 3080 Founders Edition when running the stock fan profile testing. These give an interesting look at the heatsink temperatures as well. You can see how that end section is cooling things down with the pull-through fan on that end. But you can also see where Nvidia is doing a good job of pulling heat out across that heatsink even with the PCB being far away from there. The hottest area is right at the top edge at the PCB which is in between the VRMs and right above the GPU itself. There is also a hot spot on the back at the back of the PCB where the GPU is as well.
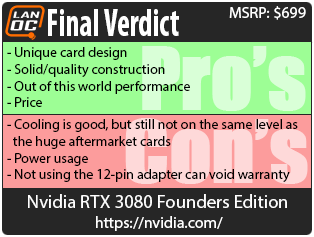
Overall and Final Verdict
Well, it didn’t take more than a few of the benchmarks to see right away just how big of a gap the RTX 3080 has put ahead of even the RTX 2080 Ti. This was especially true when gaming at 4K and wish the detail cranked up. If you are planning on playing at 4K, especially with the highest detail settings or at high refresh rates this is now the go-to GPU. Nvidia has upped that even more with Amperes advancements in RTX and DLSS performance as well which RTX performance is now solid, especially when you use DLSS to increase performance.
When it comes to the RTX 3080 Founders Edition specifically which I tested today. Nvidia has once again changed things up with their card design and this time it is completely different from anything else on the market. This is a dual axial fan design again, but they have gone with a short PCB along with a cooler that is all heatsink to use one of the fans as a blower out the back of the card and the other that blows through, out the back of the card. Even with the new design they did still manage to have the same solid construction that past Founders Edition cards have had, mostly thanks to the all-metal construction which is worlds better than most of the plastic fan shrouds that aftermarket cards have. The new design does a solid job keeping the RTX 3080 cool, but when compared to past generations with aftermarket coolers it is still a little behind. I will have to wait and see how this generation of aftermarket cards perform to know for sure though.
As for power draw, this card pulls a lot. More than just about any other card I’ve tested. So plan for that when picking out your power supply. Nvidia recommends at least a 750-watt power supply. Imagine what the RTX 3090 is going to pull, not to mention the overclocked models as well. Nvidia even went with a new power connector for these which I am excited to finally see the dual plugs start to go away. But until power supplies come with the cable, running the adapters is going to be weird and ugly. Not to mention in the fine print Nvidia has a note saying that running anything other than the included adapter could void the warranty. I’m sure that is only if it causes damage, but I know a lot of people are going to want something better looking than the included Y adapter.
Of course, all the performance in the world doesn’t matter if most people can’t afford it. But Nvidia surprised everyone during the Ampere announcement when they mentioned the RTX 3080 Founders Edition would be $699. This is finally back down around the pricing from the past after the original RTX launch having much higher prices. At $699 it is right at the same price as the GTX 1080 Ti at its launch for example. Add in the performance which is way ahead of even the fastest of the last generation and you end up with a surprisingly good value for a high-end card. Add in the huge improvements on the CPU side for the last few years and it feels like we are back in the golden years, especially with more games coming out to push the limits of the hardware like Flight Sim 2020 and Metro Exodus and Crysis Remastered and Cyberpunk 2077 both looking like they will as well.


Live Pricing: HERE


