Synthetic Benchmarks
As always I like to start my testing with a few synthetic benchmarks. 3DMark especially is one of my favorites because it is very optimized in both Nvidia and AMD drivers. It's nice to not have to worry about it being favored too much either way and the repeatability of the results makes it a nice chance to compare from card to card, especially when comparing with the same GPU. Which here I have the chance to compare the MERC 319 against the Gaming X that I took a look at launch.
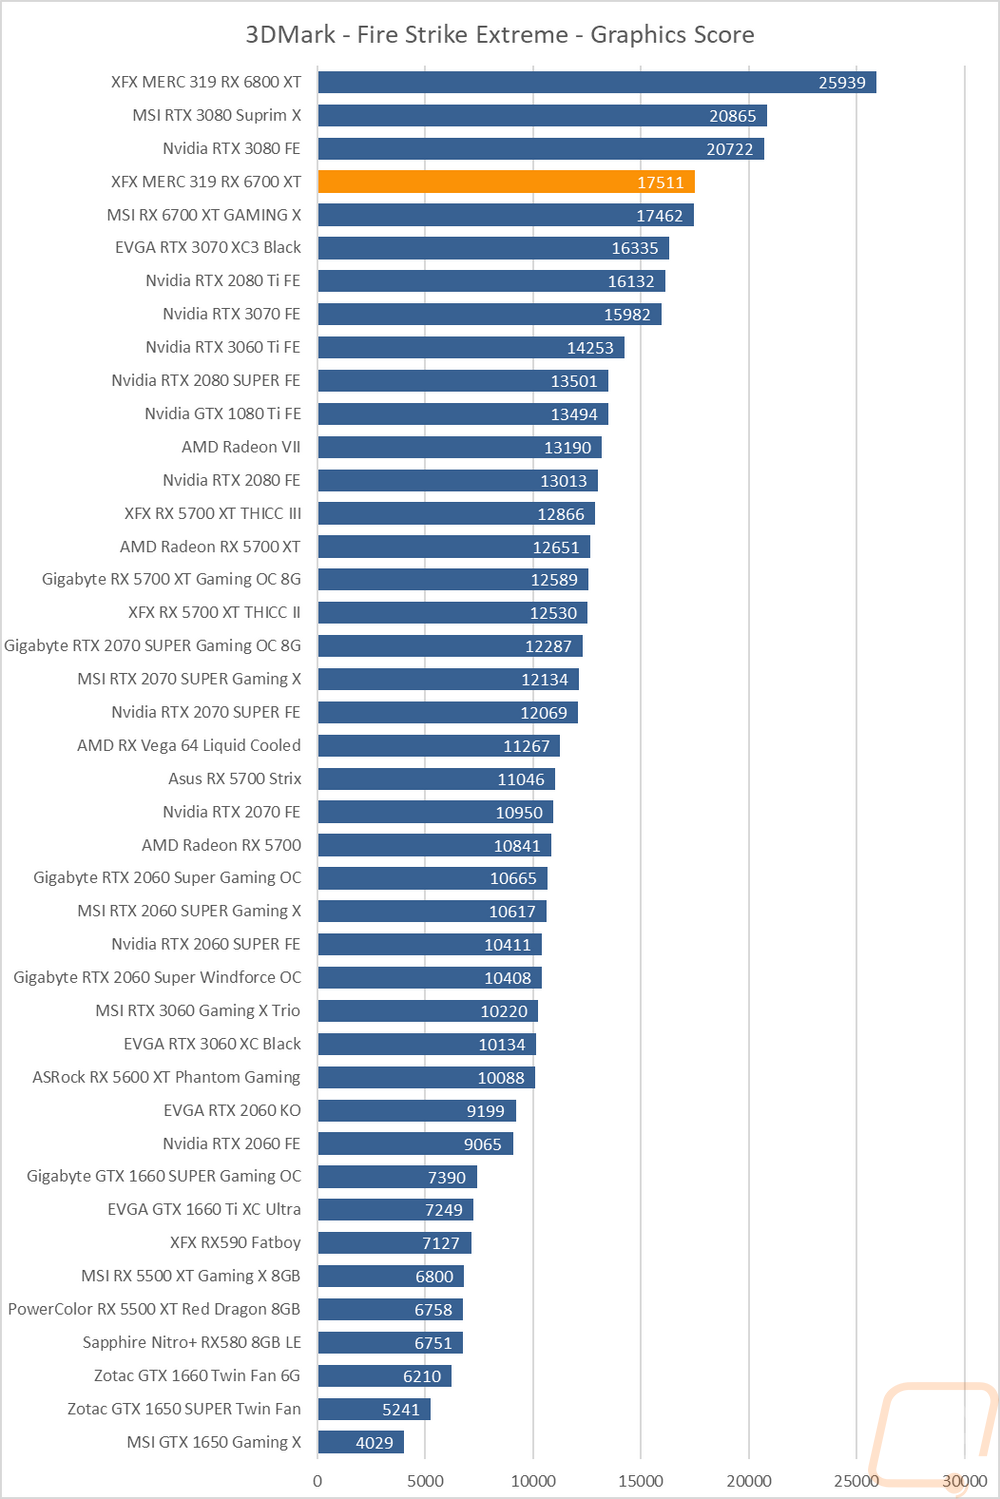
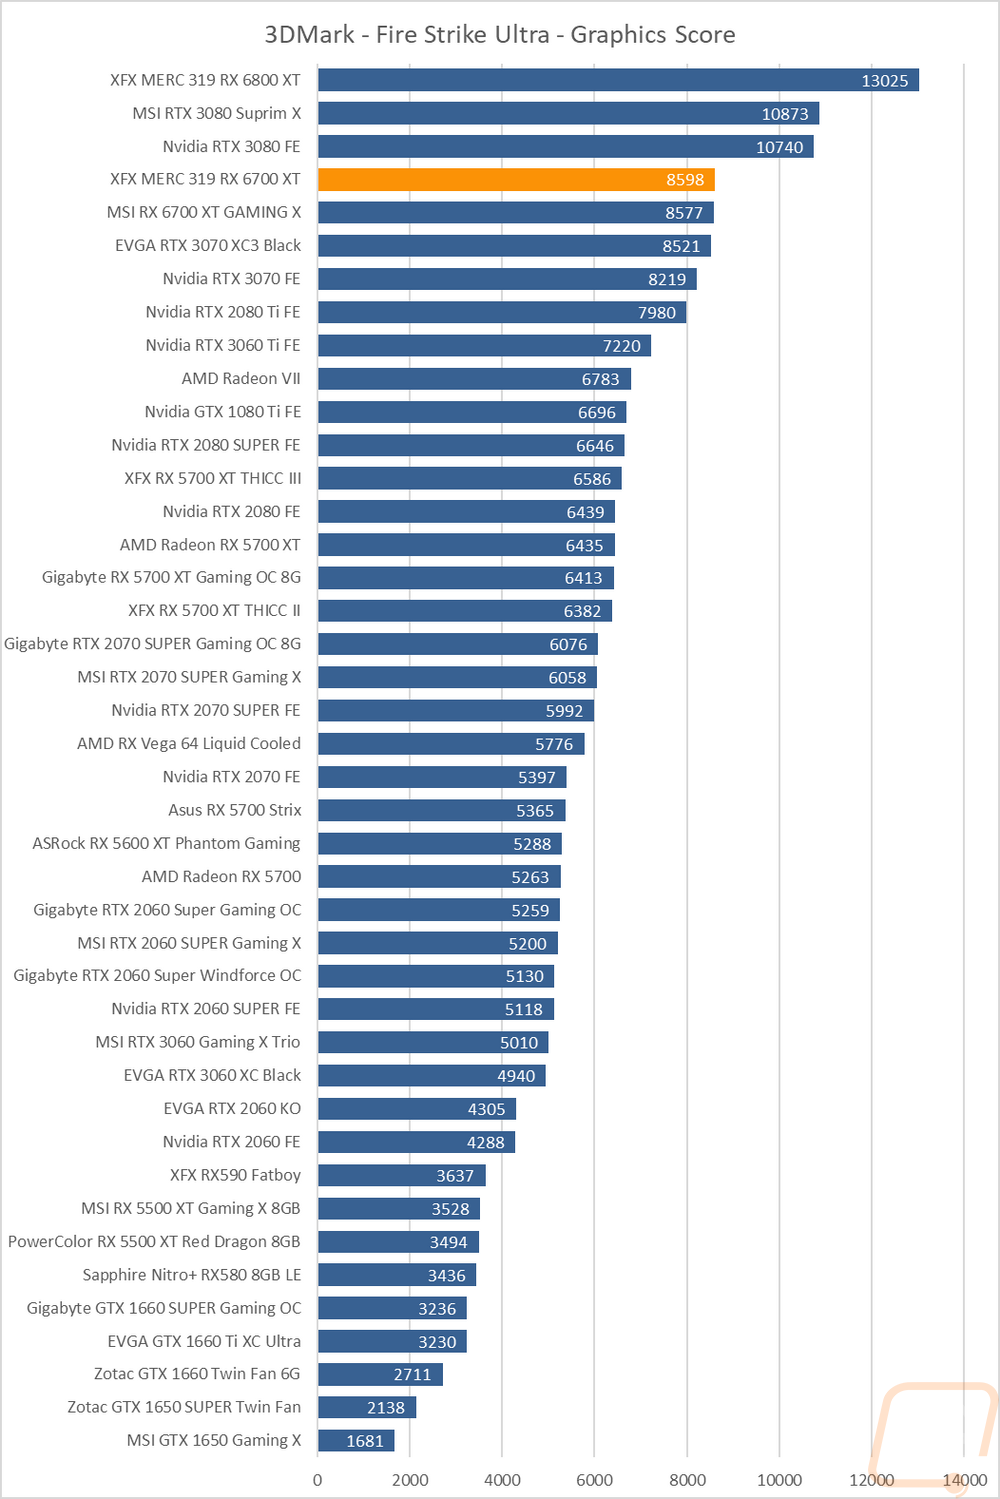
The first round of tests were done in the older Fire Strike benchmark which is a DX11 test. There are three detail levels, performance, extreme, and ultra. The XFX RX 6700 XT MERC 319 was tied right with the MSI only with the XFX edging out by a few points in each test. This kept the card above the RTX 3070 cards by a hair.

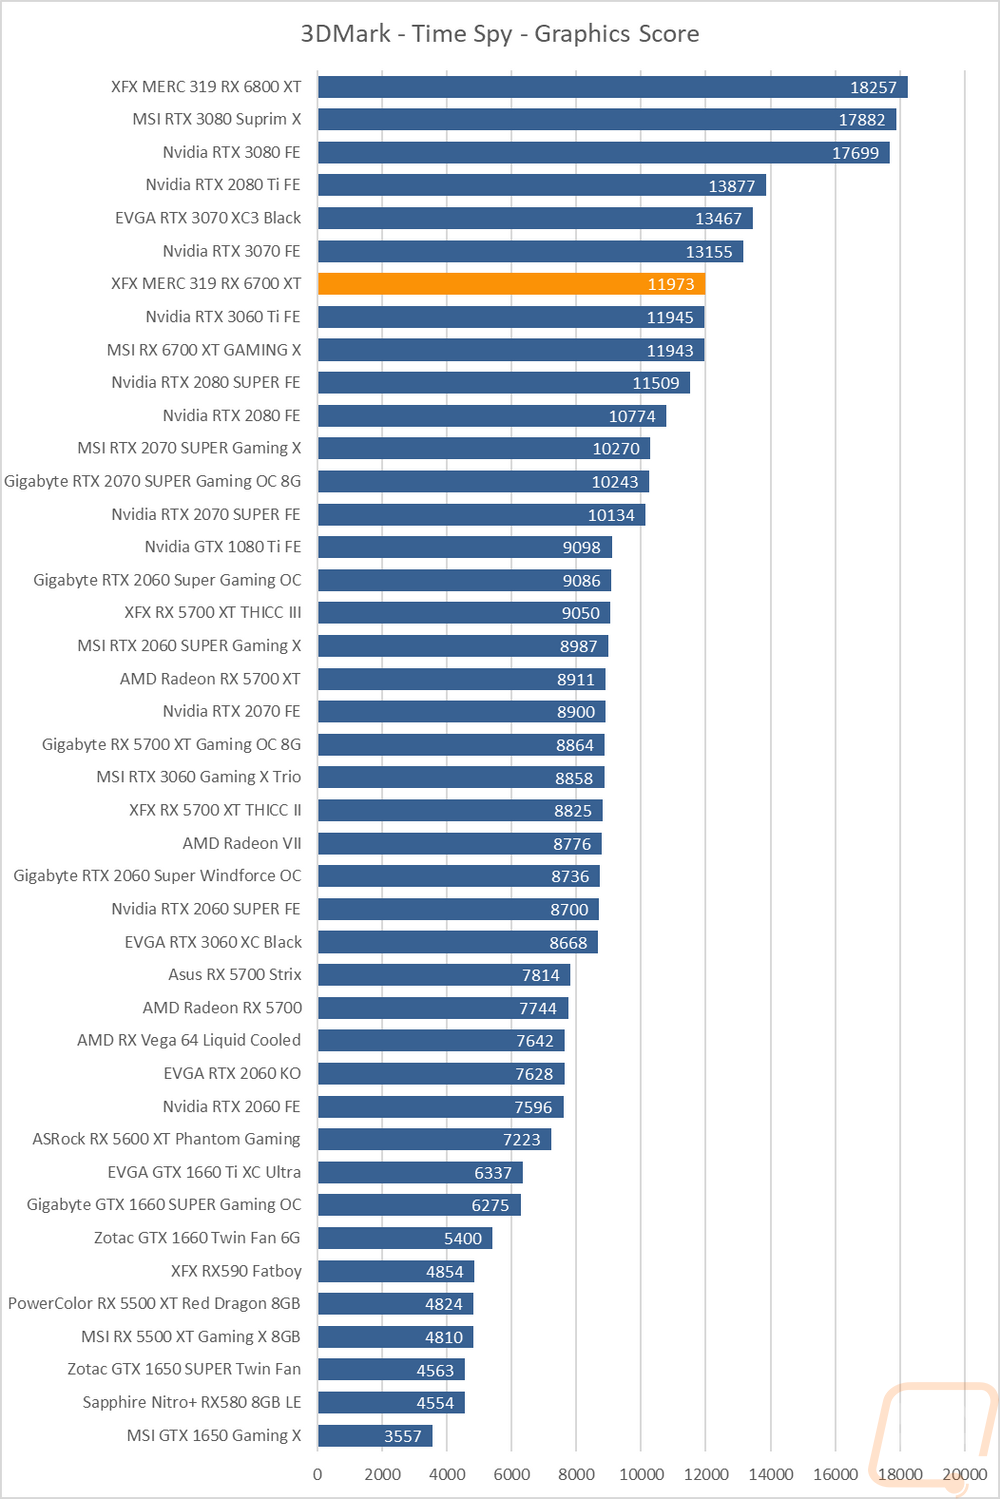
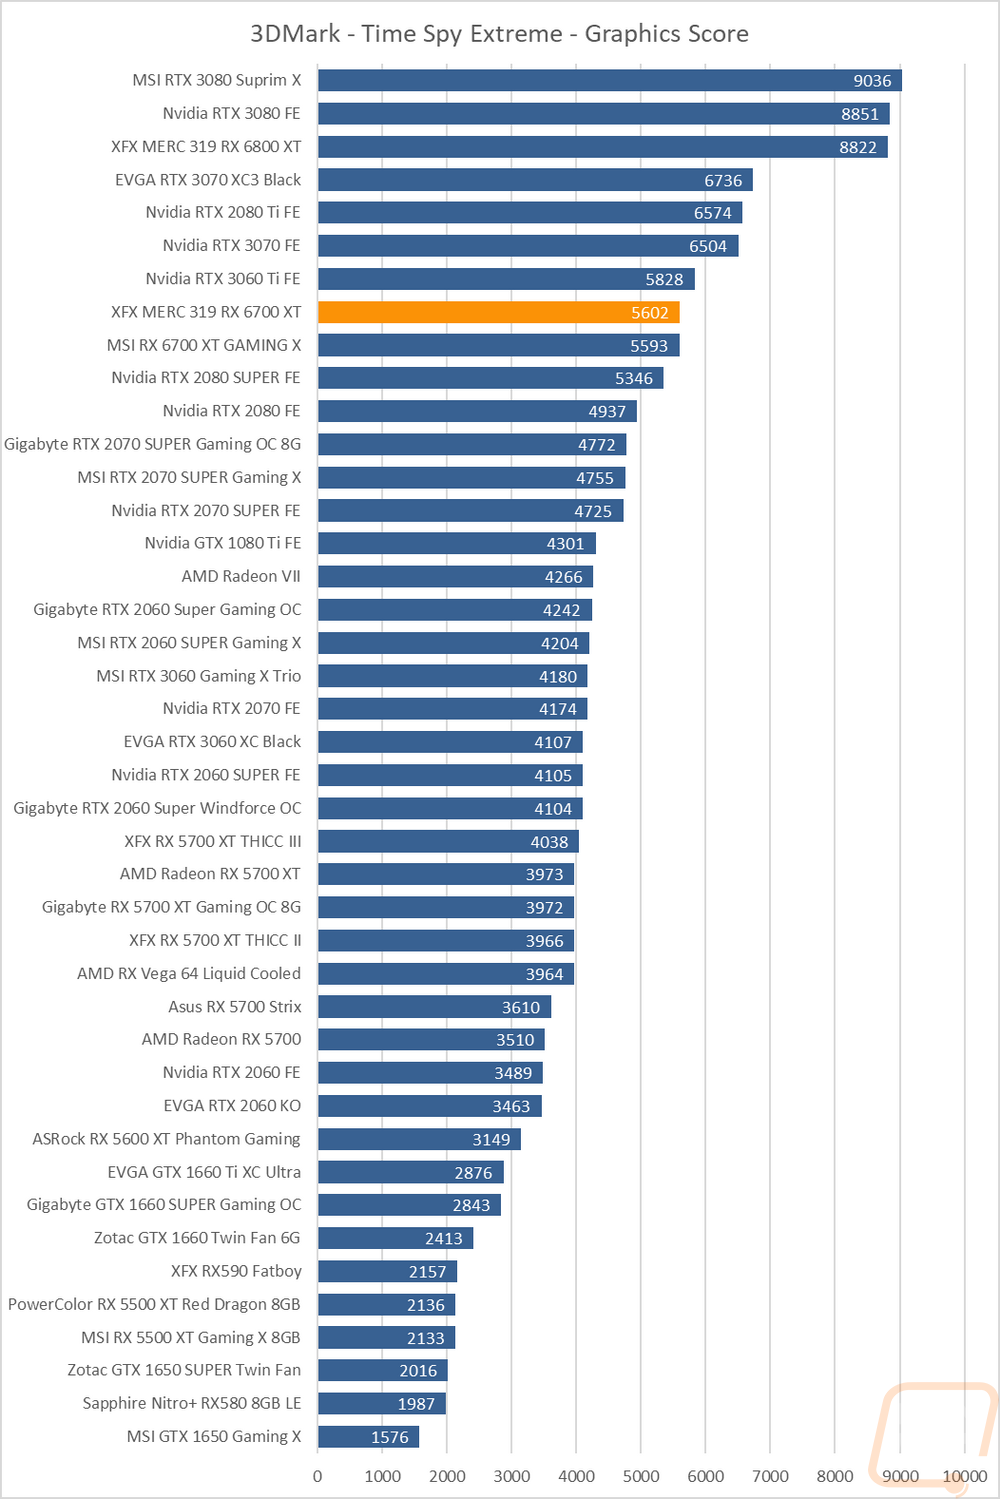
The next two were both based on the Time Spy benchmark. One is the standard test and then there is the extreme detail level. The base Time Spy results were interesting, the gap between the XFX RX 6700 XT MERC 319 and the MSI was once again nearly nothing but the 30 points was enough to edge out ahead of the RTX 3060 Ti as well. In the extreme time spy test the 3060 Ti was still out ahead, however.
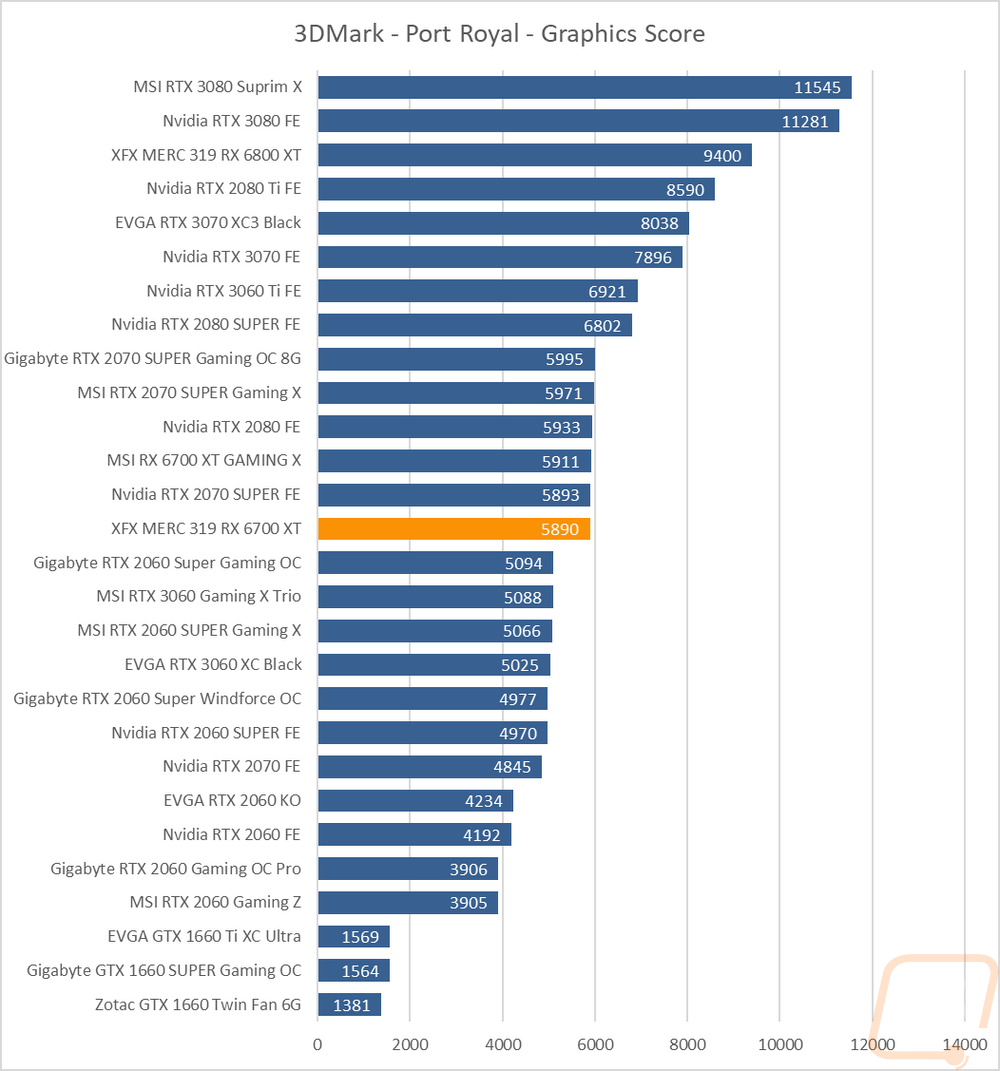
I also slipped in the Port Royal benchmark from 3DMark which with the ray-tracing cores is supported. Here the XFX and MSI are right all in a line with the RTX 2070 SUPER and RTX 2080. This time around the MSI edged out by 21 points.
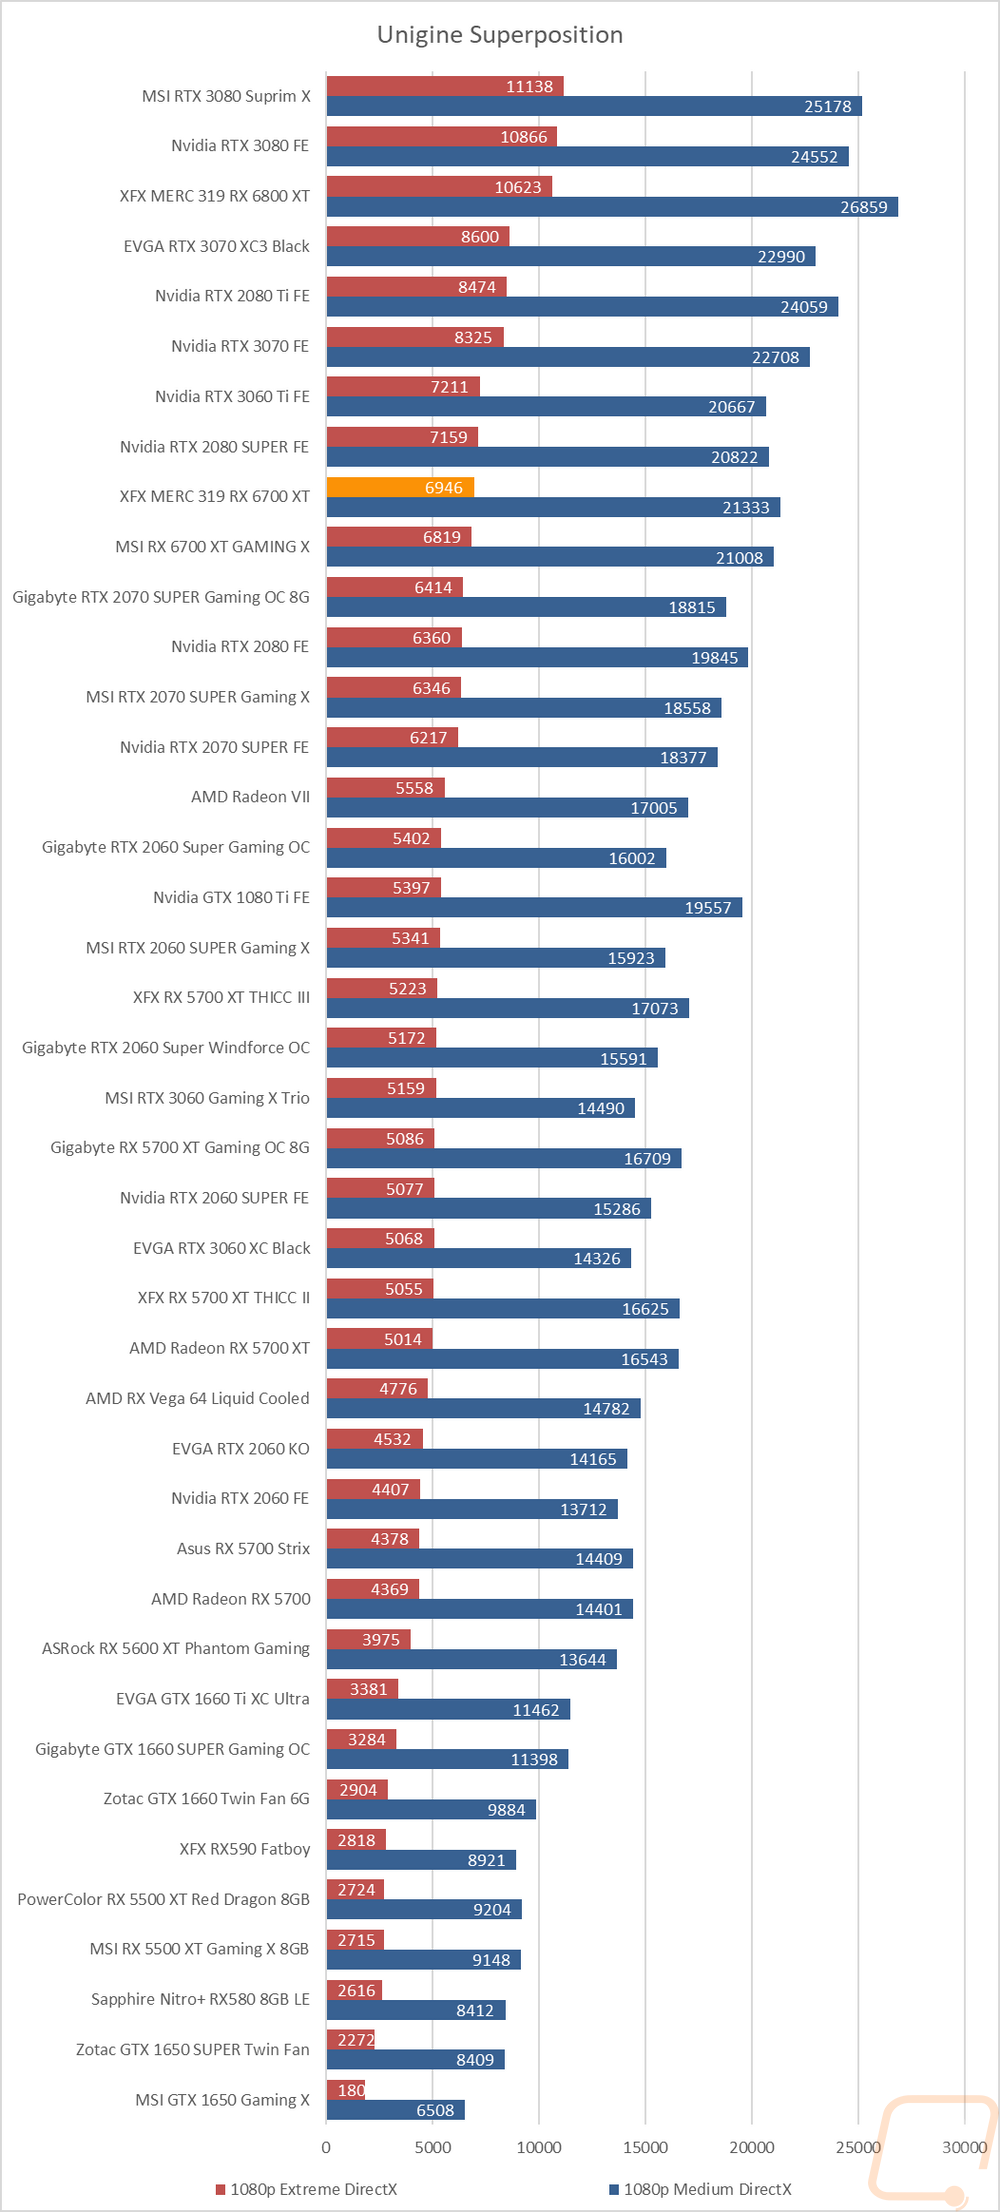
The last test was using the Unigine based Superposition benchmark and I tested at 1080p with medium detail and again at 1080p with the extreme detail setting. In the extreme detail setting the XFX RX 6700, XT MERC 319 has 29 points on the MSI but it has a larger margin in the medium detail test with 325 points. The extra points pushed it up closer to the RTX 2080 SUPER.