Cooling Noise and Power
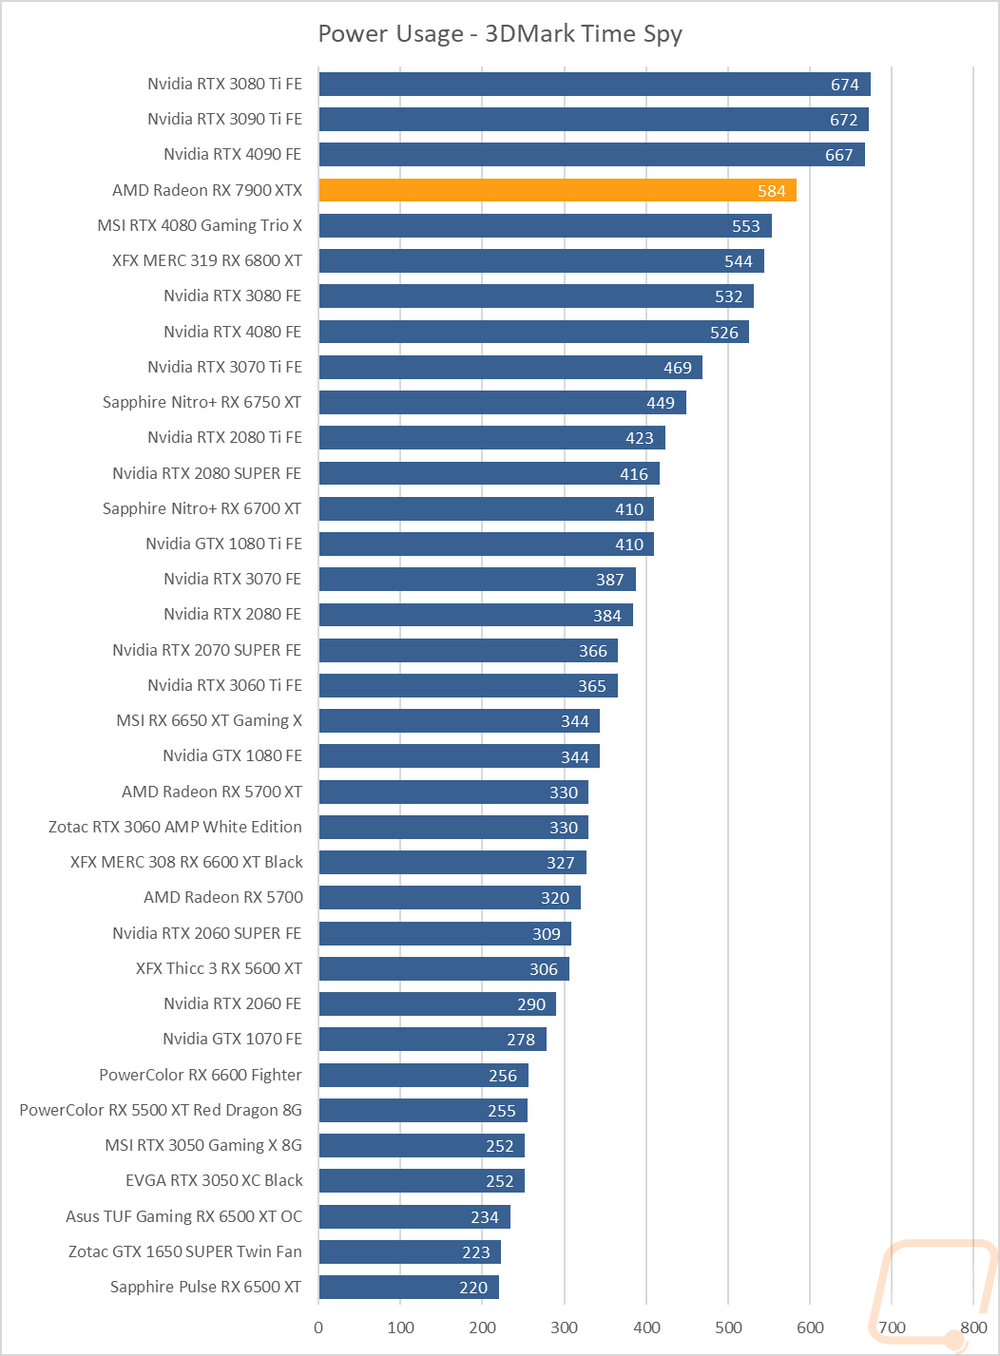
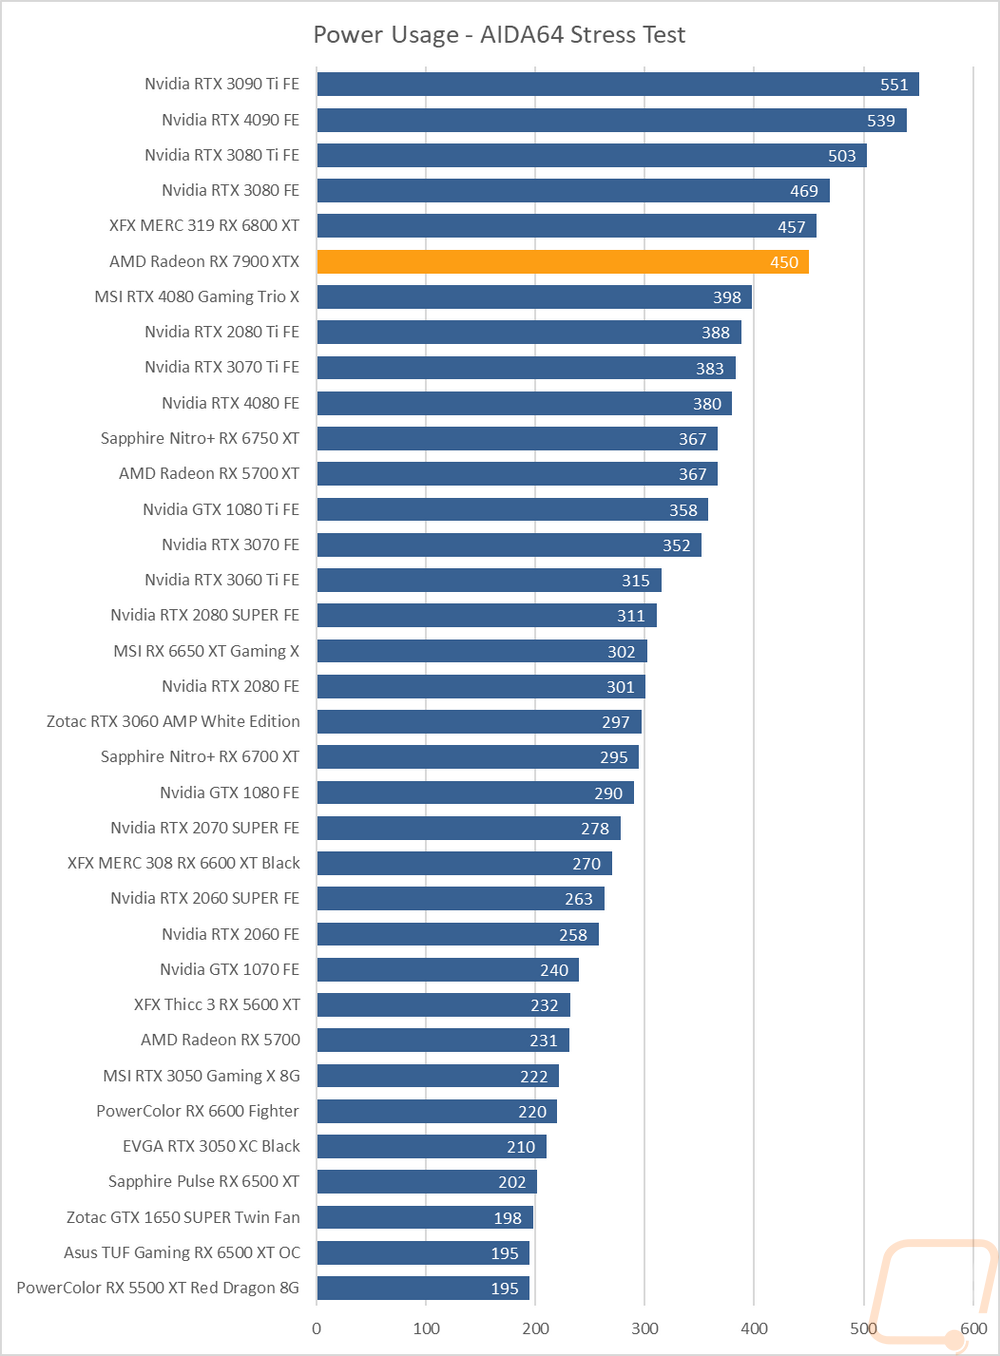
For my last few tests, rather than focusing on in game performance, I like to check out other aspects of video card performance. These are also the most important ways to differentiate the performance between cards that have the same GPU. To start things off I took a look at power usage. For this, I use our Kill-A-Watt hooked up to the test bench to record the total wattage of the system. I ran two tests with the first using 3DMark Time Spy to put the system under a load similar to normal in game performance. Here our test system with the 7900 XTX pulled 584 watts total which put it 30 watts over the same system with the RTX 4080 and well below the 3080 Ti, 3090 Ti, and 4090 which top the chart. I also ran AIDA64’s stress test on the 7900 XTX to load up only the GPU and using the Kill-A-Watt the test bench with the 7900 XTX and the system pulled a total of 450 watts which was lower than the overclocked XFX 6800 XT but still over 50 watts more than the overclocked 4080.
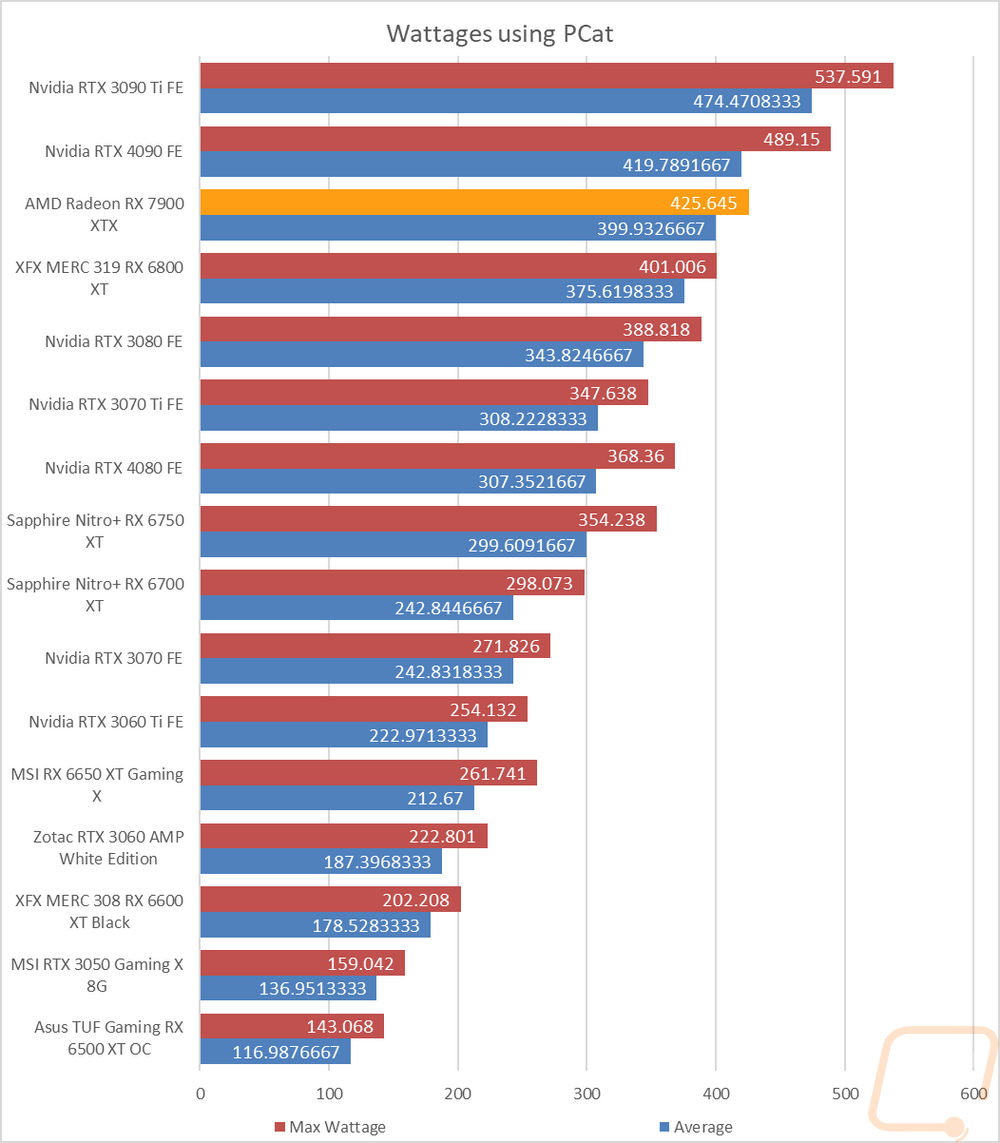
While the overall system numbers are nice, with the addition of a PCat into our testing hardware I have finally been able to look at the total power draw of just the GPU by monitoring the power over the PCIe slot and the power cables. For this test I have also expanded the number of tests I run by testing power usage in two games (Fay Cry 6 and Watch Dog Legion both at 4k and ultra detail) testing with Time Spy and Time Spy Extreme, AIDA64’s GPU workload, and Blender 3.4. I take those numbers and average them out for our average number and also look at the max wattage which is with just one exception always the Time Spy Extreme result. This gives us a much better look at the power usage across multiple situations and also the max power draw. The 7900 XTX pulled 425 watts at peak and averaged 399 watts which was a lot closer to the 4090 that I would have expected and 100 watts over the 4080 on the average result.
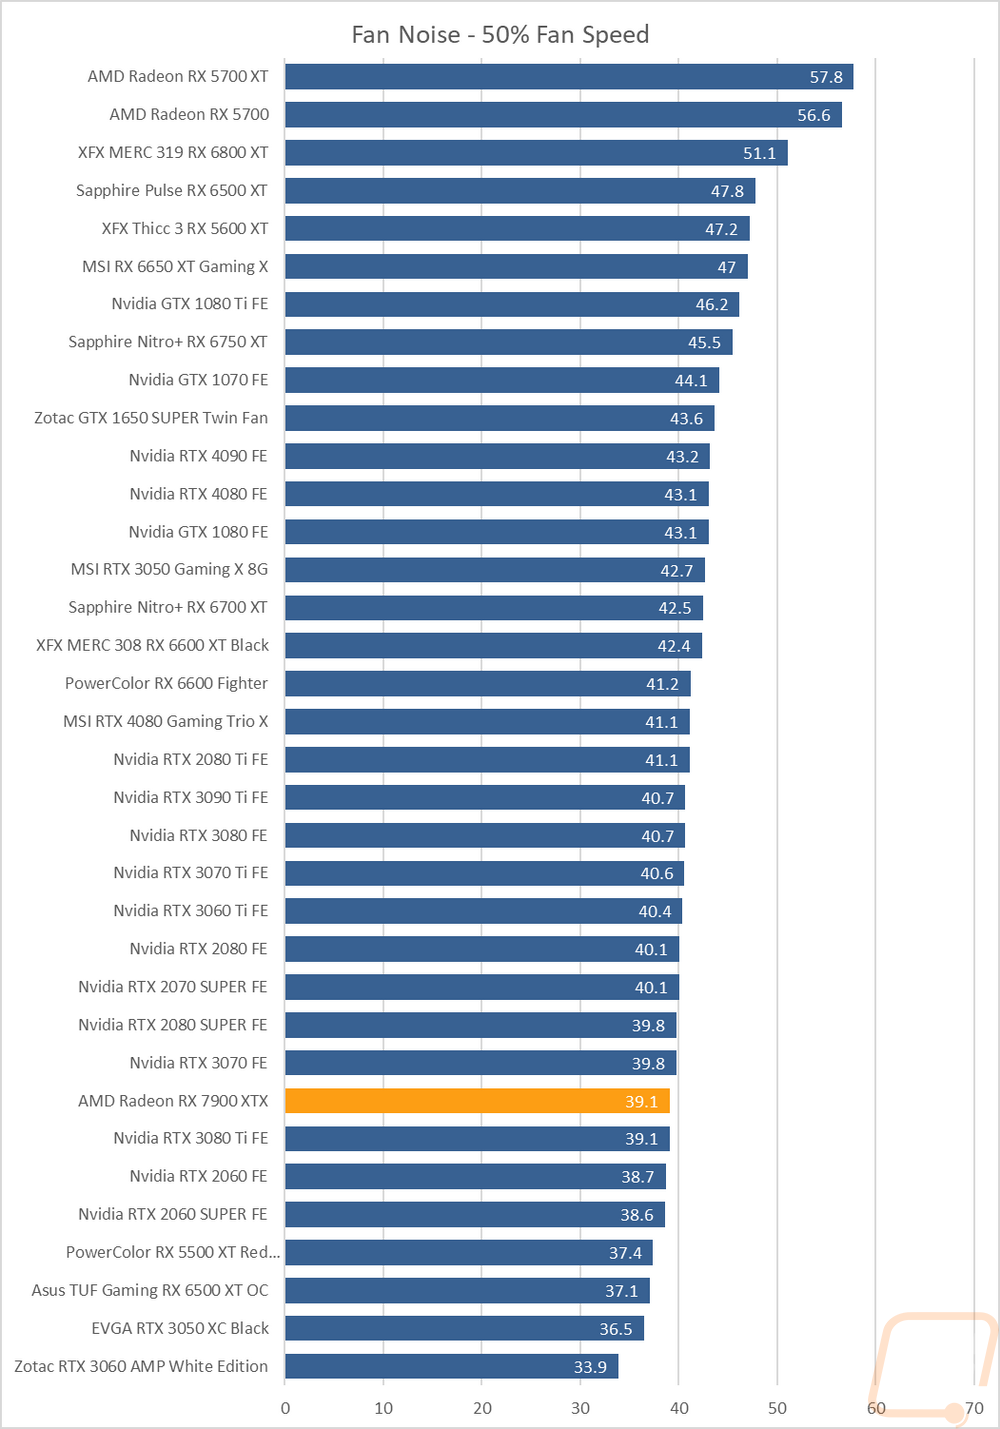
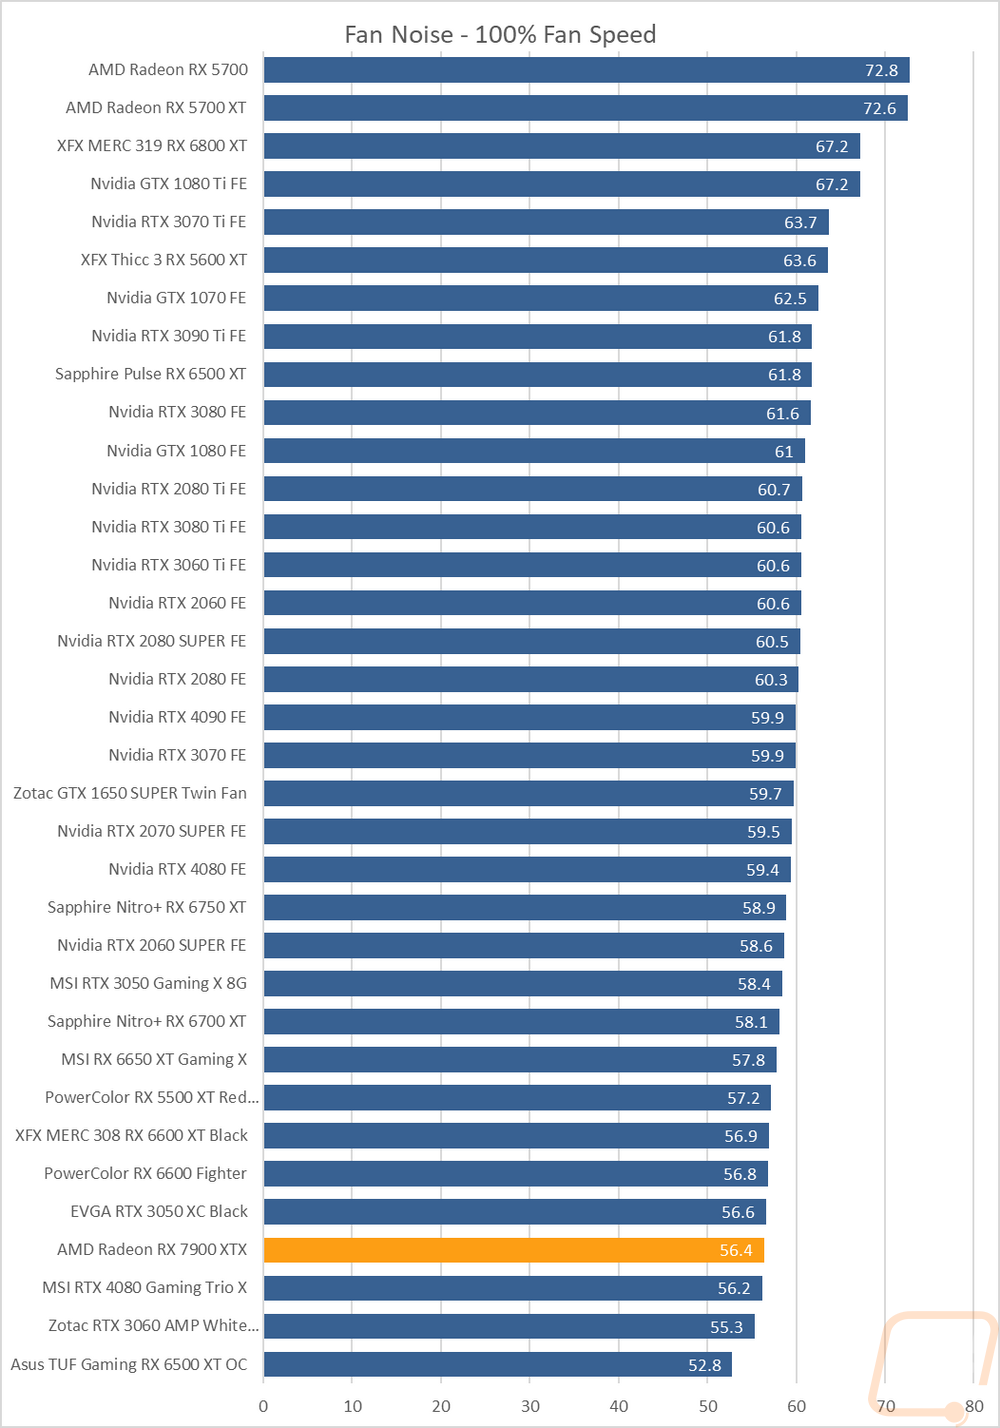
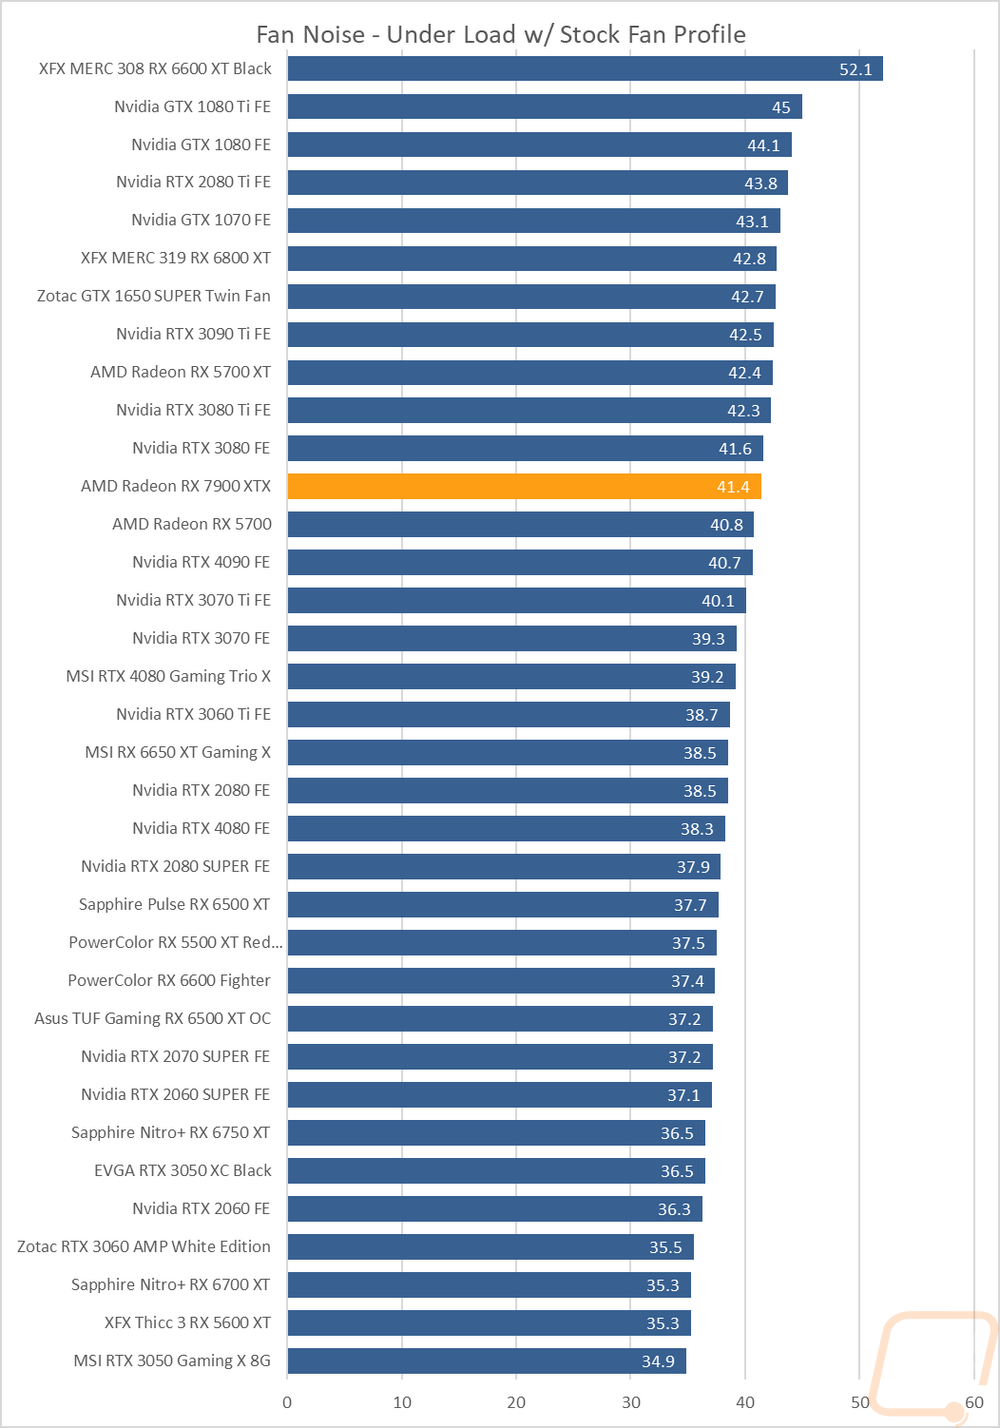
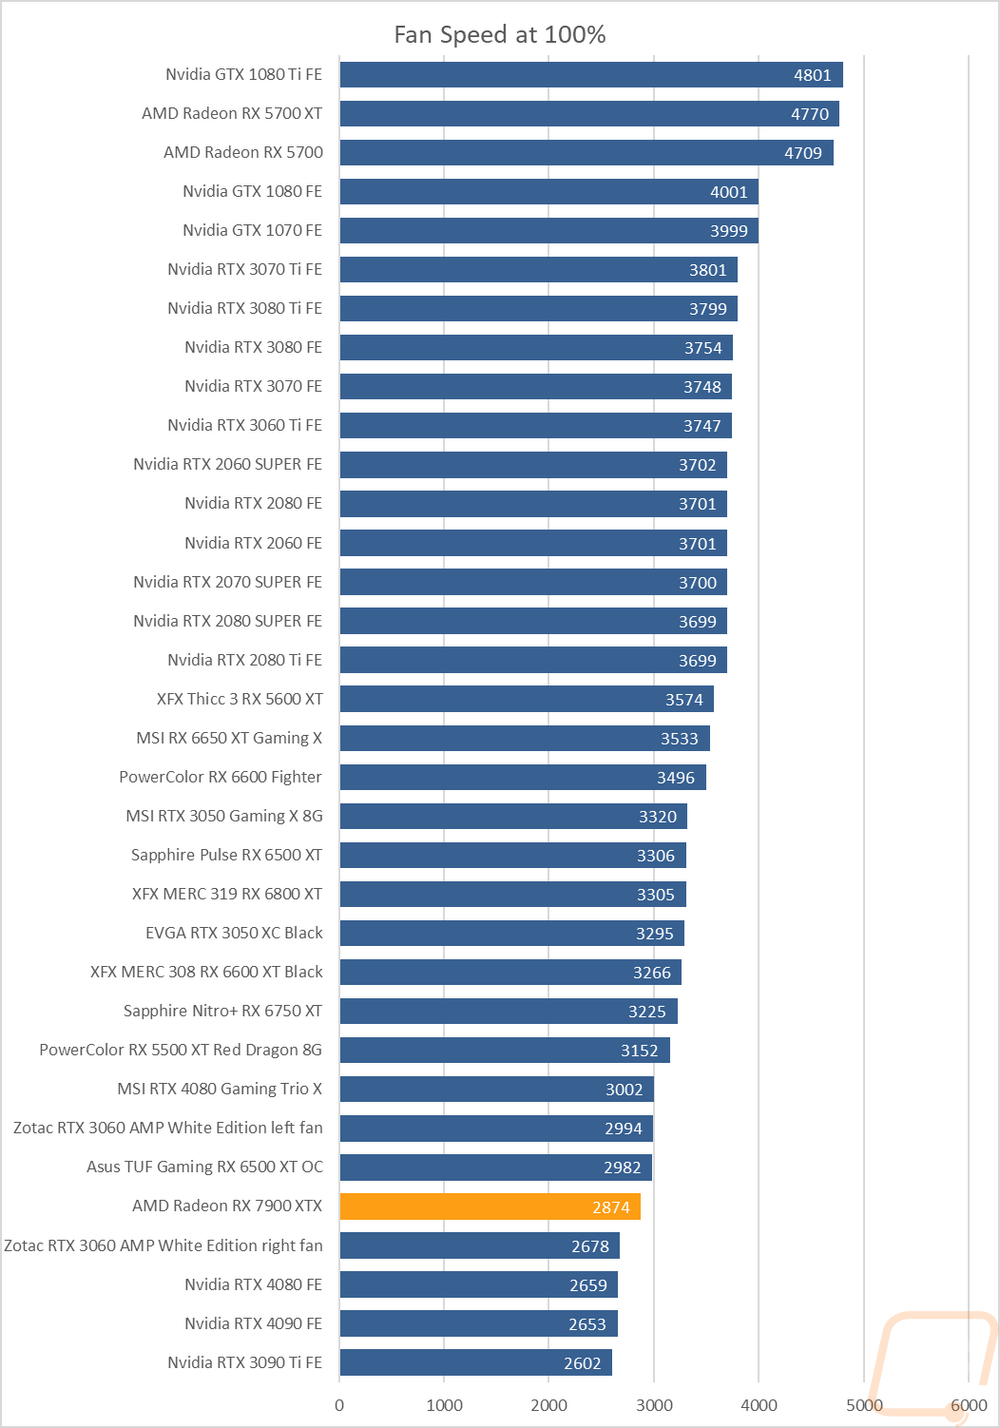
My next round of tests were looking at noise levels. These are especially important to me because I can’t stand to listen to my PC whirling. Especially when I’m not in game and other applications are using the GPU. For my testing, though I first tested with the fan cranked up to 100% to get an idea of how loud it can get, then again at 50% to get an idea of its range. The 7900 XTX reference design did well here, especially for having three fans reading 39.1 decibels on the 50% fan speed test, and was also down at the bottom of the chart at 100% fan speed at 56.4 decibels. The fan RPM chart does show us a little why that is though with the fans running just at 2874 RPM at 100% fan speed. I also take a look at noise performance while under load. For that when running AIDA64’s stress test I wait until the temperature of the card has leveled off and then measure how loud things are when the card is at its worst-case scenario with the stock fan profile. Here the 7900 XTX was higher up in the chart with its 41.4 decibel result which was a little higher than the 4090 FE did in the same test.
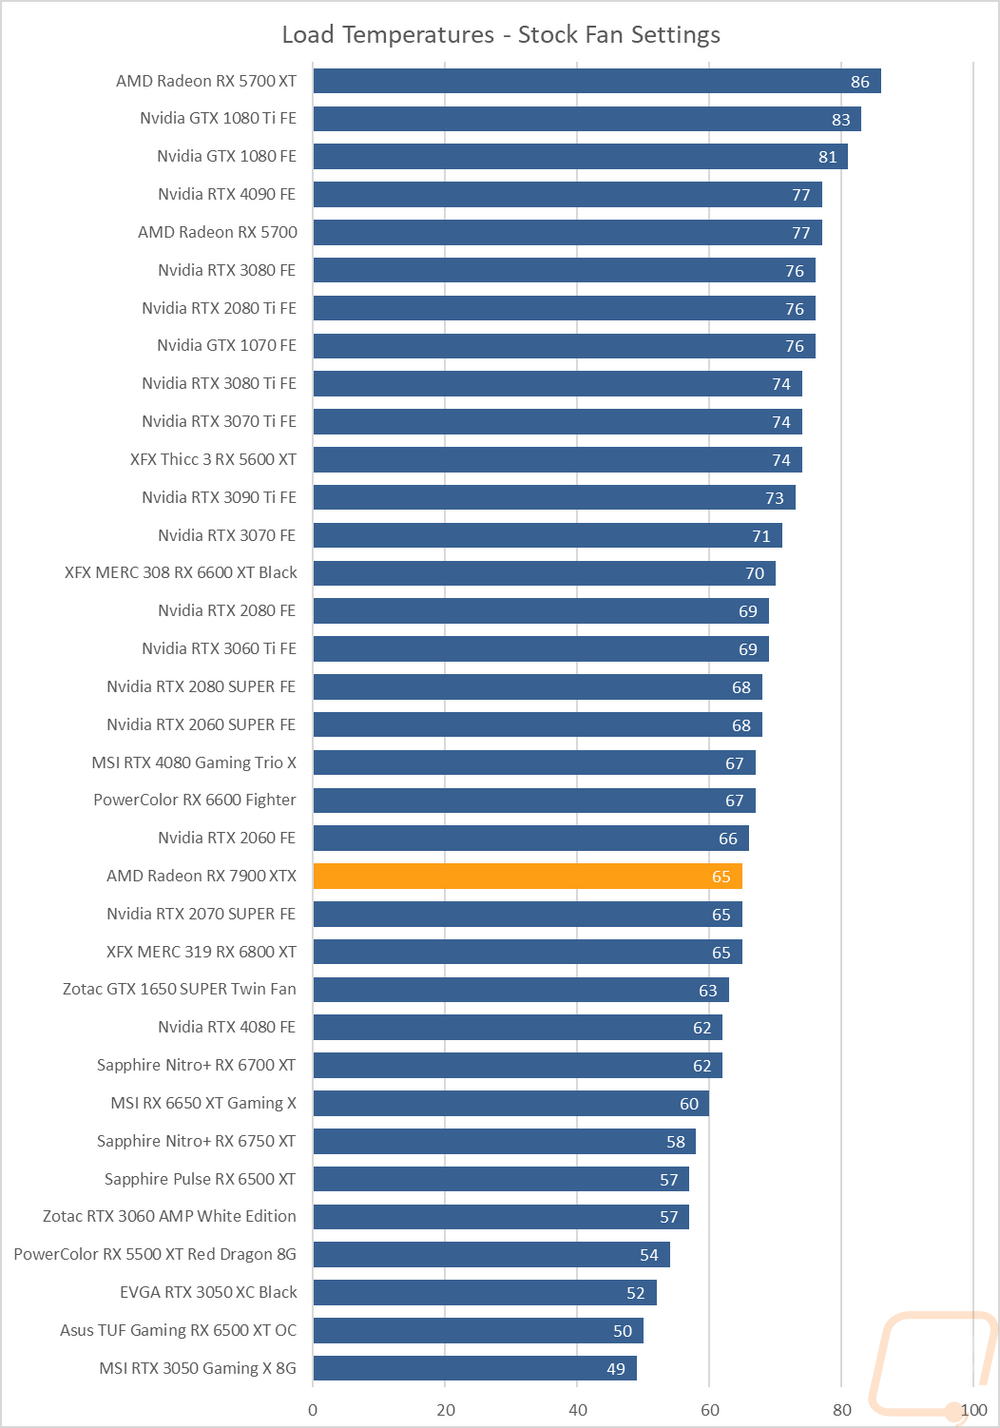
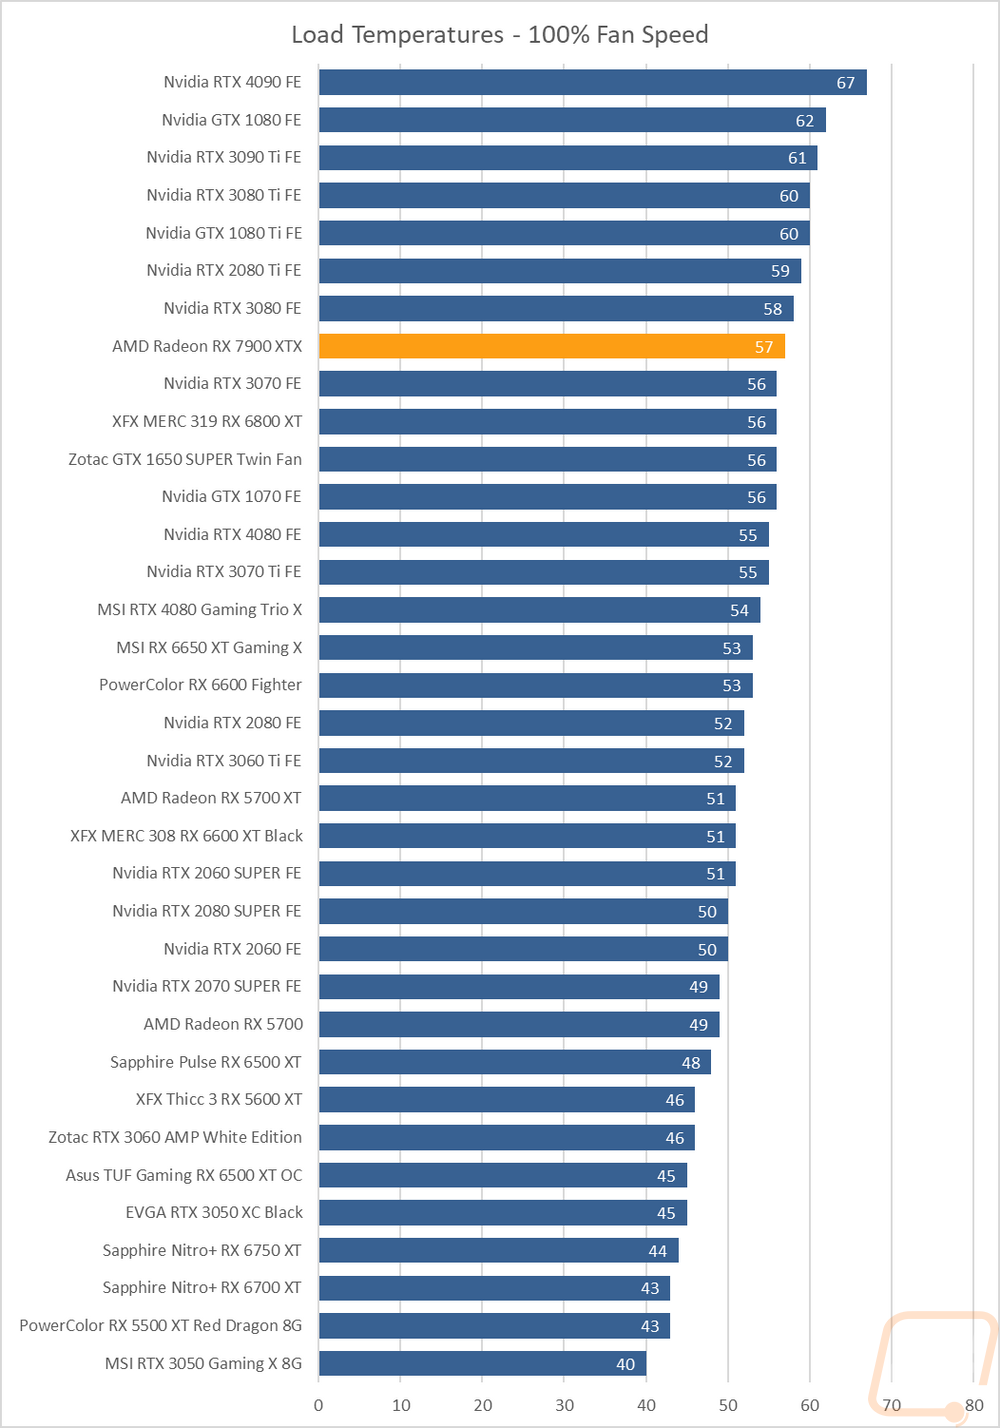
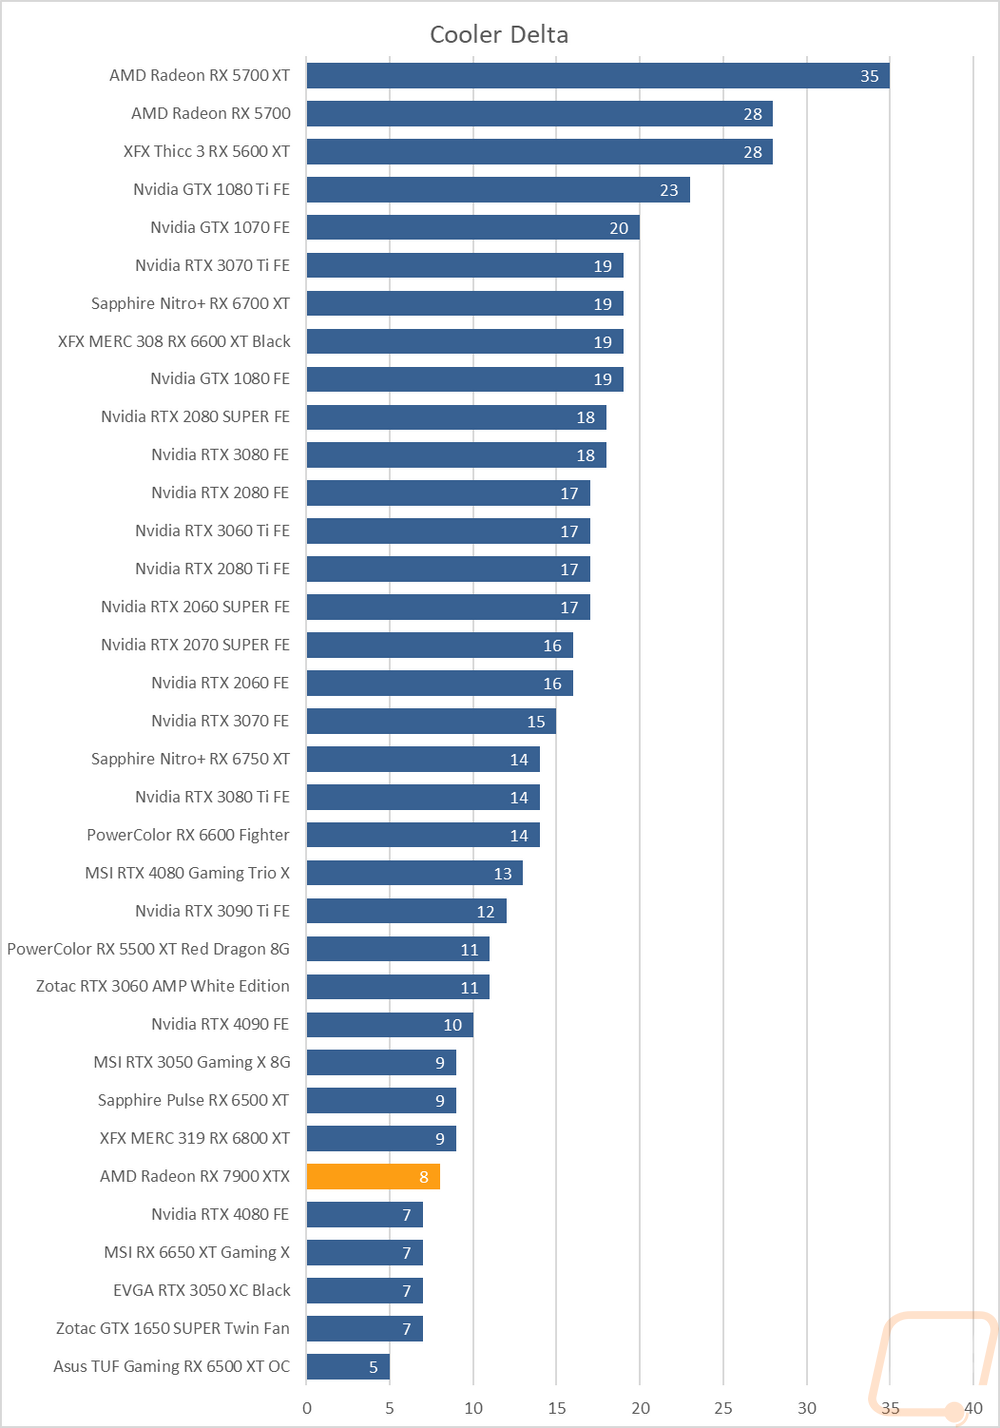
To finish up my testing I of course had to check out the cooling performance. To do this I ran two different tests. I used AIDA64’s Stress Test run for a half-hour each to warm things up. Then I documented what temperature the GPU leveled out at with the stock fan profile and then again with the fans cranked up to 100%. With the stock profile, the 7900 XTX peaked at 65c which put it in the lower half of our charts, and given the higher noise results under load in my noise testing, this also tells us that AMD was a little more aggressive with their stock fan profile. Then with the fans cranked up, the 7900 XT was running at 57c which is even higher up in our charts, having the lower fan RPM is a limitation here. Overall neither were bad results, especially for a normal sized card against mostly giant cards. The 8c delta between the two results does tell us that at the limited fan speeds the cooler doesn’t have too much more headroom left in it so if you are looking to overclock some of the larger aftermarket cards would be the better option. I should also point out that I did also keep an eye on the GPU hotspot temps when doing these tests as well and both the stock fan profile and 100% fan speed tests had the hotspot at a steamy 109c.
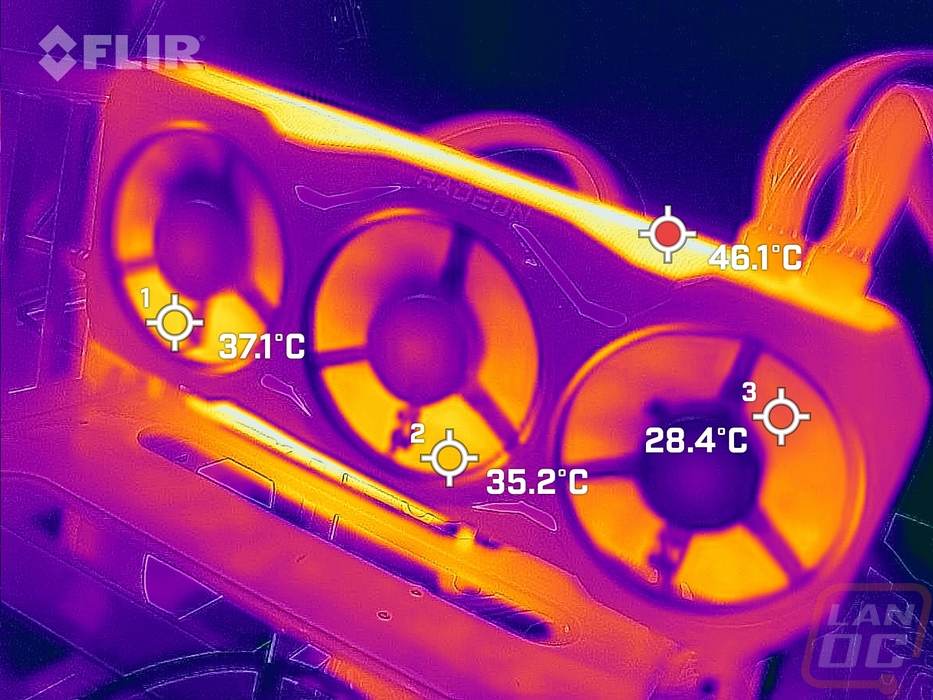
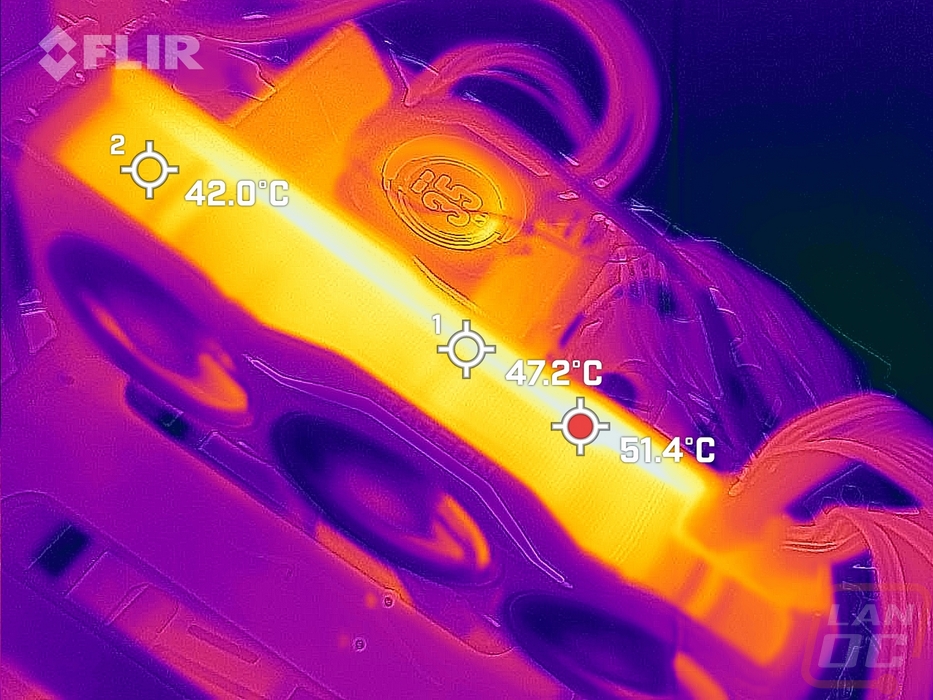
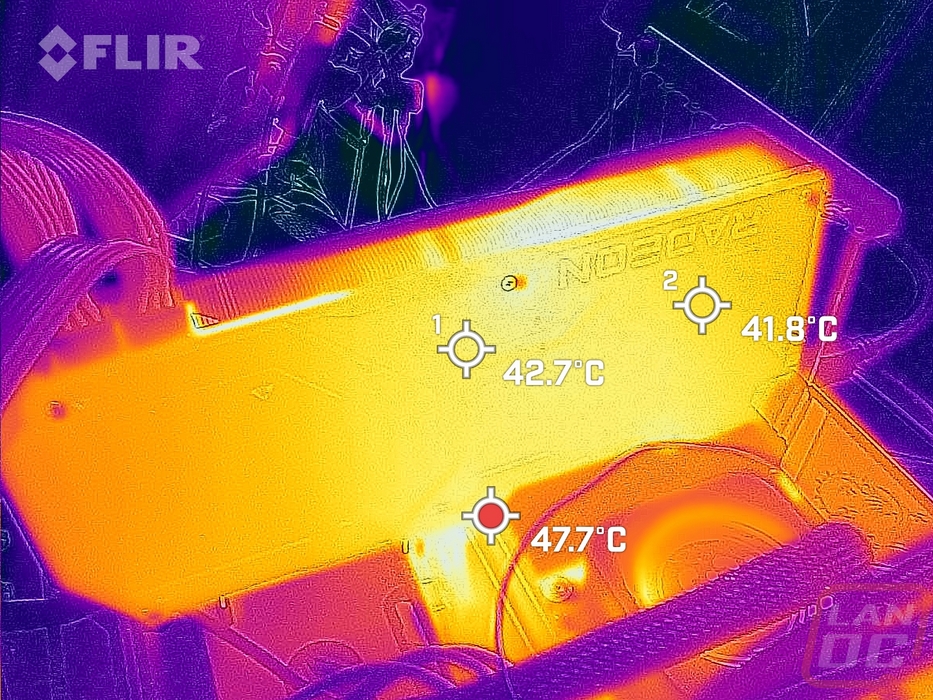
While running the stock fan profile testing I also took the time to get a few thermal images so we could see what is going on. The 7900 XTX on the fan side has its hottest spot up on the top where the air is being pushed which isn’t a surprise a tall. There is some extra heat down below the card as well but not as bad as on the top. Through the fans, things are running cooler but overall not bad at all. From the top-down view we get a better look at where the heat is and the hottest areas are along the PCB which isn’t a surprise, the heatsink itself even with all of the warmed air coming out this direction is a little cooler, especially towards the ends of the card. The power connection area is also especially cool with that insulated section keeping it away from the heatsink. Then on the back, we can see the metal backplate is transferring the heat out. The middle section near the back of the GPU is the warmest but overall the temperature difference across the back is minimal.