CPU Performance
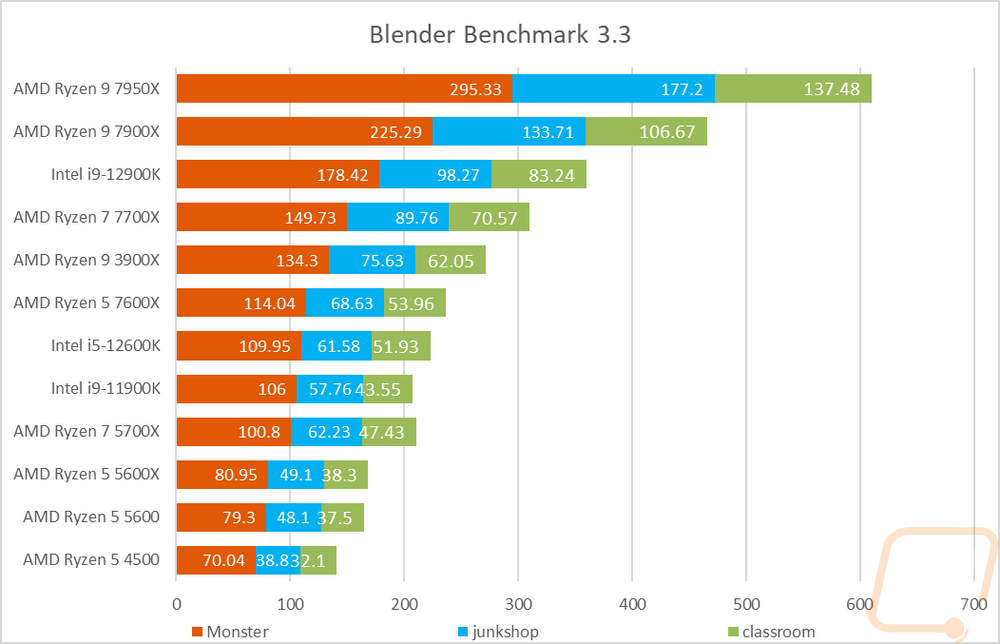
To start testing off I went with a rendering-focused benchmark with the always popular Blender. This benchmark was recently updated so our result list is smaller here. I have all three tests stacked together so we can see an overall of them altogether. Blender loves the higher core counts so the older 3900X did well here. Both the 7950X and the 7900X jumped ahead of the 12900K by a large margin with their higher core counts, especially the 7950X which is ahead of even the 7900X before adding in the classroom result.
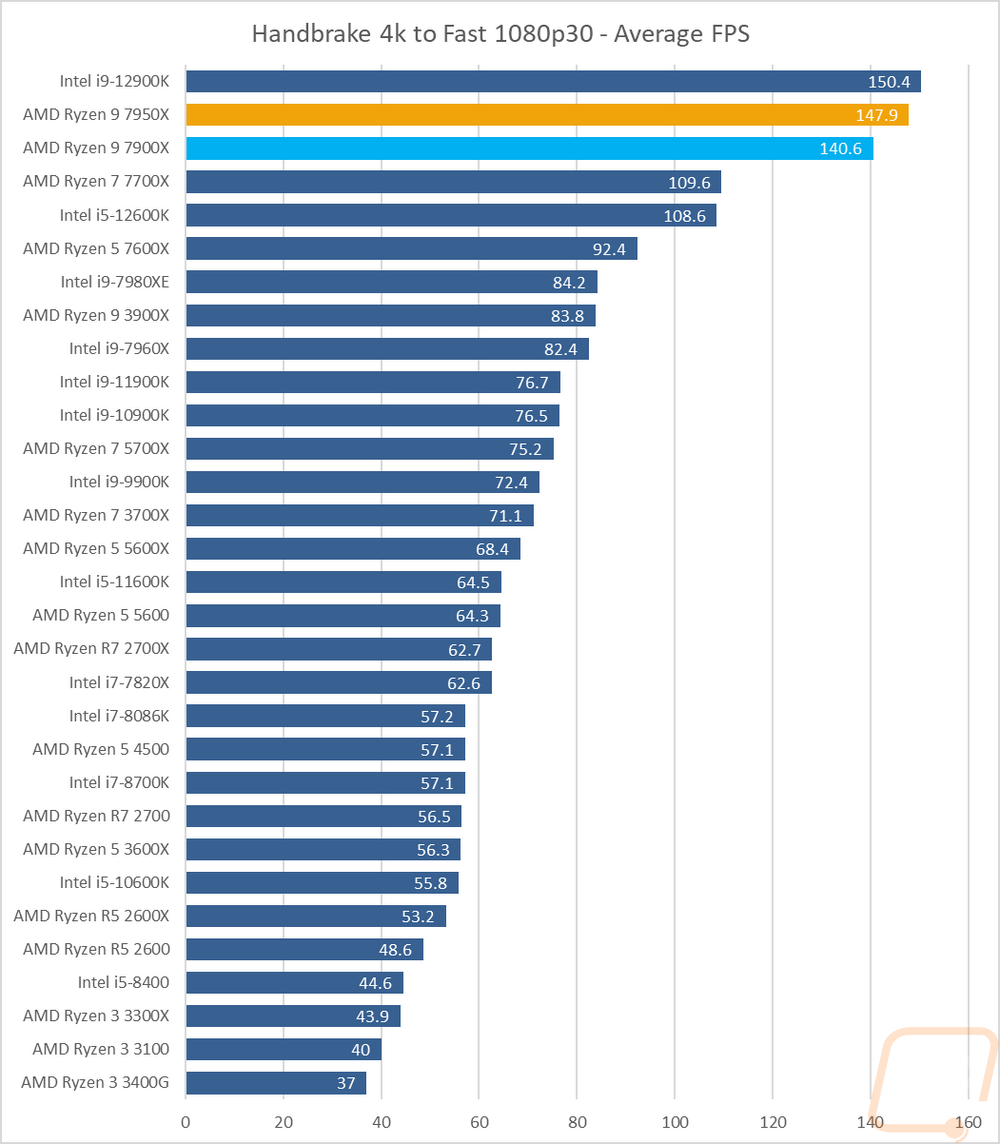
Continuing with the video encoding theme I also have Handbrake which is an open-source transcoder. For this test I am taking a 4k video down to 1080p 30 FPS, the results are the average FPS of that task. The 12900K is still in the lead here but the Ryzen 9 7950X is just behind it with both the 7950X and 7900X way out ahead of the rest of the field.
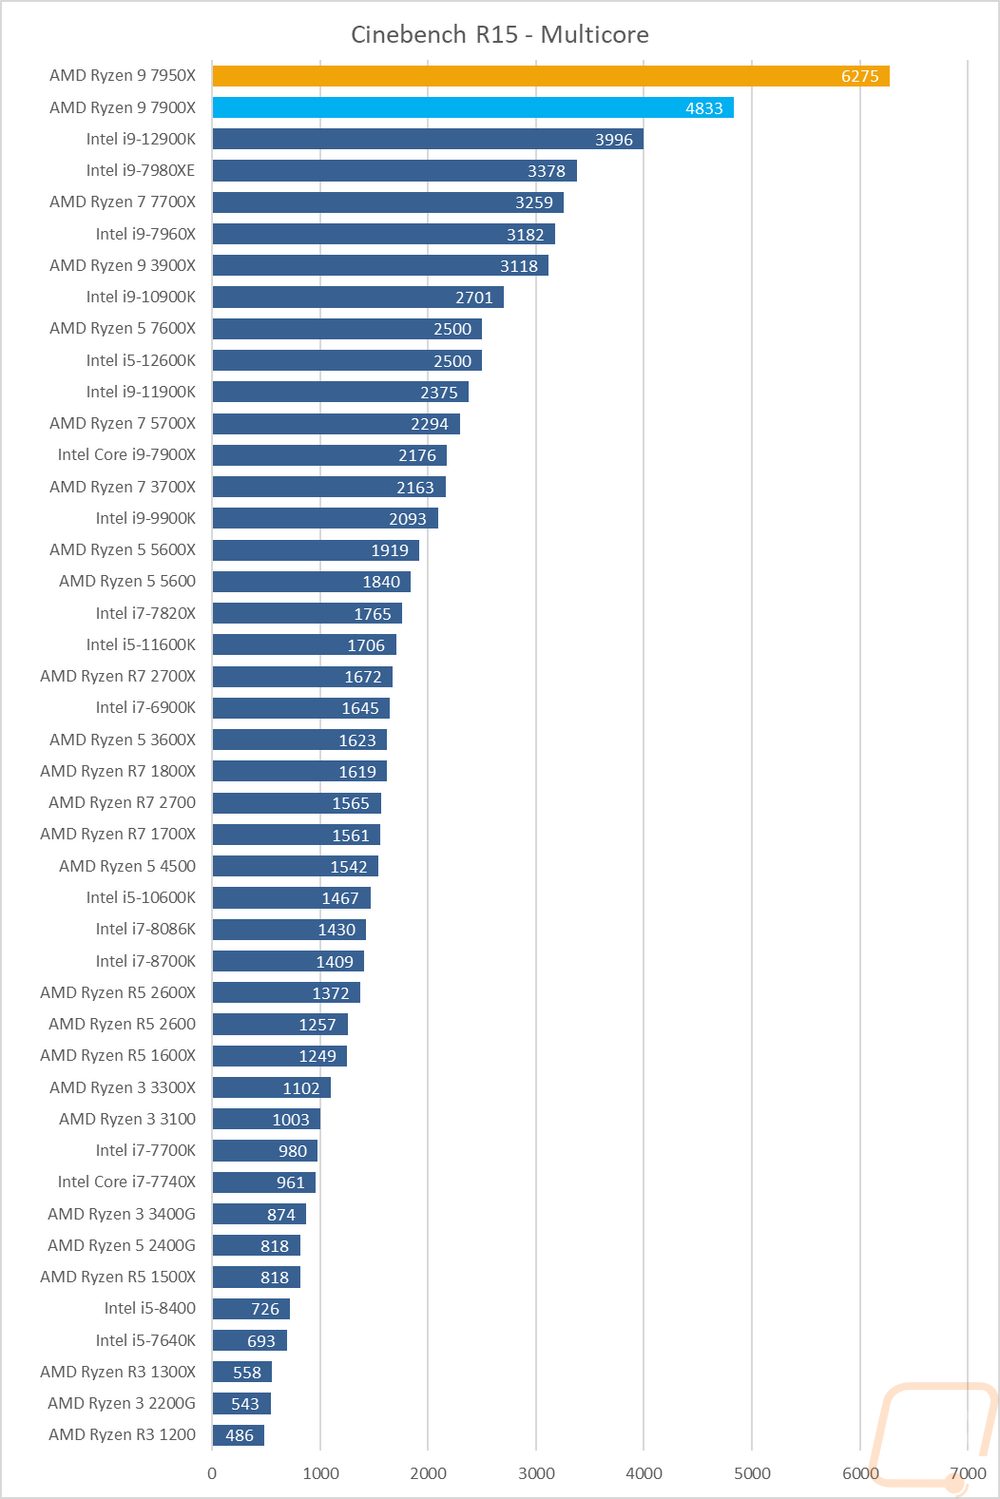
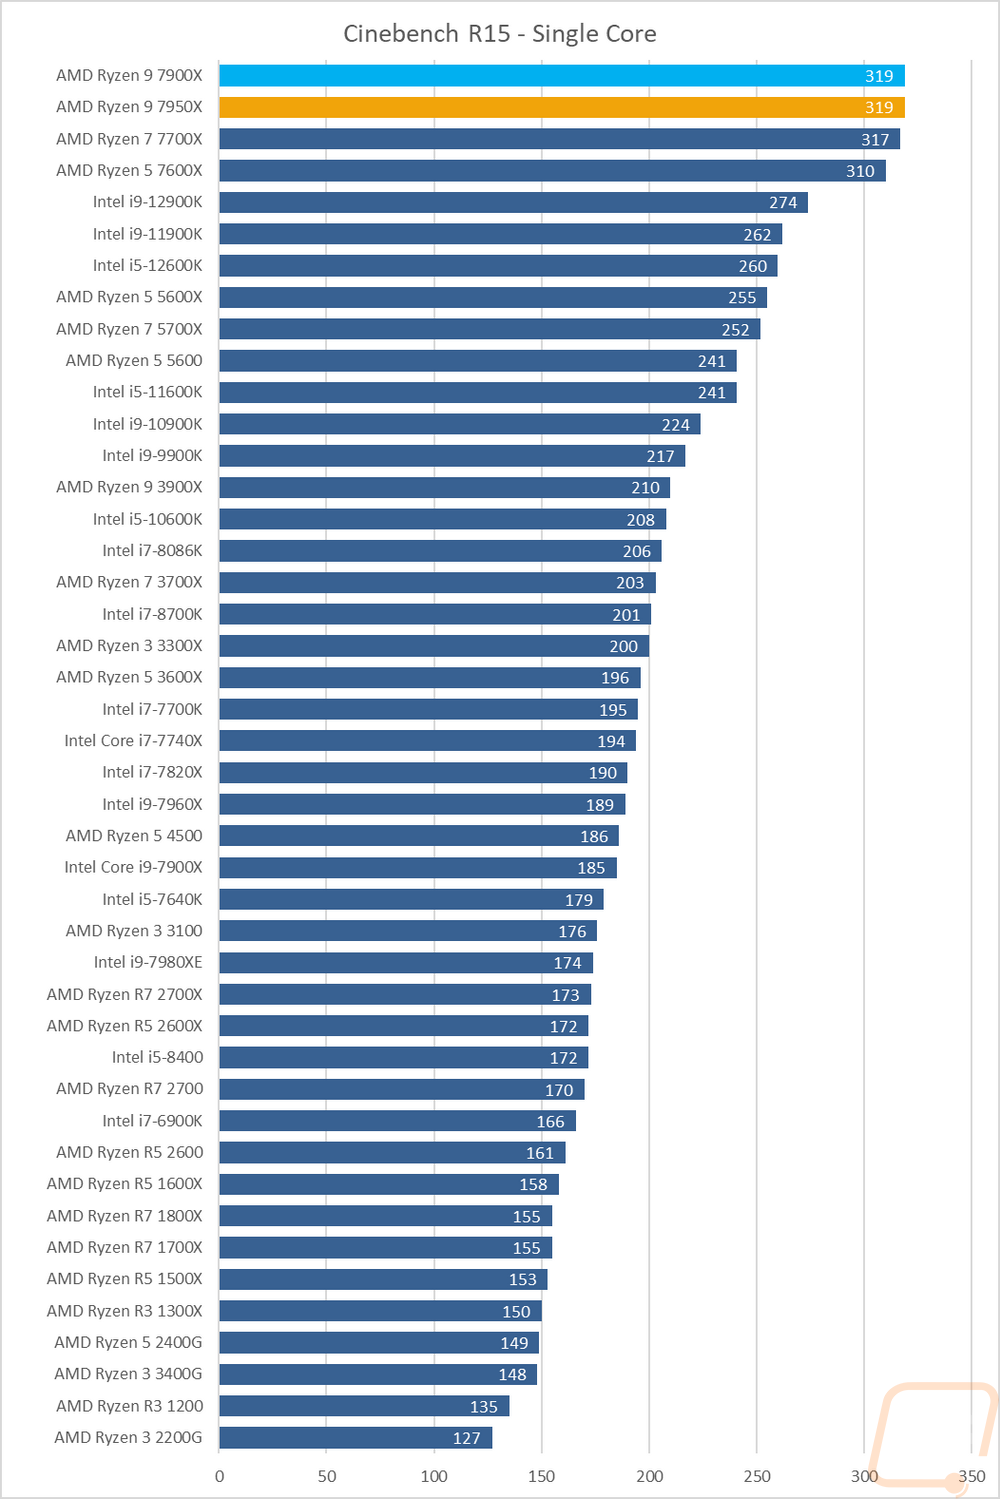
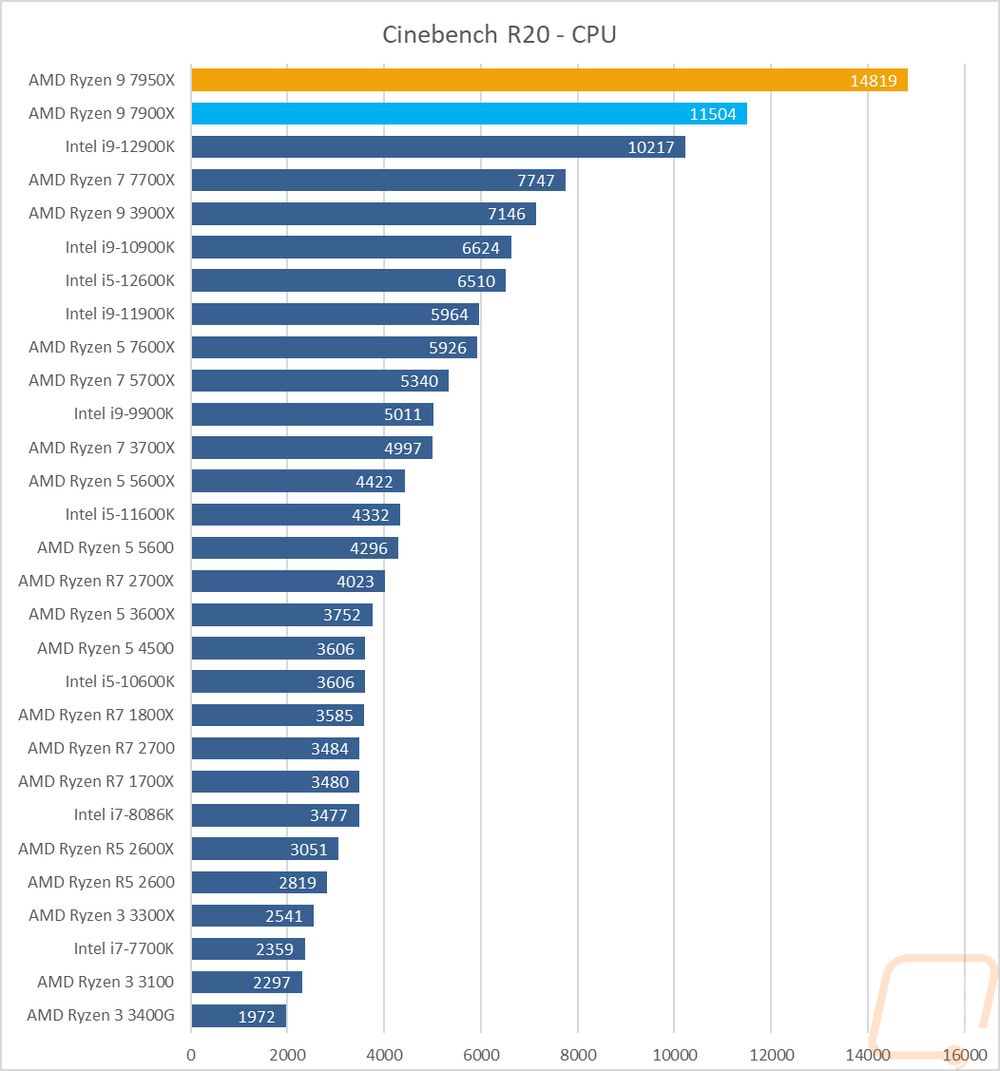
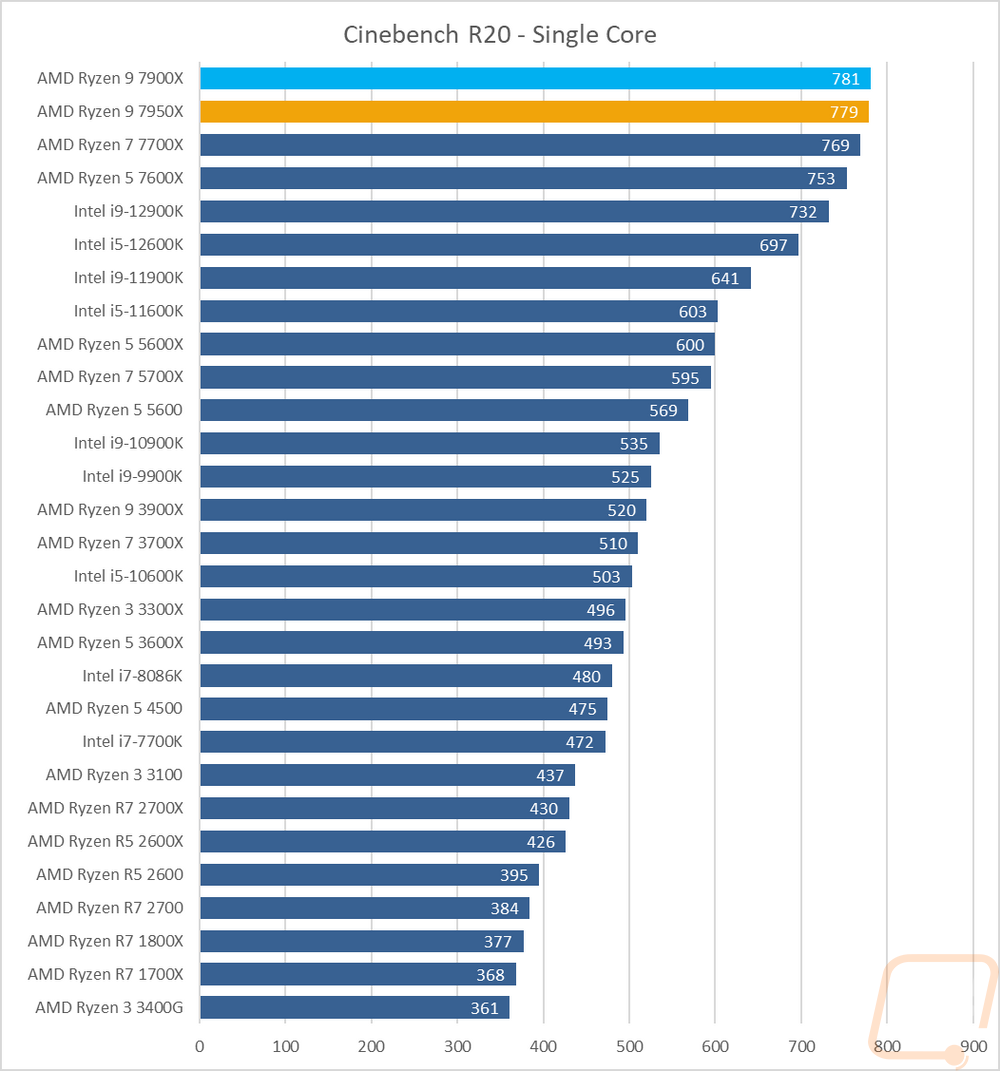
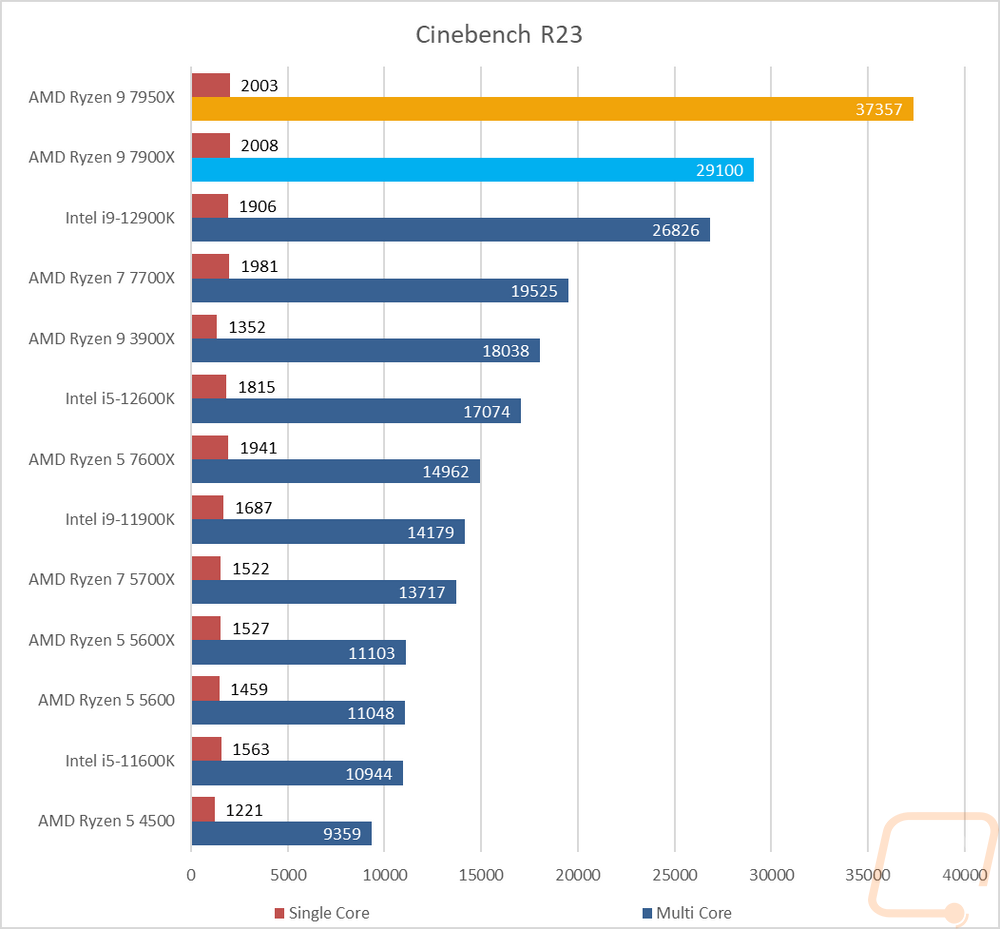
For the always popular Cinebench, I ran the three most recent versions. These are once again rendering and the latest R23 test is the most relevant for current applications but I love being able to see how everything compares in some of the older tests as well. In R15 the multicore test show just how well both Zen 4 Ryzen 9 CPUs handle things with the 7950X 2279 points ahead of the 12900K and the 7900X out ahead as well dwarfing the rest of the CPUs tested. The R15 single-core test has a much tighter field but with the IPC of Zen 4 and the high clock speeds, both Ryzen 9 CPUs are tied at the top just ahead of the 12900K. Cinebench R20 was similar in the multicore test with the 7950X and its 16 cores way out ahead and the 7900X being in second but closer to the performance of the 12900K. For R20 single core the 7900X which has a higher base clock did edge out a little ahead of the 7950X and both are 10+ points ahead of the 7700X and 7600X with all four 7000 Series CPUs at the top. Then the last and latest Cinebench R23 has the 7900X slightly ahead on the single-core test with both almost 100 points ahead of the 12900K there and then on the multi-core test, the 7950X is way out in front with the 7900X and the 12900K closer together.
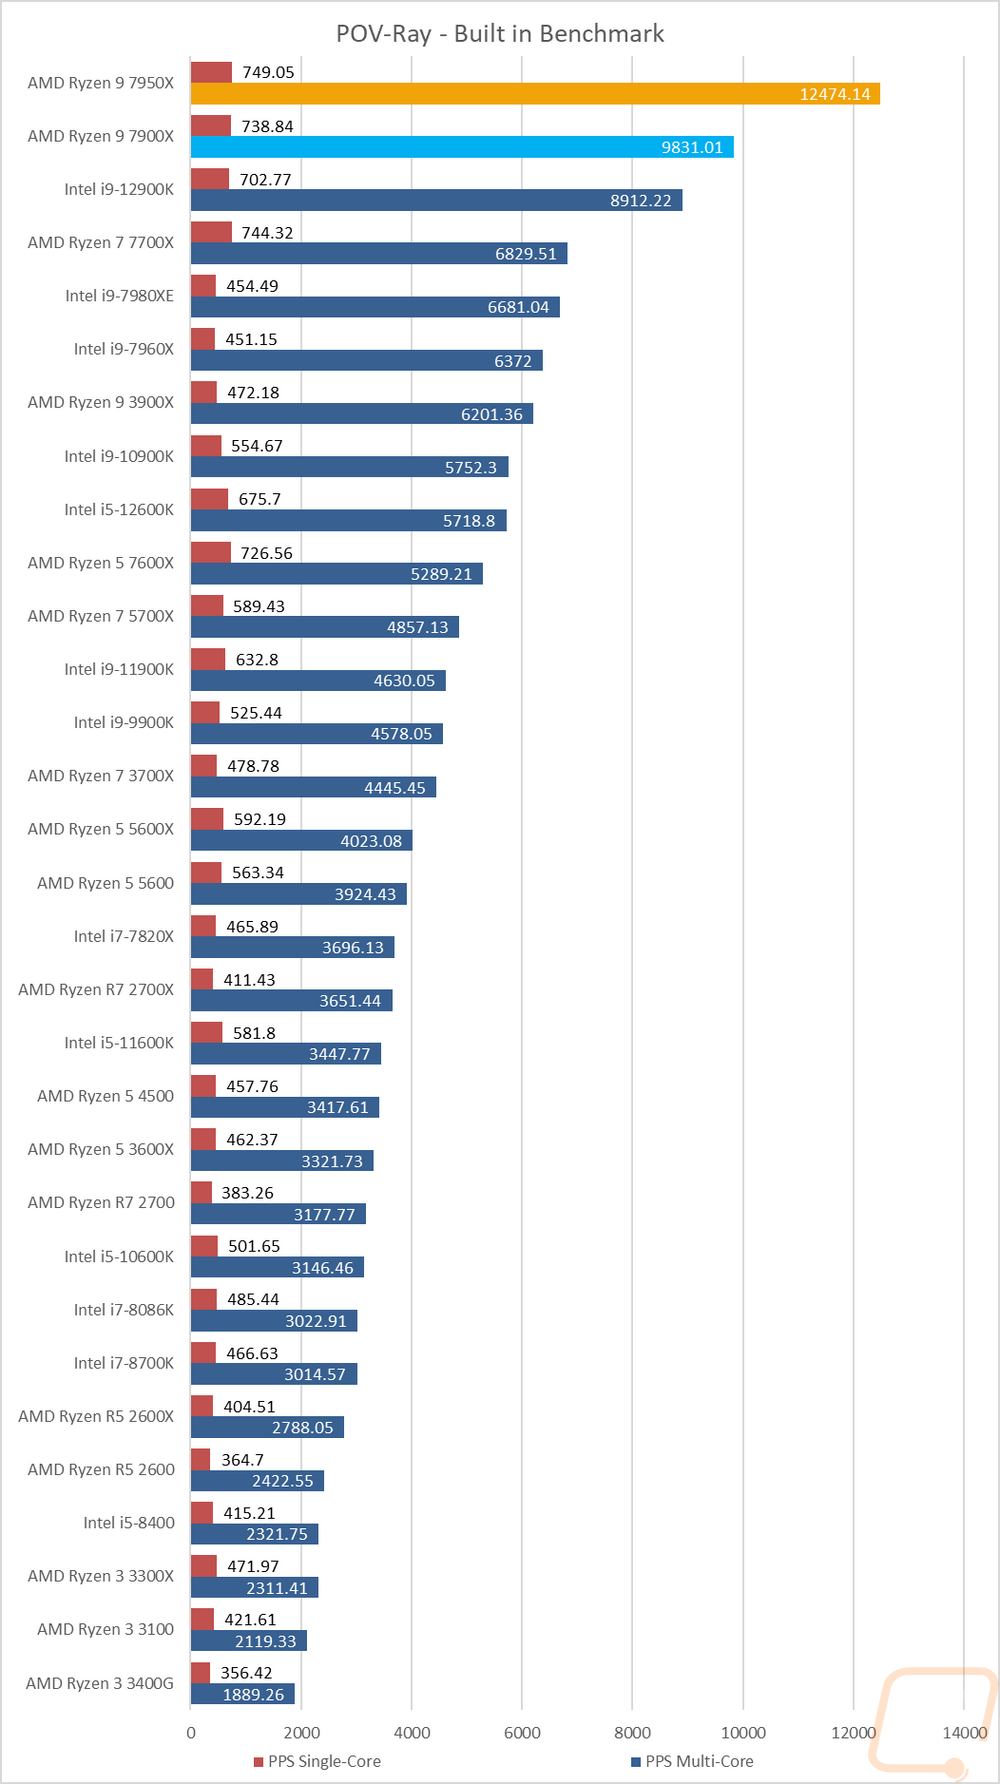
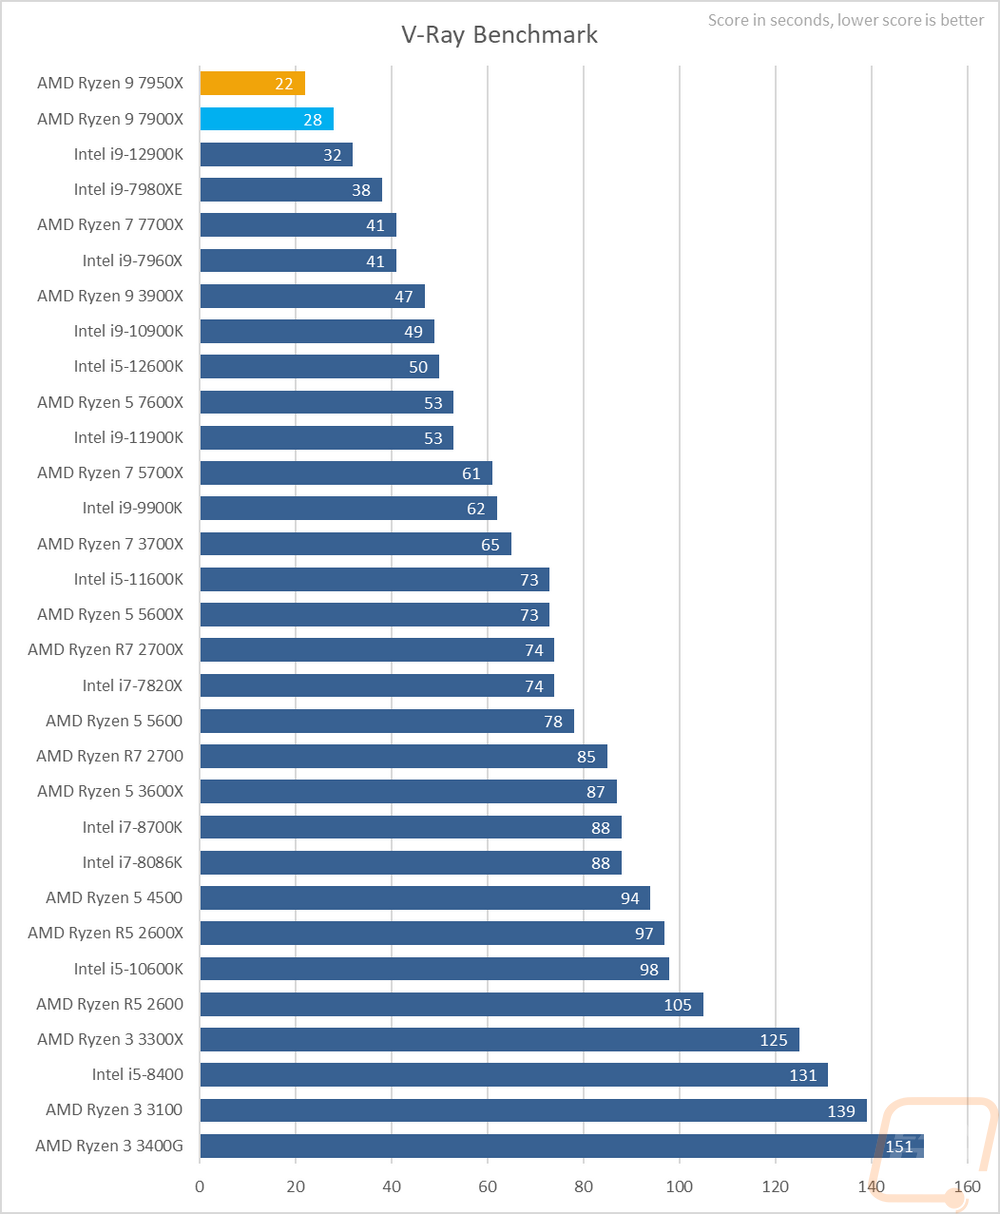
Next up we have ray tracing focused rendering benchmarks. Here I tested the CPUs in POV-Ray and V-Ray. POV-Ray was also tested with a single core and across all of the cores. In POC-Ray both the 7950X and the 7900X are out ahead of the 12900K with the 7950X over 3500 points ahead of the 12900K. The single core results are closer but all of the Zen 4 CPUs did well with them. Then in V-Ray, the 7900X edged out 4 fewer seconds than the 12900K and the 7950X did it in an even more impressive 22 seconds which is 10 seconds or a 31% improvement!
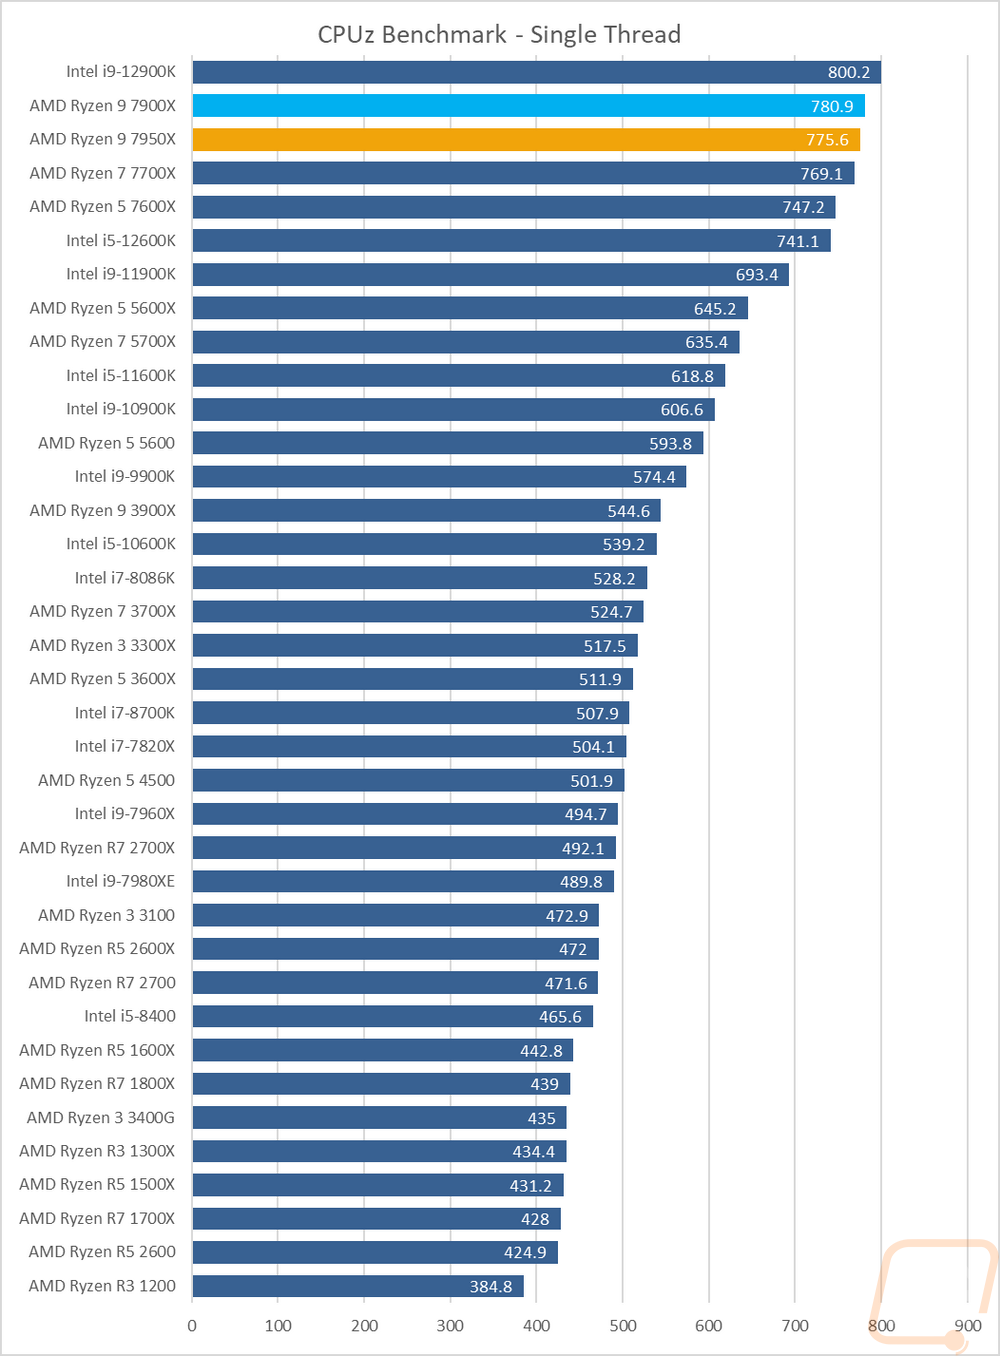
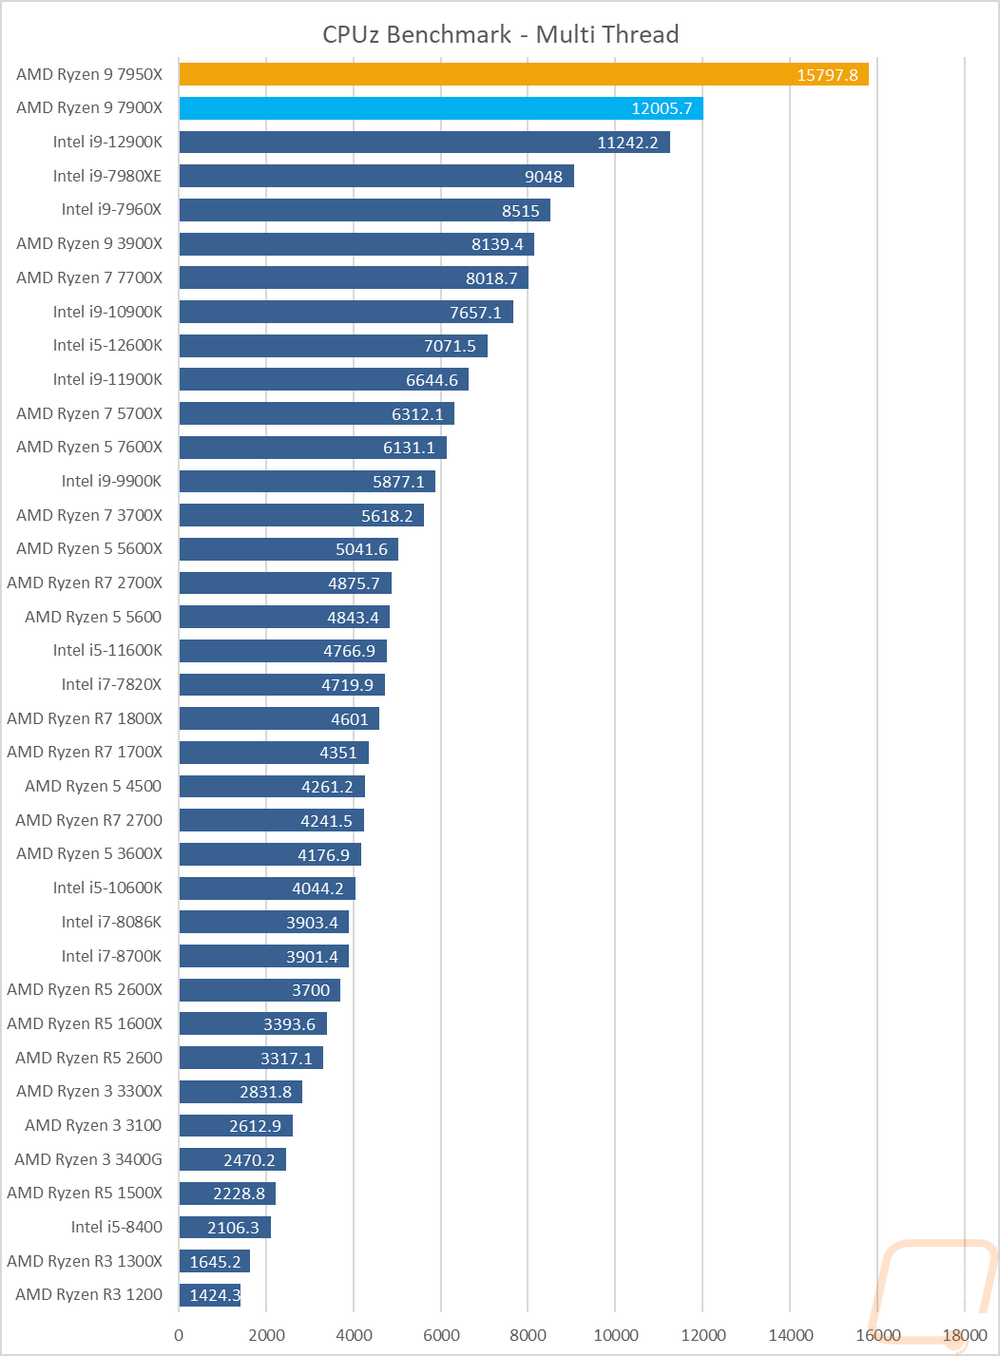
I also tested using the CPUz’s built-in benchmark which does run on a single thread and with all threads. I think this is the only result that shows the 12900K ahead in a single-threaded test, the 7950X and 7900X did close the gap slightly with both of them being a little faster than the 7700X. For the multi-thread CPUz test, it really likes the high core count CPUs and the 7950X and 7900X are both high core count with 12 and 16 cores putting the 7900X ahead of the 12900K and the 7950X way out ahead of both.
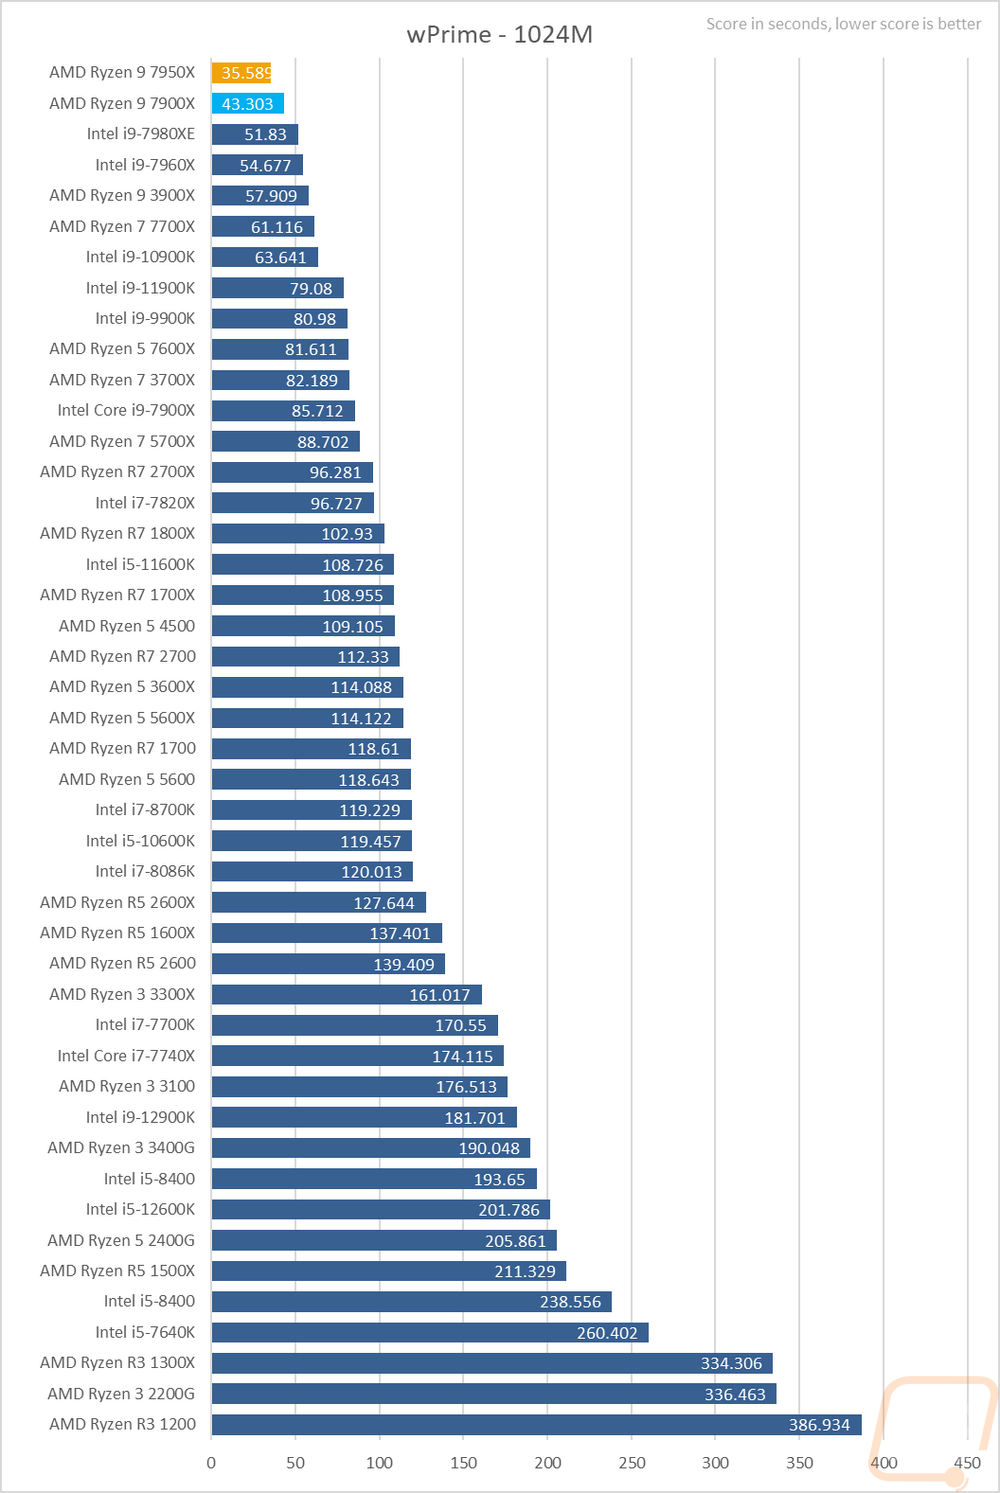
Next, we have wPrime which is a classic overclocking benchmark that calculates pi out to 1024 million digits and is timed. This is a multi-thread heavy test which has the older high core count CPUs still all over the top of the charts so it isn’t a surprise that both the 7900X and the 7950X are at the top.
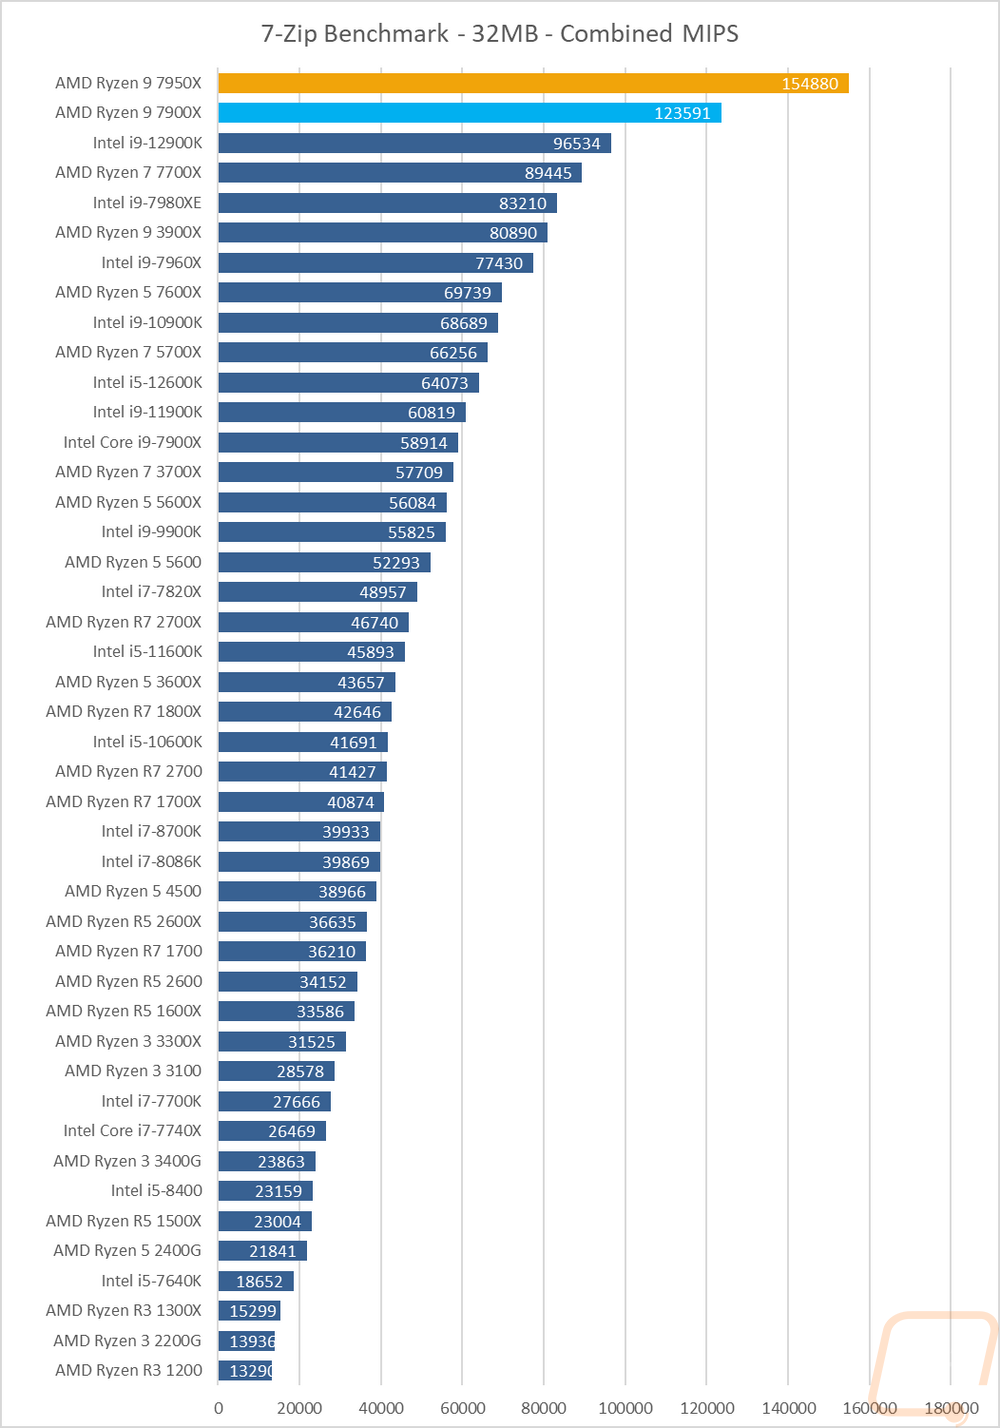
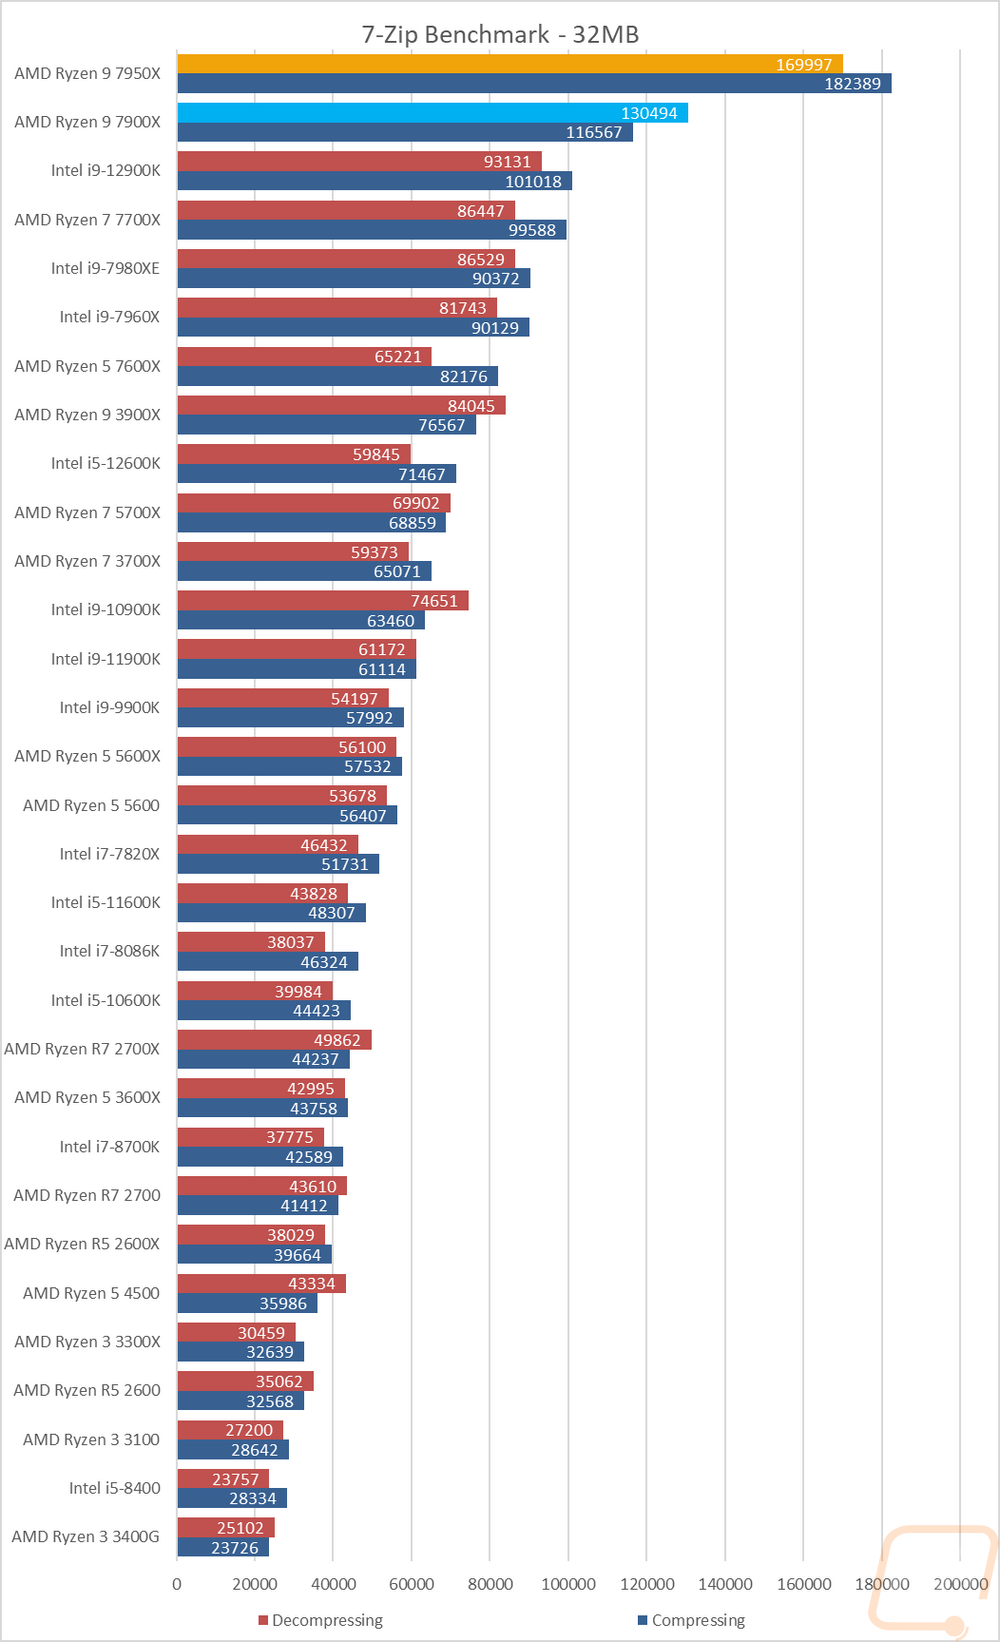
7 Zip is another open-source program, this time for compressing and decompressing all of your files. Here I have run the benchmark and we have three results. The combined MIPS is a combination of compressing and decompressing performance. Then I have it broken down between the two. This workload likes extra cores which can be seen with the CPUs that are up at the top being some of the older high core count CPUs that I have tested in the past. The high core count of both Ryzen 9 CPUs and their IPC puts them way out in front of everything else we have tested in the past with the 7950X sitting with a 60% improvement over the 12900K.
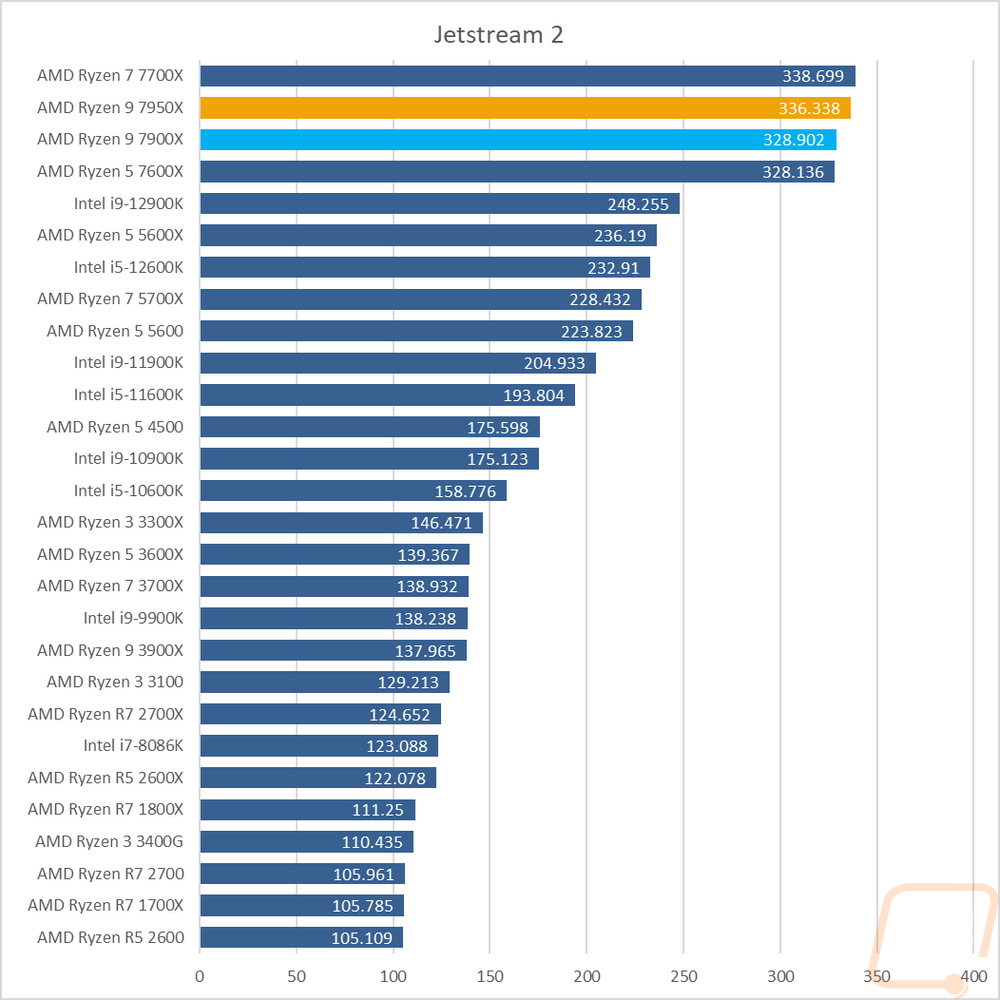
Jetstream 2 is a compilation benchmark that takes a long list of HTML5 and Java in-browser tests and runs them all three times and puts together an overall score. I love this benchmark because let's be honest, most people are using their browser more than any other game or program. Jetstream gives some interesting results sometimes though but it tends to prefer high IPC or single-core performance and there are some situations where it prefers lower core count CPUs and the 7700X being ahead of both the 7950X and 7900X would fall under that, but as a whole, though I was impressed that all four of the Zen 4 CPUs are sitting up at the top way out ahead of everything else tested.
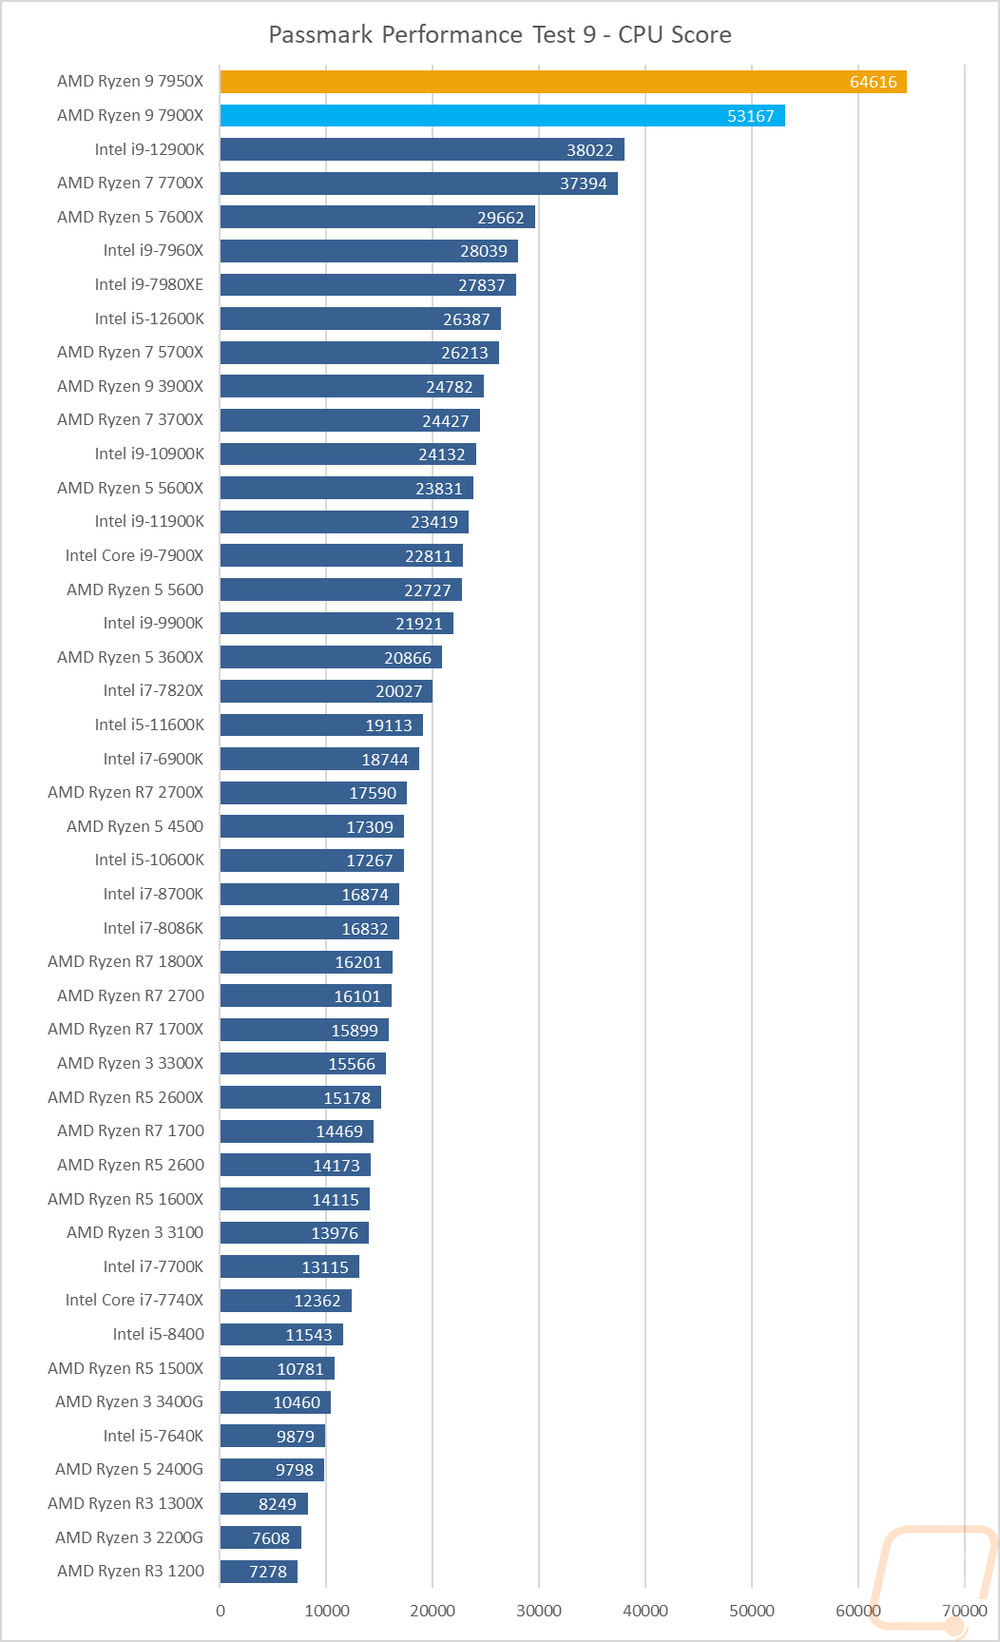
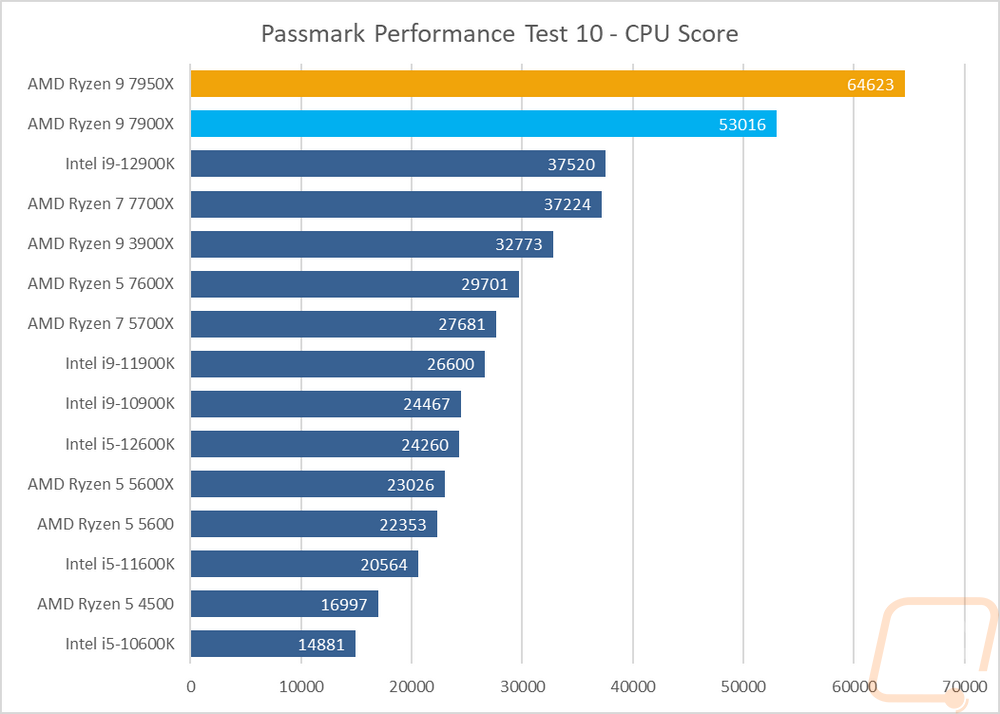
For Passmark Performance Test I took a look at both the older version 9 and the newer version 10. On both, I only look at the overall CPU score which takes a few different synthetic benchmarks and combines the results to put together an overall score. This is another example of the high core count of both of the Ryzen 9 CPUs combined with their clock speed/IPC just making everything else tested look bad. The 12900K is back just above the 7700X and the 7900X is a 39% improvement over it and the 7950X dwarfs that with its 69% improvement in Performance Test 9. Performance Test 10 was similar only with an even larger gap with the performance gap between the 7950X and the 12900K being 72%.
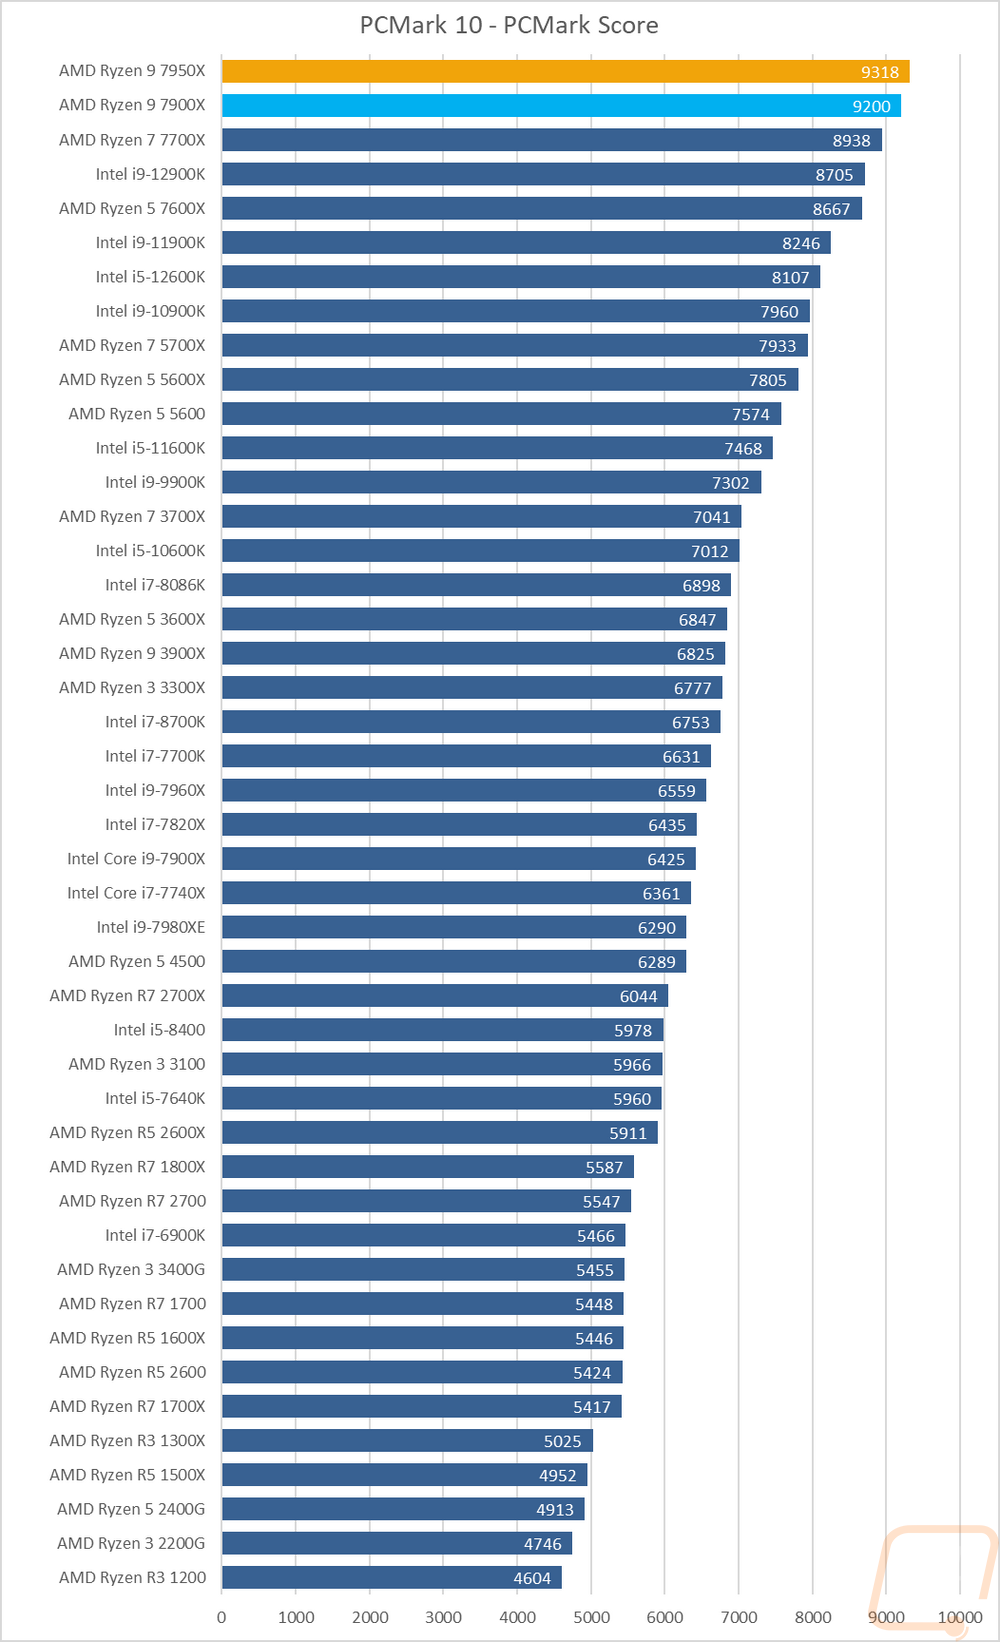
PCMark 10 is a great test because it tests things like video calls, browser performance, excel, and word performance to give an idea of real-world performance. It tends to like higher clock speeds which you can see all of the 5 GHz CPUs up at the top. The 7700X outperformed the 12900K leaving room for the 7900X and the 7950X above that up at the top.
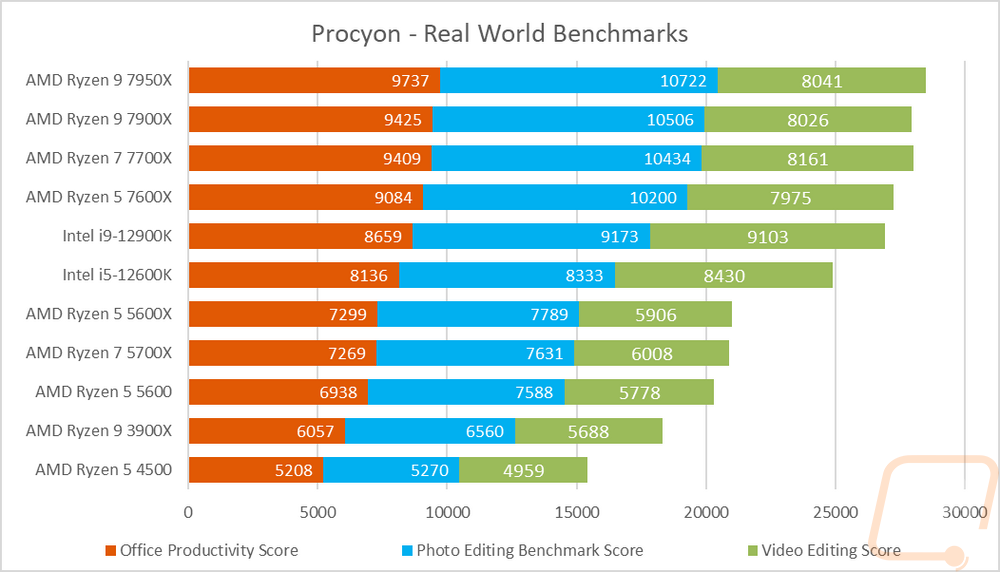
We recently added even more real-world testing with the UL Procyon Benchmarks which are as real-world as they can get using the actual programs that you would use in each test. There are three overall benchmarks, first is the Office Productivity Benchmark which uses Microsoft Office 365 to test actual performance in word, excel, PowerPoint, and outlook. The second benchmark is the Photo Editing Benchmark which is run using the latest version of Photoshop as well as Lightroom Classic to look at photo editing performance. Then the last test is the Video Editing Benchmark which uses the latest version of Adobe Premiere Pro to test video editing performance. I have all three scores stacked together to get an overall look at the performance. All four of the Zen 4 CPUs are at the top here but it is interesting to see how the 7700X with its higher boost clock edges out the 7900X just slightly in the combined results.
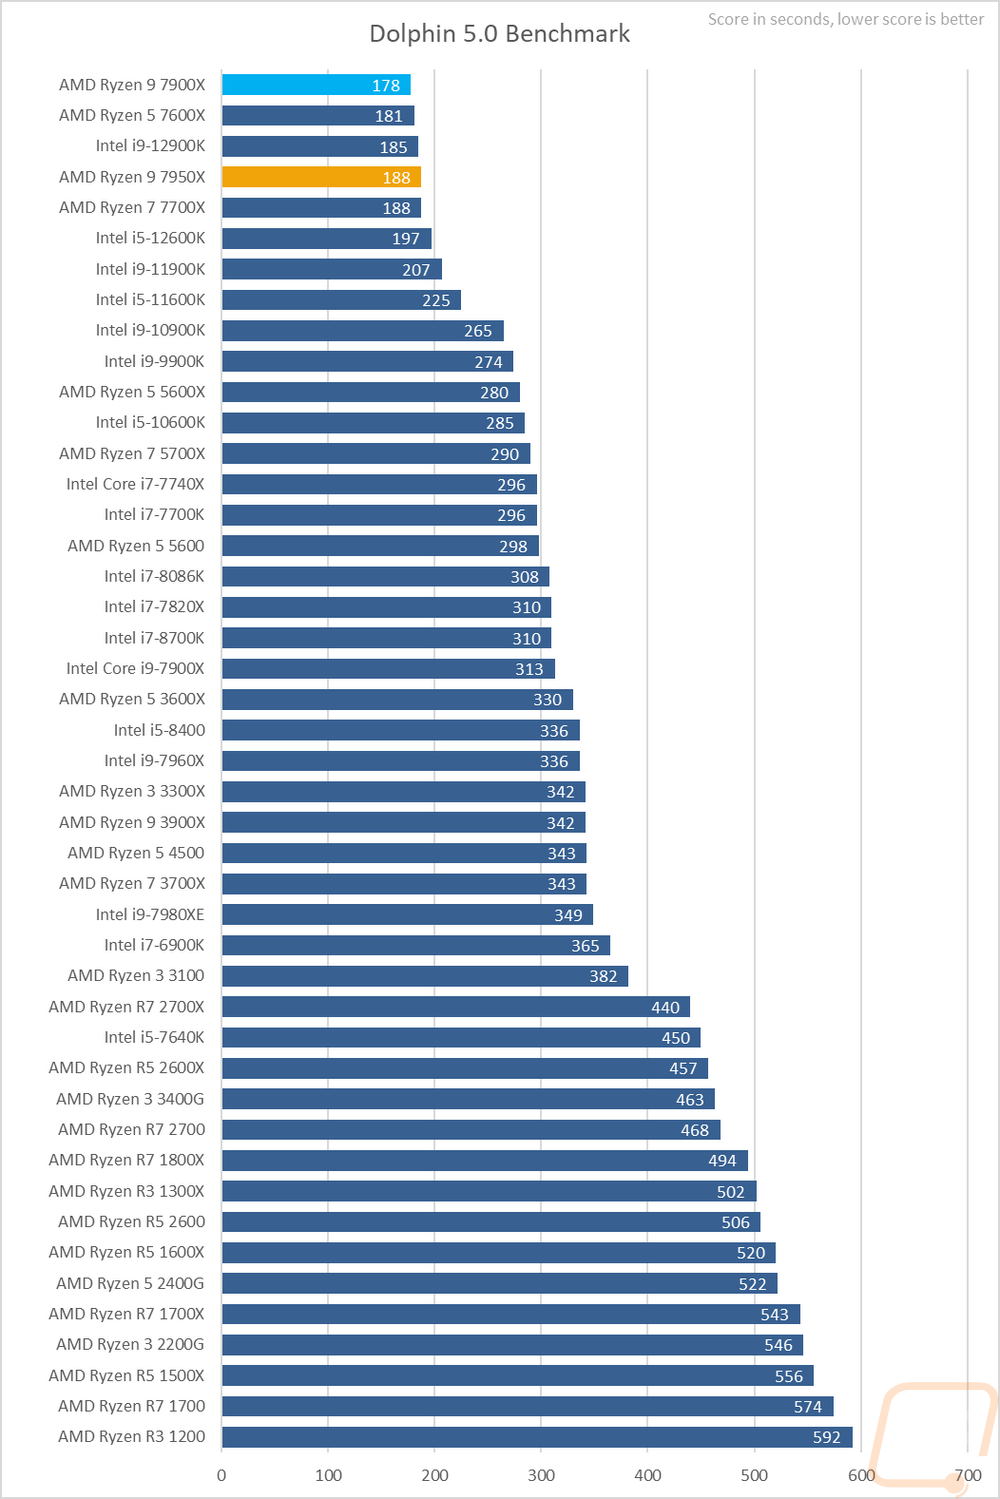
Moving the focus over towards gaming my next test is using Dolphin 5.0 Benchmark. Dolphin 5.0 is a Wii emulator and like most emulators, it doesn’t care about high core counts at all. In fact, it only runs two in total. Clock speeds are king here but apparently, it is all about the base clock speeds with both the 7700X and the 7950X sitting behind the 12900K and the 7900X and the 7600X out in front.
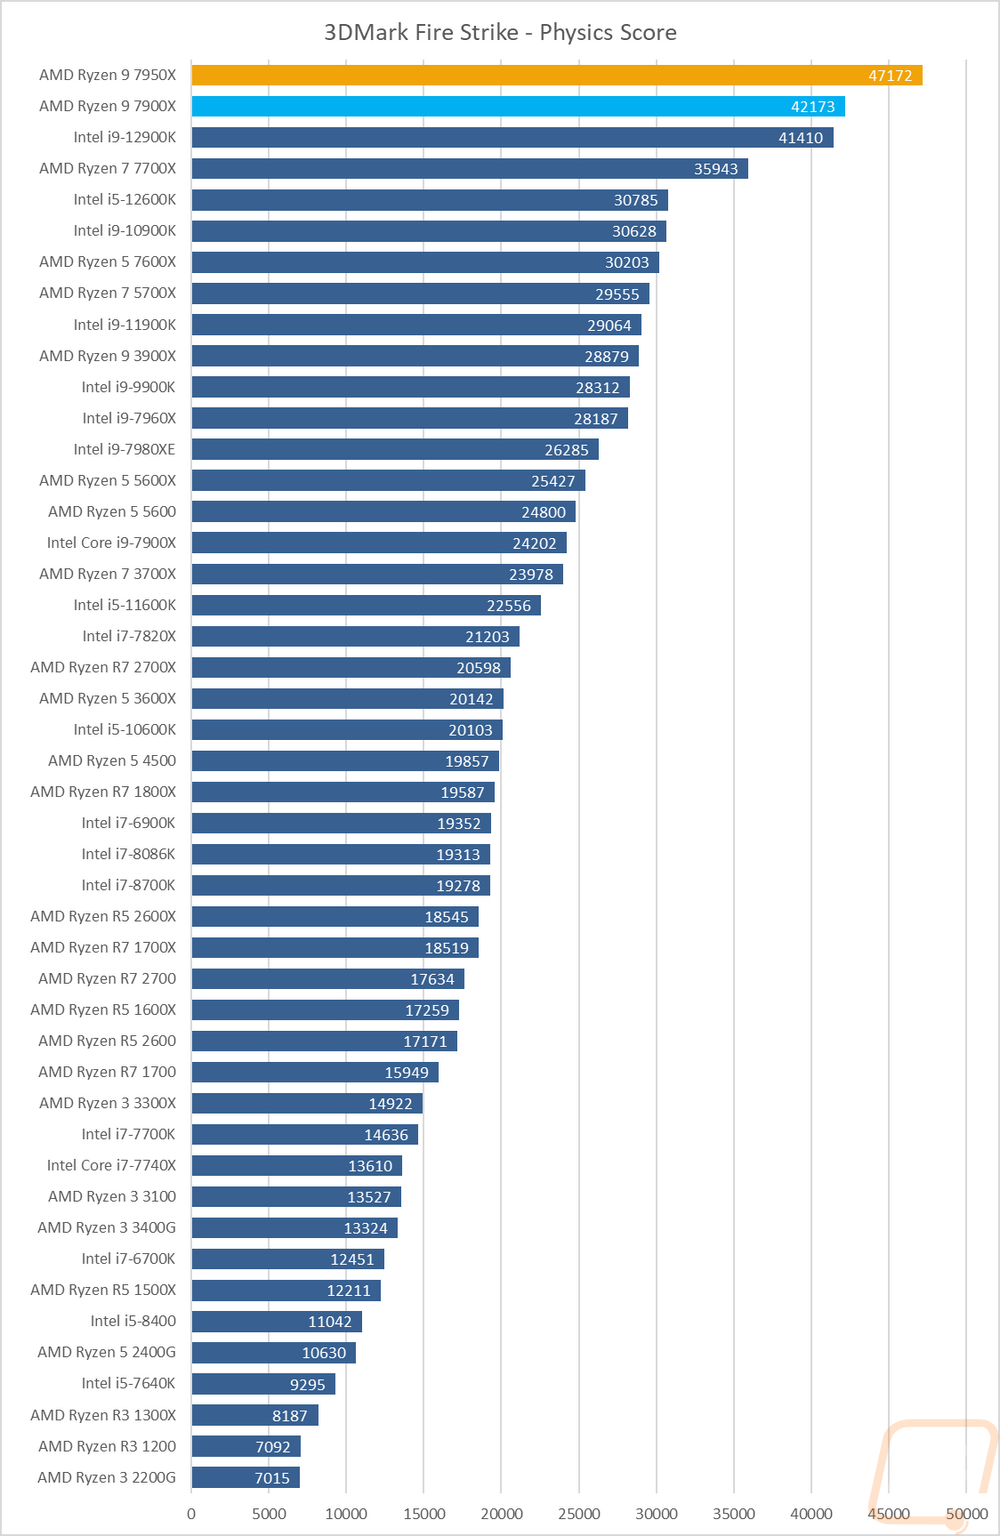
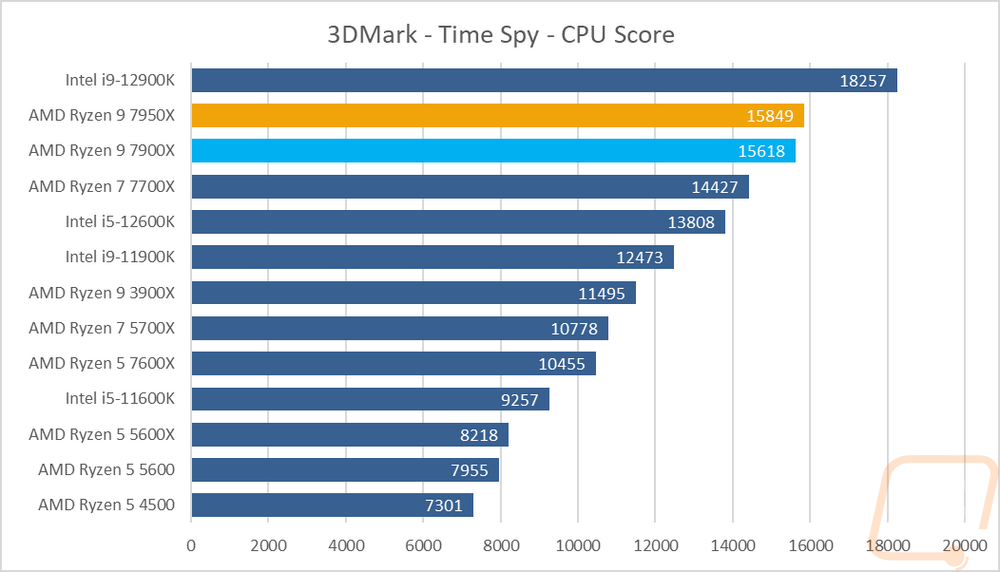
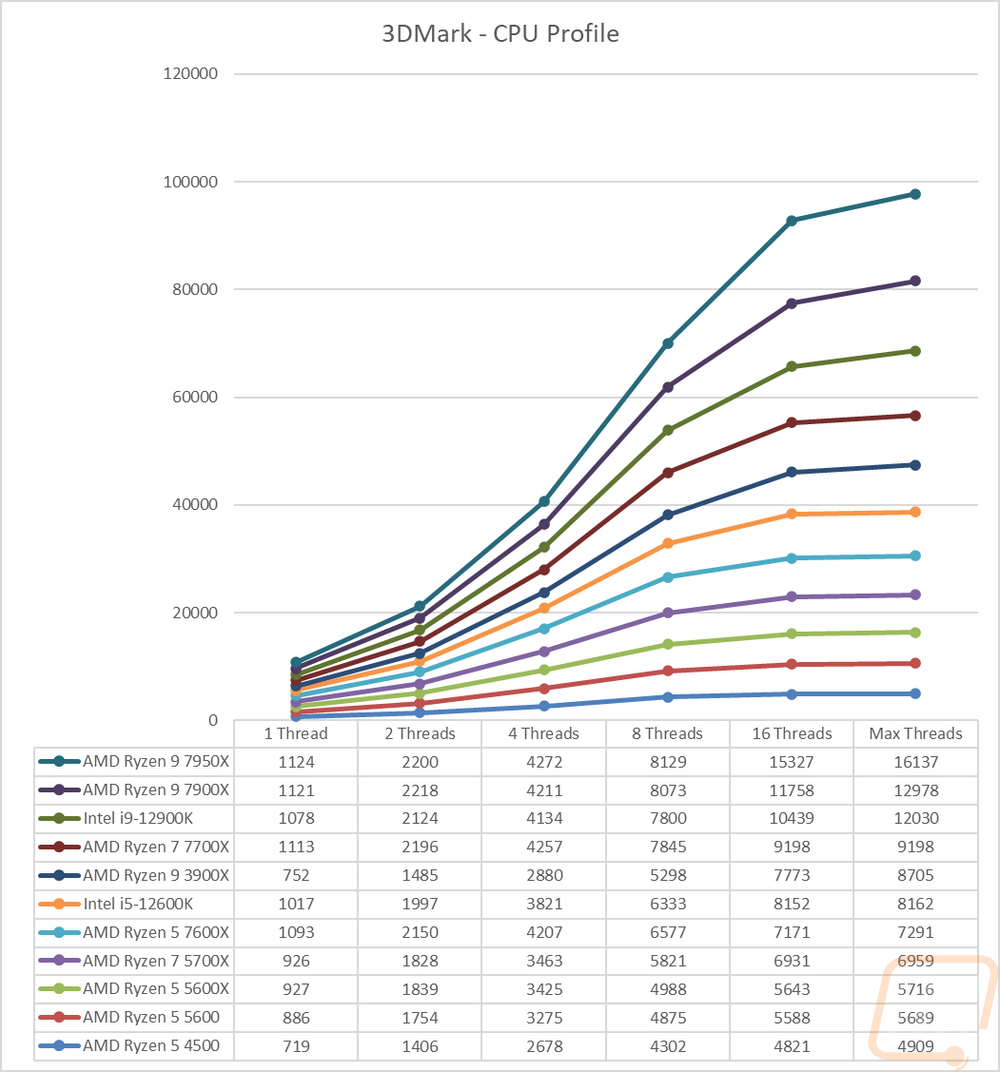
Before diving into game testing I wanted to check out synthetic performance using 3DMark. I tested with the older DX11 Fire Strike test as well as the newer DX12 Time Spy. I also added the new 3DMark CPU Profile benchmark into the mix as well which does a good job of showing the full range of thread counts that you might see being used in games as well as a max threads option that does everything above 16 threads. In the Fire Strike test, the Ryzen 9 7900X edged out ahead of the i9-12900K but with the four extra cores, the 7950X is way out ahead of everything else. In Time Spy on the other hand the 12900K is still way out in front and the 7950X and the 7900X are right with each other. Last up with the CPU Profile it is interesting that even with both CPUs having more than 16 threads that there still wasn’t too big of a difference between the 16 thread result and the max threads result. That said the 7950X is still at the top with a big gap between it and anything else and the next closest is the 7900X and it also has a big gap between it and the 12900K.
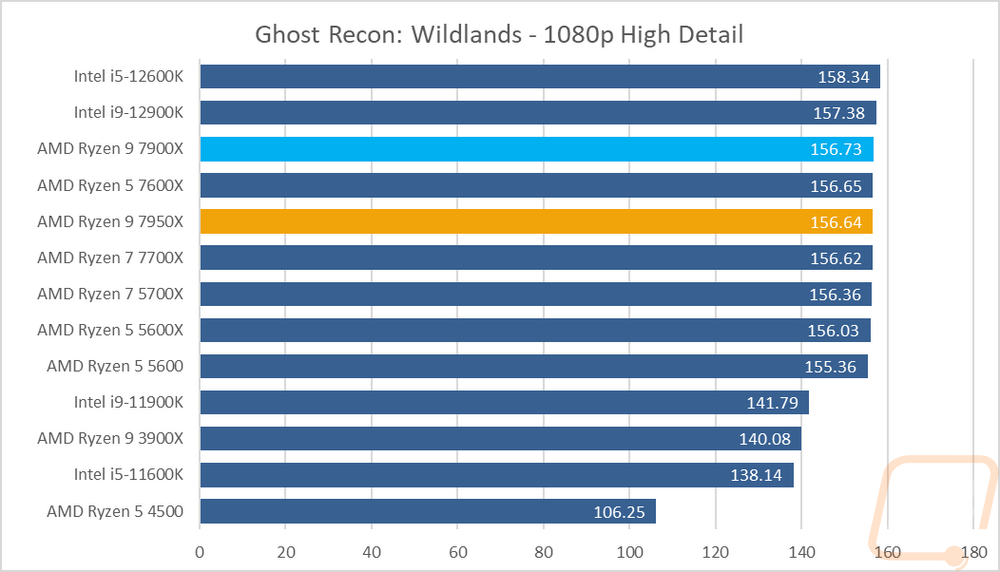
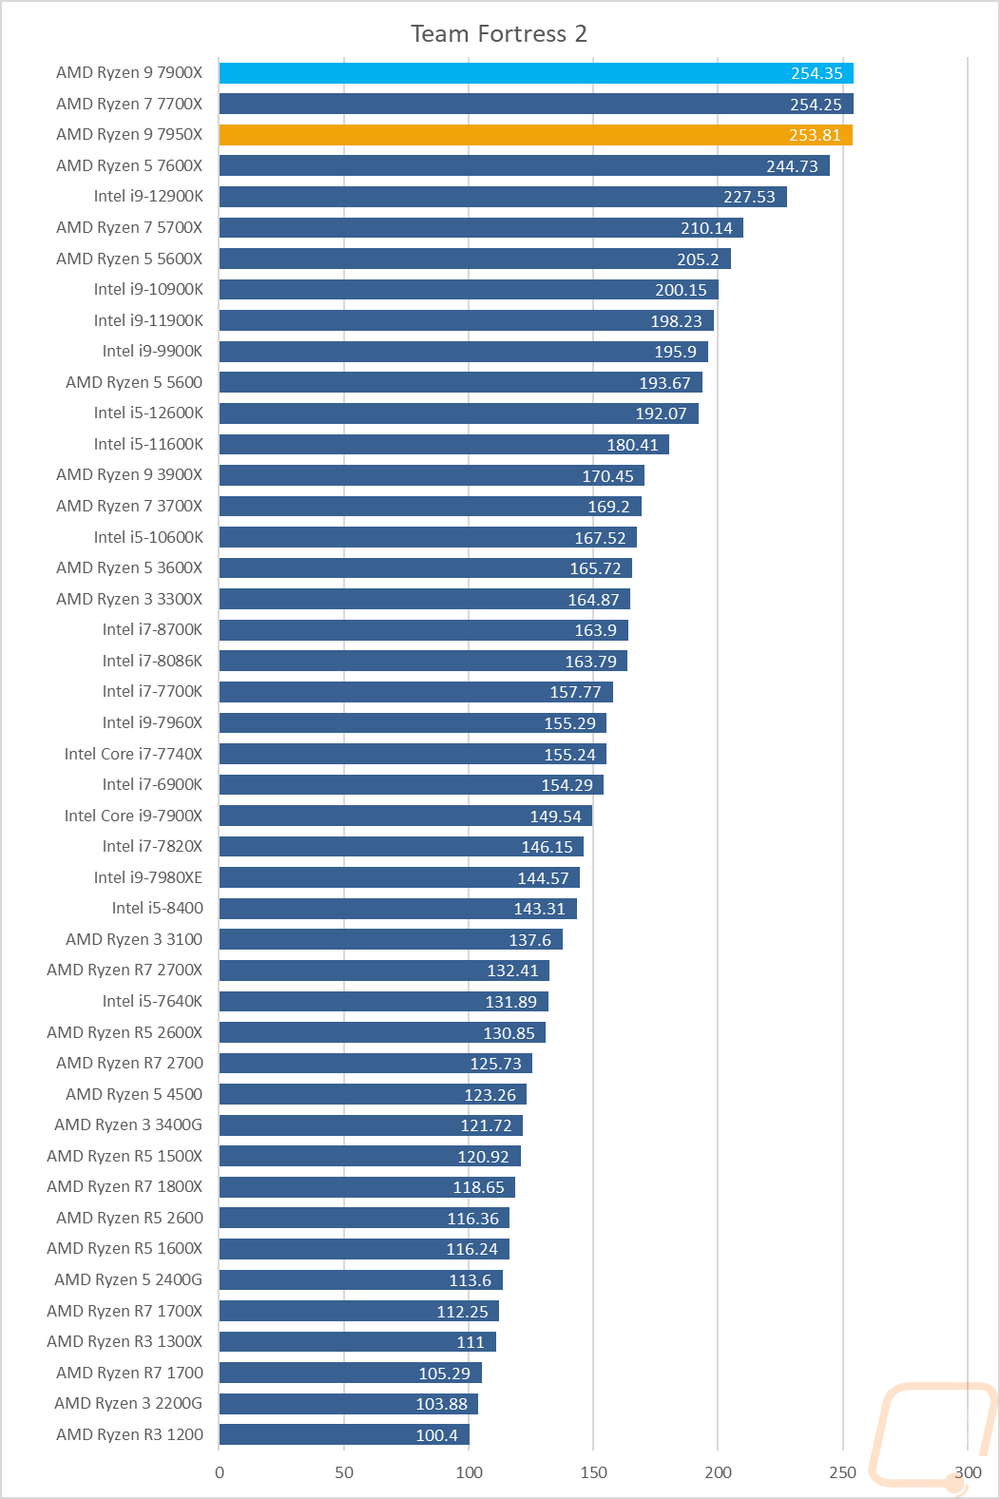
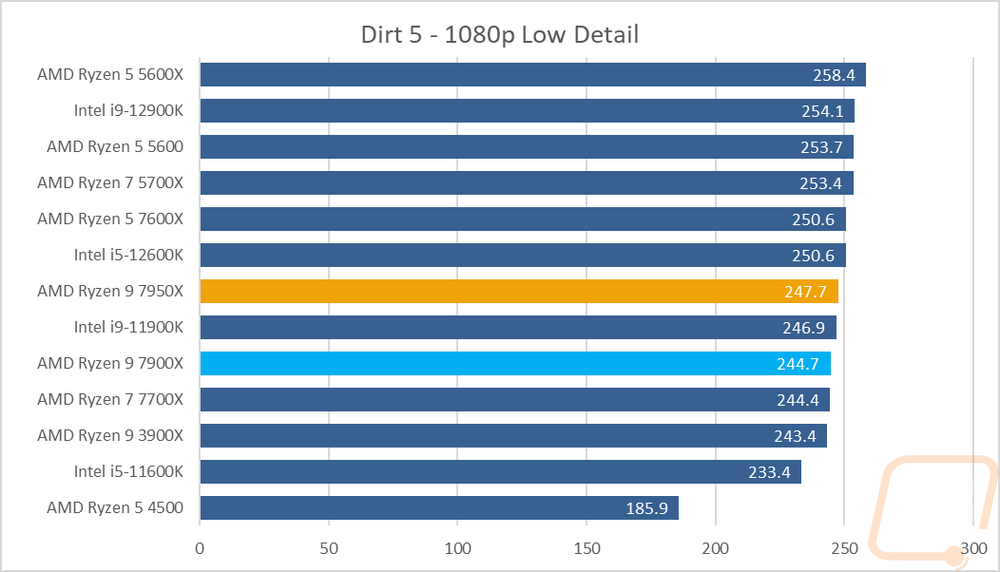
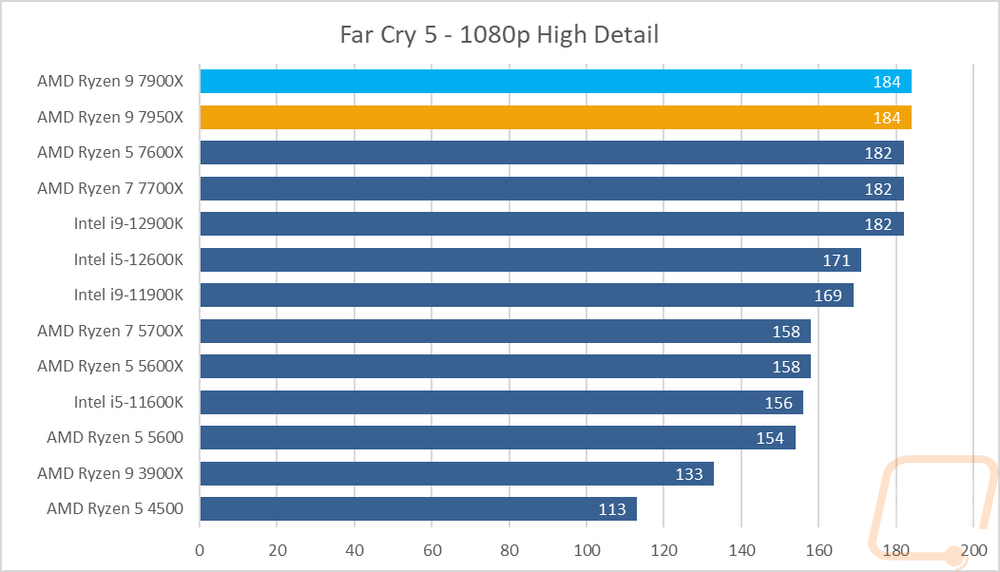
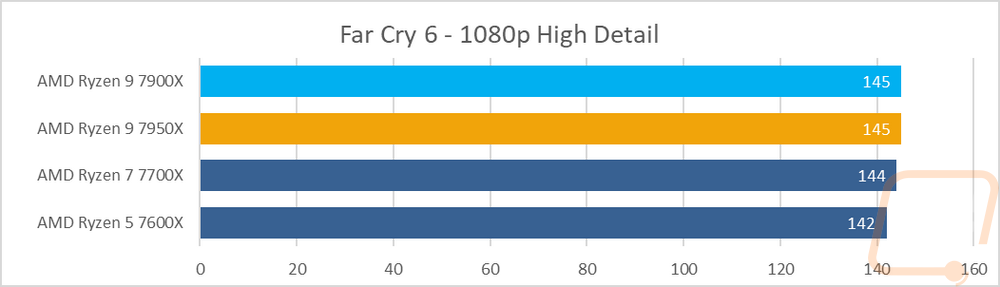
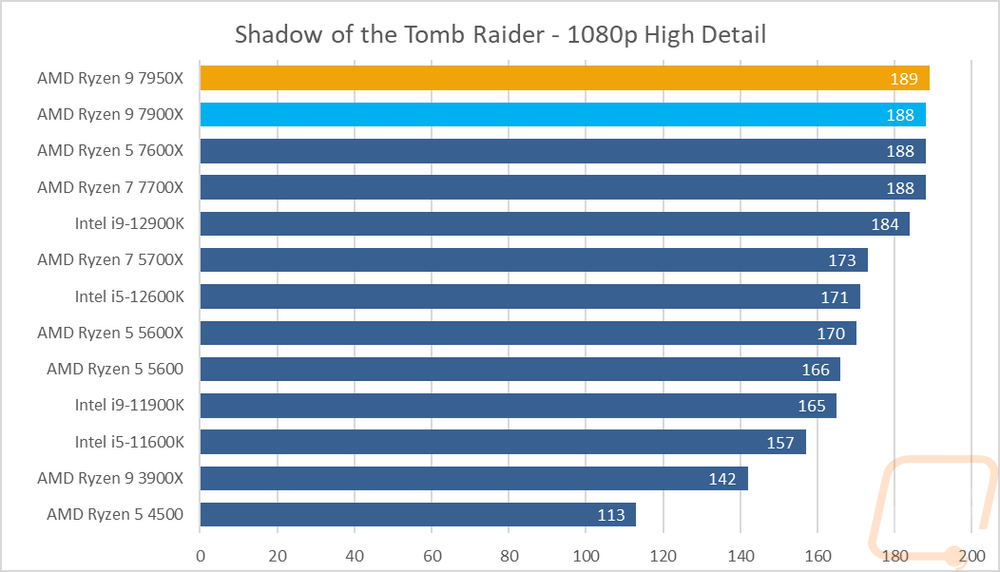
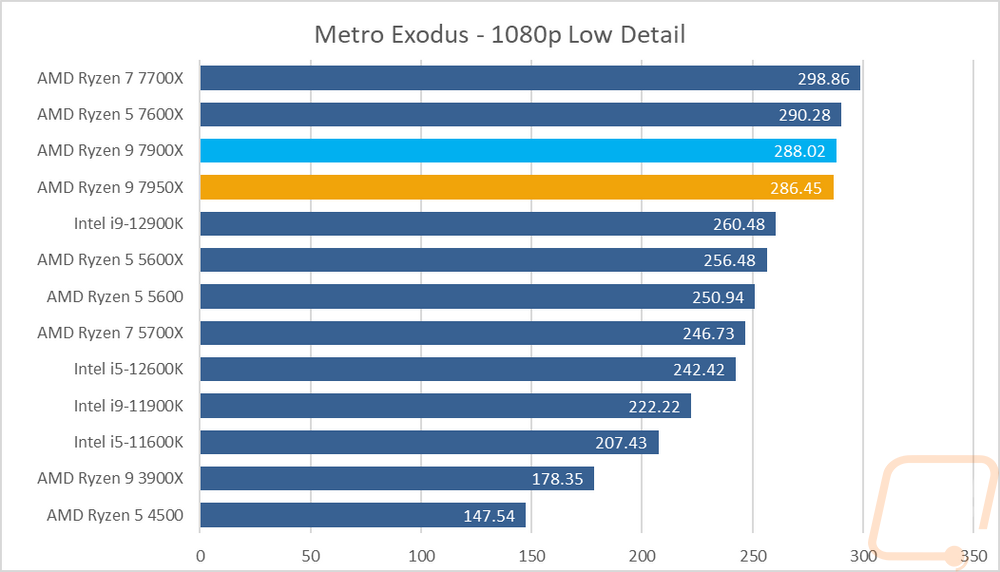
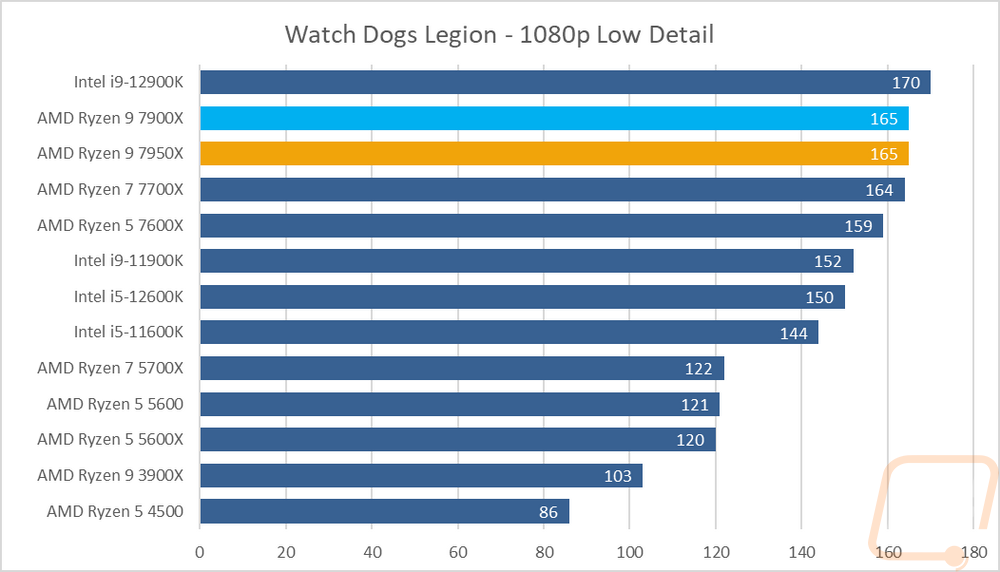
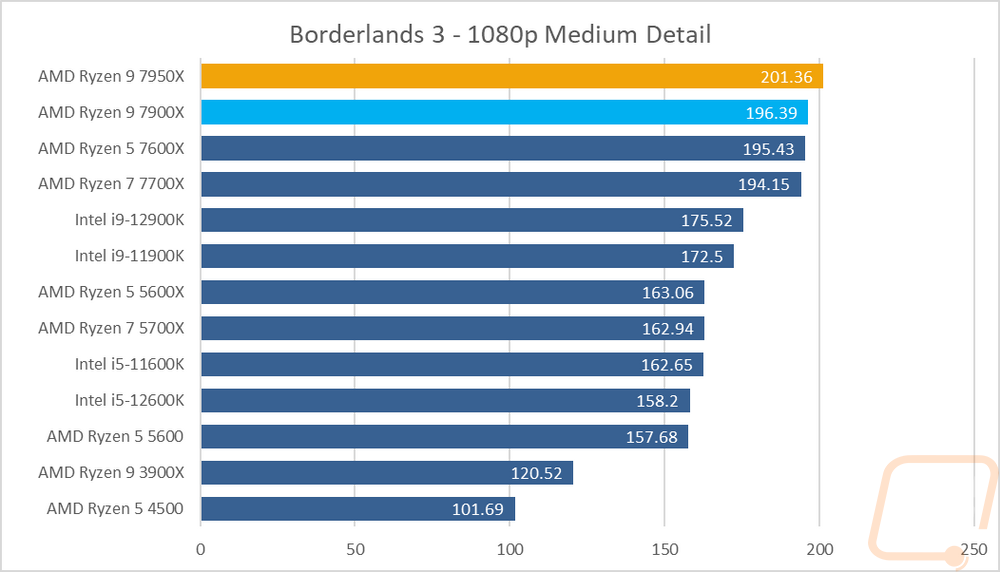
For in-game performance testing, I ran them through a variety of new and old games. TF2 for example is a very old game at this point but is also extremely CPU dependent which makes it a good option to check out for older source-based games. Game results for both the Ryzen 9 7950X and the Ryzen 9 7900X did well with them near the top of the charts in all but one game however we don’t have the 5800X3D to test alongside which is still the fastest gaming option out there. Dirt 5 still seems to be the exception with weird results there. There are also a lot of games, like with the 7700X and the 7600X which the higher base clock speed of the 7900X gives it better performance than the higher max boost clock of the 7950X.
I did also run both CPUs through a few tests using AIDA64, specifically, I wanted to check out cache performance, memory performance, and how the CPUs handle single and double precision and different integers. The 7950X and 7900X are in their own world compared to the 7700X and 7600X as far as L1 and L2 cache performance where having so much more makes a big difference. The cache latency improvements of Zen 4 are still noticeable here, especially in the L3 cache where the latency was lower than the 7700X and 7600X. Memory read speed was a little faster but for everything gained there it was lost on the write speed evening things out. The Single-Precision FLOPS and double-precision FLOPS of both Ryzen 9 CPUs was twice that of the lower-end 7000 series CPUs which themselves were higher than anything else tested. The same goes for all three of the integer IOPS tests as well.
|
AIDA64 |
L1 Cache Read |
L1 Cache Write |
L1 Cache Latency |
L2 Cache Read |
L2 Cache Write |
L2 Cache Latency |
L3 Cache Read |
L3 Cache Write |
L3 Cache Latency |
|
|
GB/s |
GB/s |
ns |
GB/s |
GB/s |
ns |
GB/s |
GB/s |
ns |
|
AMD Ryzen R7 2700X |
999.43 |
502.5 |
1 |
978.03 |
495.12 |
2.8 |
414.95 |
417.71 |
8.8 |
|
AMD Ryzen R5 2600X |
768.13 |
388.05 |
1 |
729.37 |
366.01 |
2.9 |
429.09 |
323.83 |
9.1 |
|
Ryzen 5 2400G |
485.01 |
238.29 |
1 |
459.8 |
232.2 |
3.1 |
222.96 |
181.6 |
9.6 |
|
Ryzen 3 2200G |
460.55 |
227.41 |
1.1 |
352.84 |
177.56 |
3.3 |
137.3 |
171.2 |
10.2 |
|
Intel i7-8700K |
1595.6 |
803.65 |
0.9 |
640.37 |
397.14 |
2.6 |
337 |
213.67 |
11 |
|
Intel i5-8400 |
1417.2 |
710.79 |
1 |
543.81 |
352.9 |
3.1 |
270.89 |
186.82 |
13 |
|
Intel Core i9-7980XE |
3758.3 |
1896.7 |
1.1 |
1671.7 |
1069.9 |
5.6 |
229.61 |
118.4 |
21 |
|
Intel Core i9-7960X |
3532.3 |
1785.2 |
1 |
1571.6 |
1003.5 |
5.1 |
220.22 |
121.04 |
19.8 |
|
Intel Core i7-7820X |
1969.9 |
995.02 |
1 |
884.63 |
574.74 |
5.6 |
114.4 |
103.57 |
19.2 |
|
Intel Core i5-7640X |
1044.8 |
31888 |
1 |
397.26 |
247 |
2.9 |
228.31 |
163.86 |
11.1 |
|
Intel Core i9-7900X |
2418.5 |
709.16 |
1 |
1037.3 |
521.94 |
5.2 |
124.16 |
106.78 |
21.2 |
|
Intel Core i7-7740X |
1102.7 |
561.25 |
0.9 |
424.55 |
304.3 |
2.7 |
287.01 |
186.67 |
21.2 |
|
Intel i7-6900K |
1963.9 |
999.59 |
1 |
710.28 |
310.34 |
4.1 |
243.96 |
195.41 |
14.6 |
|
Intel i7-7700K |
1114.6 |
560.82 |
0.9 |
415.45 |
285.97 |
2.7 |
234.5 |
188.7 |
10.4 |
|
Intel i7-5960X |
1748.5 |
874.6 |
1.2 |
623.08 |
272.77 |
3.5 |
260.72 |
184.92 |
15.3 |
|
AMD Ryzen R7 1800X |
917.46 |
460.16 |
1.1 |
831.95 |
446.37 |
4.7 |
388.18 |
386.01 |
12.4 |
|
AMD Ryzen R7 1700X |
867.89 |
435.33 |
1.2 |
809.29 |
419.38 |
5 |
369.75 |
350.31 |
12.9 |
|
AMD Ryzen R7 1700 |
793.9 |
398.12 |
1.3 |
742.92 |
389.73 |
5.4 |
334.36 |
332.12 |
14.2 |
|
AMD Ryzen R5 1600X |
689.47 |
345.95 |
1.1 |
630.99 |
334.93 |
4.7 |
386.48 |
326.86 |
12.3 |
|
AMD Ryzen R5 1500X |
446.84 |
224.01 |
1.1 |
306.82 |
211.58 |
11.8 |
306.82 |
211.58 |
11.8 |
|
AMD Ryzen R5 2600 |
685.38 |
344.05 |
1 |
669.28 |
333.5 |
3.1 |
381.16 |
320.56 |
9.8 |
|
AMD Ryzen R7 2700X |
849.91 |
426.09 |
1 |
837.76 |
418.75 |
3 |
357.51 |
356.71 |
9.4 |
|
Intel i7-8086K |
1596.4 |
803.56 |
0.9 |
623.36 |
423.53 |
2.6 |
380.04 |
243.73 |
10.9 |
|
Intel i9-9900K |
2375.6 |
1195.4 |
0.8 |
907.65 |
626.34 |
2.4 |
302.01 |
221.1 |
11 |
|
AMD Ryzen 9 3900X |
3098.6 |
1551.4 |
0.9 |
1545.3 |
1416.8 |
2.8 |
1014.4 |
836.39 |
11.5 |
|
AMD Ryzen 7 3700X |
2133.2 |
1072.9 |
0.9 |
1069.1 |
993.49 |
2.8 |
611.53 |
573.21 |
10.2 |
|
AMD Ryzen 5 3600X |
1547.4 |
779.24 |
1 |
777.62 |
745.3 |
2.8 |
584.93 |
538.45 |
10.4 |
|
AMD Ryzen 3 3400G |
508.97 |
253.87 |
1 |
490.26 |
247.04 |
3 |
233.57 |
193.62 |
9.3 |
|
AMD Ryzen 3 3300X |
1080.5 |
541.5 |
0.9 |
541.84 |
530.5 |
2.7 |
322.13 |
321.33 |
11.1 |
|
AMD Ryzen 3 3100 |
965.85 |
484.67 |
1 |
485.55 |
460.71 |
3.1 |
374.11 |
343.53 |
11.8 |
|
Intel i5-10600K |
1676.6 |
840.87 |
0.8 |
662.98 |
452.67 |
2.5 |
361.35 |
238.47 |
10.5 |
|
Intel i9-10900K |
3162.1 |
1586.7 |
0.8 |
1201.8 |
759.97 |
2.4 |
407.66 |
245.94 |
11.4 |
|
AMD Ryzen 5 5600X |
1721.4 |
869.69 |
0.9 |
851.89 |
831.97 |
2.6 |
276.24 |
298.84 |
11 |
|
Intel i9-11900K |
4542.8 |
2299.3 |
1 |
1413.2 |
691.62 |
2.5 |
330.32 |
213.28 |
11.4 |
|
Intel i5-11600K |
3412.3 |
1724.9 |
1 |
960.91 |
526.76 |
2.7 |
319.1 |
198.57 |
11.4 |
|
Intel i9-12900K |
2310 |
1438.7 |
1 |
1233.5 |
562.72 |
2.9 |
678.84 |
418.11 |
19.8 |
|
Intel i5-12600K |
1461.1 |
971.78 |
1.1 |
846.4 |
360.51 |
3.2 |
598.86 |
292.09 |
21.4 |
|
AMD Ryzen 5 4500 |
1561.9 |
784.1 |
1 |
785.34 |
751.61 |
2.9 |
350.05 |
571.19 |
10.5 |
|
AMD Ryzen 5 5600 |
1646.6 |
831.24 |
0.9 |
832.43 |
767.22 |
2.7 |
445.8 |
437.73 |
11.9 |
|
AMD Ryzen 7 5700X |
2267.8 |
1157.8 |
0.9 |
1147.6 |
1026.1 |
2.6 |
501.53 |
526.11 |
11.5 |
|
AMD Ryzen 7 7700X |
2722.9 |
1381 |
0.7 |
1361.1 |
1305.1 |
2.7 |
887.95 |
901.2 |
10.1 |
|
AMD Ryzen 5 7600X |
1996.3 |
1019.3 |
0.7 |
1020.9 |
999.93 |
2.6 |
847.43 |
847.61 |
10.5 |
|
AMD Ryzen 9 7950X |
5252.2 |
2685 |
0.7 |
2615.6 |
2588.4 |
2.6 |
1293.7 |
1357.3 |
9.9 |
|
AMD Ryzen 9 7900X |
4042.4 |
2051.4 |
0.7 |
2008.5 |
1956.3 |
2.5 |
1278.6 |
1394.1 |
9.8 |
|
AIDA64 |
Memory Read |
Memory Write |
Memory Latency |
Single-Precision FLOPS |
Double Precision FLOPS |
AES-256 |
24-bit Integer IOPS |
32-bit Integer IOPS |
64-bit Integer IOPS |
|
|
MB/s |
MB/s |
ns |
GFLOPS |
GFLOPS |
MB/s |
GIOPS |
GIOPS |
GIOPS |
|
AMD Ryzen R7 2700X |
50214 |
48578 |
65 |
507.9 |
253.9 |
70514 |
127.7 |
127.7 |
64.22 |
|
AMD Ryzen R5 2600X |
50273 |
48346 |
65.5 |
383.2 |
191.4 |
51932 |
95.82 |
95.82 |
48.15 |
|
Ryzen 5 2400G |
45967 |
47850 |
66.6 |
235.9 |
117.8 |
32388 |
58.94 |
58.98 |
29.67 |
|
Ryzen 3 2200G |
35567 |
36240 |
118.4 |
225.8 |
112.6 |
27603 |
56.32 |
56.32 |
28.3 |
|
Intel i7-8700K |
38421 |
40175 |
57.9 |
825 |
412.5 |
29406 |
370 |
370 |
51.55 |
|
Intel i5-8400 |
38096 |
40549 |
59.8 |
728.8 |
364.5 |
25192 |
323.5 |
323.5 |
45.55 |
|
Intel Core i9-7980XE |
77004 |
68888 |
73.4 |
1831 |
915.5 |
69377 |
821.2 |
821.3 |
121.6 |
|
Intel Core i9-7960X |
79416 |
71554 |
74.9 |
1681 |
840.6 |
65409 |
754 |
753.9 |
114.7 |
|
Intel Core i7-7820X |
76049 |
73759 |
71.6 |
944.9 |
472.5 |
36420 |
423.7 |
423.7 |
63.85 |
|
Intel Core i5-7640X |
30786 |
31888 |
68.5 |
536.5 |
268.2 |
18547 |
238.1 |
138.1 |
33.53 |
|
Intel Core i9-7900X |
76856 |
72856 |
72.8 |
1148 |
574.5 |
45506 |
515.1 |
515 |
79.76 |
|
Intel Core i7-7740X |
38455 |
40596 |
53.2 |
575.4 |
287.8 |
20503 |
258.1 |
258 |
35.97 |
|
Intel i7-6900K |
66786 |
68130 |
61.9 |
1023 |
511.7 |
36340 |
255.9 |
255.9 |
63.96 |
|
Intel i7-7700K |
38498 |
40448 |
52.7 |
575.7 |
287.9 |
20519 |
258 |
258 |
35.98 |
|
Intel i7-5960X |
66108 |
49545 |
62.8 |
895.5 |
447.7 |
31783 |
223.9 |
223.9 |
55.97 |
|
AMD Ryzen R7 1800X |
44031 |
43425 |
81.8 |
472.4 |
236.2 |
64016 |
118.1 |
118.1 |
59.03 |
|
AMD Ryzen R7 1700X |
44493 |
43749 |
78.3 |
446.8 |
223.4 |
61730 |
111.7 |
111.7 |
55.84 |
|
AMD Ryzen R7 1700 |
45343 |
43777 |
82.6 |
408.5 |
204.3 |
56811 |
102.1 |
102.1 |
51.05 |
|
AMD Ryzen R5 1600X |
44452 |
43918 |
83.7 |
354.9 |
177.5 |
49340 |
88.74 |
88.73 |
44.34 |
|
AMD Ryzen R5 1500X |
44289 |
43746 |
83.1 |
229.8 |
114.8 |
31983 |
57.43 |
57.45 |
28.72 |
|
AMD Ryzen R5 2600 |
50385 |
48499 |
66.5 |
351 |
175.4 |
48939 |
88.03 |
88.02 |
44.01 |
|
AMD Ryzen R7 2700 |
50088 |
48343 |
65.9 |
434.3 |
217.2 |
60336 |
108.6 |
108.6 |
54.68 |
|
Intel i7-8086K |
39069 |
40675 |
56.2 |
824.9 |
412.5 |
29397 |
369.9 |
369.9 |
51.55 |
|
Intel i9-9900K |
39682 |
41015 |
51.1 |
1226 |
613 |
45542 |
550 |
549.8 |
79.79 |
|
AMD Ryzen 9 3900X |
53981 |
52271 |
70.7 |
1546 |
772.1 |
106943 |
385.7 |
385.7 |
96.57 |
|
AMD Ryzen 7 3700X |
51498 |
28739 |
67.3 |
1078 |
537.8 |
74474 |
271 |
271.2 |
67.77 |
|
AMD Ryzen 5 3600X |
50769 |
28736 |
68.9 |
799.5 |
400 |
55456 |
198.6 |
198.6 |
49.64 |
|
AMD Ryzen 3 3400G |
49936 |
53502 |
67.1 |
257.2 |
128.5 |
35736 |
64.16 |
64.16 |
32.25 |
|
AMD Ryzen 3 3300X |
51435 |
28743 |
66.4 |
551.6 |
276.1 |
38176 |
138.7 |
138.7 |
34.65 |
|
AMD Ryzen 3 3100 |
50246 |
28734 |
71.1 |
497.6 |
248.7 |
34946 |
124.4 |
124.4 |
31.09 |
|
Intel i5-10600K |
43340 |
43430 |
48.2 |
863.8 |
431.9 |
30782 |
387.2 |
386.9 |
53.99 |
|
Intel i9-10900K |
44972 |
43808 |
50.5 |
1632 |
815.7 |
58163 |
731.3 |
731.2 |
102 |
|
AMD Ryzen 5 5600X |
50972 |
28772 |
59.2 |
891.9 |
445.8 |
61623 |
709.6 |
709.7 |
55.72 |
|
Intel i9-11900K |
44919 |
43343 |
51.8 |
1068 |
534.2 |
164966 |
547 |
547 |
182.7 |
|
Intel i5-11600K |
43953 |
43468 |
55.6 |
838.7 |
419.4 |
123767 |
429.3 |
429.3 |
143.4 |
|
Intel i9-12900K |
71418 |
72395 |
82 |
695.7 |
247.9 |
140499 |
400.6 |
400.6 |
166.2 |
|
Intel i5-12600K |
65416 |
71336 |
87.8 |
432.5 |
216.2 |
86470 |
252.7 |
252.7 |
96.22 |
|
AMD Ryzen 5 4500 |
52683 |
53191 |
82.8 |
806 |
402.6 |
56578 |
201.5 |
201.3 |
50.35 |
|
AMD Ryzen 5 5600 |
48444 |
28753 |
70.9 |
853.2 |
426.2 |
107839 |
675.8 |
679.6 |
53.38 |
|
AMD Ryzen 7 5700X |
47858 |
28760 |
68.2 |
1158 |
577.9 |
137459 |
919.1 |
912.9 |
74.38 |
|
AMD Ryzen 7 7700X |
58755 |
80120 |
70 |
1392 |
694.6 |
192730 |
1205 |
1205 |
602.4 |
|
AMD Ryzen 5 7600X |
54720 |
80771 |
69.5 |
1046 |
523.1 |
147661 |
912.5 |
912.5 |
456.4 |
|
AMD Ryzen 9 7950X |
67342 |
76712 |
69 |
2735 |
1364 |
379510 |
2370 |
2370 |
1184 |
|
AMD Ryzen 9 7900X |
68064 |
78123 |
67.7 |
2062 |
1029 |
288134 |
1792 |
1789 |
895.4 |
