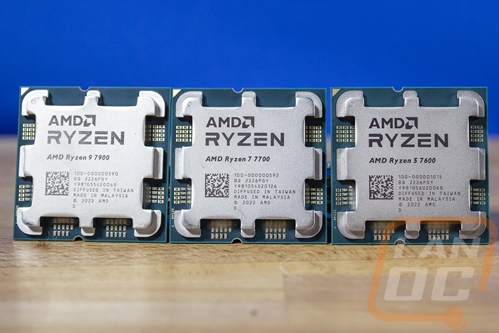
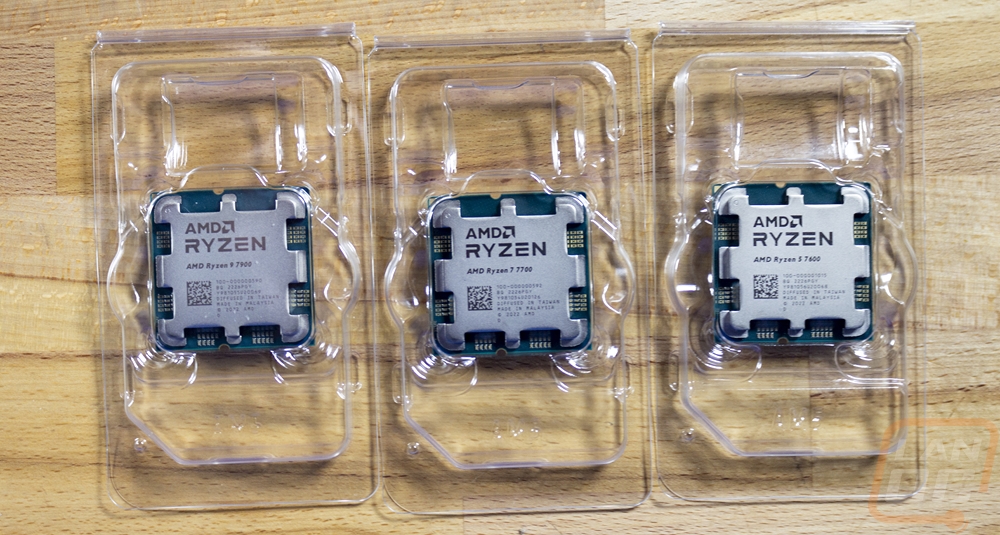
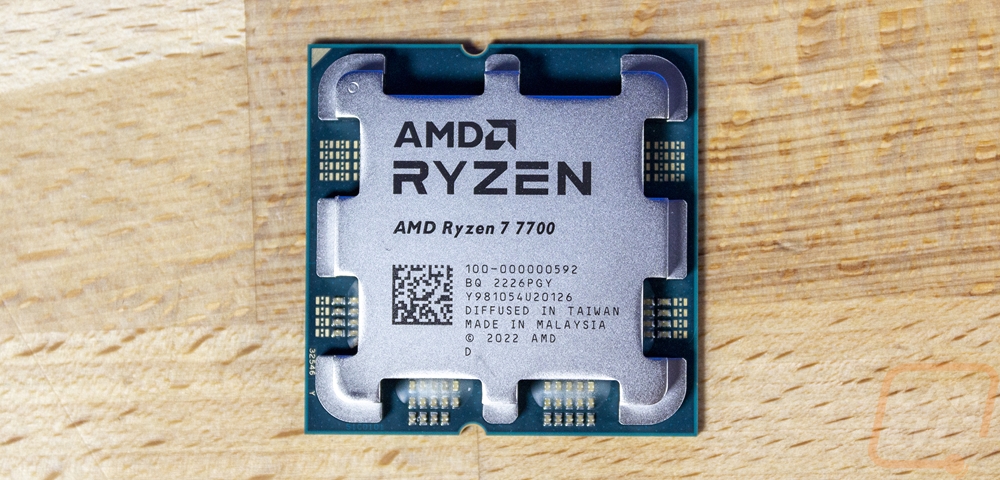
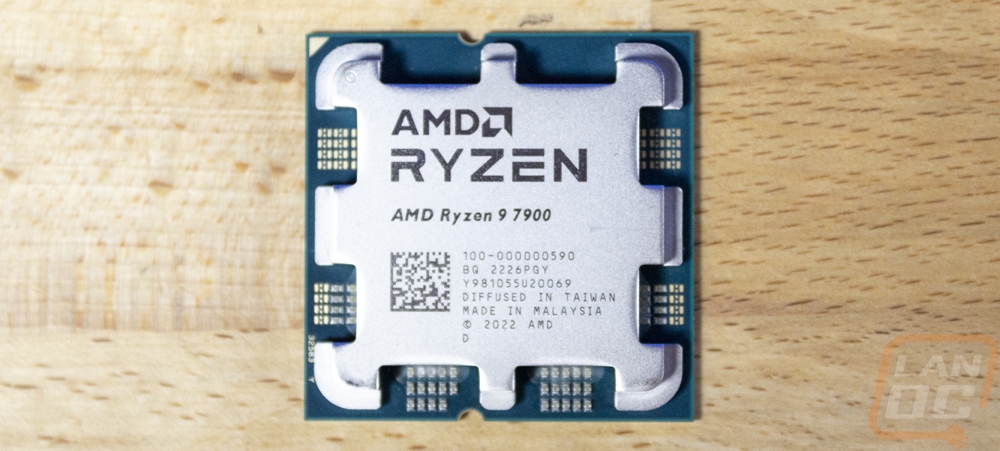
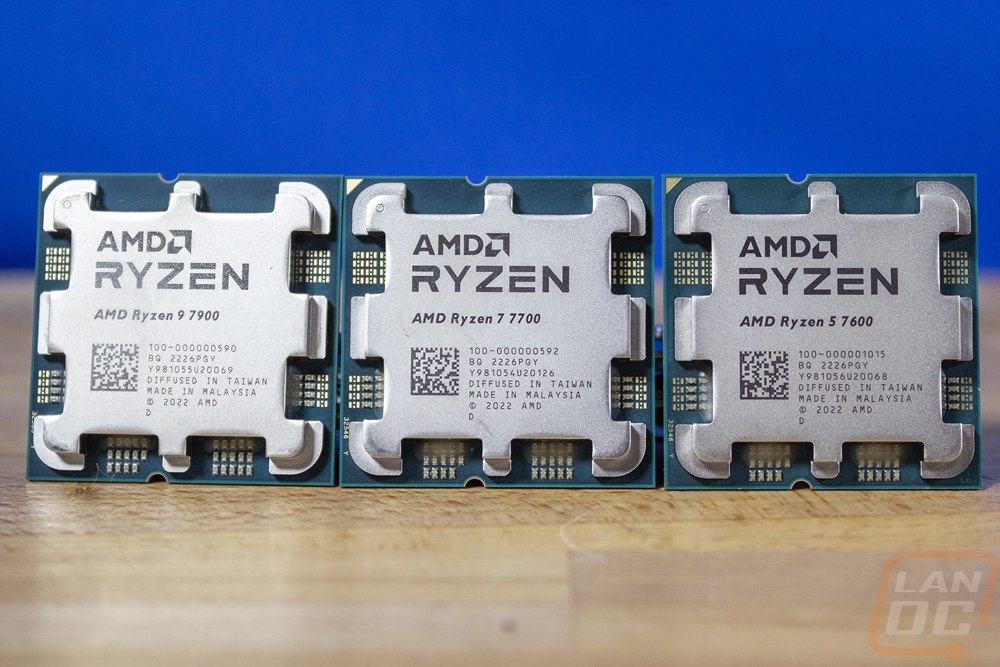
At CES this year AMD announced a few things in their CPU lineup including their upcoming 7000 series 3D CPUs and they also introduced three new non-X CPUs for their previously launched 7000 series of CPUs. The CPUs are the Ryzen 9 7900, the Ryzen 7 7700, and the Ryzen 5 7600. All three share a lot including core and thread counts to their similarly named X brothers but all three have lowered TDP wattages down to 65 watts which is to offer options for people not looking for something as extreme as the initially launched CPUs and for small form factor builds which are a lot more limited in cooling. If you have been around here in the past I love small form factor builds, especially builds focused on LAN use and this was an exciting announcement on that front. I’m a little late to the party on testing them but just received all three CPUs and today we are going to check them out and see how they compare so let’s dive in!
Product Name: Ryzen 7000 Series Non-X CPUs
Review Sample Provided by: AMD
Written by: Wes Compton
Amazon Affiliate Links:
What is the Ryzen 7000 Series Non-X and what does it do for me
With the introduction of the 7000 series of CPUs, AMD brought out a mix of CPUs, not just their highest-end CPU the 7950X. They had 12, 8, and 6 core options and the addition of some of the non-X CPUs just builds on that. They had the 7900X, 7700X, and the 7600X and for each of those they now have a matching model with the same core and thread counts but now with a lower 65-watt TDP. That at the core is what the non-X CPUs are, lower power draw models. To accomplish that they did all get changes to their clock speeds. So for the Ryzen 9 7900, they have gone from a max boost clock of 5.6 GHz down to 5.4 GHz and its base clock is a lot lower at 3.7 GHz rather than 4.7 GHz. The Ryzen 7 7700 is similar with its max boost clock being 5.3 GHz from 5.4 GHz on the 7700X and its base clock is a little better at 3.8 GHz to 4.5 GHz. Then the Ryzen 5 7600 has a max boost clock of 5.1 GHz from 5.3 GHz and a base clock of 3.8 GHz as well from 4.7 GHz on the 7600X.
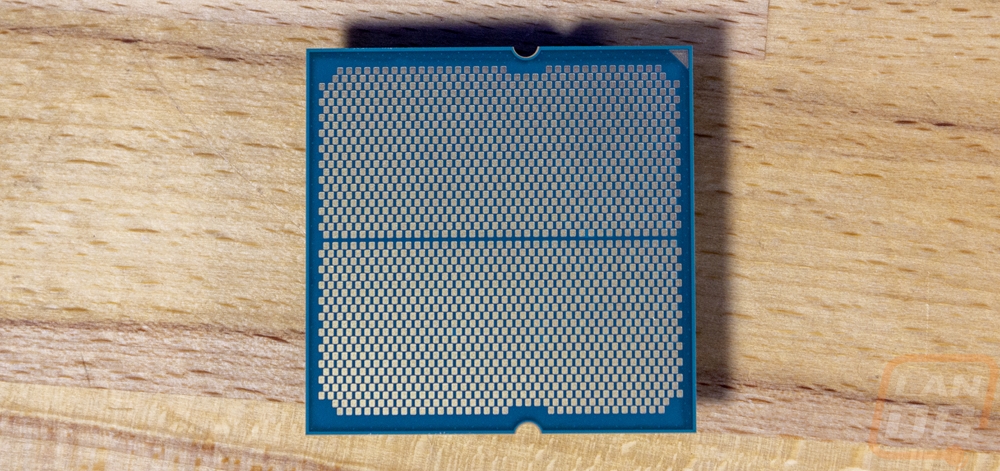
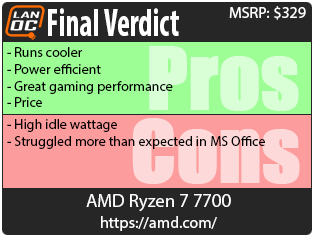
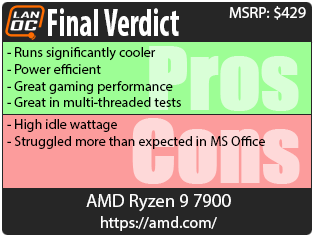
None of the CPUs have any changes to their L2 or L3 caches or the TjMax which is still 95C. But with the new lower 65 Watt TDP on all three CPUs, you are a lot less likely to be hitting those temperatures. All three non-X CPUs have the same max socket power of 88 watts and a max current of 150A. Lower power usage means lower heat and with that, all three CPUs now come with an air cooler. The 7900 and 7700 get the Wraith Prism and the 7600 gets the cheaper non-RGB Wraith Stealth. Nothing else beyond that has changed, they are all still overclockable and have precision boost 2. The max non-overclocked memory speed is still DDR5-5200 as well. The only other big change is in the pricing. The Ryzen 9 7900 has an MSRP of $429 vs the $549 of the 7900X which is a big change. The Ryzen 7 7700 is $329 down from $399 on the 7700X and then the Ryzen 5 7600 is $229 from $299 for the 7600X.
|
Specifications |
Ryzen 9 7900X |
Ryzen 9 7900 |
Ryzen 7 7700X |
Ryzen 7 7700 |
Ryzen 5 7600X |
Ryzen 5 7600 |
||||||
|
Core/Threads |
12/24 |
8/16 |
6/12 |
|||||||||
|
Max Boost |
5.6 GHz |
5.4 GHz |
5.4 GHz |
5.3 GHz |
5.3 GHz |
5.1 GHz |
||||||
|
Base Clock |
4.7 GHz |
3.7 GHz |
4.5 GHz |
3.8 GHz |
4.7 GHz |
3.8 GHz |
||||||
|
L2 Cache |
12x1MB |
8x1MB |
6x1MB |
|||||||||
|
L3 Cache |
64MB |
32MB |
32MB |
|||||||||
|
TDP |
170W |
65W |
105W |
65W |
105W |
65W |
||||||
|
Max Socket Power (PPT) |
230W |
88W |
142W |
88W |
105W |
88W |
||||||
|
Max Current (EDC) |
225A |
150A |
170A |
150A |
170A |
150A |
||||||
|
Max Curren, Thermally Limited (TDC) |
160A |
75A |
110A |
75A |
110A |
75A |
||||||
|
TjMax |
95C |
|||||||||||
|
Stock/Auto Voltage Range (Active Core) |
0.650 – 1.475V |
|||||||||||
|
Boost Algorithm |
Precision Boost 2 |
|||||||||||
|
Recommended Cooler |
240-280 Liquid (or equivalent) |
AMD Wraith Prism |
240-280 Liquid (or equivalent) |
AMD Wraith Prism |
Mid-Frame Tower Cooler (or equivalent) |
AMD Wraith Stealth |
||||||
|
Max Memory Speed (Non-OC) |
DDR5-5200 (2x16GB) |
|||||||||||
|
ECC Support |
Enabled in-silicon, support varies by motherboard |
|||||||||||
|
CCD Die Size |
70mm ² |
|||||||||||
|
CCD Transistor Count |
6.5 billion |
|||||||||||
|
IOD Die Size |
122mm ² |
|||||||||||
|
IOD Transistor Count |
3.4 billion |
|||||||||||
|
MSRP |
$549 |
$429 |
$399 |
$329 |
$299 |
$229 |
|
|||||
Test Rig and Procedures
Test System
Motherboard: ASUS ROG Crosshair X670E Hero - Live Pricing
Cooling: Corsair iCUE H100i ELITE LCD Liquid CPU Cooler - Live Pricing
Noctua NT-H1 Thermal Paste - Live Pricing
Memory: G.Skill Trident Z5 Neo DDR5 16GBx2 6000MHz - Live Pricing
Storage: Corsair 2TB MP600 PCIe Gen 4 SSD - Live Pricing
Video Card: Nvidia RTX 3070 FE - Live Pricing
Power Supply: Corsair AX1200 - Live Pricing
Case: Primochill Wetbench - Live Pricing
OS: Windows 11 Pro 64-bit - Live Pricing
|
CPU Testing Procedures |
|
|
Team Fortress 2 |
|
|
Tom Clancy's Ghost Recon: Wildlands |
Built-in Benchmark, 1080p, High detail setting |
|
Dirt 5 |
built-in benchmark, running at 1080p on all three resolution settings, V-Sync is turned off, dynamic resolution is turned off, and on the low detail setting |
|
Far Cry 5 |
1080p with High Detail setting using built-in benchmark |
|
Shadow of the Tomb Raider |
built-in benchmark, gtx 1080Ti, 1080p, high detail setting, RTX/DLSS Off |
|
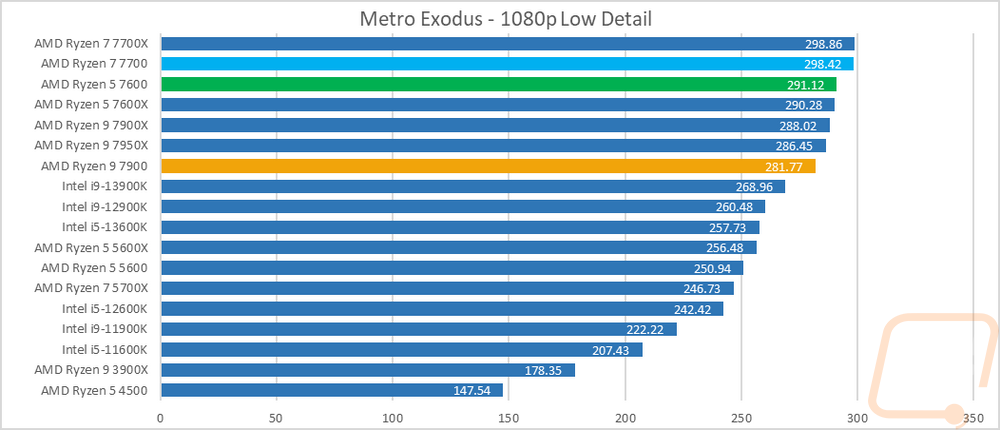
Metro Exodus |
Default benchmark low setting |
|
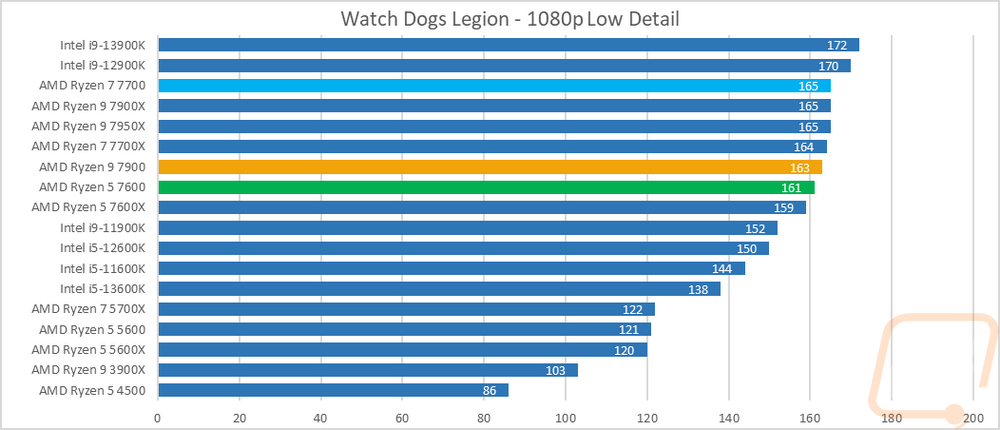
Watch Dogs Legion |
1080p, dx12, medium detail |
|
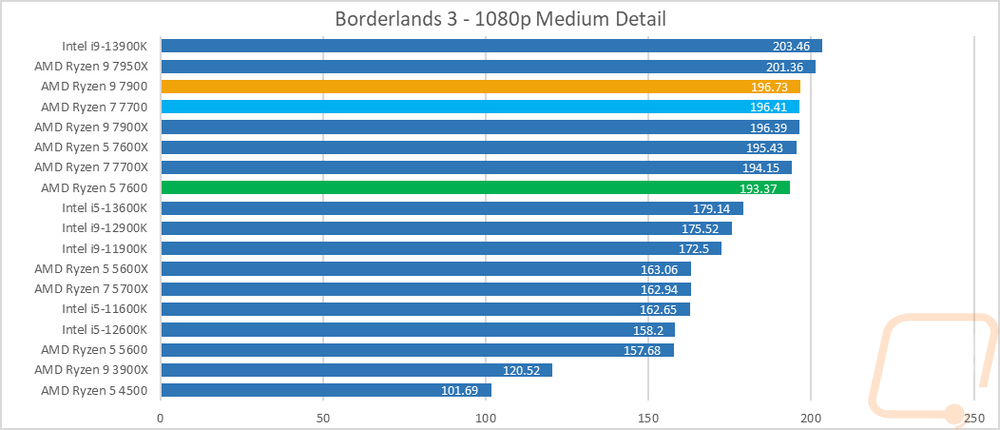
Borderlands 3 |
built-in benchmark. fullscreen, 1080p, medium quality, dx11 |
|
Far Cry 6 |
1080p with High Detail setting using built-in benchmark |
|
Dolphin 5.0 Benchmark |
|
|
3DMark |
Fire Strike - Physics Score – Performance benchmark, Time Spy - CPU Score, and CPU Profile test |
|
7-Zip |
Built-in benchmark set to 32MB, run 4 or more passes. Combined MIPS, Compressing, and Decompressing scores all used. Just the Current result, not the resulting |
|
Jetstream |
|
|
wPrime |
1024M |
|
Cinebench R15 |
CPU and CPU (Single Core results) |
|
Cinebench R20 |
CPU and CPU (Single Core results) |
|
Cinebench R23 |
CPU and CPU (Single Core results) |
|
CPUz |
CPUz's built-in benchmark, both single and multi-core scores |
|
Passmark 10 |
CPU Mark Score |
|
PCMark 10 |
Normal test ran, not the express or extended |
|
Procyon |
Office productivity benchmark is done with the current Microsoft Office 365, Photo Editing Benchmark is done with Adobe Photoshop and Lightroom Classic. Video Editing Benchmark uses Adobe Premiere Pro. All adobe products are running on the latest version at the time of testing |
|
V-Ray Benchmark 1.0.8 |
CPU Benchmark time used as the score |
|
V-Ray Benchmark 5.0.2 |
vsamples score |
|
POV-Ray |
Using built-in benchmark. Settings are all set to the "Standard Benchmark Switches" listed on http://www.povray.org/download/benchmark.php |
|
Handbrake |
Tested using 2d 4k 60 FPS version, resized using the Fast 1080p30 preset, average FPS used. Here is the file download location http://bbb3d.renderfarming.net/download.html |
|
Blender |
Using new official benchmark using 3.1.0 |
|
AIDA64 |
Memory, Cache, and FLOPS testing done with built-in GPGPU and Memory benchmarks |
|
Temps |
Aida64 FPU stability test to load and to record temperature readings |
|
Power Usage |
Idle and load testing using a Kill-A-Watt and wPrime to put the CPU under load and again with the AIDA64 FPU CPU workload |
|
Onboard Testing Procedures |
|
|
Borderlands 3 |
In-Game benchmark, 1080p, Low detail preset |
|
Tomb Raider |
Adrenaline Action Benchmark Tool on the “Medium” quality setting at 1080p |
|
Hitman: Absolution |
Adrenaline Action Benchmark Tool on the “Medium” quality setting at 1080p |
|
Far Cry 5 |
1080p, Lowest Detail setting, In game benchmark |
|
Shadow of the Tomb Raider |
1080p, Low Detail setting, In game benchmark, RTX/DLSS off |
|
Team Fortress 2 |
1080p – high, very high, high, reflect world, high, enabled, 8x msaa, x16, multicore on. https://bit.ly/2vOebin |
|
Unigine Superposition |
720p Low and 1080p Medium settings |
|
Cinebench R15 |
OpenGL benchmark |
|
3DMark Fire Strike |
Performance setting – GPU Score |
|
3DMark Time Spy |
GPU Score |
|
Tom Clancy's Ghost Recon: Wildlands |
Built-in Benchmark, 1080p, Low detail setting |
CPU Performance
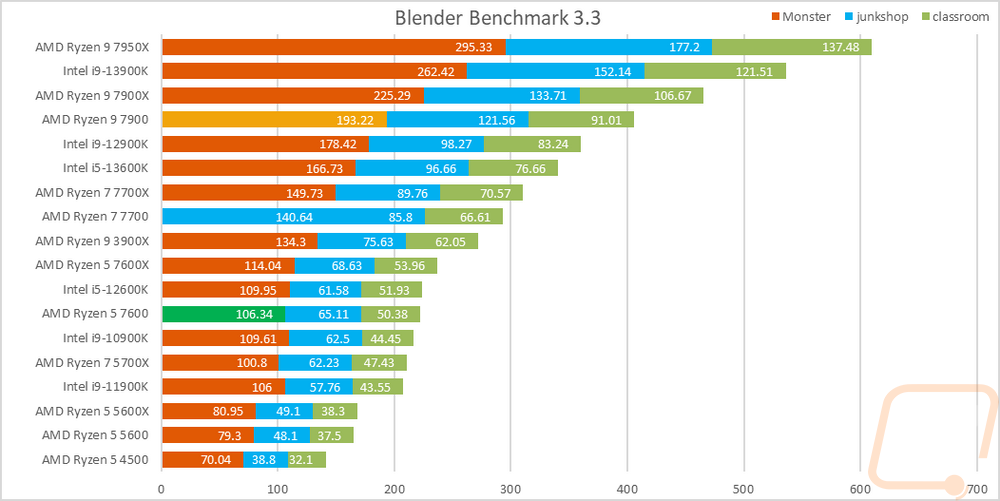
To start testing off I went with a rendering-focused benchmark with the always popular Blender. This benchmark was recently updated so our result list is smaller here. I have all three tests stacked together so we can see an overall of them altogether. Blender loves the higher core counts but clock speed does still make a difference and all three of these CPUs show that with each one having a noticeable performance drop from its higher power twin especially the 7900 compared to the 7900X which has a big gap between each other. That said the 7900 is still way out in front of the 12900K.
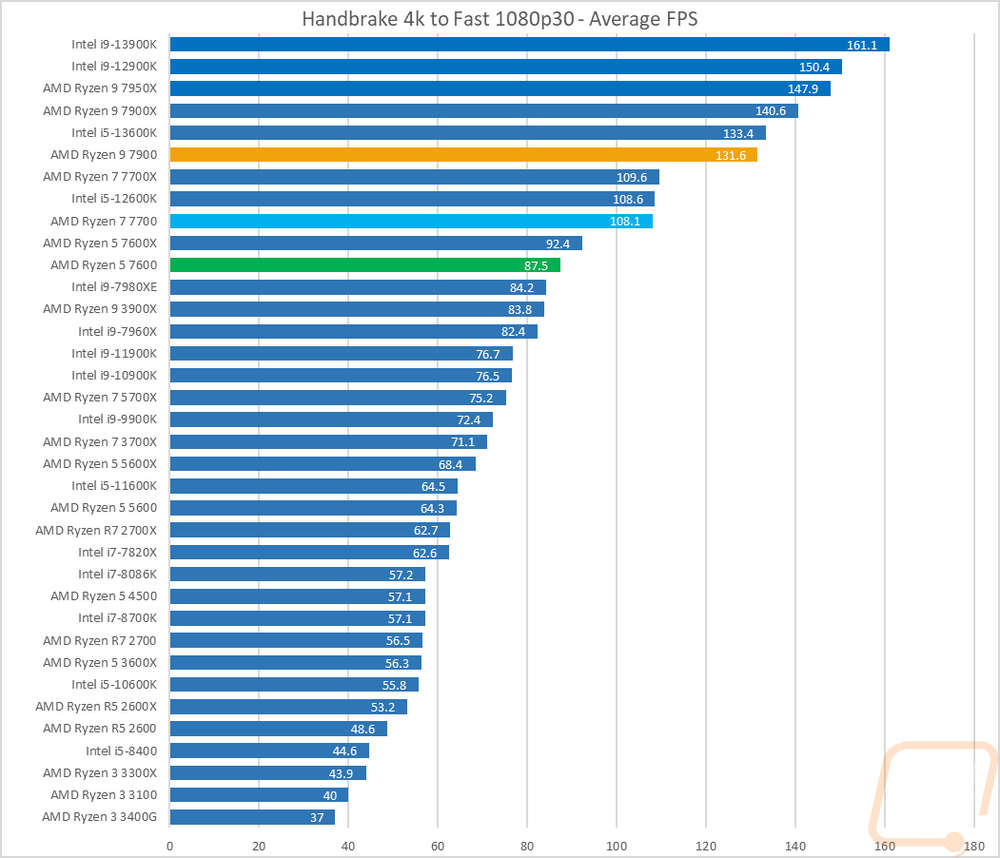
Continuing with the video encoding theme I also have Handbrake which is an open-source transcoder. For this test I am taking a 4k video down to 1080p 30 FPS, the results are the average FPS of that task. The 7900 saw a 9 FPS performance drop compared to the 7900X and with that, it drops below the 13600K which has a much better price. The 7700 on the other hand is running right behind the 12600K and is just 1 FPS lower than the 7700X. Then the 7600 is down 5 FPS.
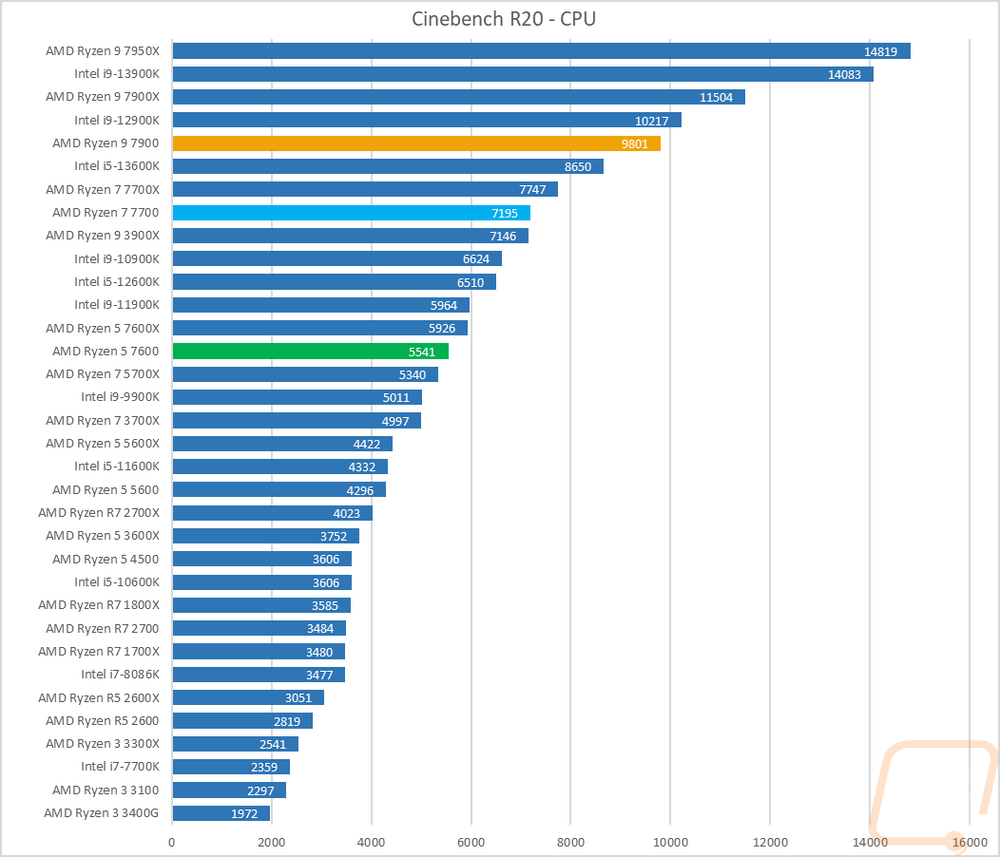
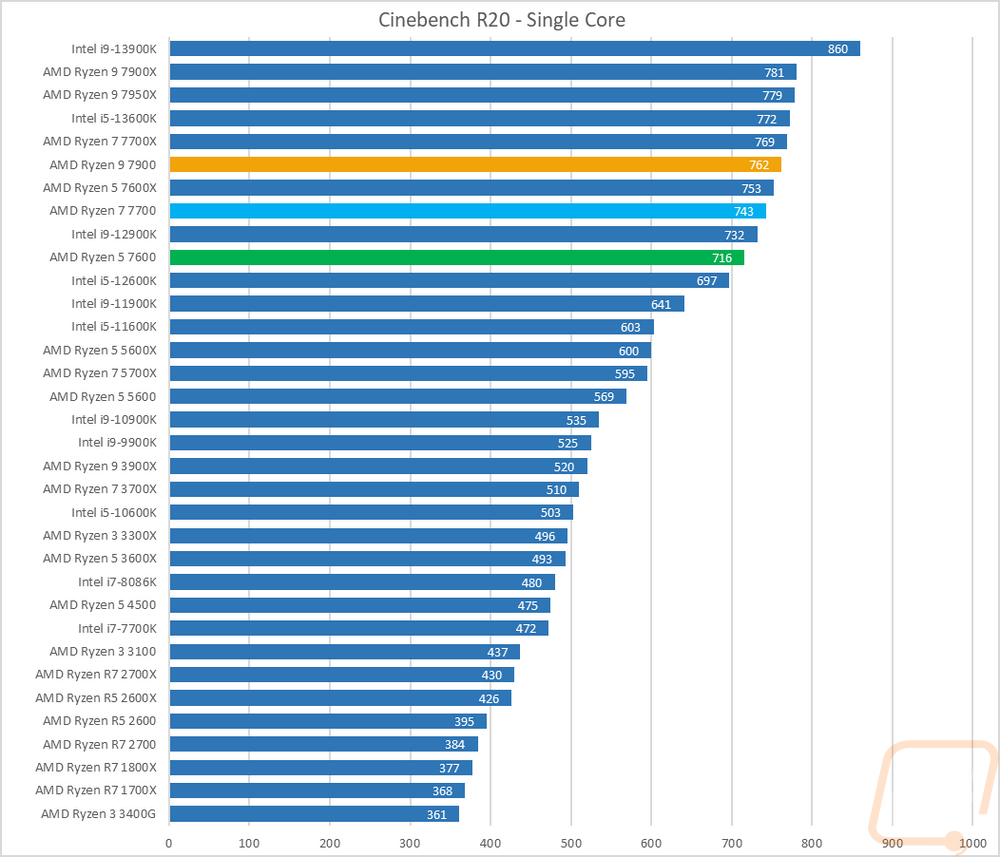
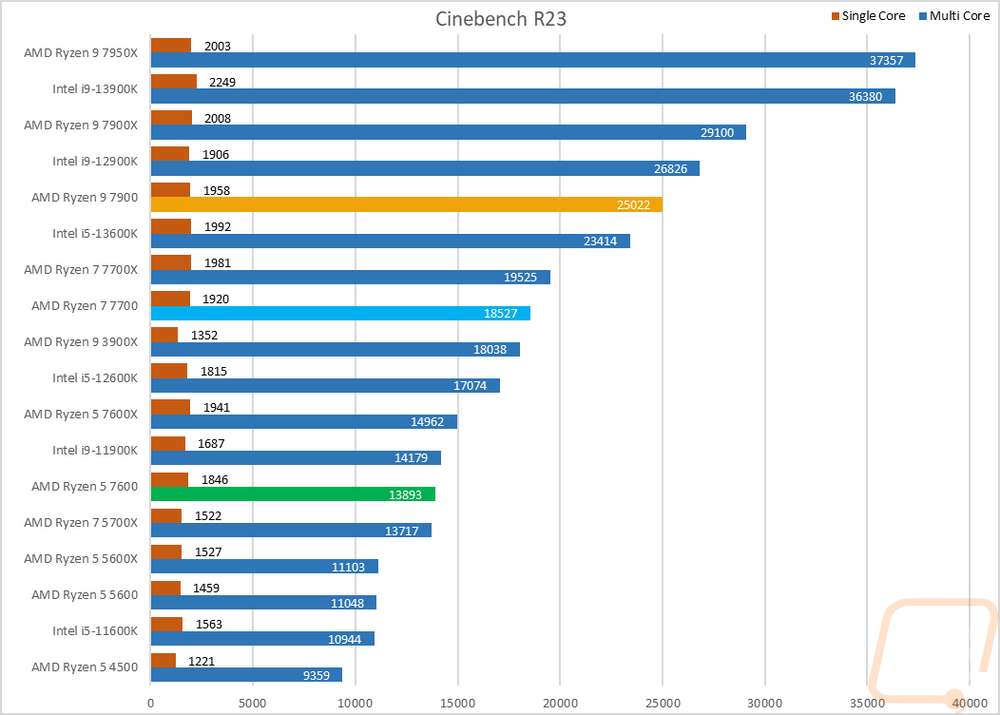
For the always popular Cinebench, I have finally retired the old R15 tests but I am still testing with the current R23 and the slightly older Cinebench R20. I always like Cinebench because we have multi-core and single-core performance which gives us a good look at the performance of the whole CPU and IPC performance. In R20 on the multi-core test, the Ryzen 9 7900 saw a big drop in the multi-core test dropping down below last year's 12900K showing that with its 12 cores the power limit becomes a bigger issue when you have all of the cores under load. The 7700 didn’t have as big of a drop in the multi-core test but did drop and the 7900 was the same. For the single-core R20 results they all dropped down as expected but, interestingly, the 7700X is faster than the 7900, they do have the same max boost clock and the 7700X does have a higher base clock. The same happened with the 7700 which is behind the 7600X which shares the same max boost clock as the 7700. For Cinebench R23 the results for all three were similar to the R20 results as well.
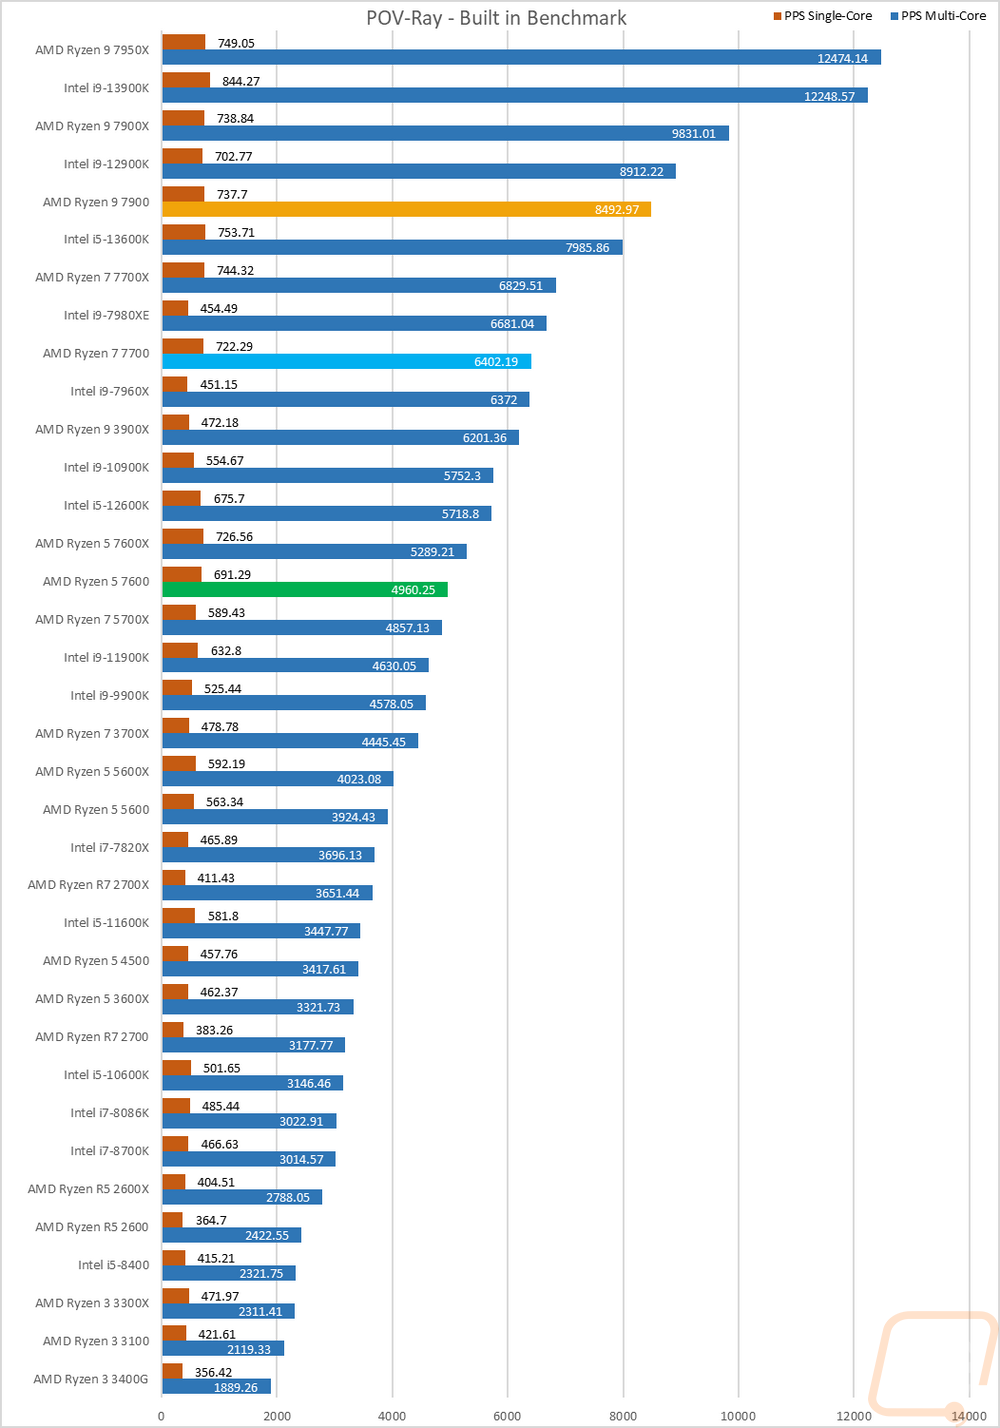
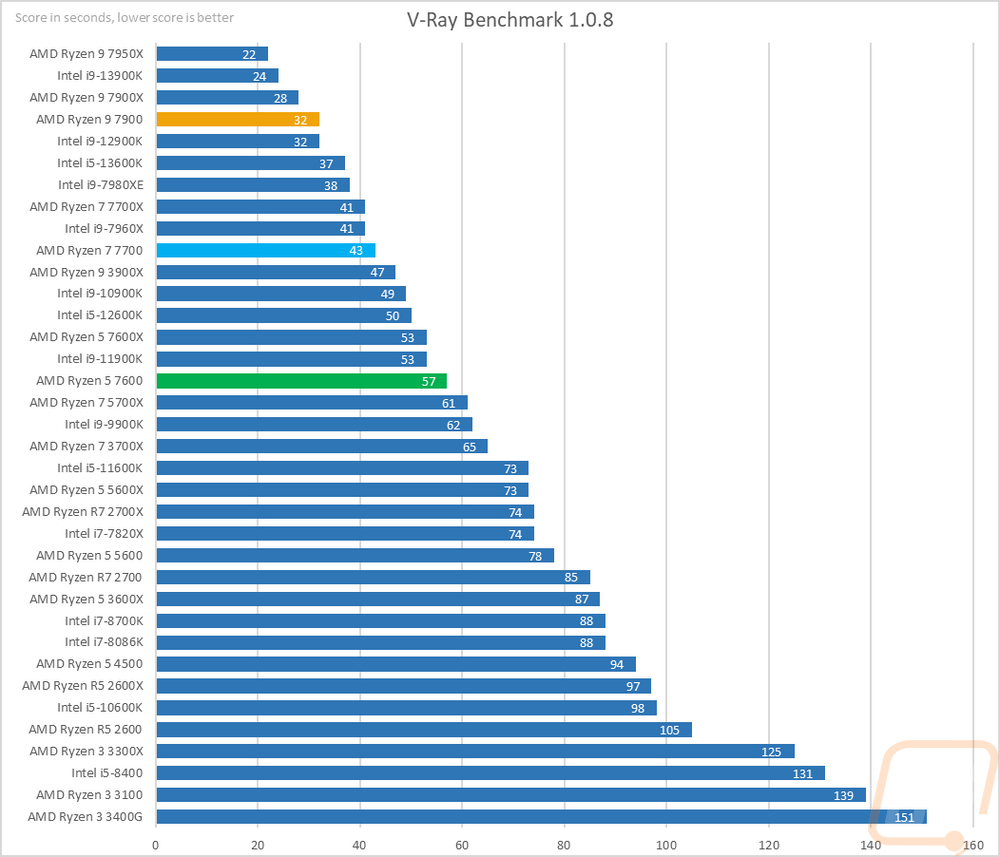
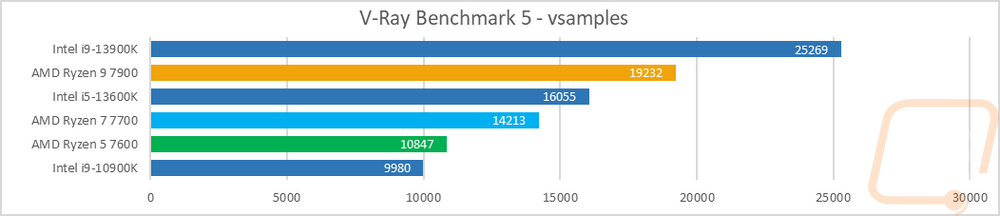
Next up we have ray tracing-focused rendering benchmarks. Here I tested the CPUs in POV-Ray and V-Ray including the newer V-Ray Benchmark 5. POV-Ray was also tested with a single core and across all of the cores. In POC-Ray the Ryzen 9 7900 runs right with its X twin in the single-core test but does drop down below the 12900K in the multi-core test. The Ryzen 7 7700 didn’t do as well on its single-core test dropping 22 points from the 7700X and 400 on the multi-core test. Then the 7600 dropped even more in the single-core compared to the 7600X with 36 points and 329 for the multi-core. In the older V-Ray benchmark, the 7900 did well and is still up near the top of the charts with its 32-second score, tied with the 12900K and 4 seconds slower than the 7900X. The 7700 is just 2 seconds behind the 7700X and the 7600 is 4 seconds behind the 7600X. I also included new V-Ray Benchmark 5 results but I haven’t finished retesting past CPUs on that one just yet.
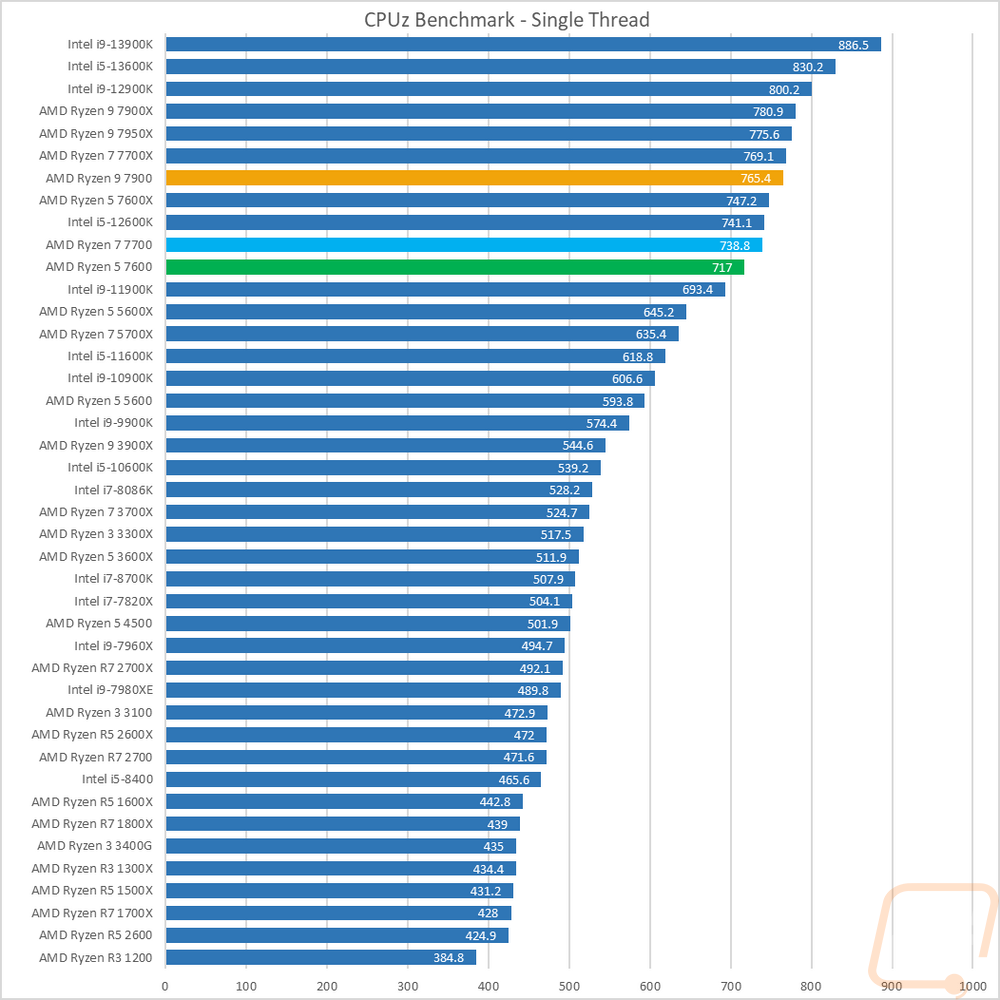
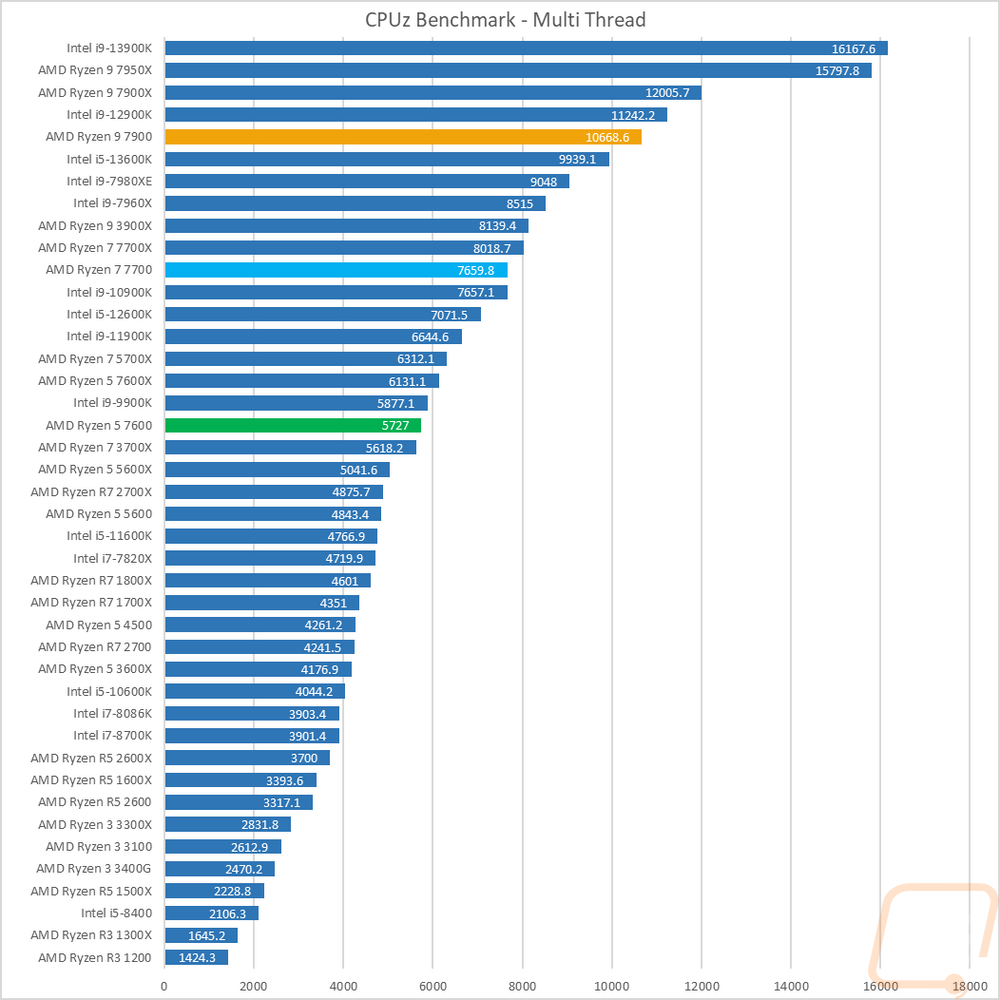
I also tested using the CPUz’s built-in benchmark which does run on a single thread and with all threads. In the multi-thread test, the 7900 dropped down to 10668.6 from 12005.7 which now puts it behind the 12900K. The 7700 on the other hand didn’t drop nearly as much going from 8018 on the 7700X to 7659 on the 7700. Then for the 7600, it scored 5727 compared to the 3131.1 of the 7700X. The multi-thread results are still spread out across the graph but the single-thread test has them all clumped closer together. The 7900 is behind the 7700X and then the 7700 and 7600 are next to each other and behind the 7600X.
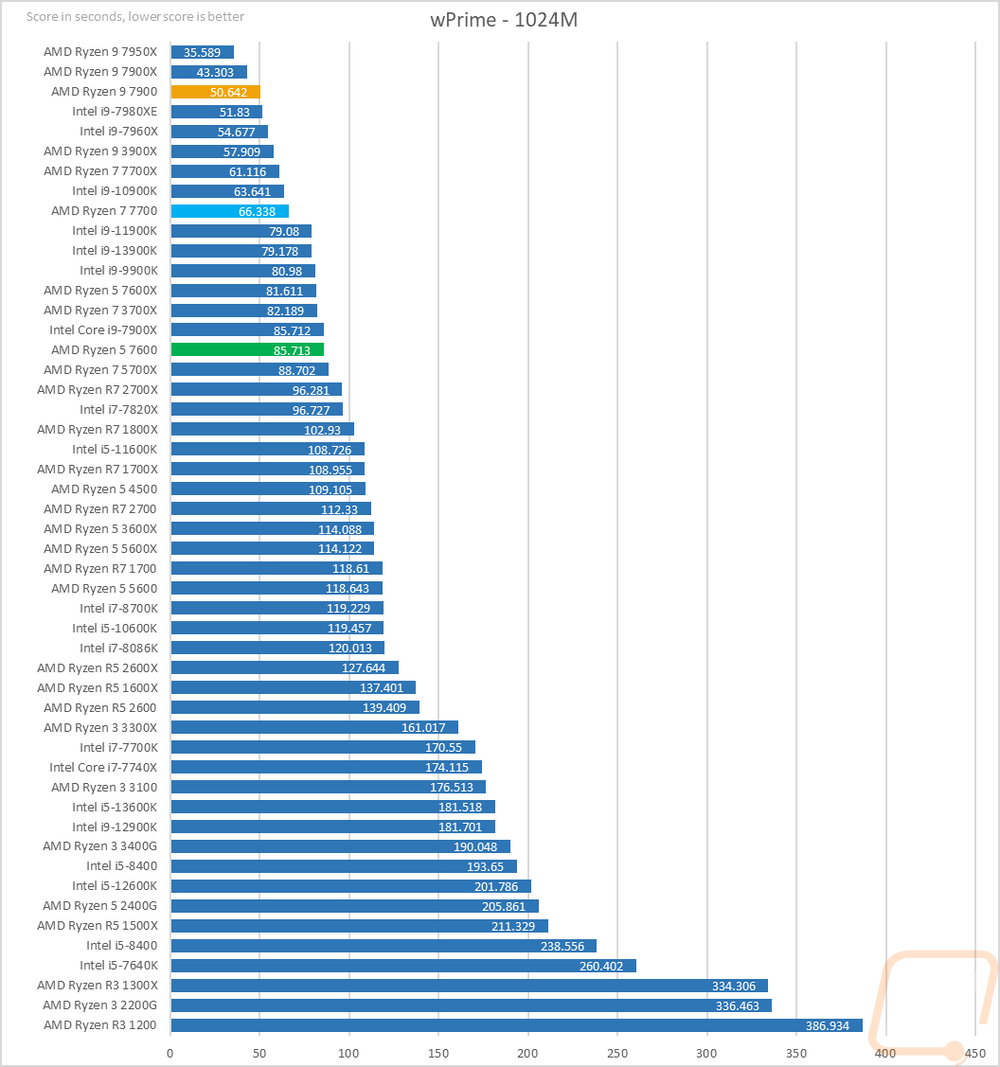
Next, we have wPrime which is a classic overclocking benchmark that calculates pi out to 1024 million digits and is timed. This is a multi-thread heavy test which has the older high core count CPUs still all over the top of the charts and the 7900 did stay up top but is 7 seconds behind the 7900X. The 7700 is 5 seconds behind the 7700X which was enough to put it behind the two-generation old 10900K but is still impressive that a mid-level CPU pulling just 65 watts is running with Intel’s flagship from just a few years ago. Then the 7600 finished the test in 85 seconds to the 81 of the 7600X.
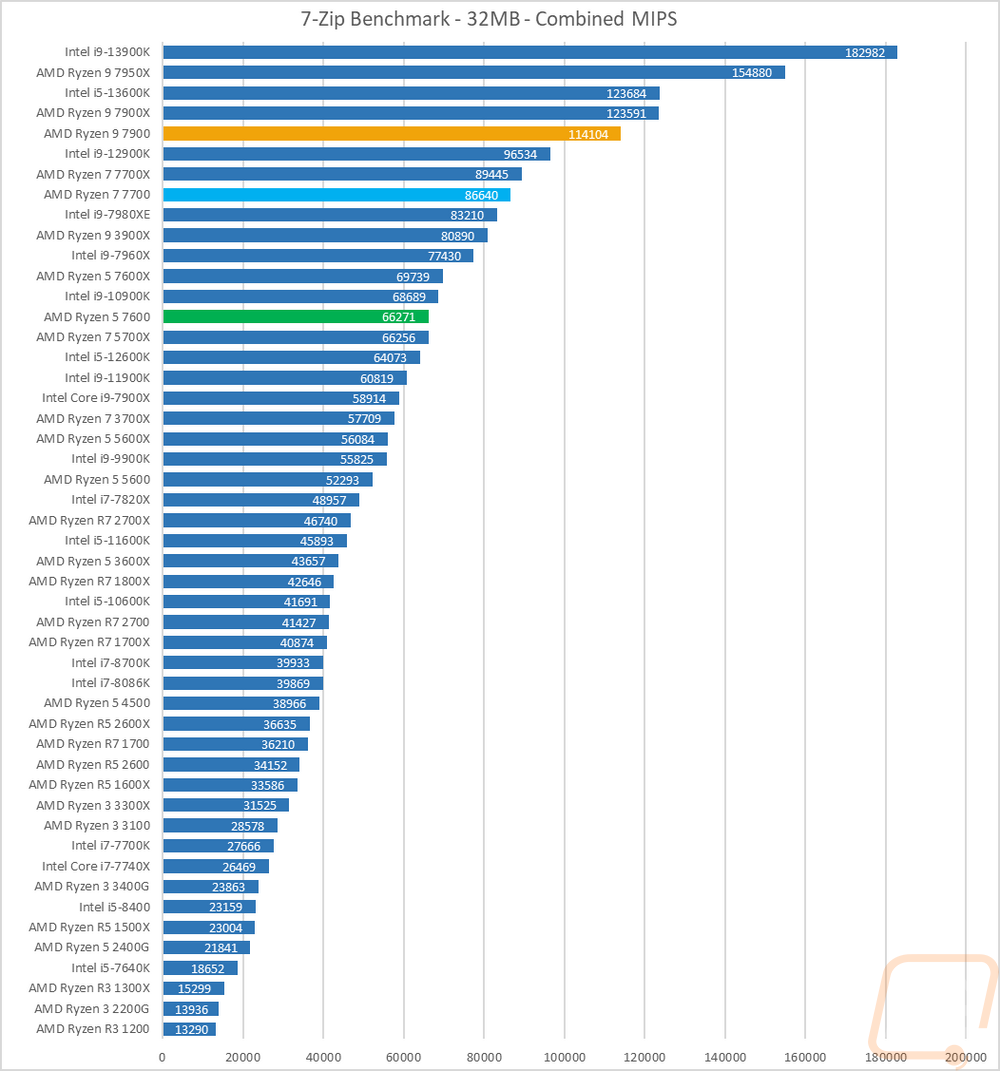
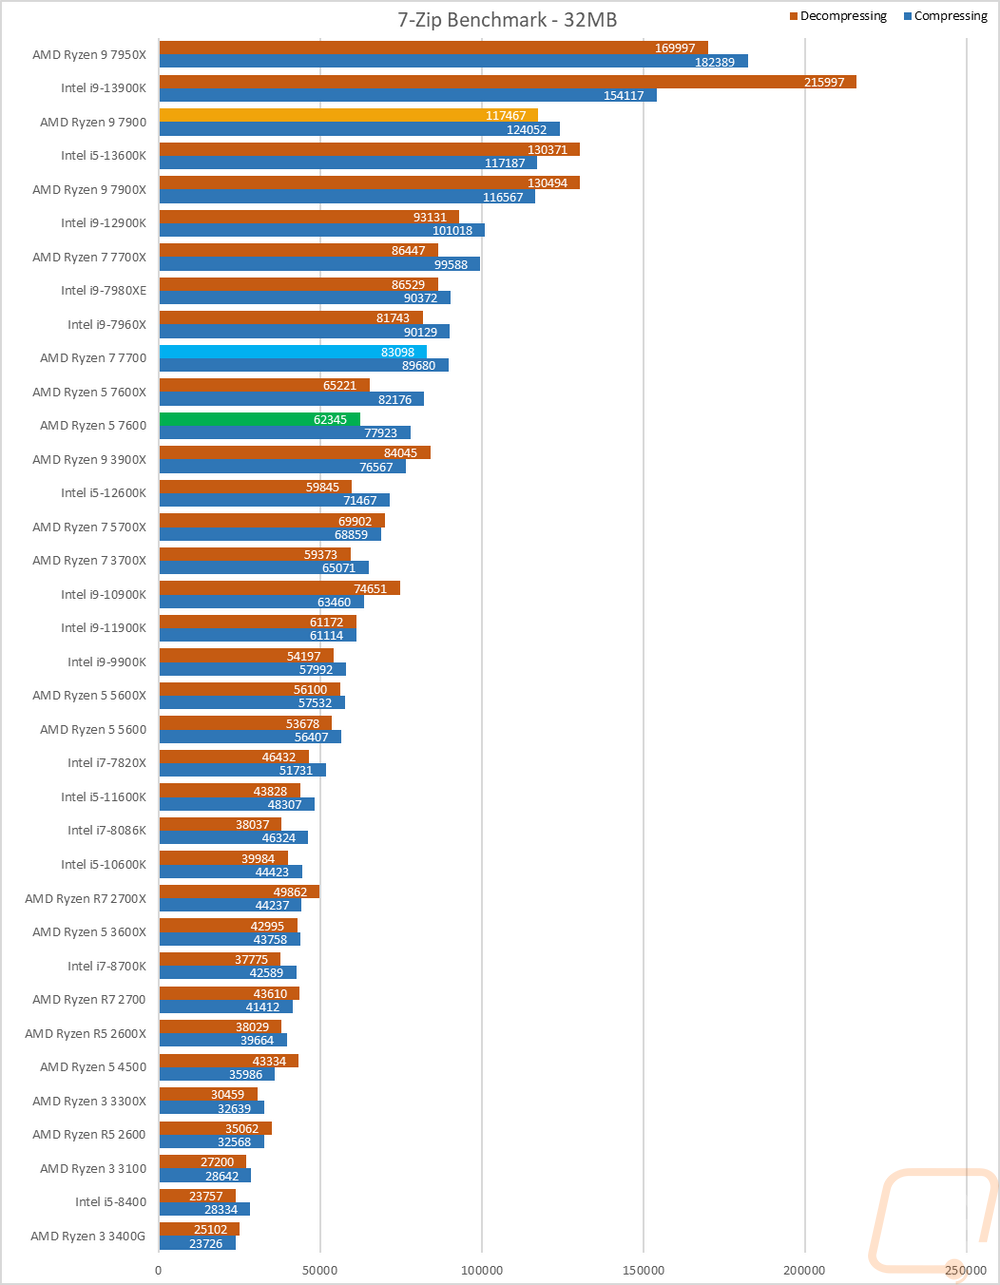
7 Zip is another open-source program, this time for compressing and decompressing all of your files. Here I have run the benchmark and we have three results. The combined MIPS is a combination of compressing and decompressing performance. Then I have it broken down between the two. The combined results have the 7900 up just behind the 7900X and way out in front of the 12900K. The 7700 and the 7600 are both not far behind their X twins on this test. For the split results, I have them sorted by the decompressing result and the 7900 just barely edged out in front of the 7900X but you can see that for the compressing result, it is the other way around. The decompressing result for the 7700X and the 7700 were close as well so I was surprised to see that the 7600 is noticeably behind the 7600X on its results.
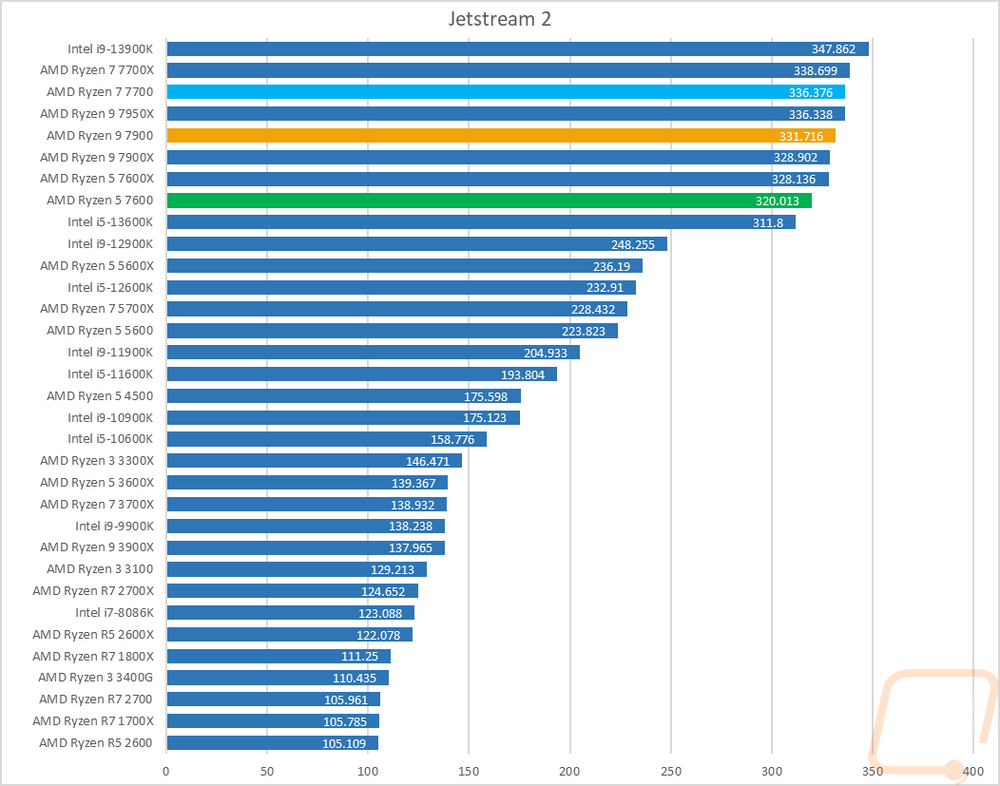
Jetstream 2 is a compilation benchmark that takes a long list of HTML5 and Java in-browser tests and runs them all three times and puts together an overall score. I love this benchmark because let's be honest, most people are using their browser more than any other game or program. Jetstream gives some interesting results sometimes though but it tends to prefer high IPC or single-core performance and there are some situations where it prefers lower core-count CPUs. This time around the 7700 is right with the 7700X and out in front of the 7900 and 7900X. The 7900 is also in front of the 7900X but for the 7600 it is behind the 7600X.
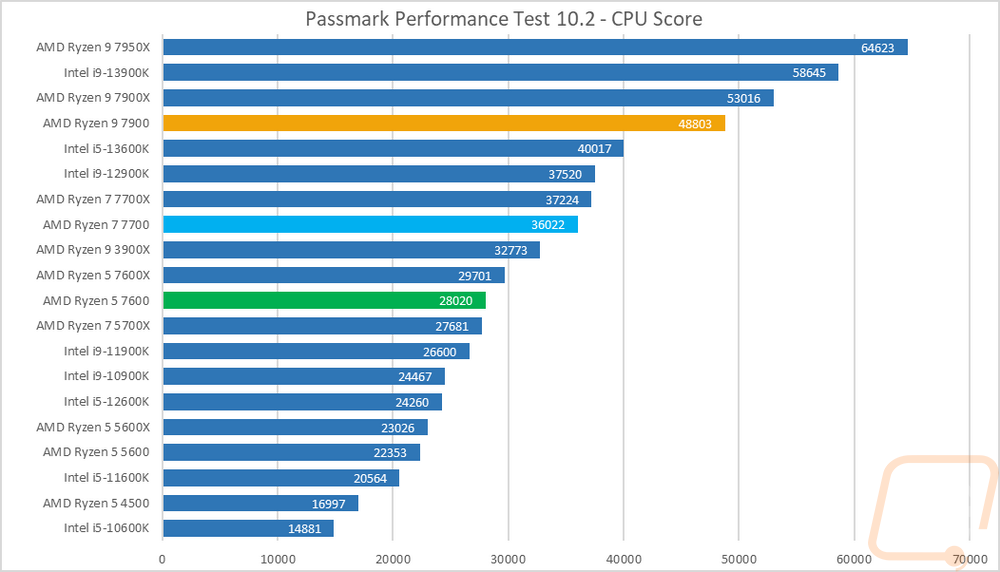
For Passmark Performance Test I used the latest version, Performance Test 10 I only look at the overall CPU score which takes a few different synthetic benchmarks and combines the results to put together an overall score. This is a test that does favor multi-threader performance over IPC and you can see that with the 7950X topping the chart here still. The 7900 is 7.9% below the 7900X but has a huge lead in front of the next CPU behind it, the 13600K. The 7700 is 3% behind the 7700X and the 7600 is 5.6% behind the 7600X.
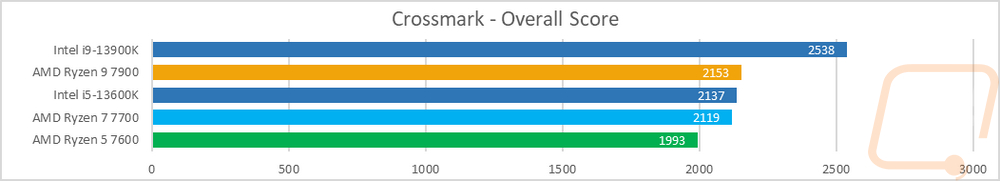
Crossmark was a late addition so I haven’t retested on other CPUs yet. Crossmark is from BAPCo which also makes SYSmark and this is a cross-platform test where you can compare performance between phones and both windows and mac computers. This is the start of our overall PC benchmarks and Crossmark uses a mix of real-world tests to output an overall score. Without any comparisons, this information doesn’t do us much good just yet but the 7900 and the 7700 sit on either side of Intel's new 13600K and the 7600 is down at the bottom of the CPUs tested so far.
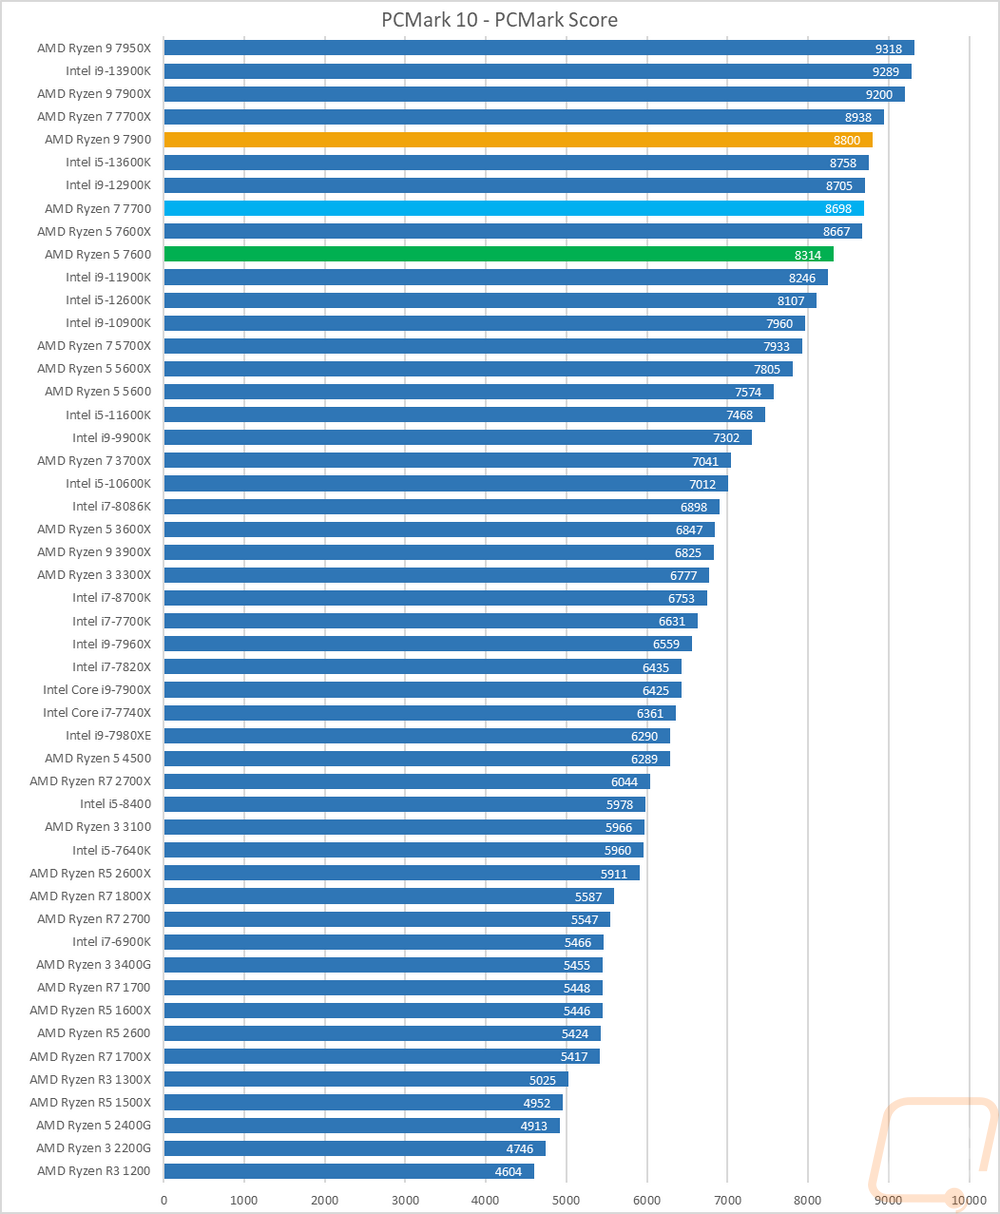
PCMark 10 is a great test because it tests things like video calls, browser performance, excel, and word performance to give an idea of real-world performance. It tends to like higher clock speeds but does take raw core count into account as well which you can see with the 7950X at the top of the chart and the Intel 13900K right behind it. The 7900 interestingly though came in just behind the 7700X and the 7700 is just barely ahead of the 7600X.
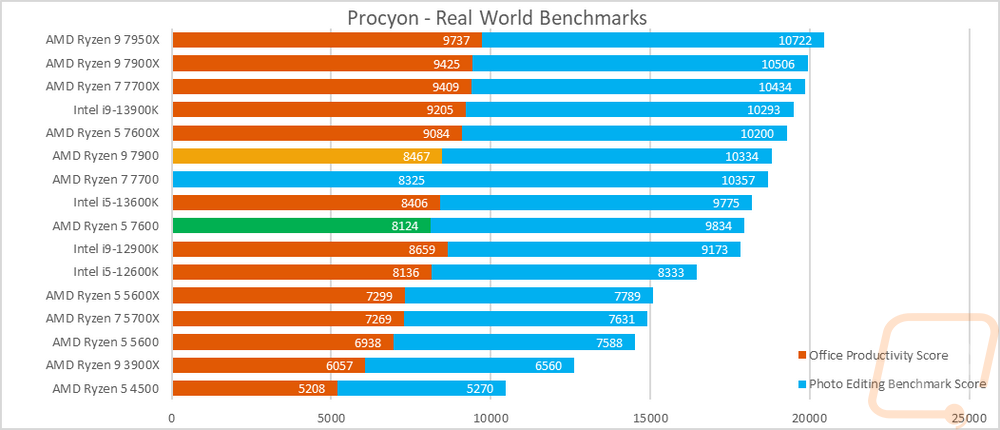
We recently added even more real-world testing with the UL Procyon Benchmarks which are as real-world as they can get using the actual programs that you would use in each test. There are two overall benchmarks, first is the Office Productivity Benchmark which uses Microsoft Office 365 to test actual performance in word, excel, PowerPoint, and outlook. The second benchmark is the Photo Editing Benchmark which is run using the latest version of Photoshop as well as Lightroom Classic to look at photo editing performance. I have both scores stacked together to get an overall look at the performance. It is really interesting to see how all three of the X CPUs are out in front of the 7900 with the office productivity scores on all of the non-X CPUs being lower than the rest. The photo editing benchmark on the other hand they all did well and kept up with their higher-powered brothers.
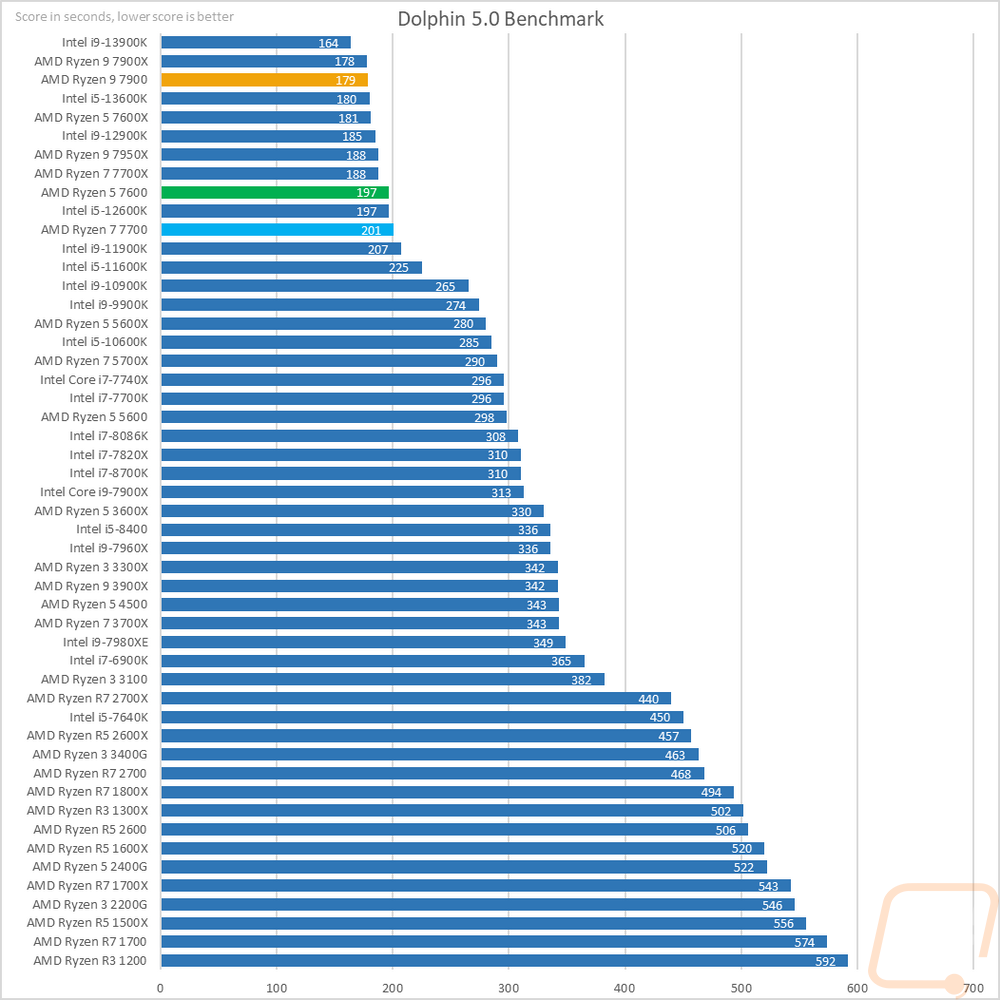
Moving the focus over towards gaming my next test is using Dolphin 5.0 Benchmark. Dolphin 5.0 is a Wii emulator and like most emulators, it doesn’t care about high core counts at all. In fact, it only runs two in total. Clock speeds are king here most of the time and the 7900 was just one second behind the 7900X. The 7600 had an interesting result though coming in ahead of the 7700 but the same thing happened with the 7700X and the 7600X showing that the extra two cores don’t matter in this situation.
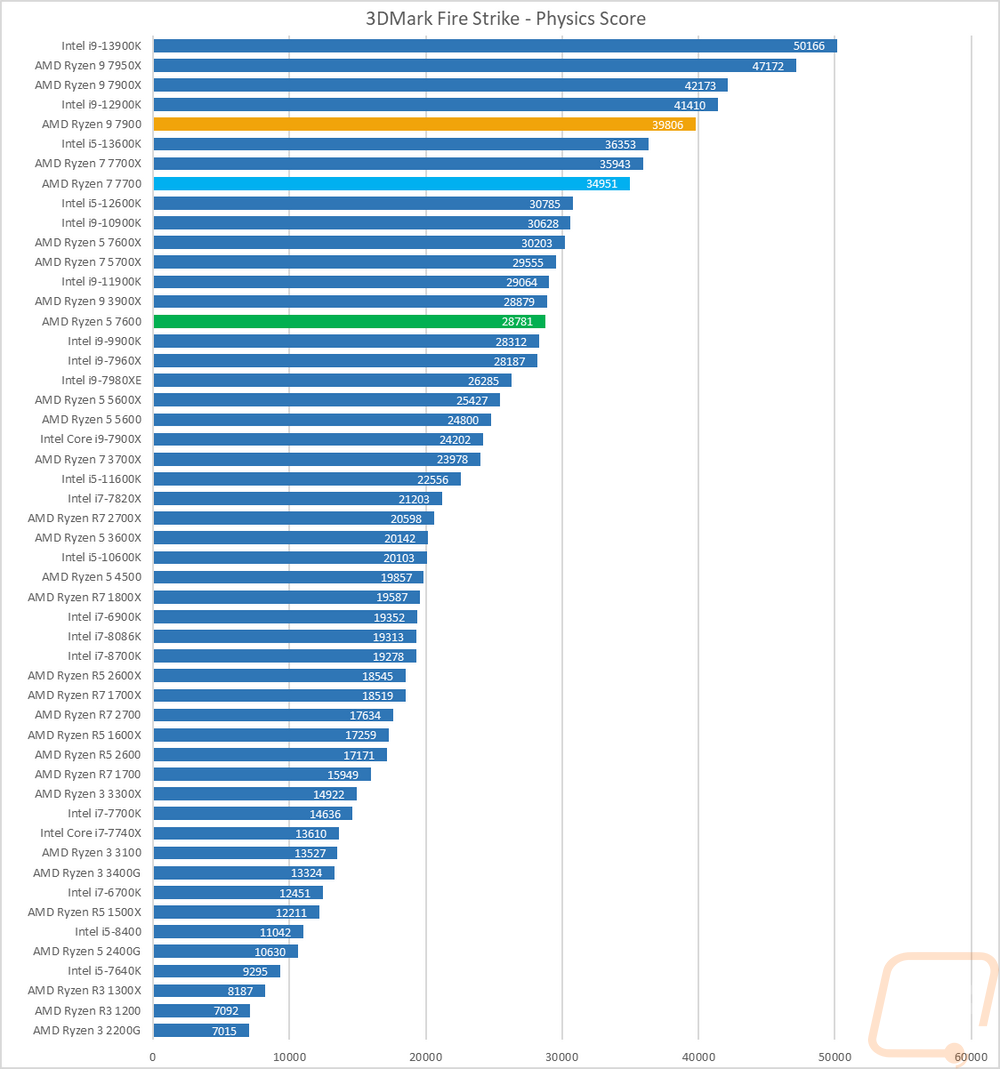
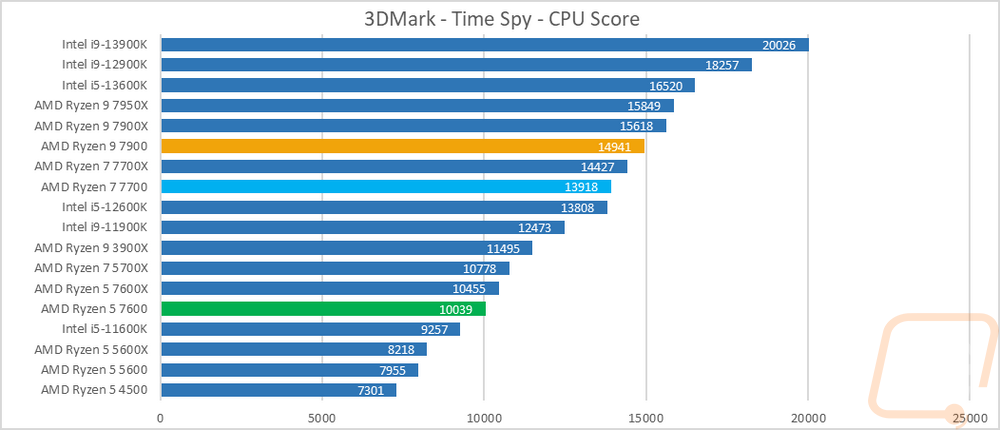
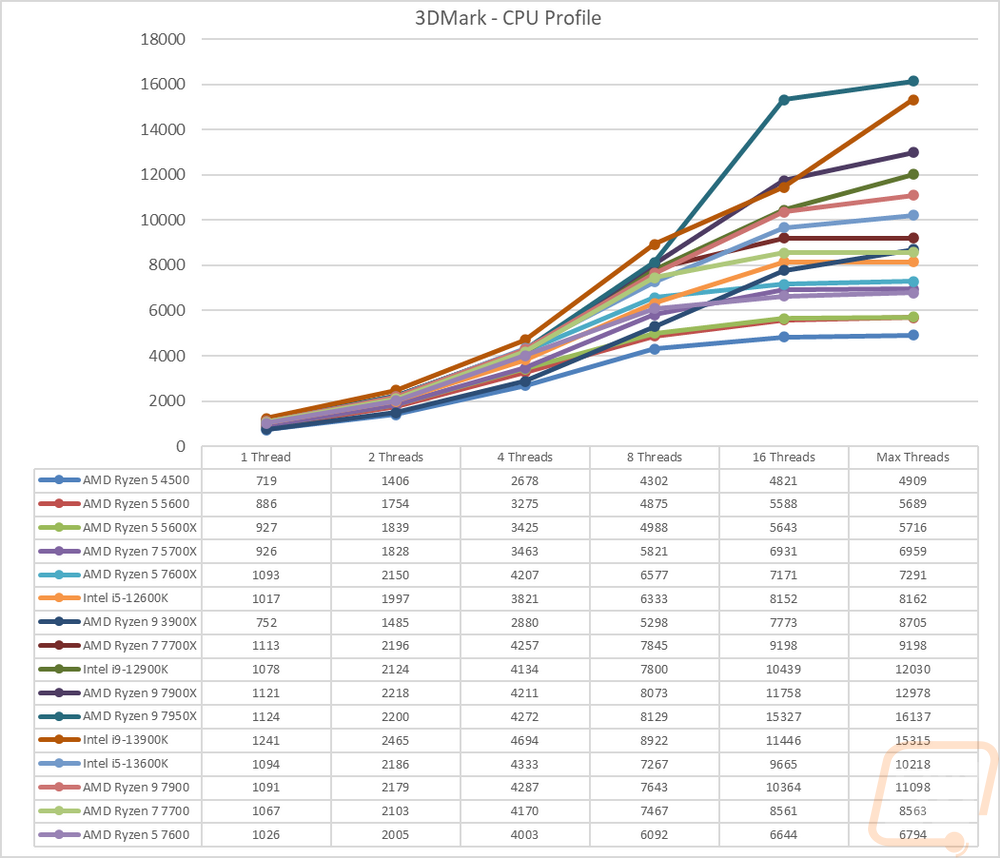
Before diving into game testing I wanted to check out synthetic performance using 3DMark. I tested with the older DX11 Fire Strike test as well as the newer DX12 Time Spy. I also added the new 3DMark CPU Profile benchmark into the mix as well which does a good job of showing the full range of thread counts that you might see being used in games as well as a max threads option that does everything above 16 threads. In the Fire Strike test, the Fire Strike results repeated what we have seen in a lot of our tests so far today with the 7900 dropping 5.6% from the 7900X which put it behind the 12900K. The 7700 dropped 2.7% compared to the 7700X and the 7600 was down 4.7% from the 7600X which given how tight the grouping is around that dropped it down below the 5700X, 11900K, and 3900X. With Time Spy the 7900 was down 4.3%, the 7700 was down 3.5%, and the 7600 was down 3.9%.
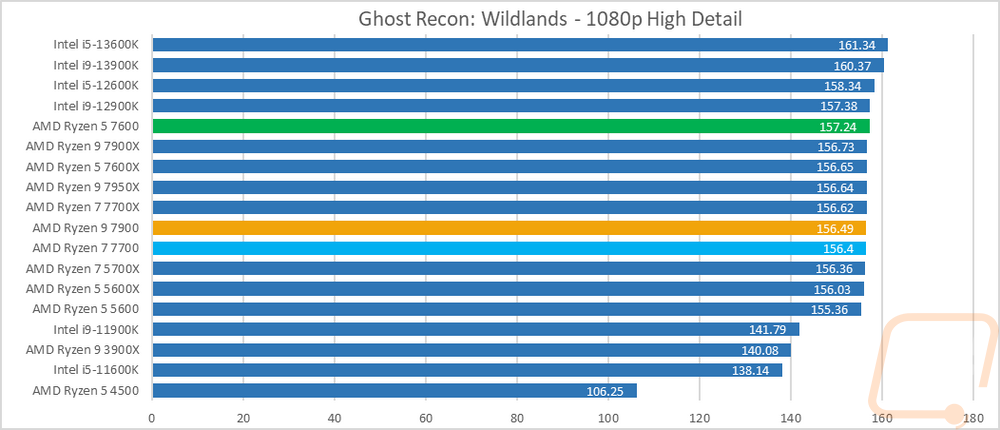
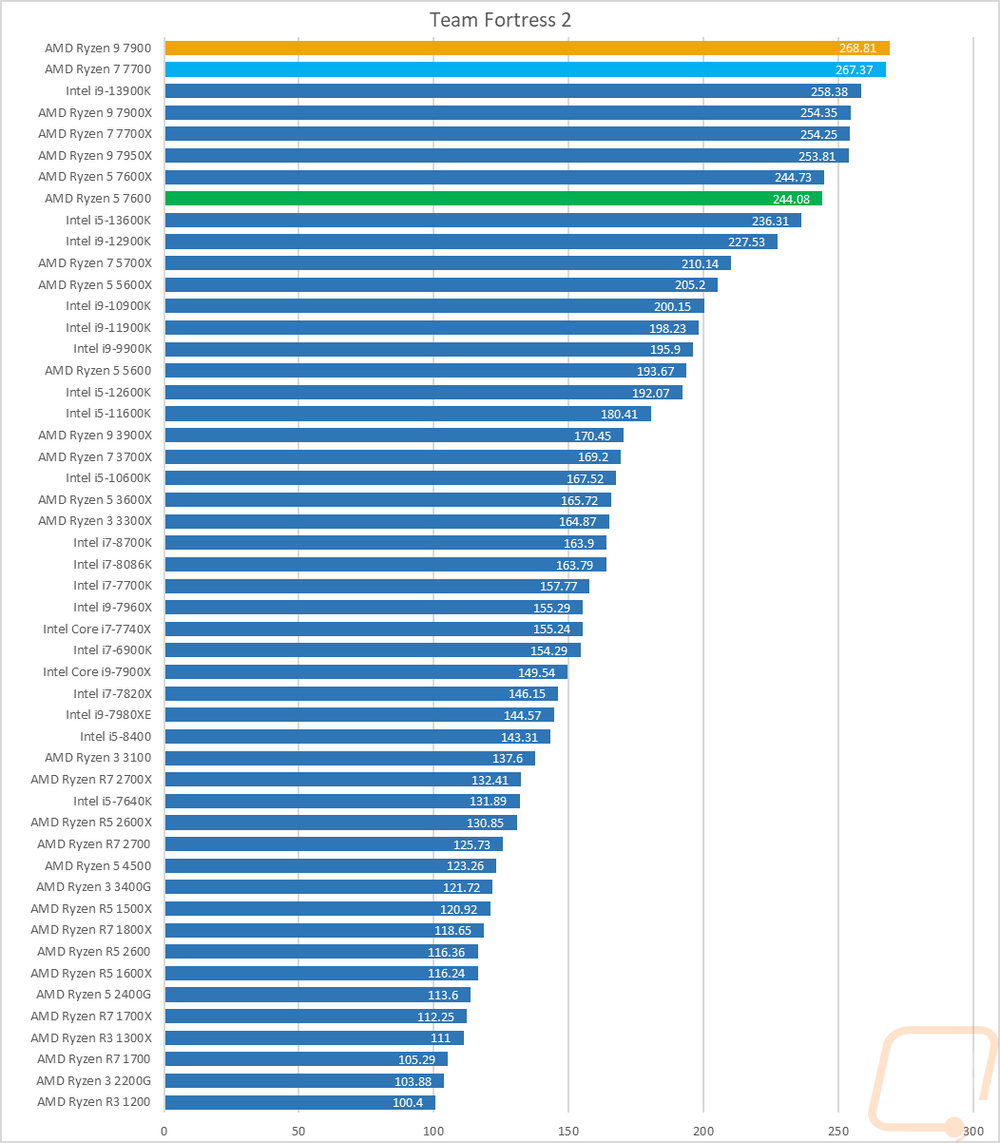
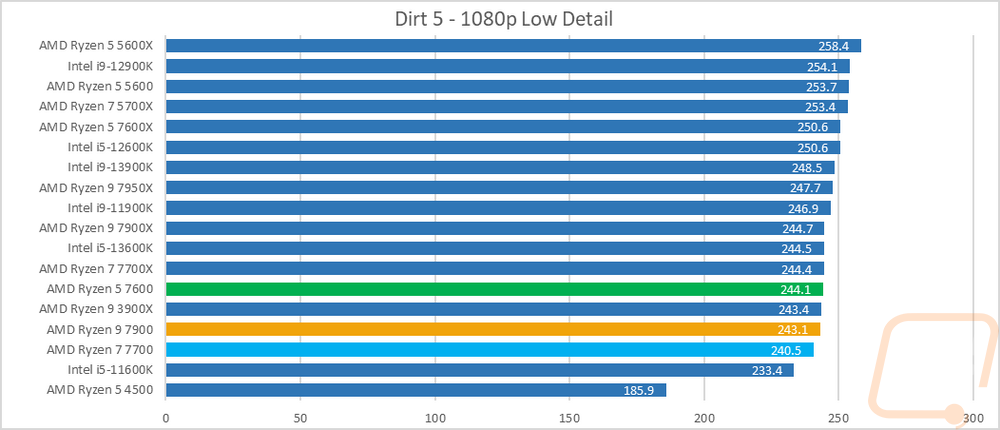
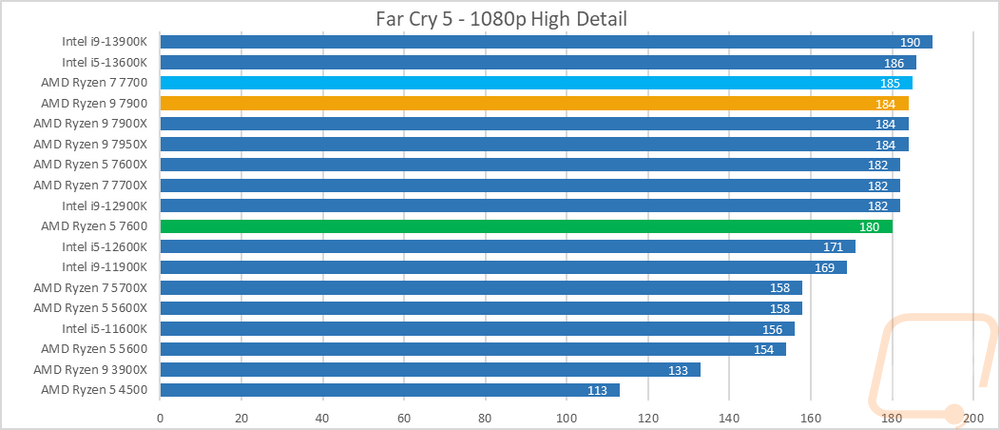
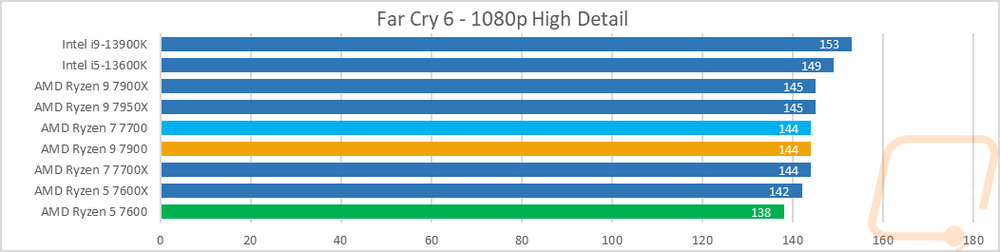
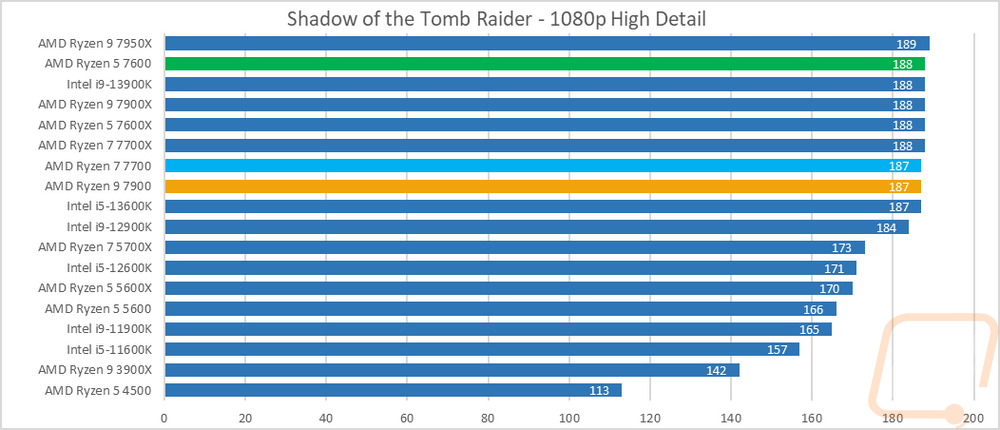
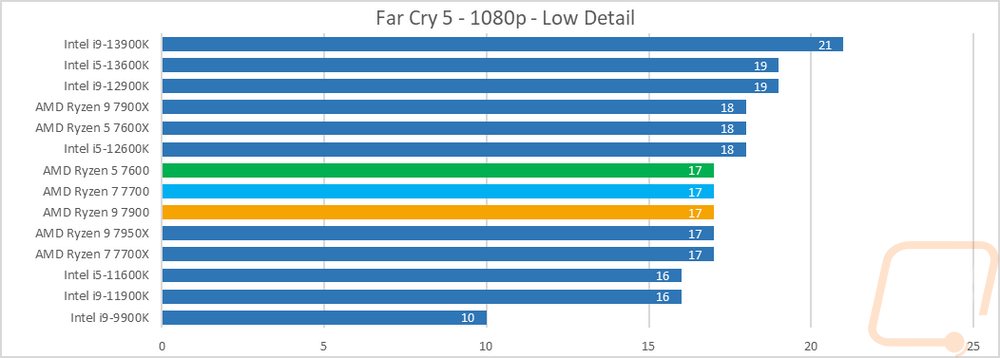
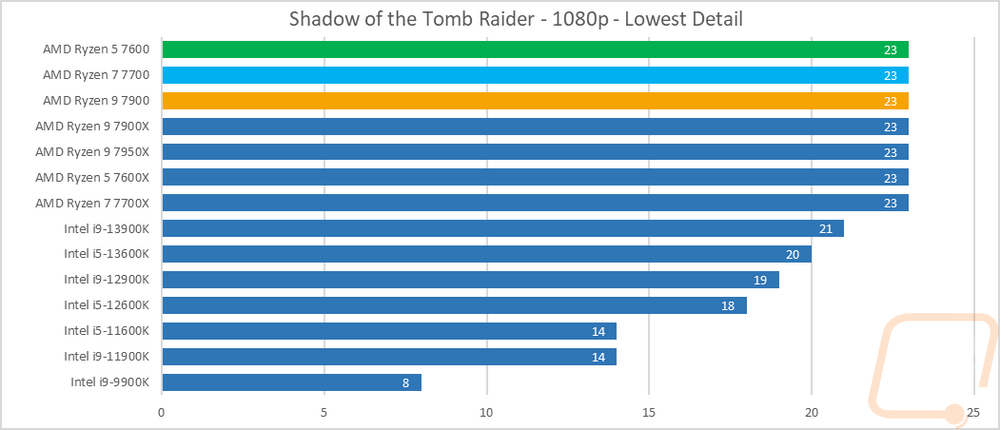
The in-game results are all over the place for the non-X CPUs. The lower power draw helped keep temps down in some of the games and had them testing faster than the original CPUs in some situations. Some of our results have the lower-end CPUs up ahead of the higher-end CPUs just like in the Jetstream 2 tests and the Dolphin benchmark. But overall what we saw is that the non-X CPUs didn’t drop in performance with their lower power usage. Some of the games are a little less demanding and the TDP wasn’t the limitation. Then with TF2 for example we can see how AMD's constant AGESA updates may have improved things with the 7900 jumping past Intel’s latest 13900K even.
The AIDA64 benchmarks showed that the cache performance dropped slightly with the non-X CPUs but most likely from AGESA firmware updates they all have improved memory performance.
|
AIDA64 |
L1 Cache Read |
L1 Cache Write |
L1 Cache Latency |
L2 Cache Read |
L2 Cache Write |
L2 Cache Latency |
L3 Cache Read |
L3 Cache Write |
L3 Cache Latency |
|
|
GB/s |
GB/s |
ns |
GB/s |
GB/s |
ns |
GB/s |
GB/s |
ns |
|
AMD Ryzen R7 2700X |
999.43 |
502.5 |
1 |
978.03 |
495.12 |
2.8 |
414.95 |
417.71 |
8.8 |
|
AMD Ryzen R5 2600X |
768.13 |
388.05 |
1 |
729.37 |
366.01 |
2.9 |
429.09 |
323.83 |
9.1 |
|
Ryzen 5 2400G |
485.01 |
238.29 |
1 |
459.8 |
232.2 |
3.1 |
222.96 |
181.6 |
9.6 |
|
Ryzen 3 2200G |
460.55 |
227.41 |
1.1 |
352.84 |
177.56 |
3.3 |
137.3 |
171.2 |
10.2 |
|
Intel i7-8700K |
1595.6 |
803.65 |
0.9 |
640.37 |
397.14 |
2.6 |
337 |
213.67 |
11 |
|
Intel i5-8400 |
1417.2 |
710.79 |
1 |
543.81 |
352.9 |
3.1 |
270.89 |
186.82 |
13 |
|
Intel Core i9-7980XE |
3758.3 |
1896.7 |
1.1 |
1671.7 |
1069.9 |
5.6 |
229.61 |
118.4 |
21 |
|
Intel Core i9-7960X |
3532.3 |
1785.2 |
1 |
1571.6 |
1003.5 |
5.1 |
220.22 |
121.04 |
19.8 |
|
Intel Core i7-7820X |
1969.9 |
995.02 |
1 |
884.63 |
574.74 |
5.6 |
114.4 |
103.57 |
19.2 |
|
Intel Core i5-7640X |
1044.8 |
31888 |
1 |
397.26 |
247 |
2.9 |
228.31 |
163.86 |
11.1 |
|
Intel Core i9-7900X |
2418.5 |
709.16 |
1 |
1037.3 |
521.94 |
5.2 |
124.16 |
106.78 |
21.2 |
|
Intel Core i7-7740X |
1102.7 |
561.25 |
0.9 |
424.55 |
304.3 |
2.7 |
287.01 |
186.67 |
21.2 |
|
Intel i7-6900K |
1963.9 |
999.59 |
1 |
710.28 |
310.34 |
4.1 |
243.96 |
195.41 |
14.6 |
|
Intel i7-7700K |
1114.6 |
560.82 |
0.9 |
415.45 |
285.97 |
2.7 |
234.5 |
188.7 |
10.4 |
|
Intel i7-5960X |
1748.5 |
874.6 |
1.2 |
623.08 |
272.77 |
3.5 |
260.72 |
184.92 |
15.3 |
|
AMD Ryzen R7 1800X |
917.46 |
460.16 |
1.1 |
831.95 |
446.37 |
4.7 |
388.18 |
386.01 |
12.4 |
|
AMD Ryzen R7 1700X |
867.89 |
435.33 |
1.2 |
809.29 |
419.38 |
5 |
369.75 |
350.31 |
12.9 |
|
AMD Ryzen R7 1700 |
793.9 |
398.12 |
1.3 |
742.92 |
389.73 |
5.4 |
334.36 |
332.12 |
14.2 |
|
AMD Ryzen R5 1600X |
689.47 |
345.95 |
1.1 |
630.99 |
334.93 |
4.7 |
386.48 |
326.86 |
12.3 |
|
AMD Ryzen R5 1500X |
446.84 |
224.01 |
1.1 |
306.82 |
211.58 |
11.8 |
306.82 |
211.58 |
11.8 |
|
AMD Ryzen R5 2600 |
685.38 |
344.05 |
1 |
669.28 |
333.5 |
3.1 |
381.16 |
320.56 |
9.8 |
|
AMD Ryzen R7 2700X |
849.91 |
426.09 |
1 |
837.76 |
418.75 |
3 |
357.51 |
356.71 |
9.4 |
|
Intel i7-8086K |
1596.4 |
803.56 |
0.9 |
623.36 |
423.53 |
2.6 |
380.04 |
243.73 |
10.9 |
|
Intel i9-9900K |
2375.6 |
1195.4 |
0.8 |
907.65 |
626.34 |
2.4 |
302.01 |
221.1 |
11 |
|
AMD Ryzen 9 3900X |
3098.6 |
1551.4 |
0.9 |
1545.3 |
1416.8 |
2.8 |
1014.4 |
836.39 |
11.5 |
|
AMD Ryzen 7 3700X |
2133.2 |
1072.9 |
0.9 |
1069.1 |
993.49 |
2.8 |
611.53 |
573.21 |
10.2 |
|
AMD Ryzen 5 3600X |
1547.4 |
779.24 |
1 |
777.62 |
745.3 |
2.8 |
584.93 |
538.45 |
10.4 |
|
AMD Ryzen 3 3400G |
508.97 |
253.87 |
1 |
490.26 |
247.04 |
3 |
233.57 |
193.62 |
9.3 |
|
AMD Ryzen 3 3300X |
1080.5 |
541.5 |
0.9 |
541.84 |
530.5 |
2.7 |
322.13 |
321.33 |
11.1 |
|
AMD Ryzen 3 3100 |
965.85 |
484.67 |
1 |
485.55 |
460.71 |
3.1 |
374.11 |
343.53 |
11.8 |
|
Intel i5-10600K |
1676.6 |
840.87 |
0.8 |
662.98 |
452.67 |
2.5 |
361.35 |
238.47 |
10.5 |
|
Intel i9-10900K |
3162.1 |
1586.7 |
0.8 |
1201.8 |
759.97 |
2.4 |
407.66 |
245.94 |
11.4 |
|
AMD Ryzen 5 5600X |
1721.4 |
869.69 |
0.9 |
851.89 |
831.97 |
2.6 |
276.24 |
298.84 |
11 |
|
Intel i9-11900K |
4542.8 |
2299.3 |
1 |
1413.2 |
691.62 |
2.5 |
330.32 |
213.28 |
11.4 |
|
Intel i5-11600K |
3412.3 |
1724.9 |
1 |
960.91 |
526.76 |
2.7 |
319.1 |
198.57 |
11.4 |
|
Intel i9-12900K |
2310 |
1438.7 |
1 |
1233.5 |
562.72 |
2.9 |
678.84 |
418.11 |
19.8 |
|
Intel i5-12600K |
1461.1 |
971.78 |
1.1 |
846.4 |
360.51 |
3.2 |
598.86 |
292.09 |
21.4 |
|
AMD Ryzen 5 4500 |
1561.9 |
784.1 |
1 |
785.34 |
751.61 |
2.9 |
350.05 |
571.19 |
10.5 |
|
AMD Ryzen 5 5600 |
1646.6 |
831.24 |
0.9 |
832.43 |
767.22 |
2.7 |
445.8 |
437.73 |
11.9 |
|
AMD Ryzen 7 5700X |
2267.8 |
1157.8 |
0.9 |
1147.6 |
1026.1 |
2.6 |
501.53 |
526.11 |
11.5 |
|
AMD Ryzen 7 7700X |
2722.9 |
1381 |
0.7 |
1361.1 |
1305.1 |
2.7 |
887.95 |
901.2 |
10.1 |
|
AMD Ryzen 5 7600X |
1996.3 |
1019.3 |
0.7 |
1020.9 |
999.93 |
2.6 |
847.43 |
847.61 |
10.5 |
|
AMD Ryzen 9 7950X |
5252.2 |
2685 |
0.7 |
2615.6 |
2588.4 |
2.6 |
1293.7 |
1357.3 |
9.9 |
|
AMD Ryzen 9 7900X |
4042.4 |
2051.4 |
0.7 |
2008.5 |
1956.3 |
2.5 |
1278.6 |
1394.1 |
9.8 |
|
Intel i9-13900K |
2005.7 |
872.39 |
0.9 |
2280.2 |
851.63 |
3.7 |
1729.2 |
619.38 |
18.3 |
|
Intel i5-13600K |
3218.4 |
1472.5 |
1.1 |
1156 |
479.87 |
4.5 |
907.63 |
406.76 |
14.9 |
|
AMD Ryzen 9 7900 |
3839.2 |
2023.6 |
0.7 |
1925.5 |
1865.1 |
2.7 |
1146 |
1046.4 |
10.3 |
|
AMD Ryzen 7 7700 |
2630.8 |
1333.7 |
0.8 |
1336.2 |
1298.2 |
2.9 |
826.97 |
879.08 |
10.4 |
|
AMD Ryzen 5 7600 |
1898 |
963.23 |
0.8 |
964.63 |
946.49 |
2.9 |
698.77 |
690.84 |
10.8 |
|
AIDA64 |
Memory Read |
Memory Write |
Memory Latency |
Single-Precision FLOPS |
Double Precision FLOPS |
AES-256 |
24-bit Integer IOPS |
32-bit Integer IOPS |
64-bit Integer IOPS |
|
|
MB/s |
MB/s |
ns |
GFLOPS |
GFLOPS |
MB/s |
GIOPS |
GIOPS |
GIOPS |
|
AMD Ryzen R7 2700X |
50214 |
48578 |
65 |
507.9 |
253.9 |
70514 |
127.7 |
127.7 |
64.22 |
|
AMD Ryzen R5 2600X |
50273 |
48346 |
65.5 |
383.2 |
191.4 |
51932 |
95.82 |
95.82 |
48.15 |
|
Ryzen 5 2400G |
45967 |
47850 |
66.6 |
235.9 |
117.8 |
32388 |
58.94 |
58.98 |
29.67 |
|
Ryzen 3 2200G |
35567 |
36240 |
118.4 |
225.8 |
112.6 |
27603 |
56.32 |
56.32 |
28.3 |
|
Intel i7-8700K |
38421 |
40175 |
57.9 |
825 |
412.5 |
29406 |
370 |
370 |
51.55 |
|
Intel i5-8400 |
38096 |
40549 |
59.8 |
728.8 |
364.5 |
25192 |
323.5 |
323.5 |
45.55 |
|
Intel Core i9-7980XE |
77004 |
68888 |
73.4 |
1831 |
915.5 |
69377 |
821.2 |
821.3 |
121.6 |
|
Intel Core i9-7960X |
79416 |
71554 |
74.9 |
1681 |
840.6 |
65409 |
754 |
753.9 |
114.7 |
|
Intel Core i7-7820X |
76049 |
73759 |
71.6 |
944.9 |
472.5 |
36420 |
423.7 |
423.7 |
63.85 |
|
Intel Core i5-7640X |
30786 |
31888 |
68.5 |
536.5 |
268.2 |
18547 |
238.1 |
138.1 |
33.53 |
|
Intel Core i9-7900X |
76856 |
72856 |
72.8 |
1148 |
574.5 |
45506 |
515.1 |
515 |
79.76 |
|
Intel Core i7-7740X |
38455 |
40596 |
53.2 |
575.4 |
287.8 |
20503 |
258.1 |
258 |
35.97 |
|
Intel i7-6900K |
66786 |
68130 |
61.9 |
1023 |
511.7 |
36340 |
255.9 |
255.9 |
63.96 |
|
Intel i7-7700K |
38498 |
40448 |
52.7 |
575.7 |
287.9 |
20519 |
258 |
258 |
35.98 |
|
Intel i7-5960X |
66108 |
49545 |
62.8 |
895.5 |
447.7 |
31783 |
223.9 |
223.9 |
55.97 |
|
AMD Ryzen R7 1800X |
44031 |
43425 |
81.8 |
472.4 |
236.2 |
64016 |
118.1 |
118.1 |
59.03 |
|
AMD Ryzen R7 1700X |
44493 |
43749 |
78.3 |
446.8 |
223.4 |
61730 |
111.7 |
111.7 |
55.84 |
|
AMD Ryzen R7 1700 |
45343 |
43777 |
82.6 |
408.5 |
204.3 |
56811 |
102.1 |
102.1 |
51.05 |
|
AMD Ryzen R5 1600X |
44452 |
43918 |
83.7 |
354.9 |
177.5 |
49340 |
88.74 |
88.73 |
44.34 |
|
AMD Ryzen R5 1500X |
44289 |
43746 |
83.1 |
229.8 |
114.8 |
31983 |
57.43 |
57.45 |
28.72 |
|
AMD Ryzen R5 2600 |
50385 |
48499 |
66.5 |
351 |
175.4 |
48939 |
88.03 |
88.02 |
44.01 |
|
AMD Ryzen R7 2700 |
50088 |
48343 |
65.9 |
434.3 |
217.2 |
60336 |
108.6 |
108.6 |
54.68 |
|
Intel i7-8086K |
39069 |
40675 |
56.2 |
824.9 |
412.5 |
29397 |
369.9 |
369.9 |
51.55 |
|
Intel i9-9900K |
39682 |
41015 |
51.1 |
1226 |
613 |
45542 |
550 |
549.8 |
79.79 |
|
AMD Ryzen 9 3900X |
53981 |
52271 |
70.7 |
1546 |
772.1 |
106943 |
385.7 |
385.7 |
96.57 |
|
AMD Ryzen 7 3700X |
51498 |
28739 |
67.3 |
1078 |
537.8 |
74474 |
271 |
271.2 |
67.77 |
|
AMD Ryzen 5 3600X |
50769 |
28736 |
68.9 |
799.5 |
400 |
55456 |
198.6 |
198.6 |
49.64 |
|
AMD Ryzen 3 3400G |
49936 |
53502 |
67.1 |
257.2 |
128.5 |
35736 |
64.16 |
64.16 |
32.25 |
|
AMD Ryzen 3 3300X |
51435 |
28743 |
66.4 |
551.6 |
276.1 |
38176 |
138.7 |
138.7 |
34.65 |
|
AMD Ryzen 3 3100 |
50246 |
28734 |
71.1 |
497.6 |
248.7 |
34946 |
124.4 |
124.4 |
31.09 |
|
Intel i5-10600K |
43340 |
43430 |
48.2 |
863.8 |
431.9 |
30782 |
387.2 |
386.9 |
53.99 |
|
Intel i9-10900K |
44972 |
43808 |
50.5 |
1632 |
815.7 |
58163 |
731.3 |
731.2 |
102 |
|
AMD Ryzen 5 5600X |
50972 |
28772 |
59.2 |
891.9 |
445.8 |
61623 |
709.6 |
709.7 |
55.72 |
|
Intel i9-11900K |
44919 |
43343 |
51.8 |
1068 |
534.2 |
164966 |
547 |
547 |
182.7 |
|
Intel i5-11600K |
43953 |
43468 |
55.6 |
838.7 |
419.4 |
123767 |
429.3 |
429.3 |
143.4 |
|
Intel i9-12900K |
71418 |
72395 |
82 |
695.7 |
247.9 |
140499 |
400.6 |
400.6 |
166.2 |
|
Intel i5-12600K |
65416 |
71336 |
87.8 |
432.5 |
216.2 |
86470 |
252.7 |
252.7 |
96.22 |
|
AMD Ryzen 5 4500 |
52683 |
53191 |
82.8 |
806 |
402.6 |
56578 |
201.5 |
201.3 |
50.35 |
|
AMD Ryzen 5 5600 |
48444 |
28753 |
70.9 |
853.2 |
426.2 |
107839 |
675.8 |
679.6 |
53.38 |
|
AMD Ryzen 7 5700X |
47858 |
28760 |
68.2 |
1158 |
577.9 |
137459 |
919.1 |
912.9 |
74.38 |
|
AMD Ryzen 7 7700X |
58755 |
80120 |
70 |
1392 |
694.6 |
192730 |
1205 |
1205 |
602.4 |
|
AMD Ryzen 5 7600X |
54720 |
80771 |
69.5 |
1046 |
523.1 |
147661 |
912.5 |
912.5 |
456.4 |
|
AMD Ryzen 9 7950X |
67342 |
76712 |
69 |
2735 |
1364 |
379510 |
2370 |
2370 |
1184 |
|
AMD Ryzen 9 7900X |
68064 |
78123 |
67.7 |
2062 |
1029 |
288134 |
1792 |
1789 |
895.4 |
|
Intel i9-13900K |
76006 |
68902 |
86.1 |
2238 |
1116 |
157028 |
831.4 |
831.4 |
270.6 |
|
Intel i5-13600K |
64721 |
62311 |
97.2 |
1294 |
647 |
86637 |
509.5 |
509.4 |
136.4 |
|
AMD Ryzen 9 7900 |
73968 |
73494 |
69.4 |
2007 |
998.7 |
267499 |
1710 |
1709 |
855.9 |
|
AMD Ryzen 7 7700 |
58694 |
79929 |
68.9 |
1369 |
684.7 |
185084 |
1192 |
1192 |
594.3 |
|
AMD Ryzen 5 7600 |
59454 |
81467 |
69.6 |
988.6 |
494.3 |
140625 |
861.9 |
861.2 |
431.2 |
Onboard Video Performance
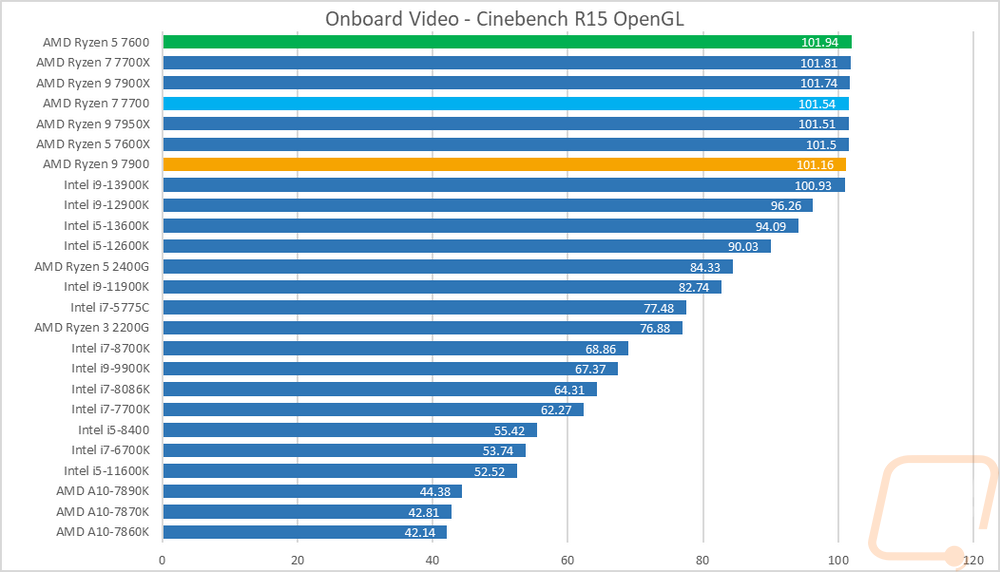
Onboard performance isn’t something that you think about when it comes to high-end CPUs because I think the expectation is that you will be adding a dedicated GPU but there are situations where a dedicated GPU isn’t needed or you may need to run the integrated graphics while waiting on your video card to come in or be replaced. So I do still want to check out the performance of all three of the non-X CPUs when it comes to integrated GPU performance. For that, I have run a few basic tests with a mix of older and newer games and benchmarks. Integrated GPUs aren’t anywhere near the performance of even the lowest-end GPUs but it is still interesting to see what they can do. To start that I went with the older Cinebench R15 which has an OpenGL benchmark showing basic rendering performance. With all of the 7000 Series CPUs having the same integrated GPU the results weren’t a surprise at all with all of the CPUs right at the 101 FPS result with just small variations.
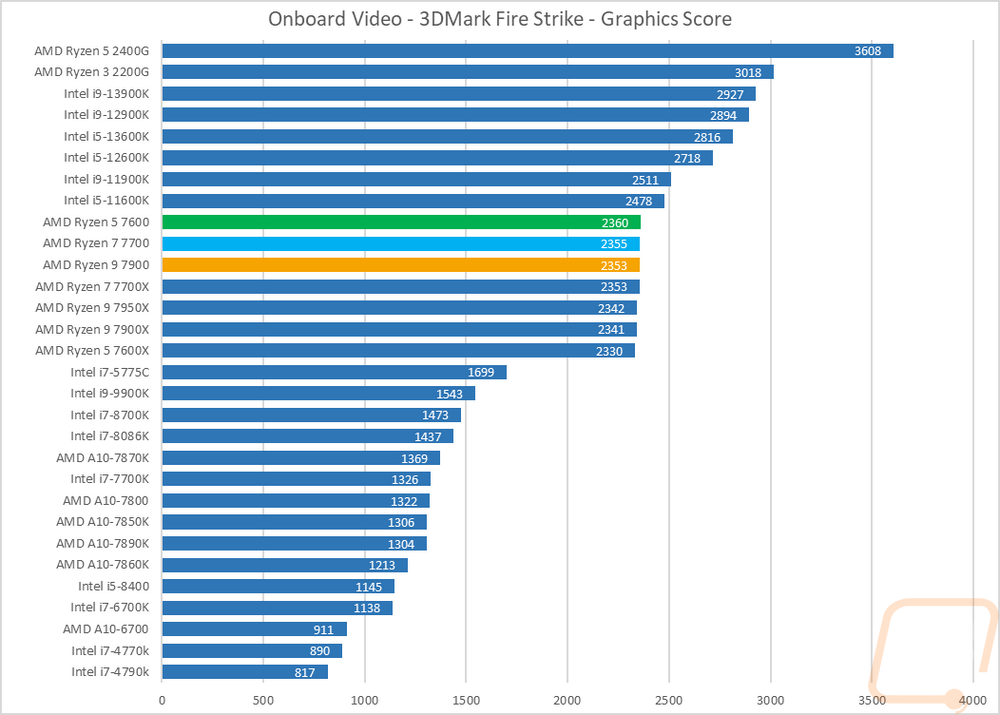
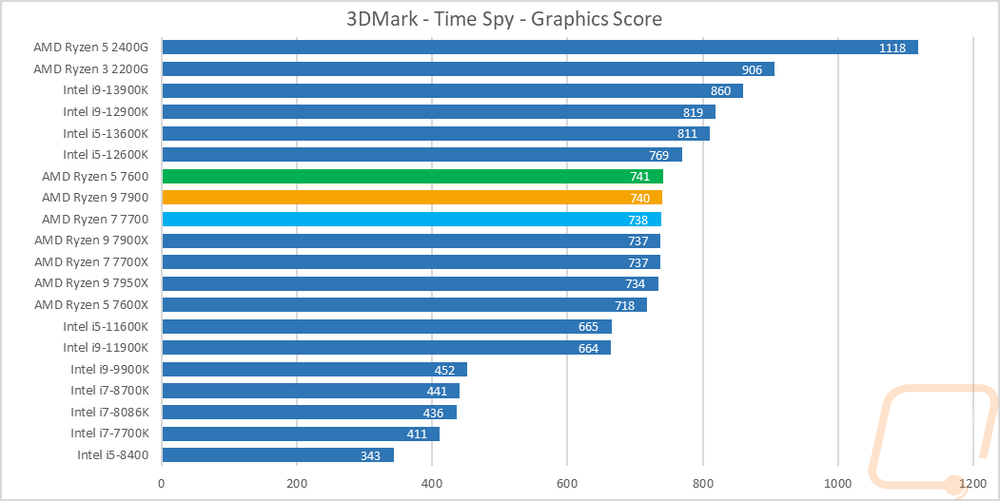
Next, I defaulted to the always consistent 3DMark with both the older Fire Strike benchmark and the newer Time Spy which is DX12. I only used the graphics score, not the total score to take the CPU performance out of the equation as much as possible. In both tests, we see the same thing once again with all 7 of the CPUs all together with their results. The three non-X CPUs were all on top which may be an indication of a driver improvement or the lower power helping but it is such a small difference that it isn’t a big deal at all.
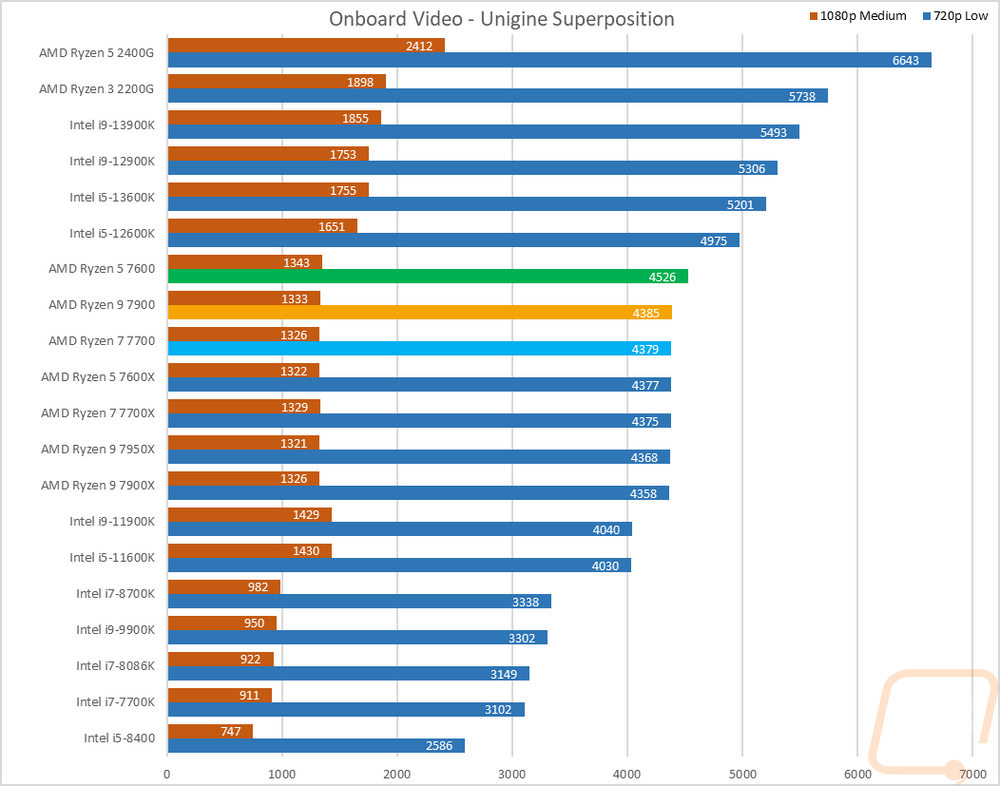
In Unigine Superposition I ran the 1080p medium detail and 720p low detail tests and the results here weren’t much different than the previous tests. All three CPUs had the same score on the 1080p medium result and the 720p low would have been the same if not for the one higher score from the 7600.
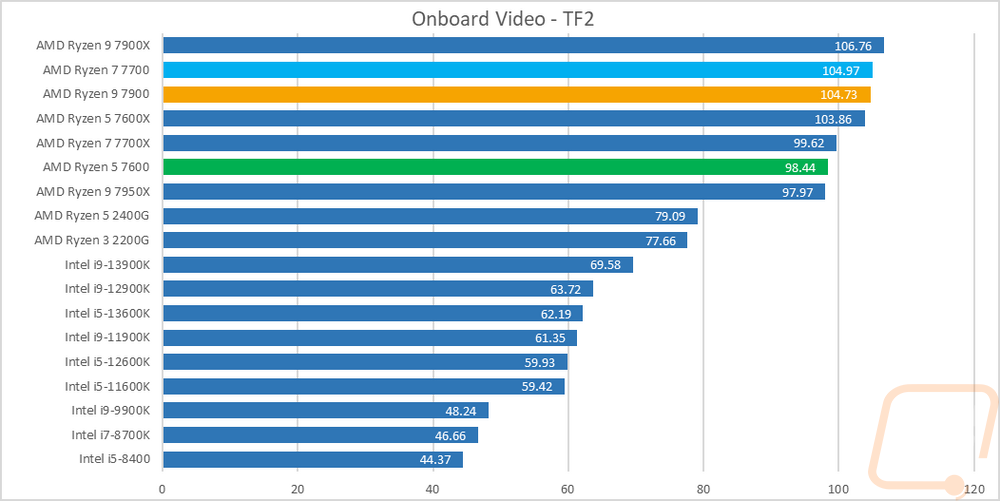
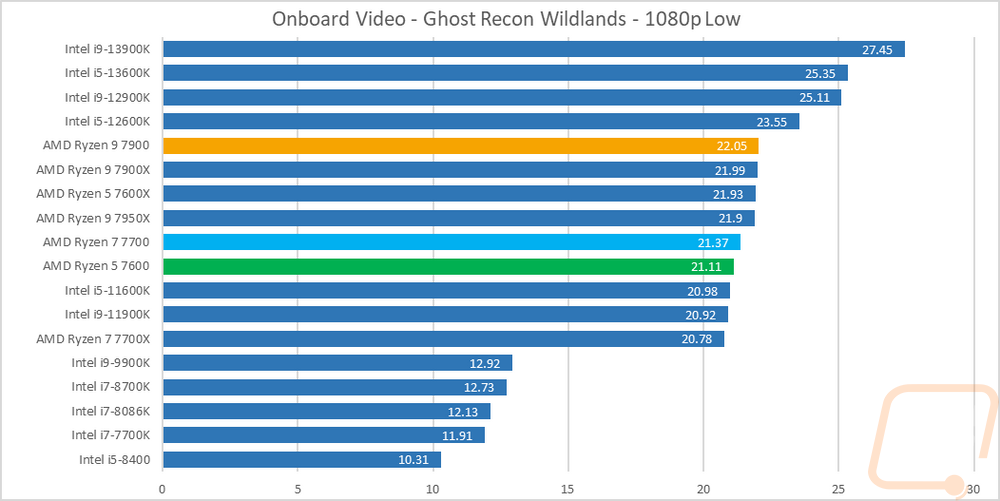
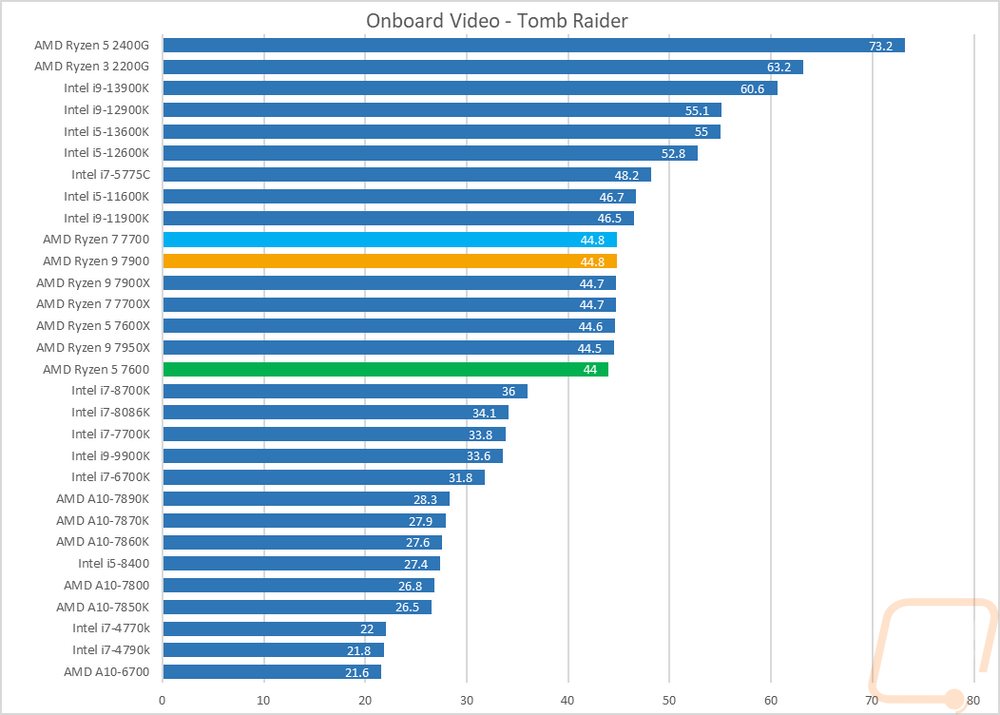
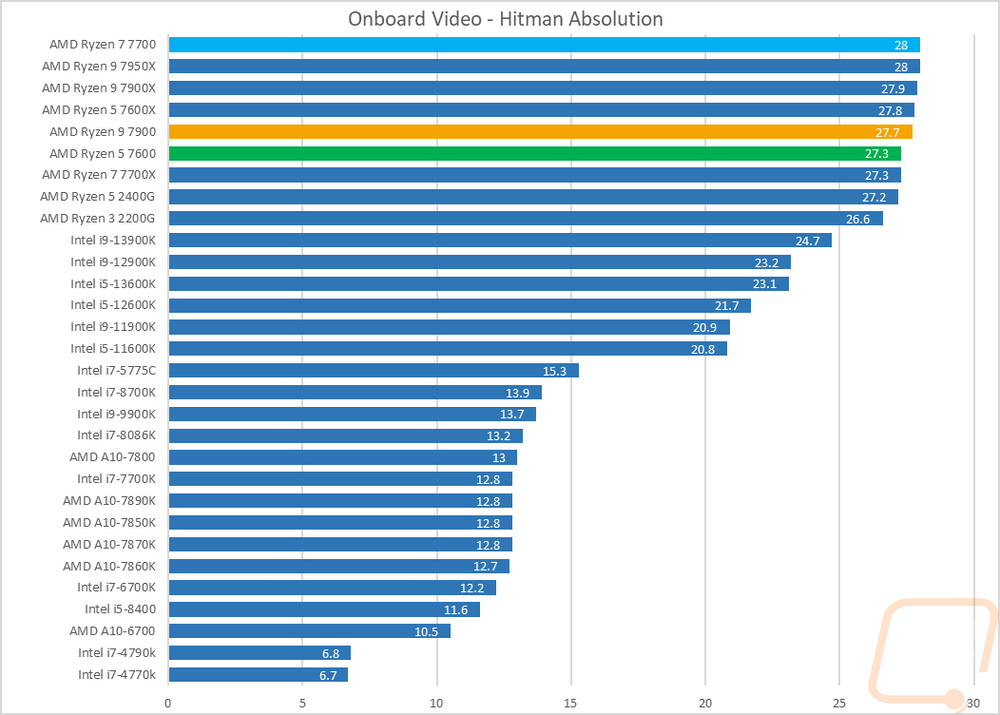
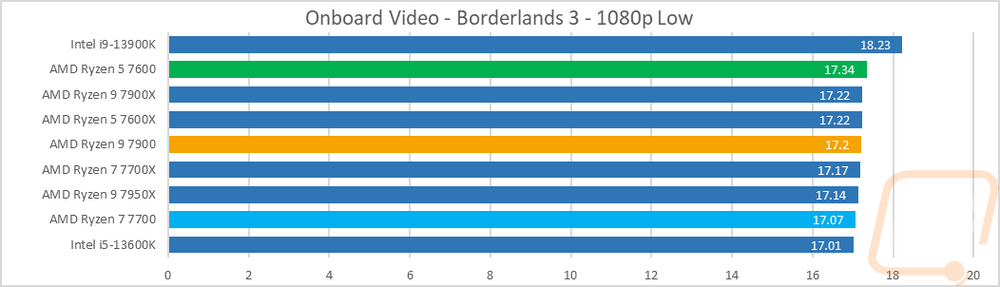
Then from there on, I jumped into game tests. Some of our tests are older games but I did also add in a few newer games as well to get an idea of newer games when tested at 1080p and low or medium settings. Like with the other onboard tests some of the results like both Tomb Raiders, Far Cry 5, and Borderlands the difference between any of the CPUs was minimal. But with a few like TF2, you can see the performance difference, but that was completely from the CPUs themselves, not the GPU. More importantly, what we can see is that none of the onboard GPUs tested can handle some of the modern games even at their lowest settings at 1080p. But they are capable of rendering video in Cinebench and can handle older games without any problems.
Power Usage and Temperatures
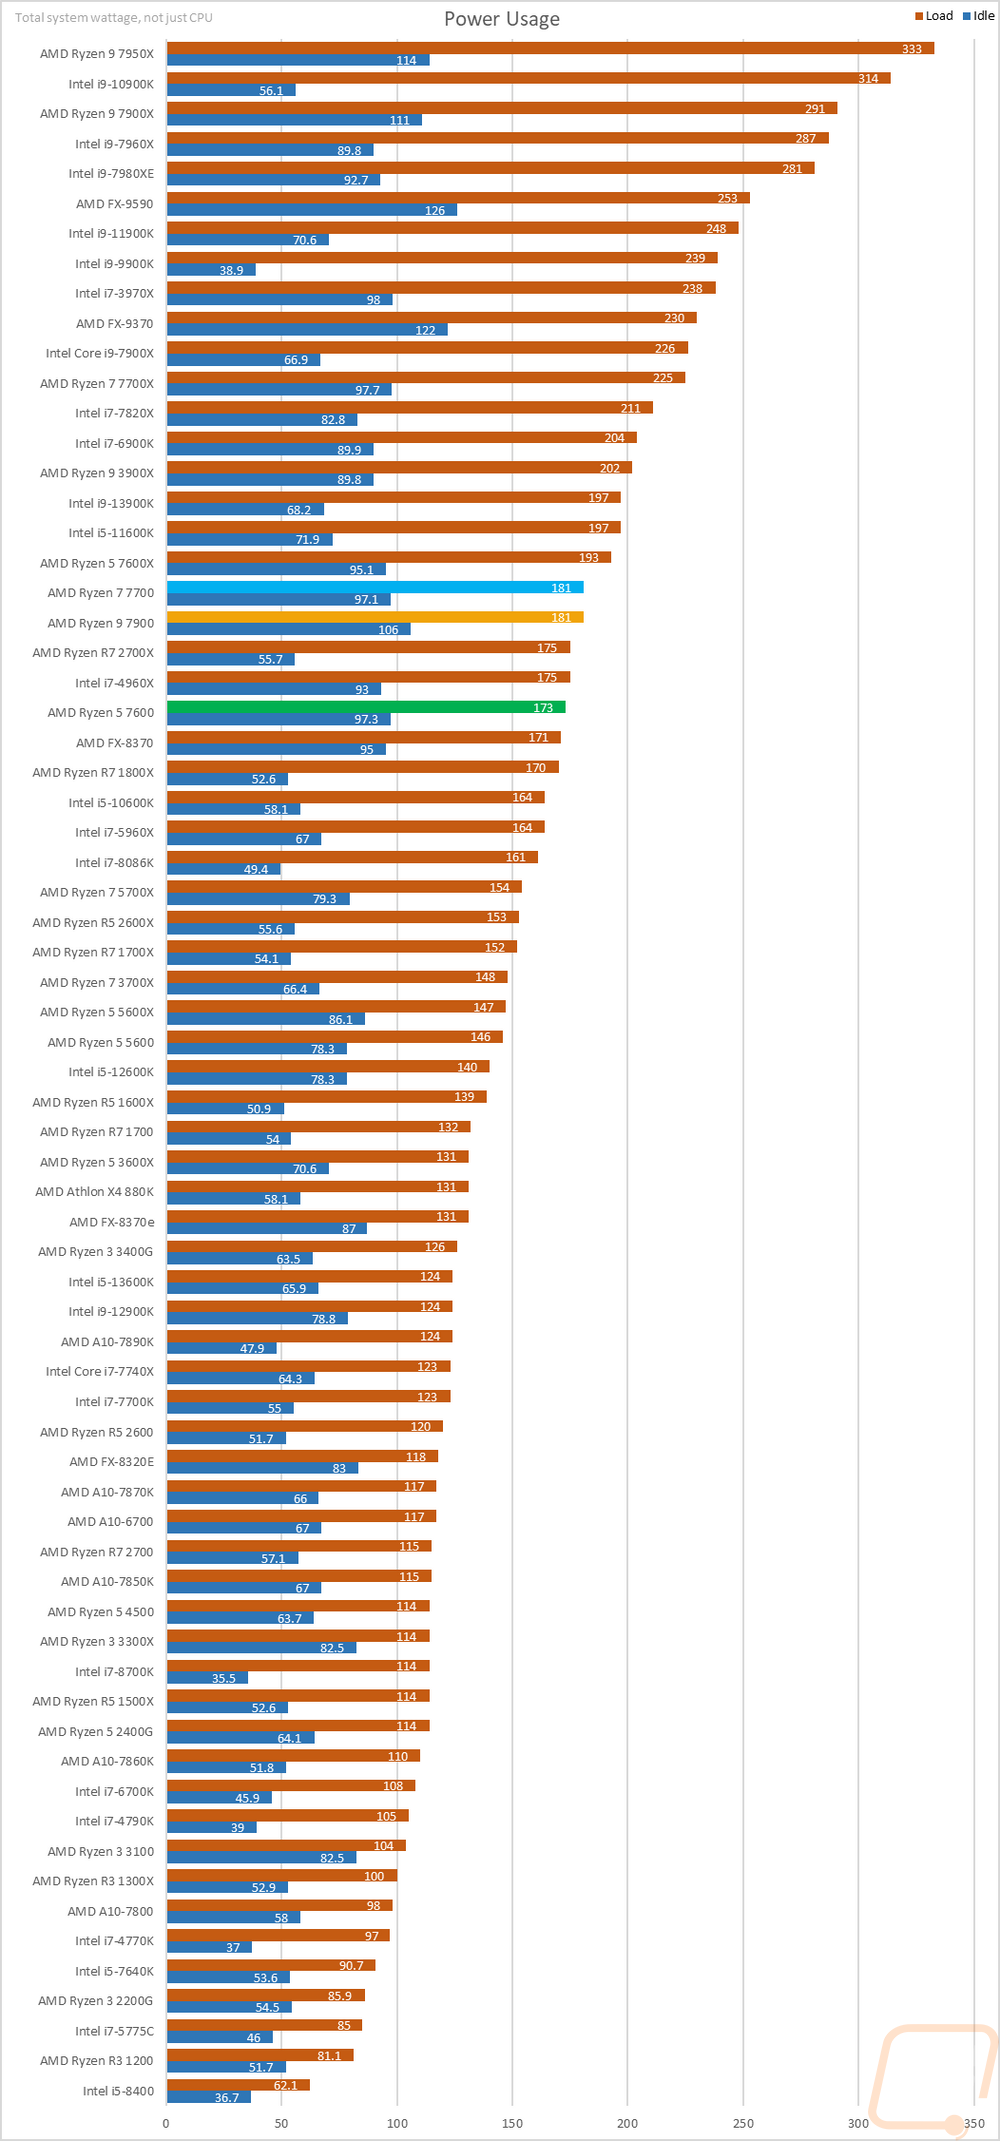
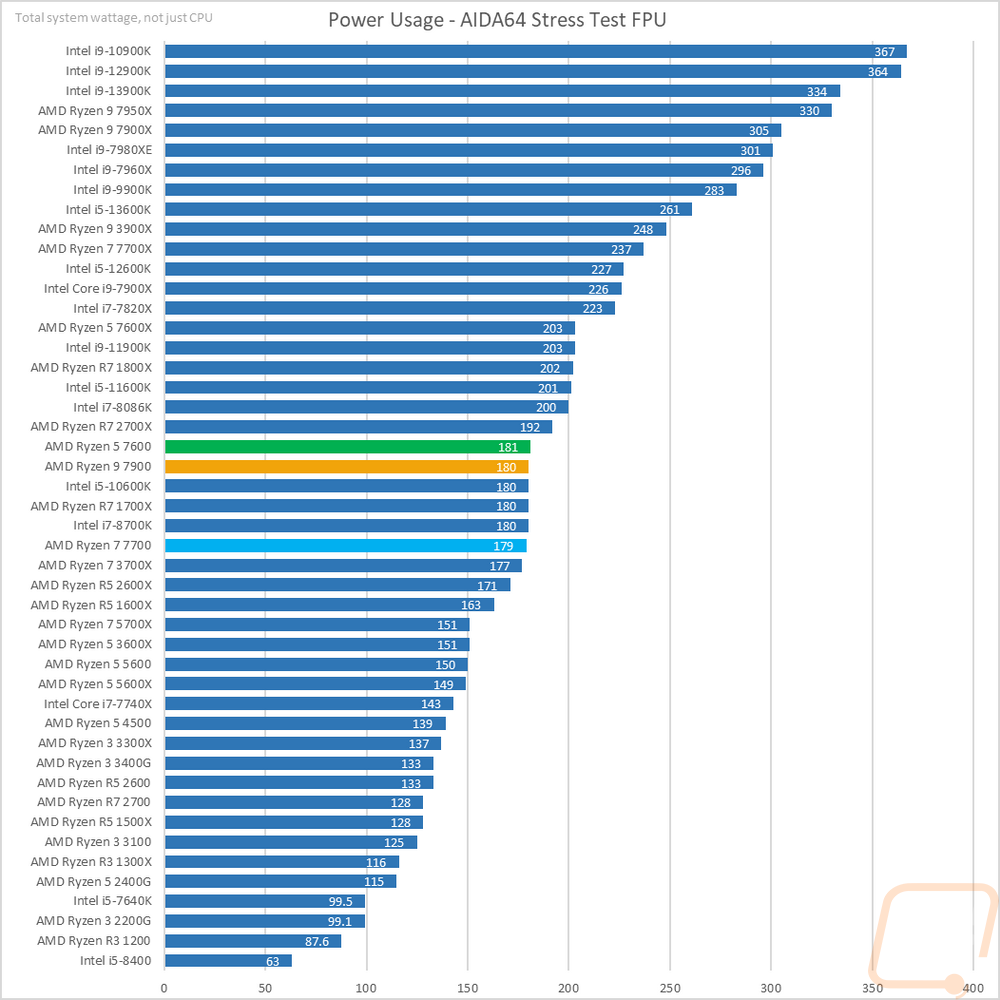
For some people, performance is the only thing important, but for others, power usage and temperatures also play a role so we do take a look at both of those as well. This is especially important in SFF or even just smaller mid-sized builds and it affects the components you need to get for your system as well as your PSU and cooler. To take a look at power usage I ran three different tests. I noted the idle power draw of our entire system then I took a look at the load wattage of the system using two different workloads. One was wPrime and the second was AIDA64 using their FPU workload which is extremely demanding. At idle the testbench with the system with the three non-X CPUs in it does still have the high wattage at idle that we saw with the other 7000 Series CPUs with the 7700 sitting at 97.1 watts, the 7600 at 97.3, and the 7900 at 106 watts. But with the wPrime test, all three have significantly lower under load numbers. The 7700 and 7900 were both at 181 watts and the 7600 was a little lower at 173 watts. For comparison the 7600X pulled 193 watts in the same test, the 7700X was at 225, and the 7900X was at 226. The second graph which has the AIDA64 FPU workload does a better job of showing the clear difference with all the non-X in the 179-181 watt range. Then the 7600X is at 203, the 7700X is at 237, and the 7900X is even higher at 305 watts. All three show a huge drop in power usage but look at the gap between the 7900 and the 7900X!
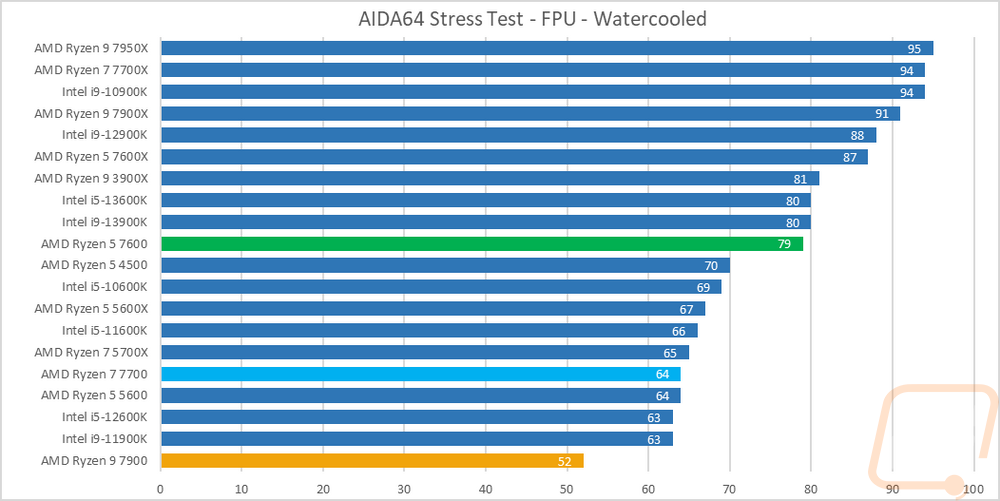
The reason the non-X CPUs were exciting was because of their 65-watt TDP but while the lower power usage is nice the real reason that was important is because of the temperatures that the original 7000 Series CPUs were running at. AMD designed all of them to run at 95c at all times and .that they did. The 7700X ran at 94c in our thermal test, the 7900X was at 91C, and the 7600X was the lowest at 87c which was still hot. The 65 watts CPUs change that up significantly though and you might be surprised at the order in which they are in our graph. The Ryzen 9 7900 is the lowest of the three in our test running at 52c while under load. The 7700 ran warmer at 64c which was 30c lower than the 7700X, then the 7600 was the hottest at 79c. While they do seem to run hotter the fewer cores they have, I have to wonder if our 7600 has a worse connection with its heatspreader given how much warmer it was running but I did test this multiple times to confirm it wasn’t a thermal paste issue.
Overall and Final Verdict
With all of our initial coverage of the AMD Ryzen 7000 Series CPUs just about all of them had the same cons and with the new non-X models and with the launch of the other chipsets AMD has seemingly addressed each and every issue. All of the 7000 Series X CPUs were extremely impressive in their performance but their downsides came with the power usage both at idle and under load. The Ryzen 9 7900, Ryzen 7 7700, and the Ryzen 5 7600 all have addressed the load power with their lower TDP of 65 watts and that change shows all across the board in our testing. Sadly this hasn’t changed the higher idle power usage that I have been seeing but I do still have hope that can be addressed later with firmware and BIOS updates. But the new power draw turns each of the CPUs into surprisingly efficient CPUs as their performance while it did drop didn’t drop anywhere near as much as the wattage did. In fact, when it comes to performance all three CPUs seemed to stay in the 5-7% range in performance drop but in heavy multi-threaded workloads the 7900 did see more than that. While it felt like in all of the tests I could only talk about the performance dropping, if not for the X editions each’s numbers would be impressive. The 7900 for example was trading blows with Intel’s flagship from last year, the 12900K while having a 60-watt lower TDP. All three still have great single-core performance which translated to great performance in game. I was still surprised that all three struggled more than I would have thought in our real-world Microsoft Office testing but had no issues at all with the real-world Photoshop tests.
The biggest change of course was in the thermal numbers we saw when running a standard 240mm radiator. The lower TDP helped keep things under control and finally brings temperatures down into a range that smaller cooling options are now a possibility. Air cooling can work on all three of the CPUs and you also don’t have to worry about the consistently high temperatures warming up your entire system and causing other components to run hot. For me these finally make small form factor builds possible and make me really want to get my hands on AM5 ITX motherboards to give that a try. Speaking of motherboards, one of my initial problems with the AM5 launch was the overall cost of switching with the only motherboard options available being extremely high-end and expensive and DDR5 being the only option that was expensive too. DDR5 prices are coming down slowly and between that launch and now AMD has released their B650 and B650E chipsets which means we now have cheaper options.
The cheaper motherboard and DDR5 options go well with the lower pricing that AMD gave the three non-X CPUs as well. They also made them easy to remember for pricing. The Ryzen 9 7900 is the highest of course at $429, then the Ryzen 7 7700 is $329, and lastly the Ryzen 5 7600 is $229. You might see the trend, each one ends in 29 and they go up $100 for each model. This makes the 7900 $120 less than the 7900X which is huge. The 7600 and 7700 are both $70 less than their higher TDP brothers. Now Intel’s launch which happened between the initial launch and now does play a role in everything as well, specifically with the 13900K and both the 7900 and the 7700 because the 13900K is priced at $319 and it performed ahead of both in a lot of tests. But we then do have to come back to the power draw and heat. If those aren’t a concern I doubt you are looking at the non-X models and the 13900K starts to look like a good deal. But if you are looking to build something SFF or just don’t want to spend a fortune on cooling AMD has given a few good options depending on what you are looking to build. The 7600 is looking especially interesting given its gaming performance and because you can keep costs down with cooling, power, and motherboard it looks like it is going to be the new budget sweet spot for me. If I need an SFF system but need multi-threaded performance then the 7900 is the way to go!


Live Pricing: HERE
Live Pricing: HERE
Live Pricing: HERE


