Synthetic Benchmarks
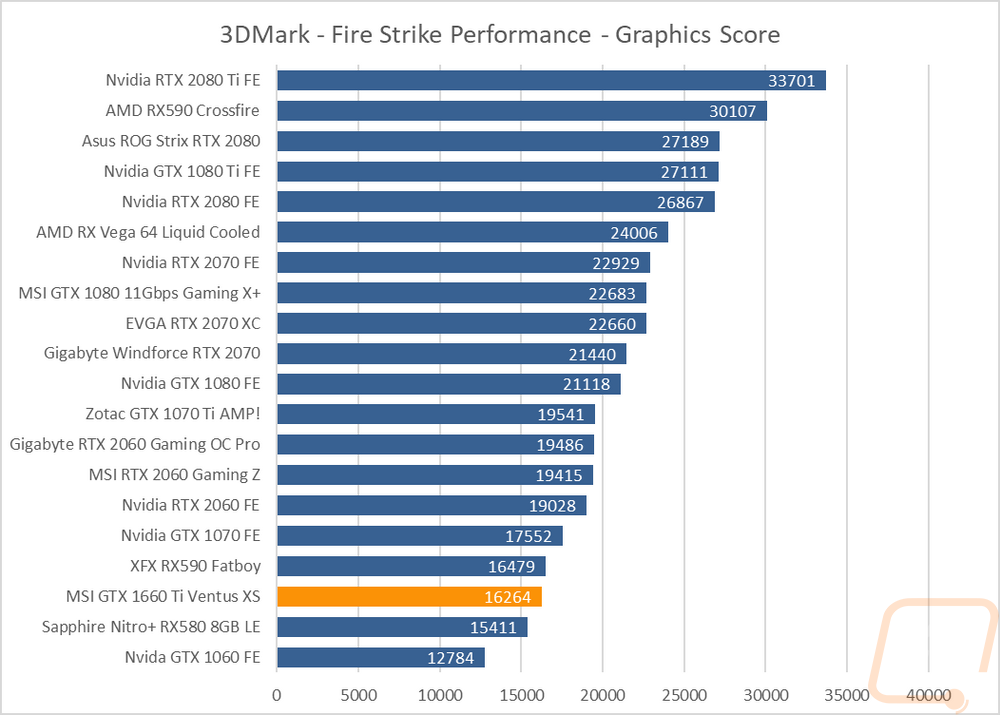
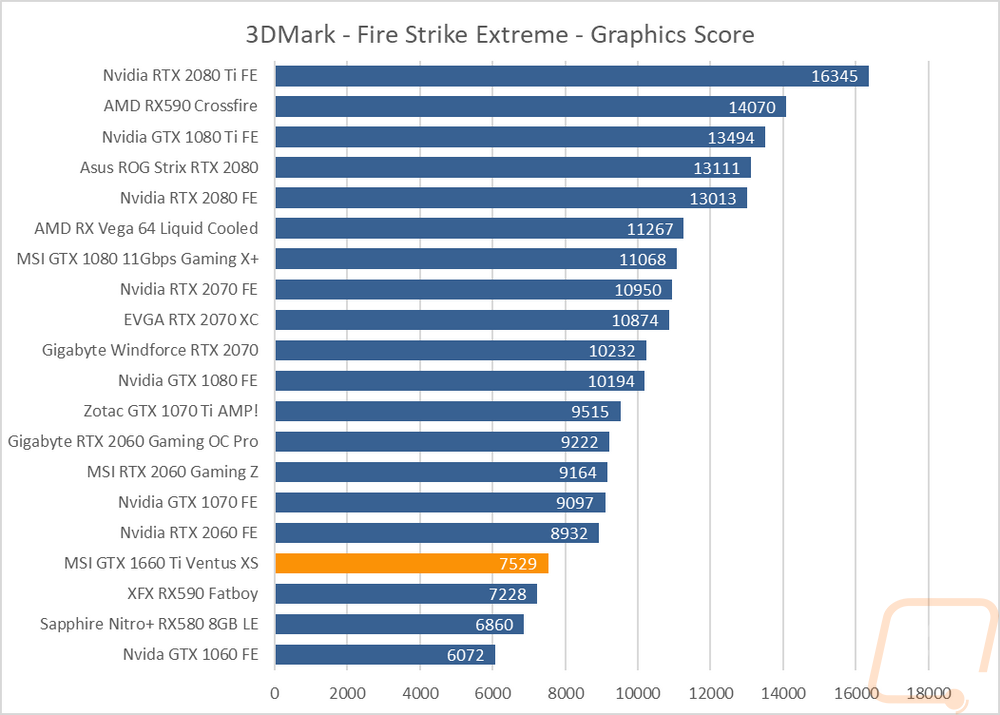
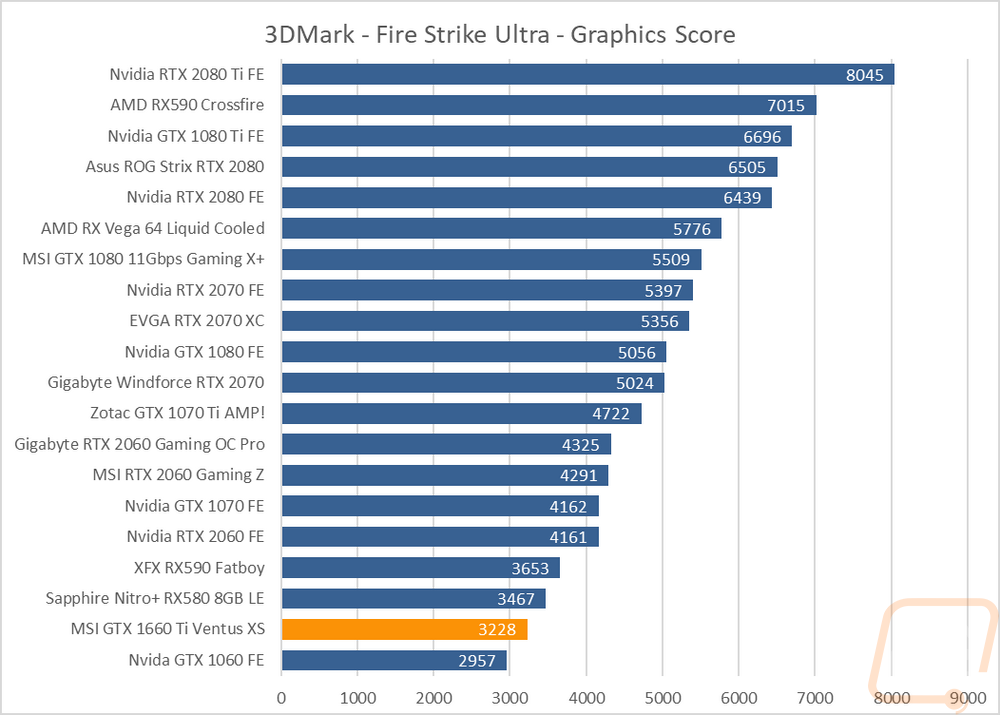
To start off testing, I like to run through a few different synthetic benchmarks. They give us a nice consistent way to compare from card to card and in this case, we can see where the GTX 1660 Ti fits into the market and also see how it compares with the GTX 1060 and the RTX 2060. I’m also very curious how the AMD RX590 compares as well. A lot of my testing is done in 3DMark and I started off with the three DX111 based Fire Strike benchmarks. Fire Strike can be run at three detail levels, performance, extreme, and ultra. At the performance detail setting the GTX 1660 Ti came in right in between the RX580 and the RX590 and WELL above the GTX 1060 that it is replacing. In Fire Strike Extreme the result was similar, the RX590 wasn’t far behind but the 7529 score was well above the original GTX 1060. The gap here between the RTX 2060 and the GTX 1660 Ti is a large one as well. In the Fire Strike Ultra test, both the AMD RX590 and RX580 pulled ahead of the GTX 1660 Ti at this detail level.
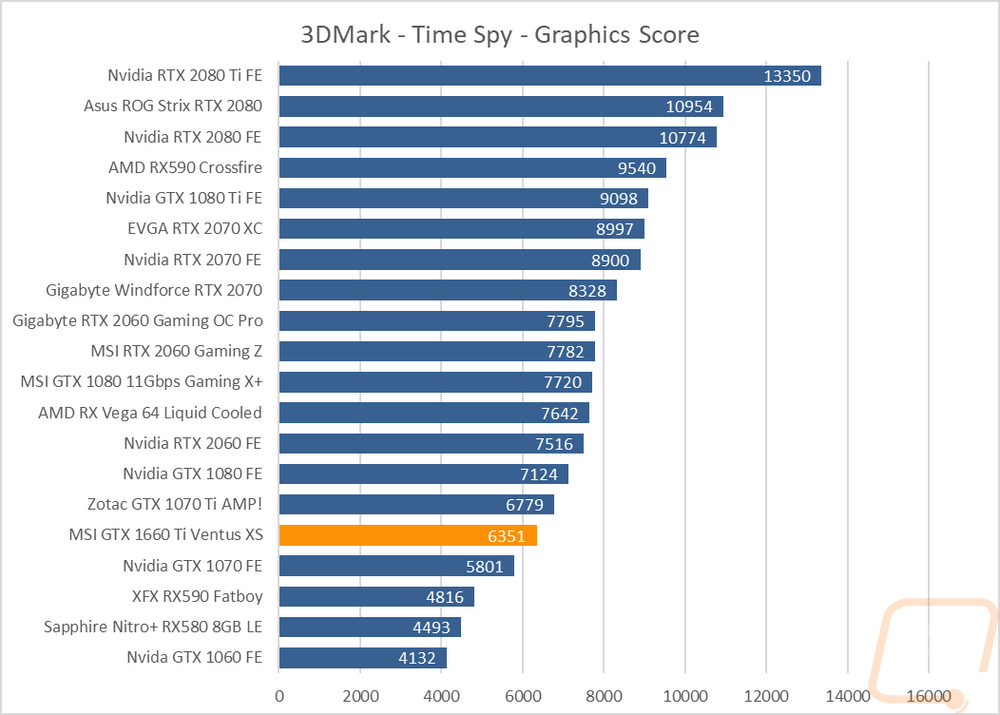
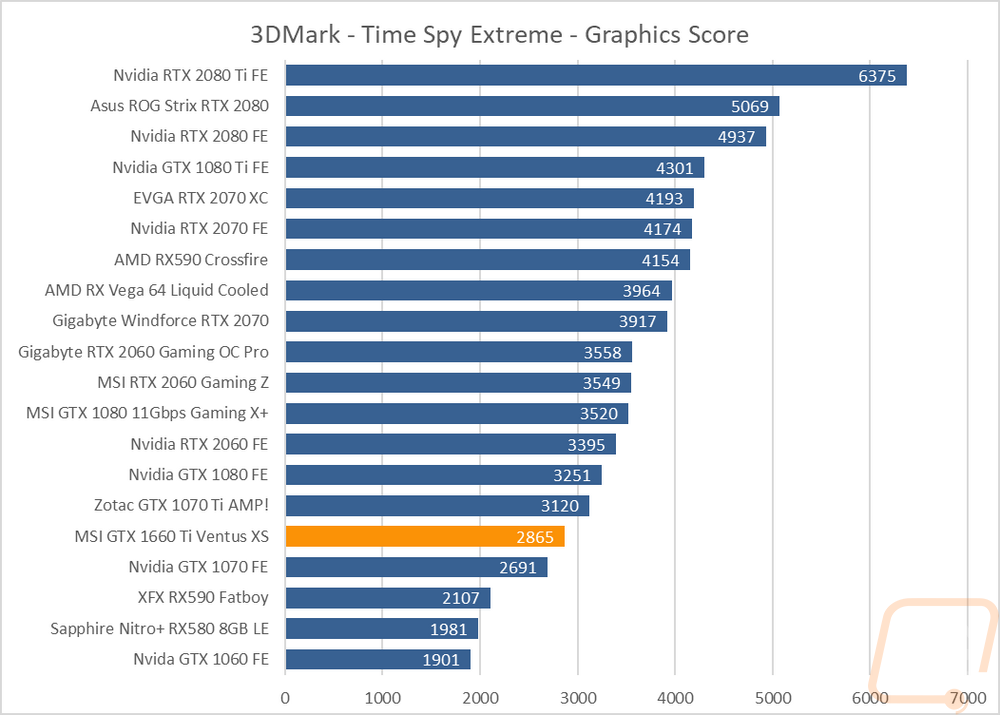
Now the Turing based RTX cards have favored the DX12 based Time Spy tests a lot more and the result is the same again here, even without the Tensor and RT cores. In the original Time Spy the GTX 1660 Ti ended up above the GTX 1070 and had a huge 53% increase over the GTX 1060. In the Time Spy Extreme test, the result was similar only with a 50% increase this time.
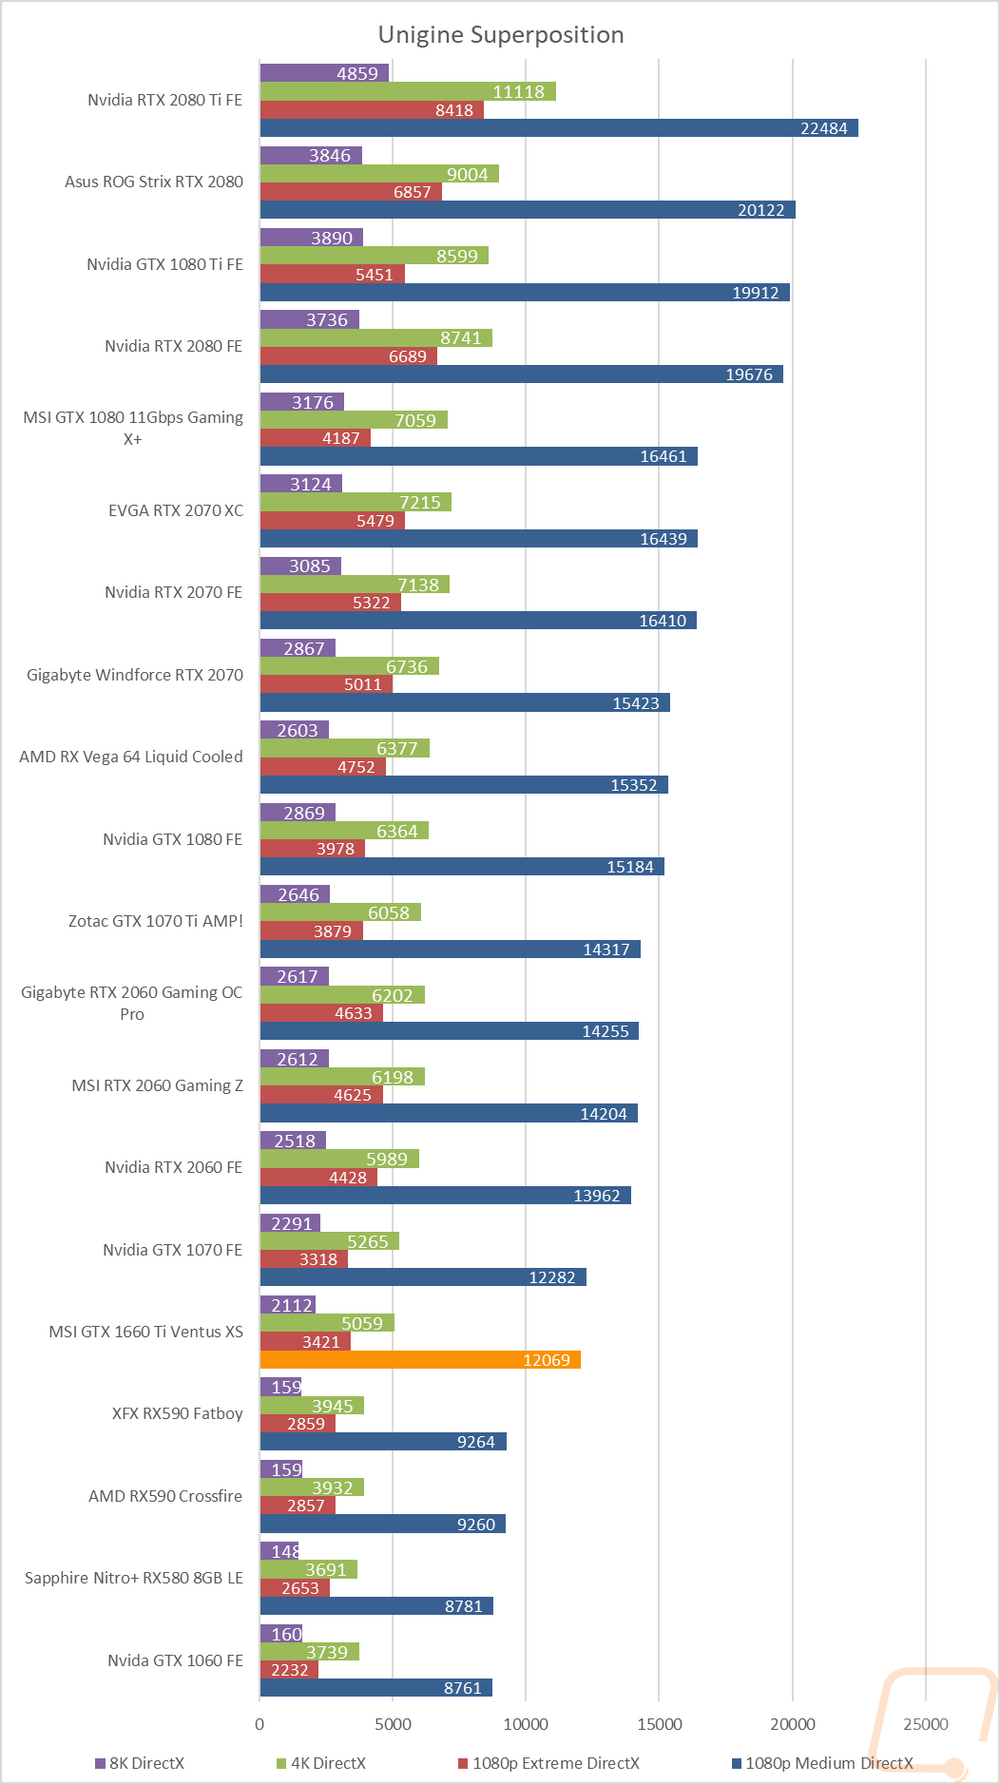
I didn’t only test with 3DMark based tests. I did also test using the Unigine based Superposition benchmark as well. Here I tested twice at 1080p with two wildly different detail levels. Then again at 4k and 8k to take a look at the ultra-high resolutions. In the 1080p Medium test the GTX 1660 Ti was battling with the GTX 1070 coming in just below it. The RX590 and RX580, as well as the GTX 1060, were down 2-3k points below. This was repeated across all of the other tests as well.