Cooling Noise and Power
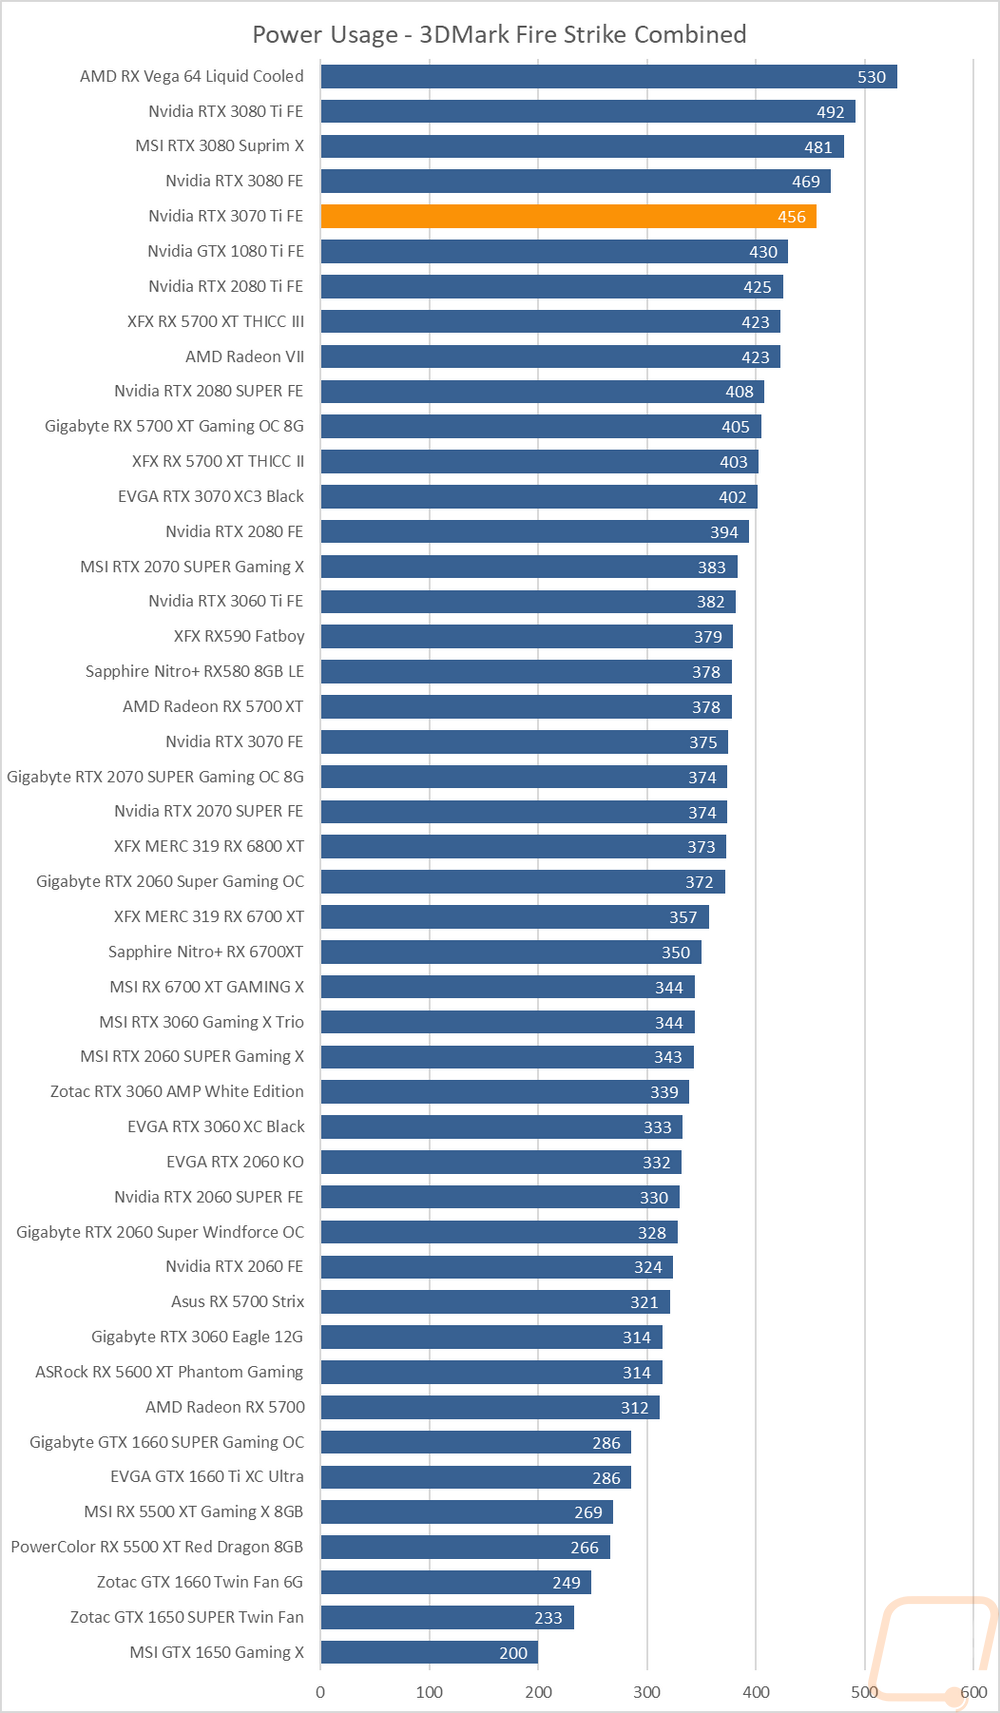
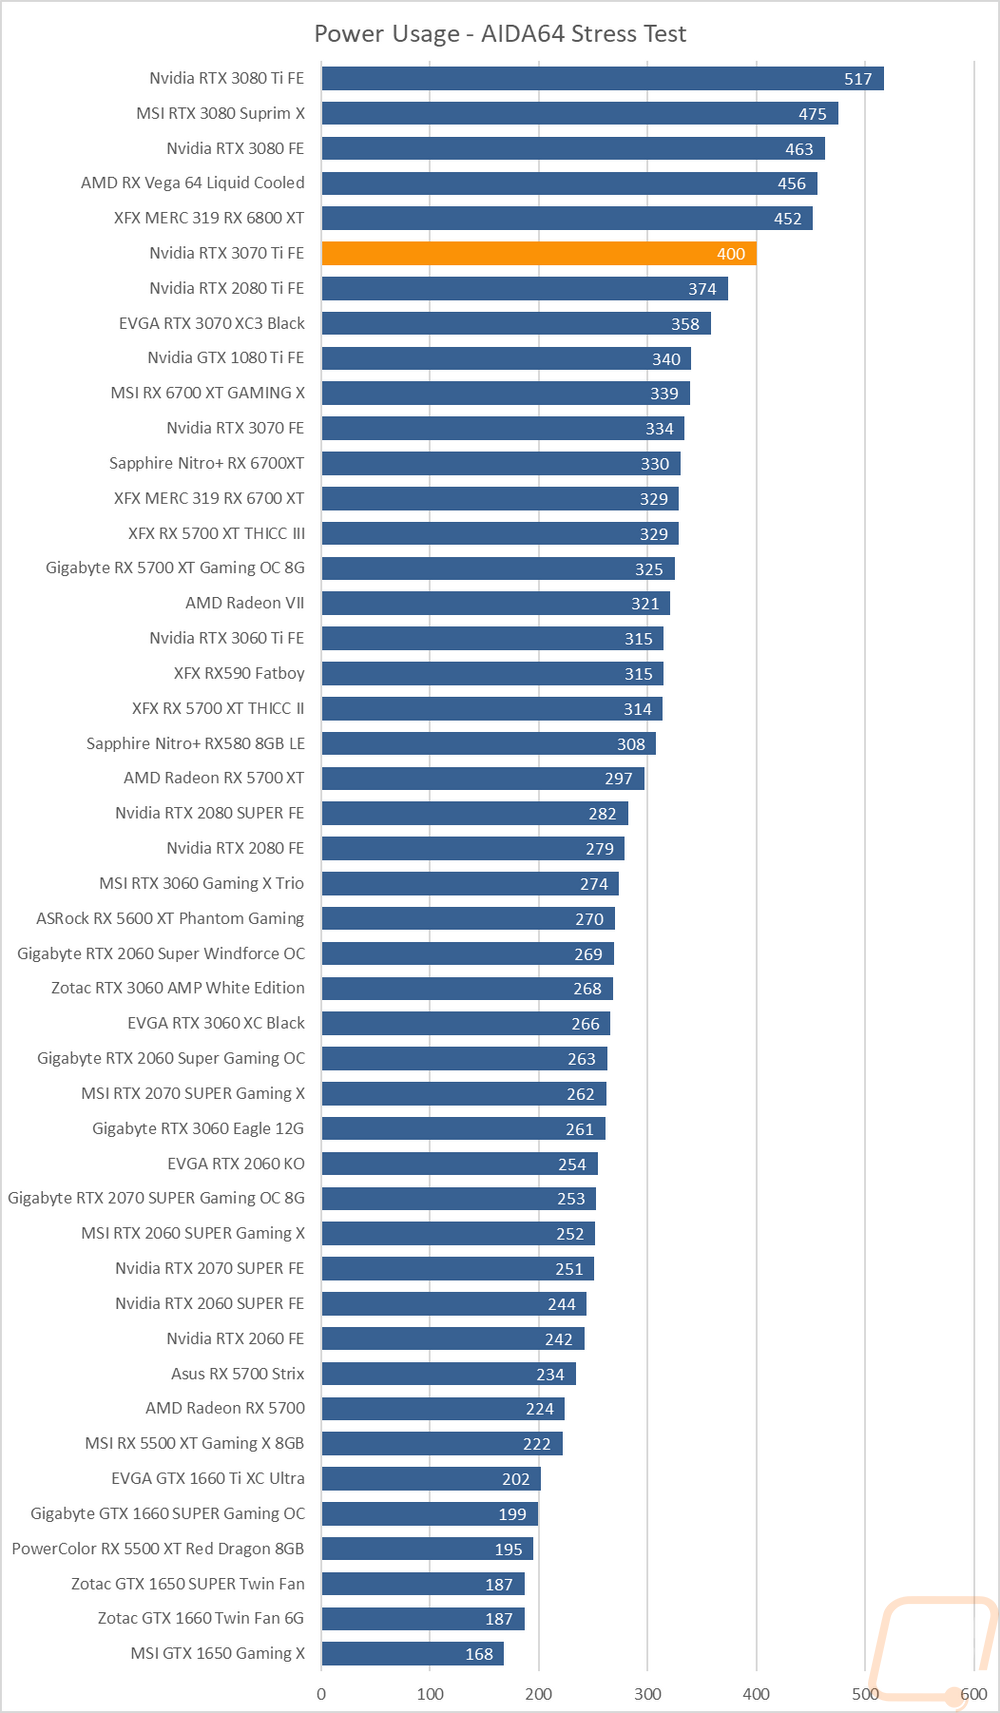
For my last few tests, rather than focusing on in game performance, I like to check out other aspects of performance. These are also the most important ways to differentiate the performance between cards that have the same GPU. To start things off I took a look at power usage. For this, I use our Kill-A-Watt hooked up to the test bench to record the total wattage of the system. I ran two tests with the first using 3DMark Fire Strike to put the system under a load similar to normal in game performance. Here our test system with the RTX 3070 Ti Founders Edition ended up pulling 456 watts which is high compared to the original RTX 3070 which pulled 375. At 456 the power draw was up near the RTX 3080 and even above the old GTX 1080 Ti. Switching over to AIDA64 for a GPU only workload dropped things down to 400 watts and for this, the RTX 3070 pulled 334, the RTX 3070 Ti Founders Edition pulling 66 watts more than the RTX 3070 is a bigger jump than the RTX 3070 Ti gets in overall performance.
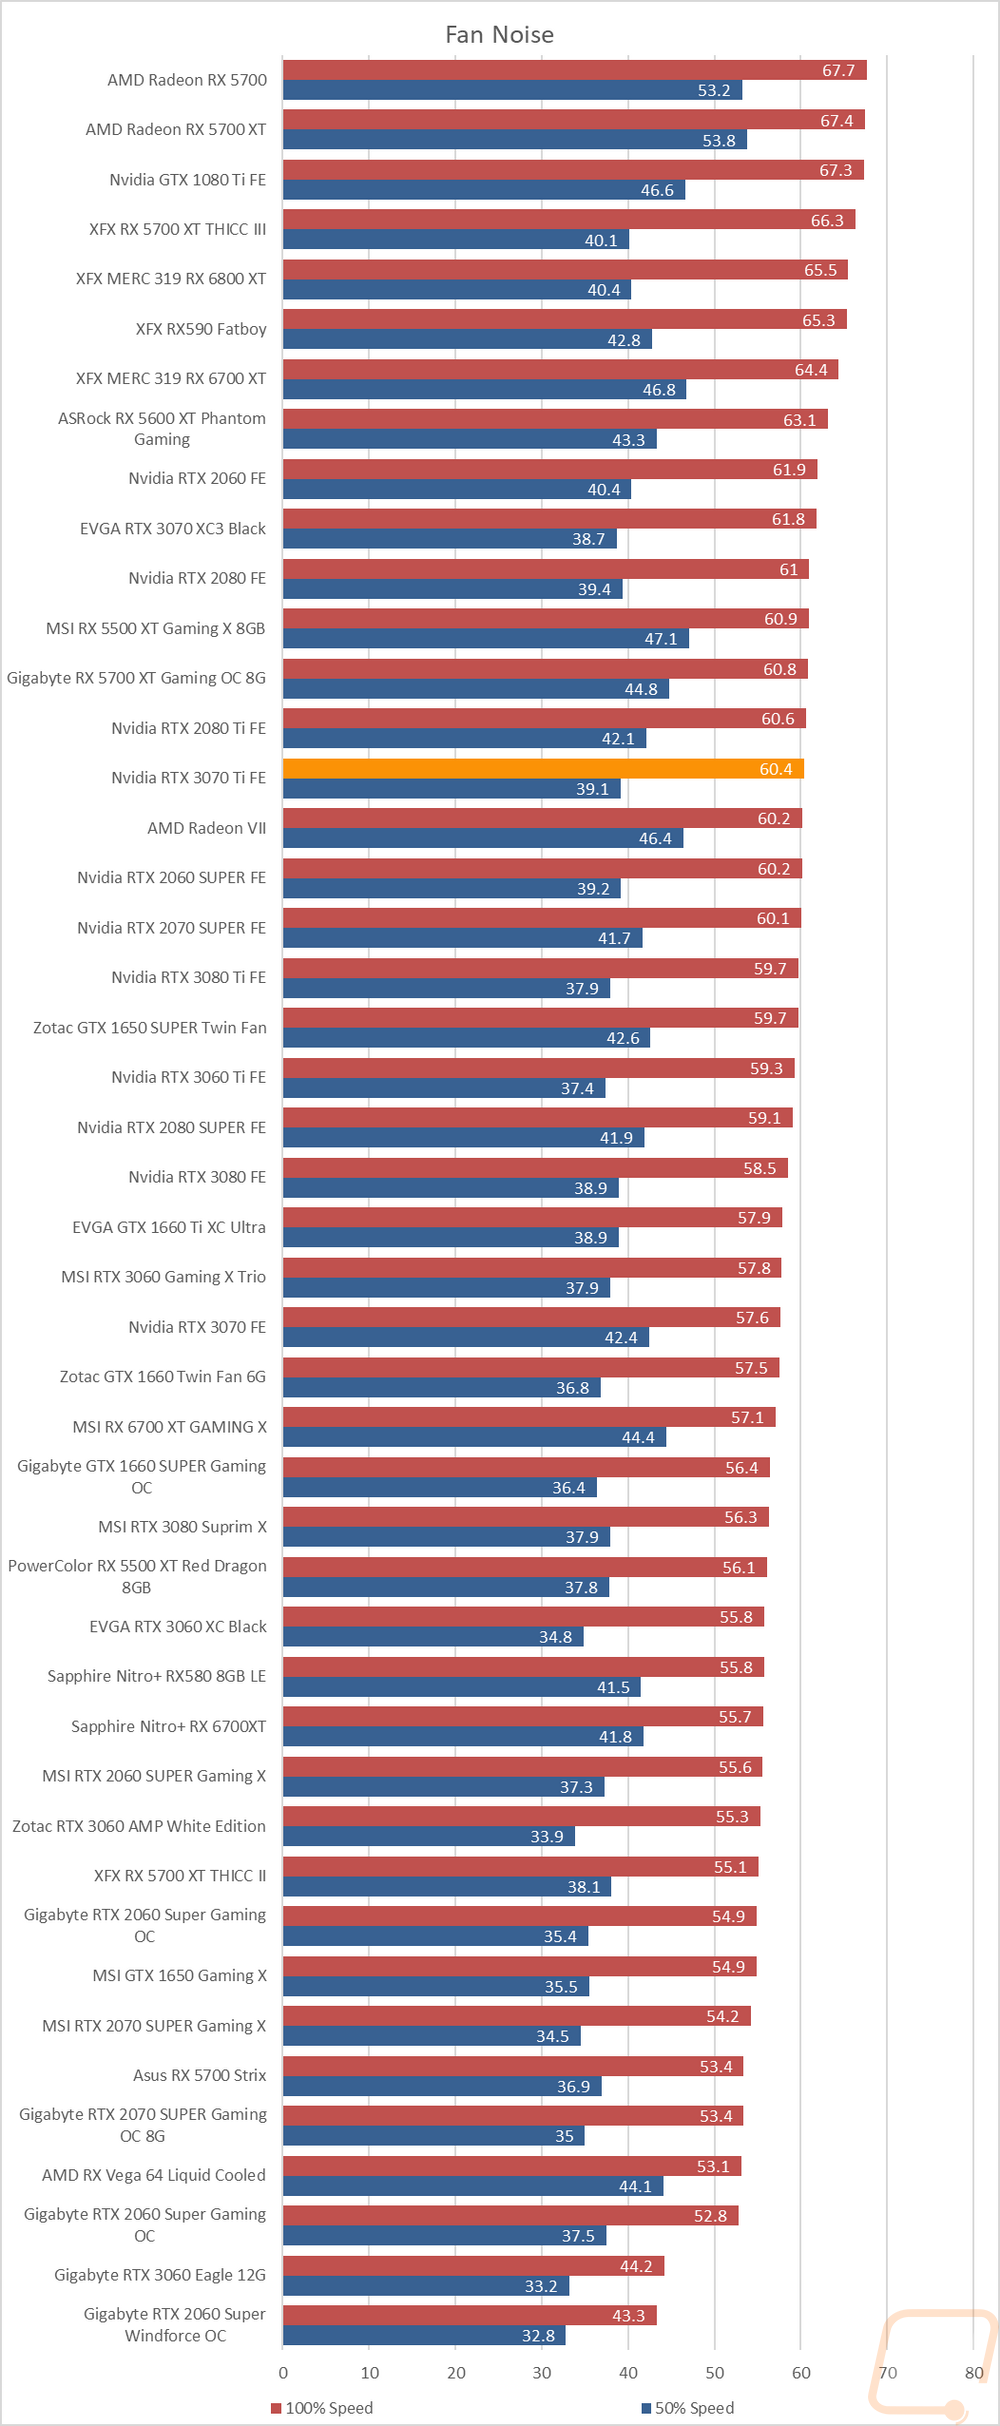
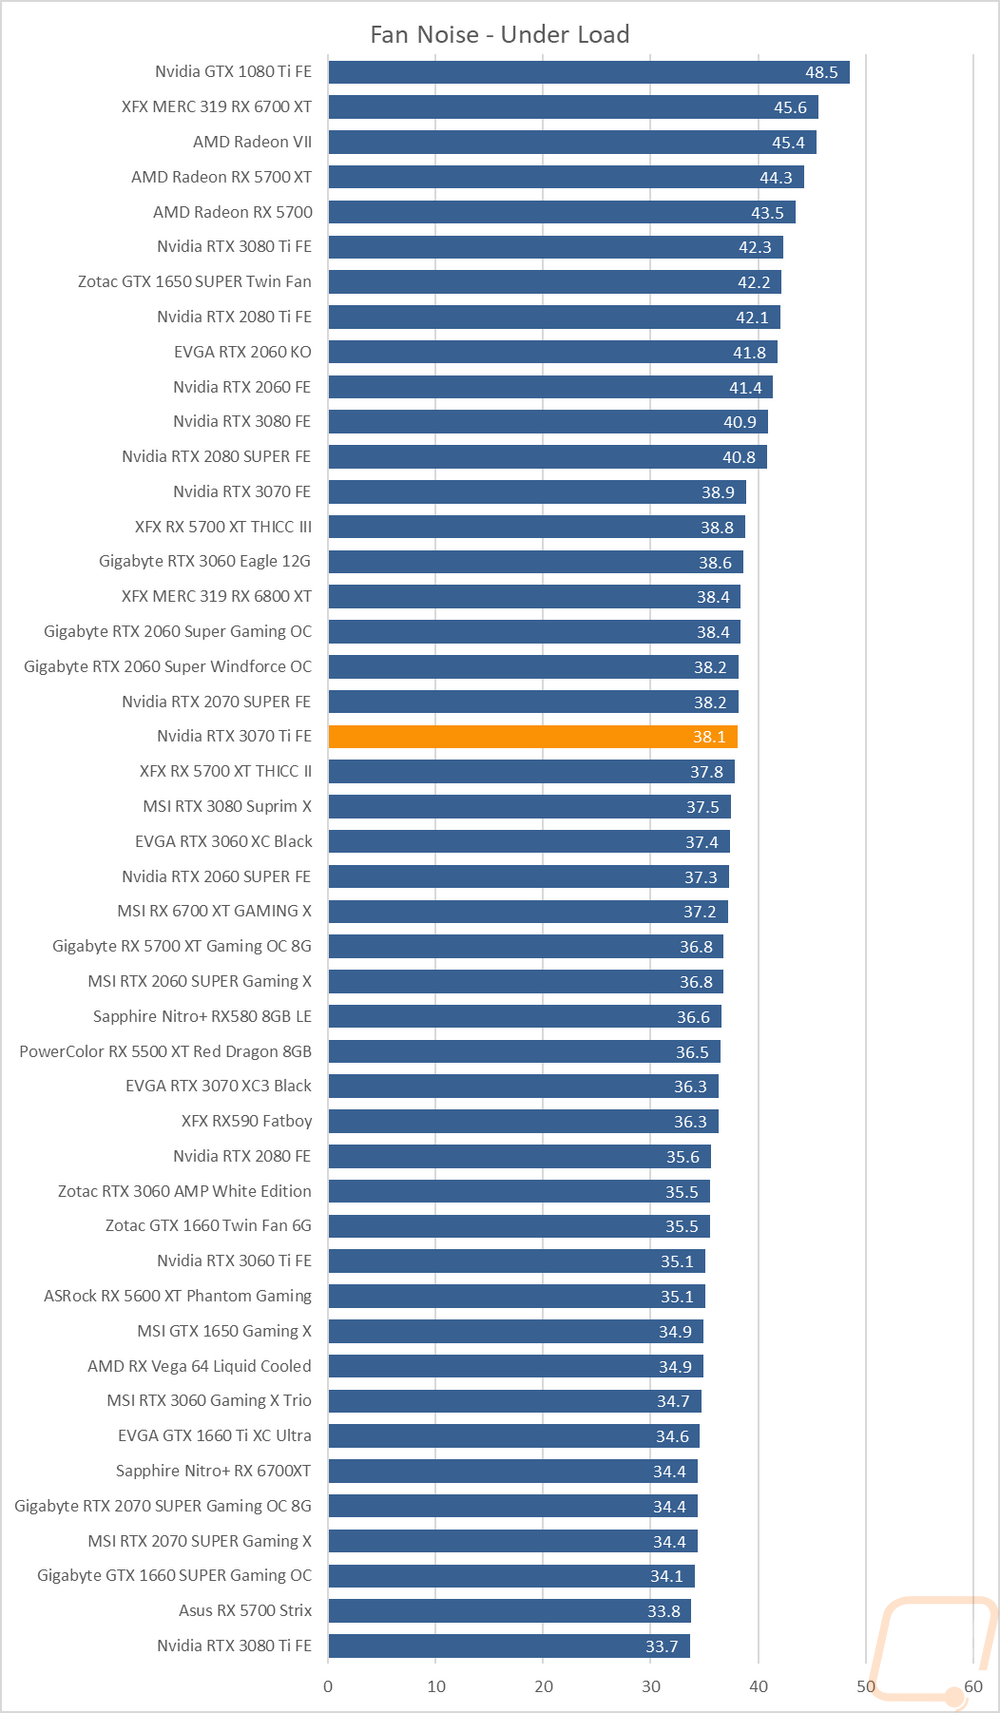
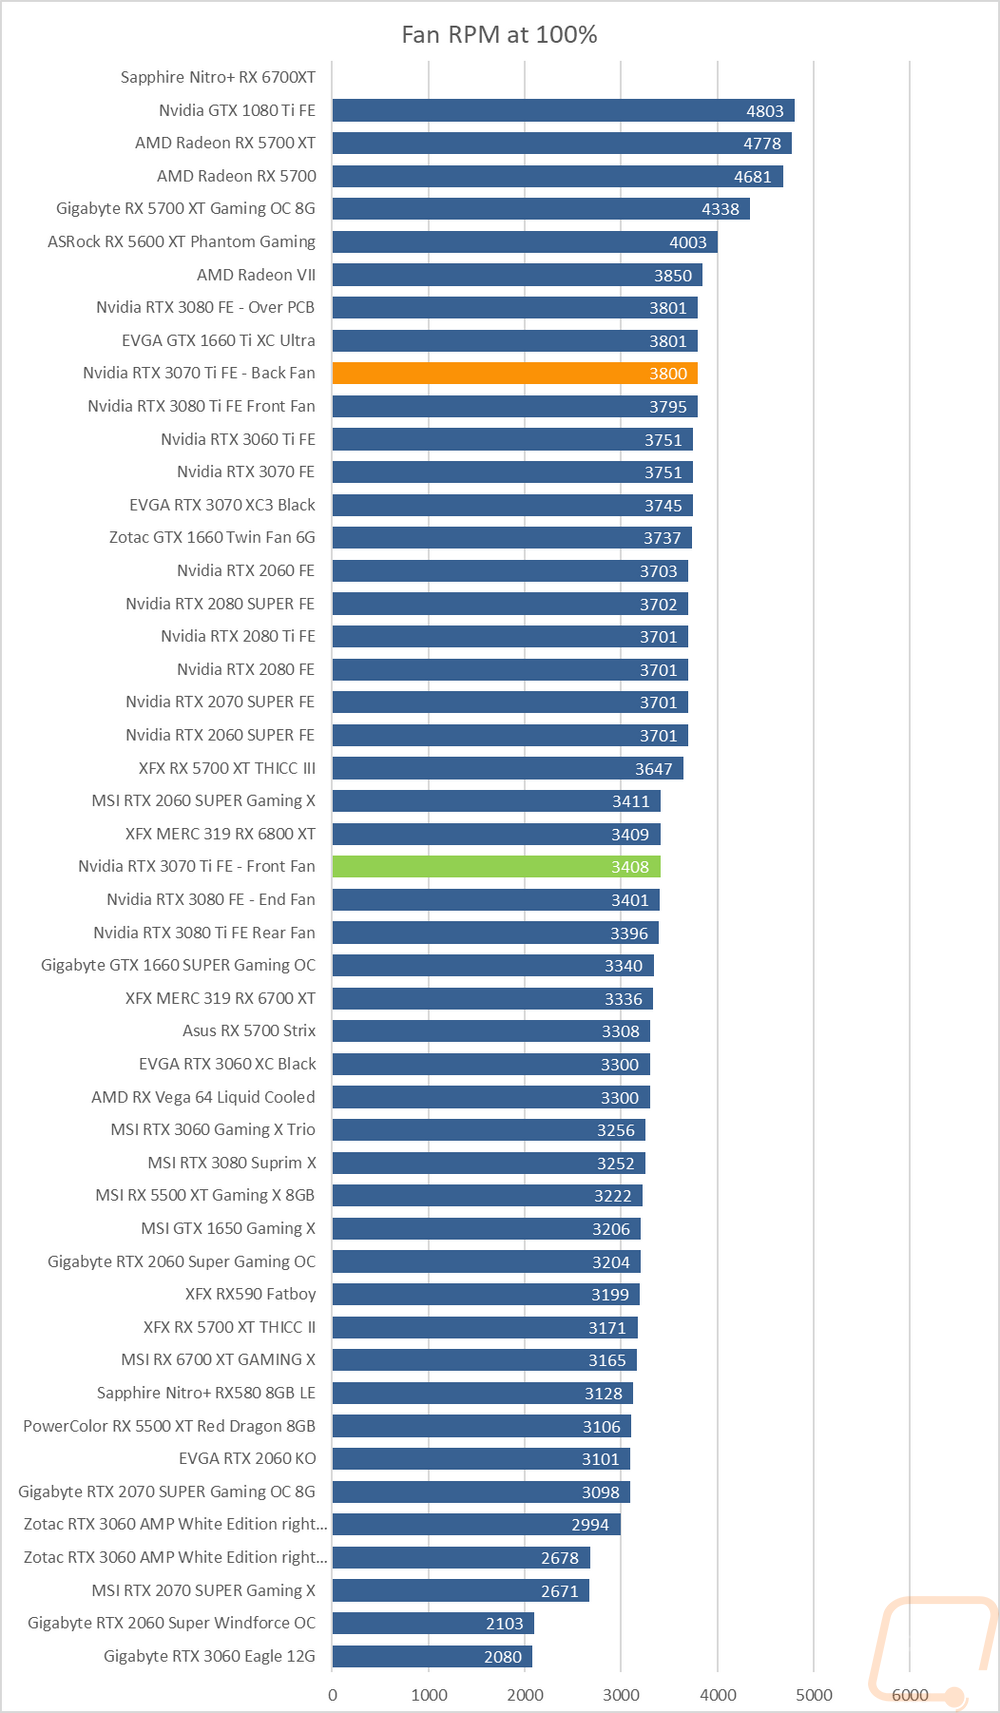
My next round of tests were looking at noise levels. These are especially important to me because I can’t stand to listen to my PC whirling. Especially when I’m not in game and other applications are using the GPU. For my testing, though I first tested with the fan cranked up to 100% to get an idea of how loud it can get, then again at 50% to get an idea of its range. The RTX 3070 Ti Founders Edition ends up in the upper middle part of our graphs for the 100% fan speed results which were 60.4 dB. Cranking the fans up had the front fan at 3408 RPM and the back at 3800 RPM, so they were moving. It's also interesting that Nvidia has the free flowing pull-through fan running at a higher RPM. But under load, the RTX 3070 Ti Founders Edition is smack dab in the middle of the pack with the noise level with a load at 38.1 dB which isn’t too bad considering Nvidia packs it all in a standard sized card, not a tall and thick design like most aftermarket cards.
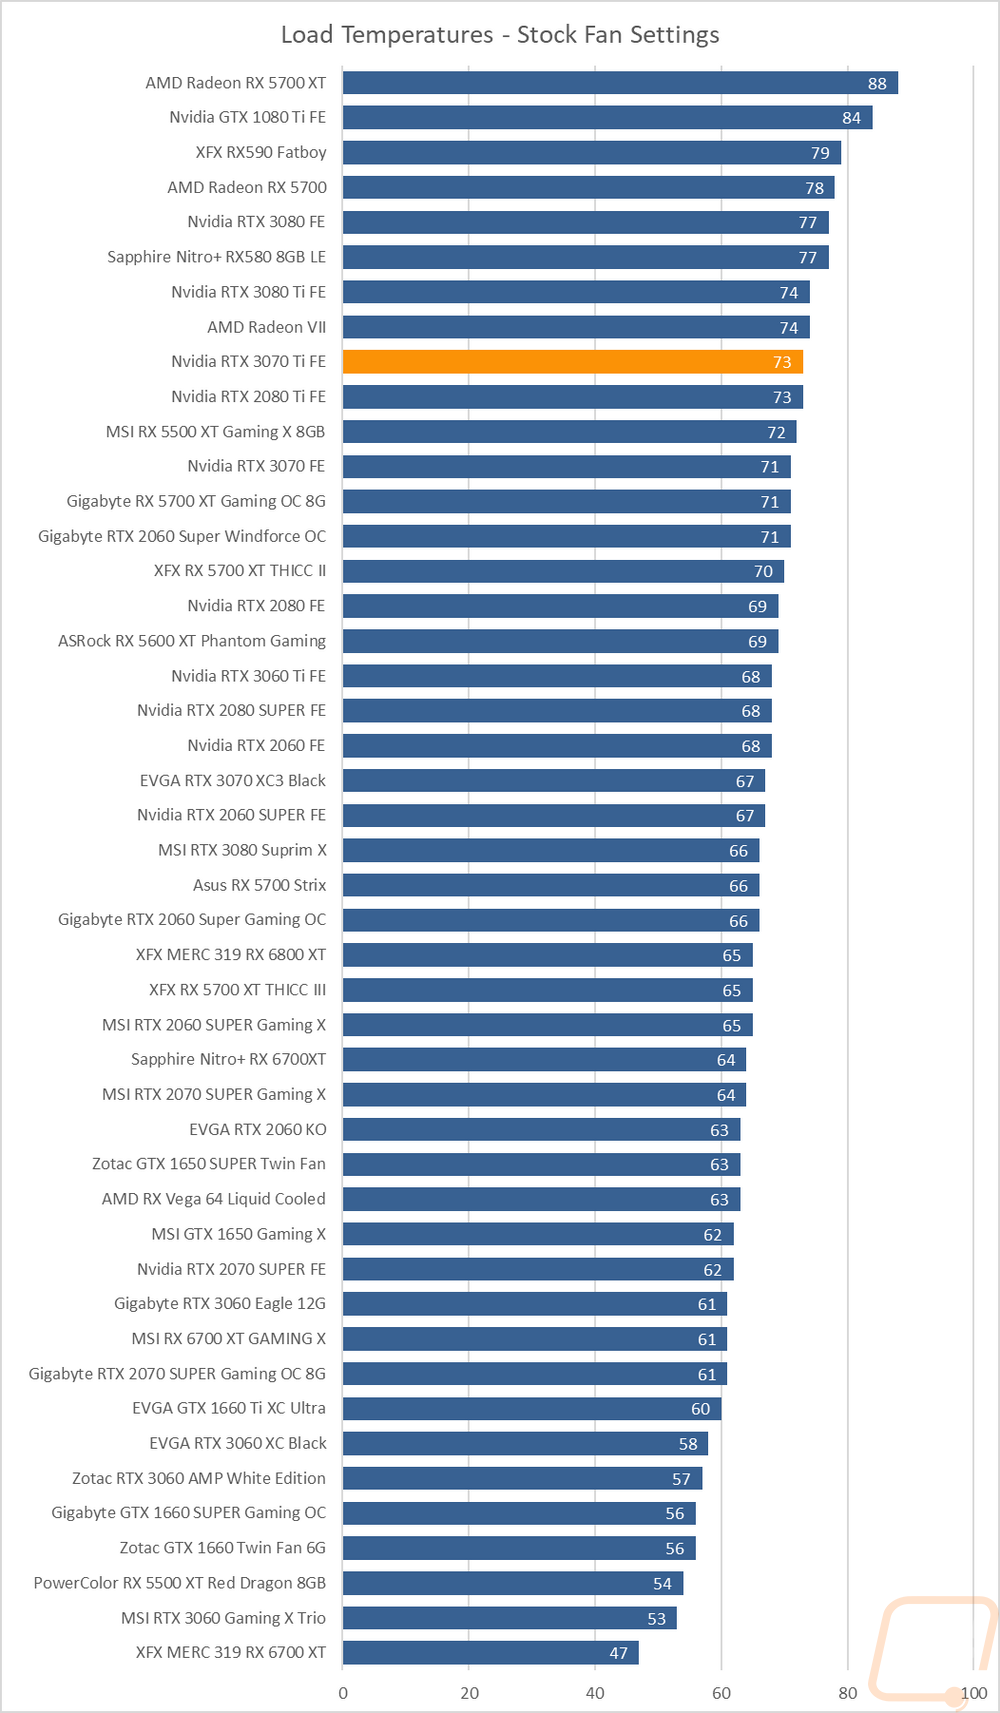
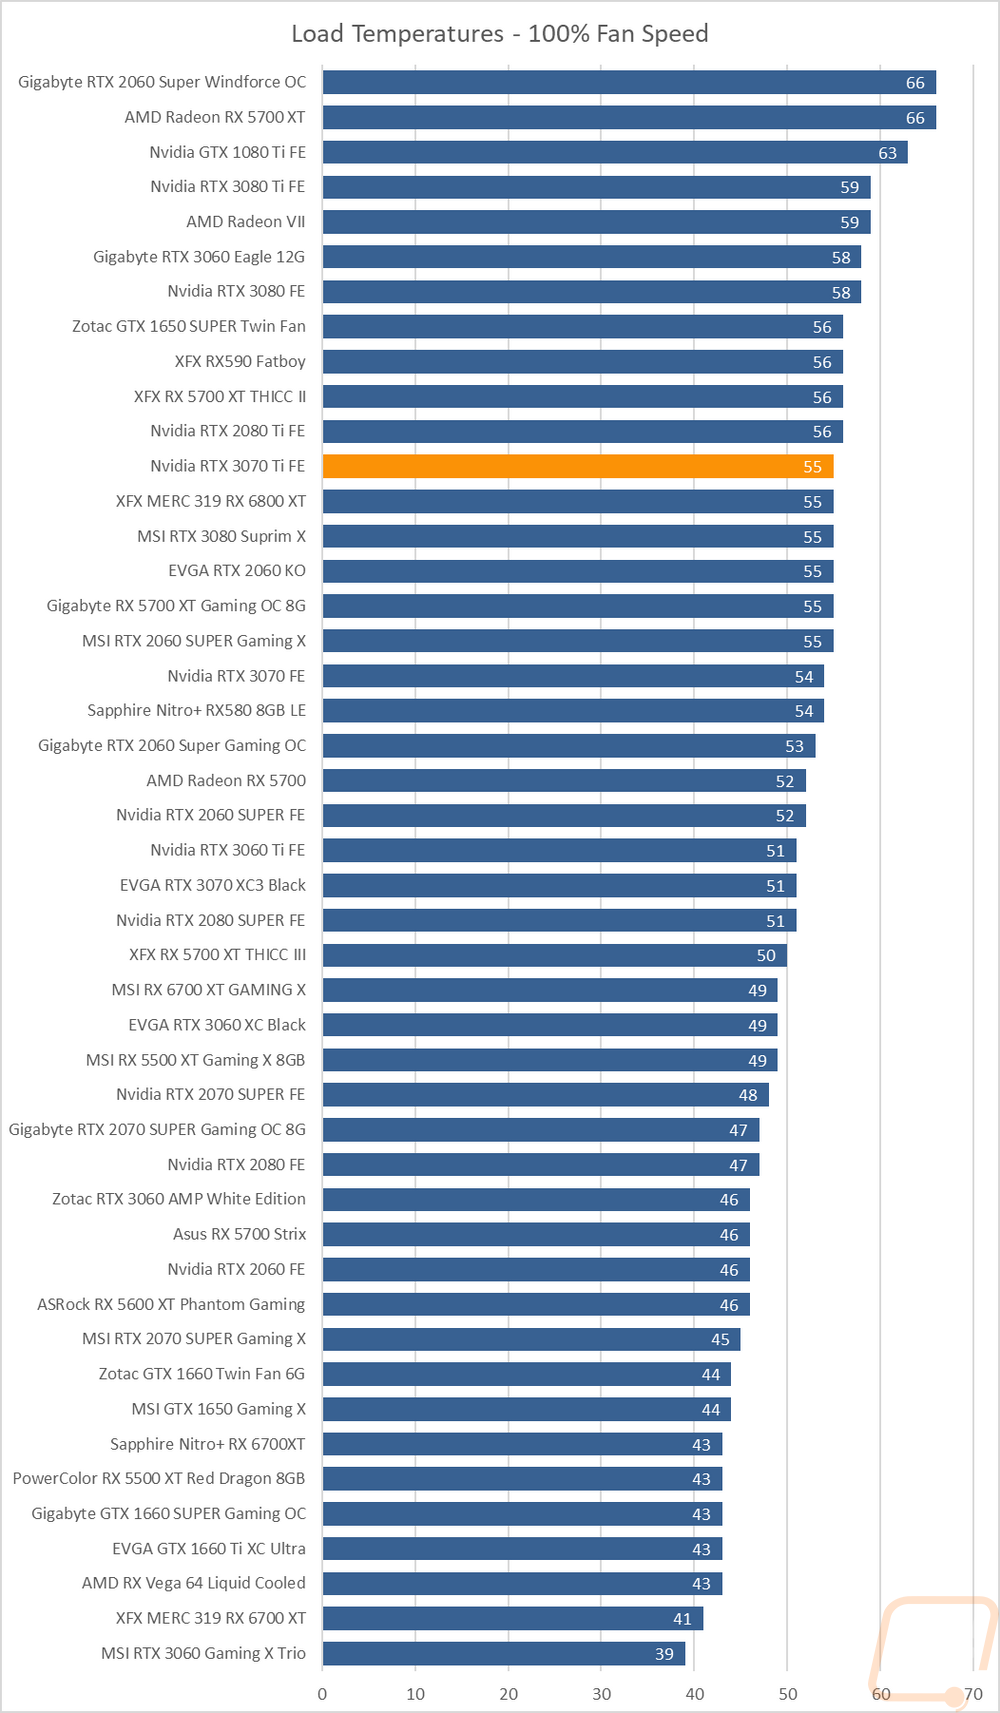
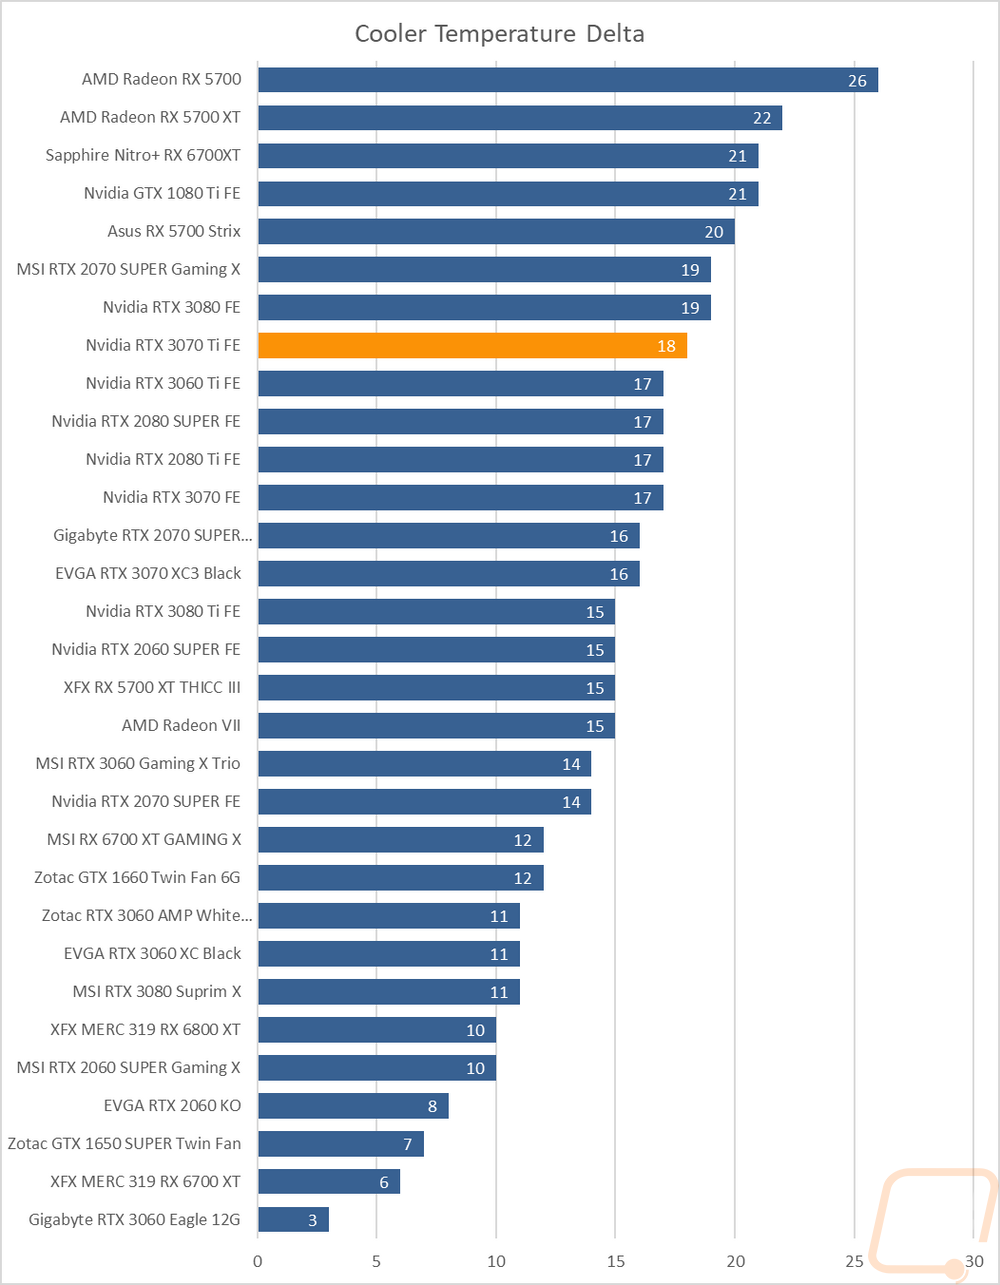
To finish up my testing I of course had to check out the cooling performance. To do this I ran two different tests. I used AIDA64’s Stress Test run for a half-hour each to warm things up. Then I documented what temperature the GPU leveled out at with the stock fan profile and then again with the fans cranked up to 100%. With the stock profile, the RTX 3070 Ti Founders Edition ends up in the top ¼ of the charts running at 73c. This isn’t a huge surprise as this isn’t far off from the original RTX 3070 which ran at 71c and it's lower than the two RTX 3080’s, but it is a lot higher than any of the aftermarket cards. Cranking the fans up to 100% did drop the temperatures down to 55c which is still in the top half of our charts. But the delta between the two results is 18c meaning that Nvidia is being conservative with their fan profiles and that there is still a lot of headroom left in the Founders Edition cooler as long as you don’t mind cranking the fan speeds up.
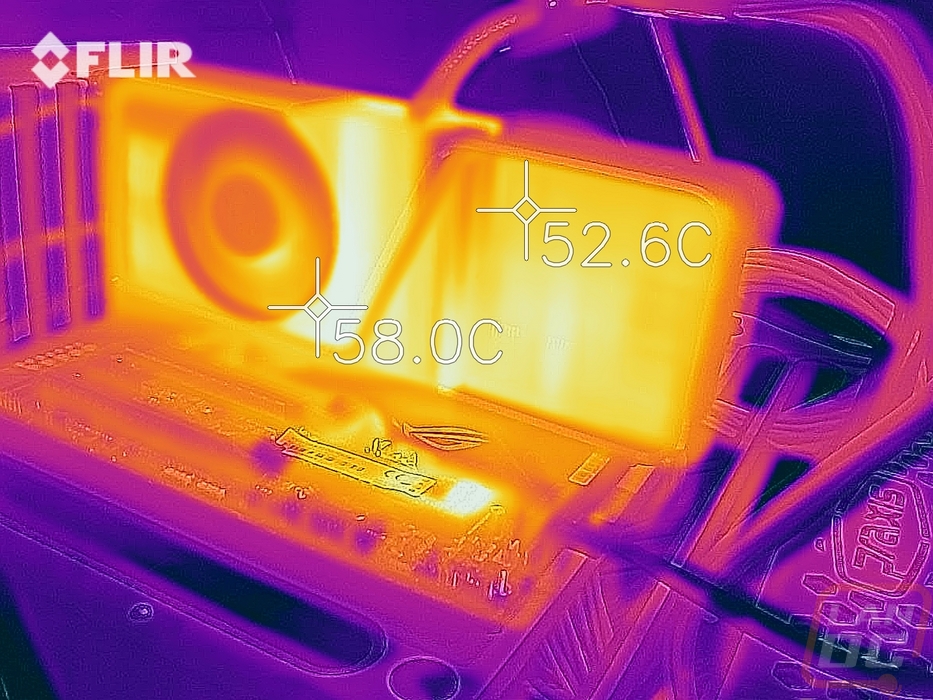
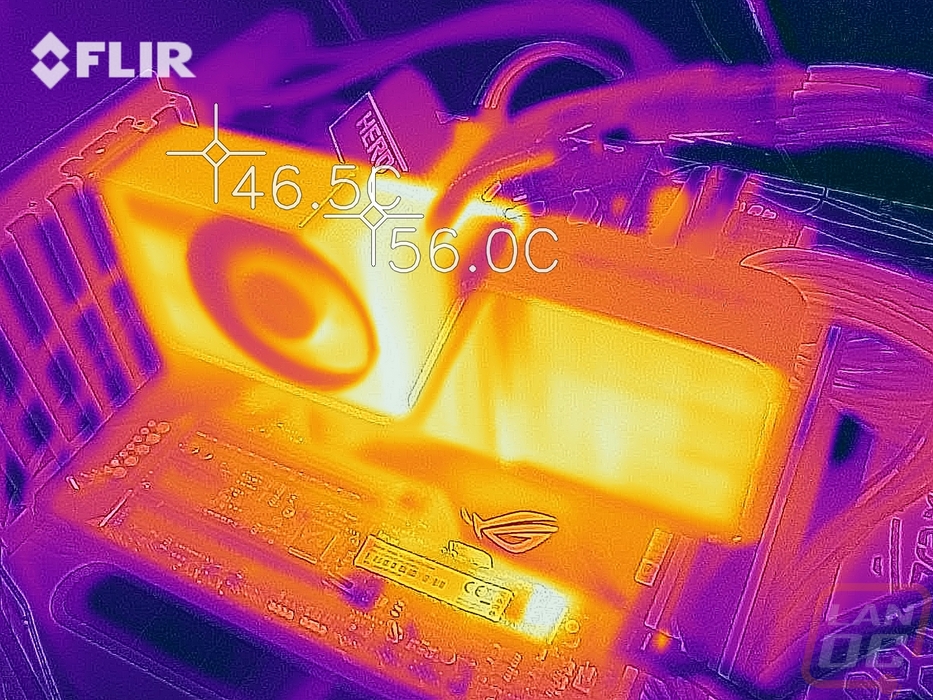
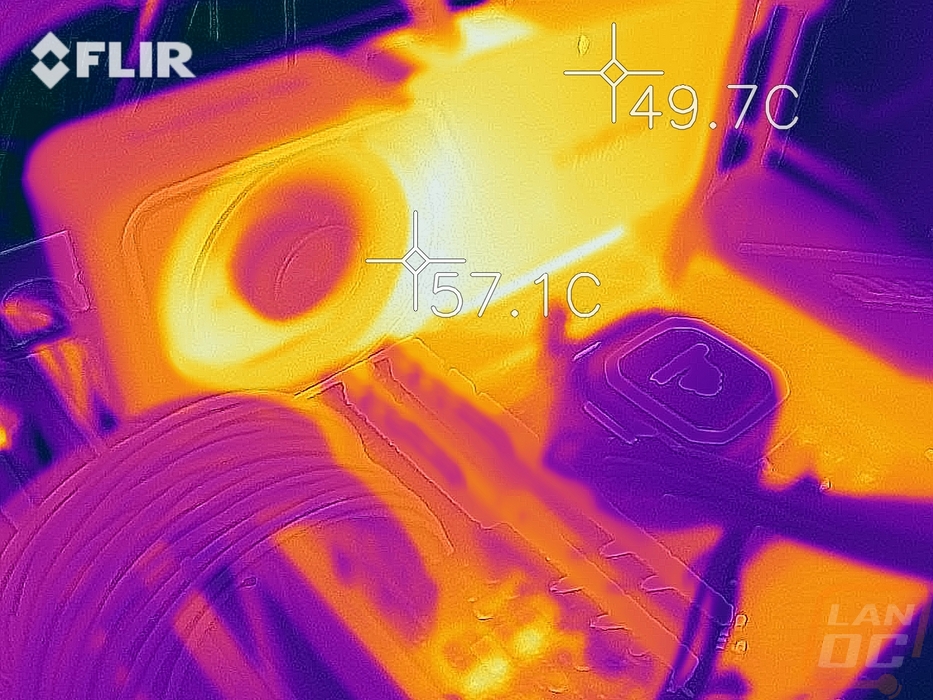
While running the stock fan profile testing I also took the time to get a few thermal images so we could see what is going on. The front side of the RTX 3070 Ti Founders Edition which has the fan up over top of the PCB has a small warmer spot to the bottom right of the fan, but you can see how it is pushing warm air into the exposed heatsink and the farther up the heatsink the air goes the cooler it gets before venting out the top. The solid heatsink blow-through side on the right runs 6c cooler. Then up on top the middle where the air is being pushed up and out is of course the warmest, we can also see that the card isn’t pushing hot air down against the motherboard which is rare. Then on the back, the bottom right area next to the back fan is the hottest area on the entire card. The rest of the backplate has a consistent temperature.