Cooling Noise and Power
For my last few tests, rather than focusing on in game performance, I like to check out other aspects of video card performance. These are also the most important ways to differentiate the performance between cards that have the same GPU. To start things off I took a look at power usage.
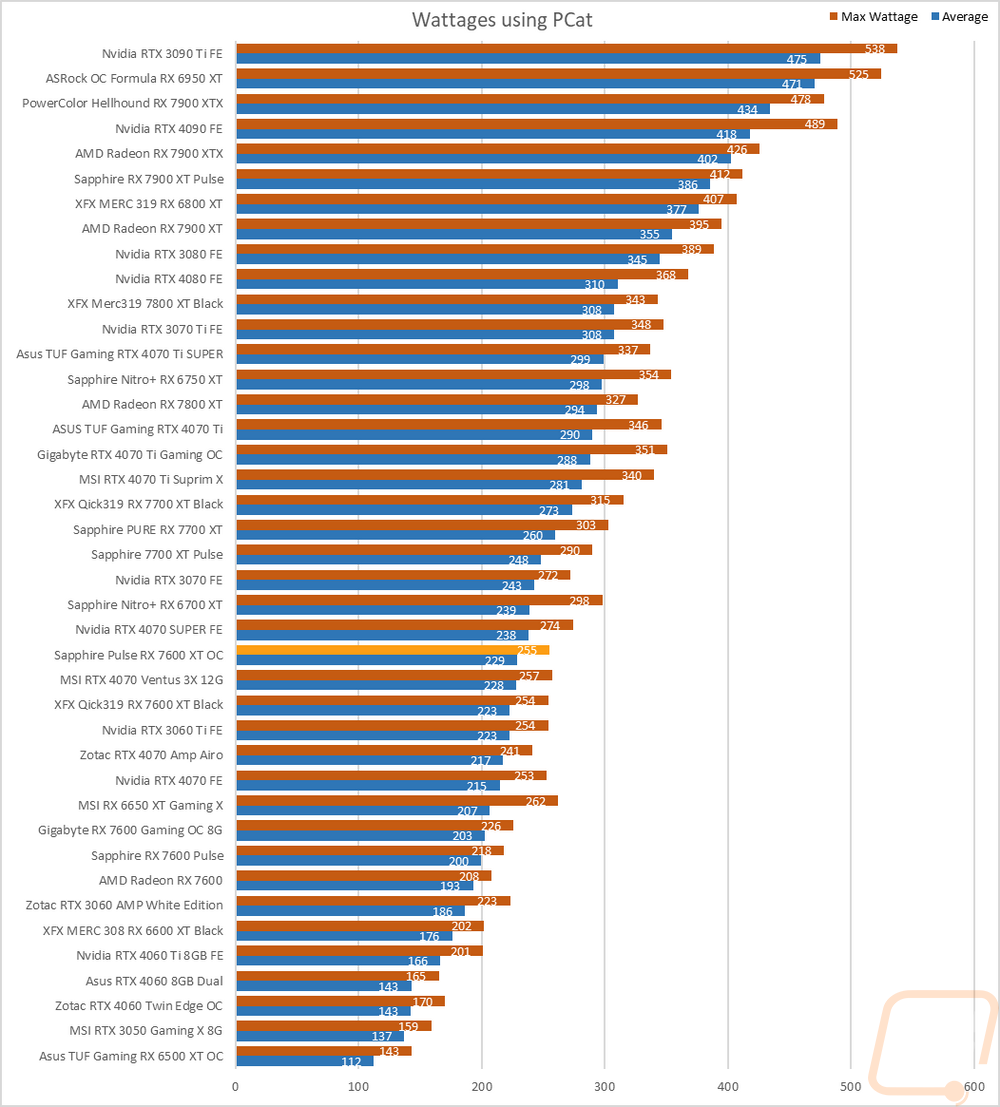
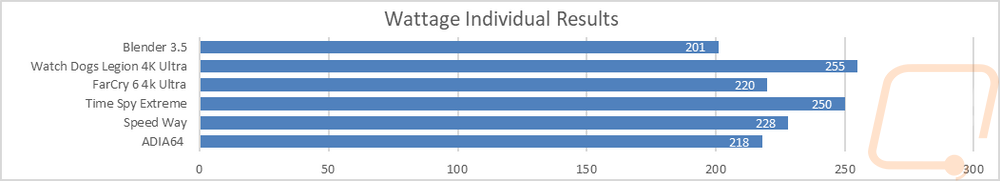
For this, our new test setup utilizes the Nvidia-designed PCat v2 along with cables to handle both traditional 6 or 8-pin connections as well as the new 12VHPWR. The PCat also utilizes a PCIe adapter to measure any power going to the card through the PCIe slot so we can measure the video card wattage exclusively, not the entire system as we have done in the past. I test with a mix of applications to get both in game, synthetic benchmarks, and other workloads like Blender and AIDA64. Then everything is averaged together for our result. I also have the individual results for this specific card and I document the peak wattage result as well which is almost always Time Spy Extreme. The Pulse RX 7600 XT OC averaged 229 watts from the peak results and the highest wattage result was 255 watts. This was 6 watts above the XFX 7600 XT on average but just a 1-watt difference on the highest result which was a surprise, I thought for sure that the Pulse RX 7600 XT OC would be pulling a little less power. This put the Pulse RX 7600 XT OC just behind the RTX 4070 SUPER and ahead of an overclocked RTX 4070.
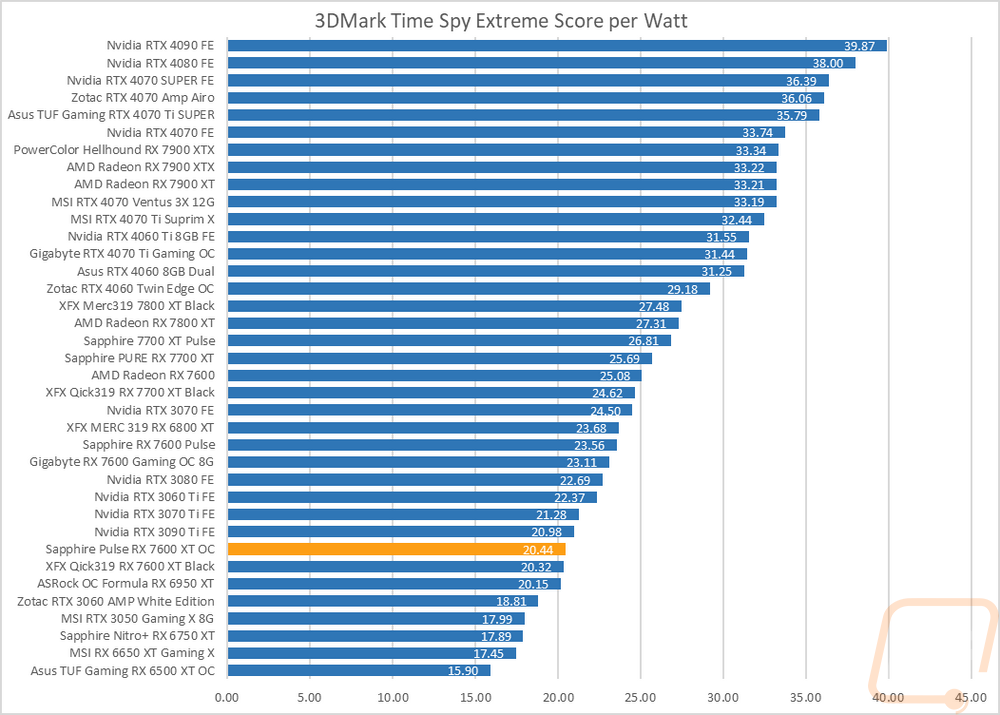
With having exact peak wattage numbers when running Time Spy Extreme I was also able to put together a graph showing the total score for each watt that a card draws which gives us an interesting look at overall power efficiency in the popular and demanding benchmark. AMD's power efficiency while improved has been behind Nvidia across the board for this generation and adding in an overclock on top of an upclocked card just exaggerates that with the Pulse RX 7600 XT OC sitting at 20.44 points per watt. The RTX 4060 that it otherwise outperformed is getting 10 more points per watt. The XFX 7600 XT ended up being just a touch lower here at 20.32.
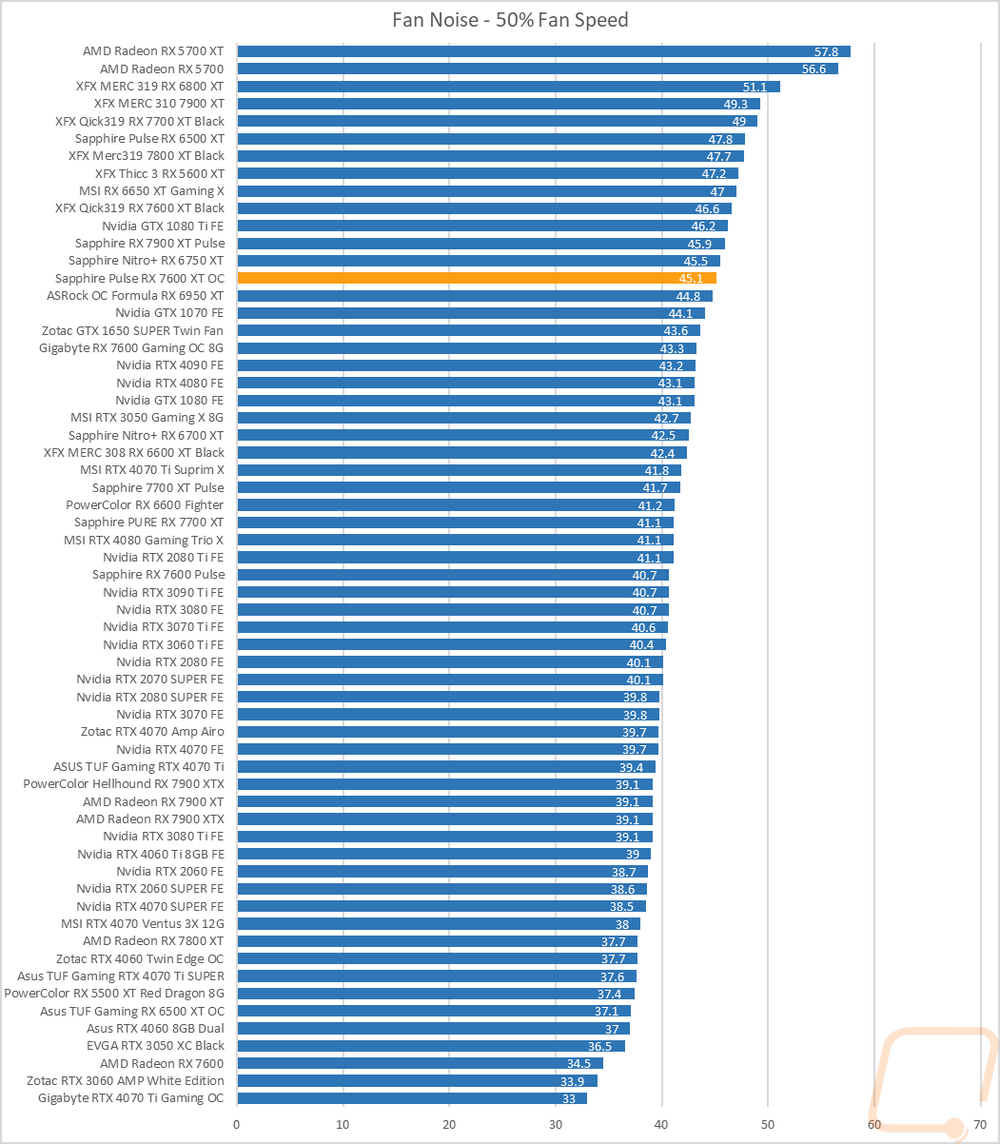
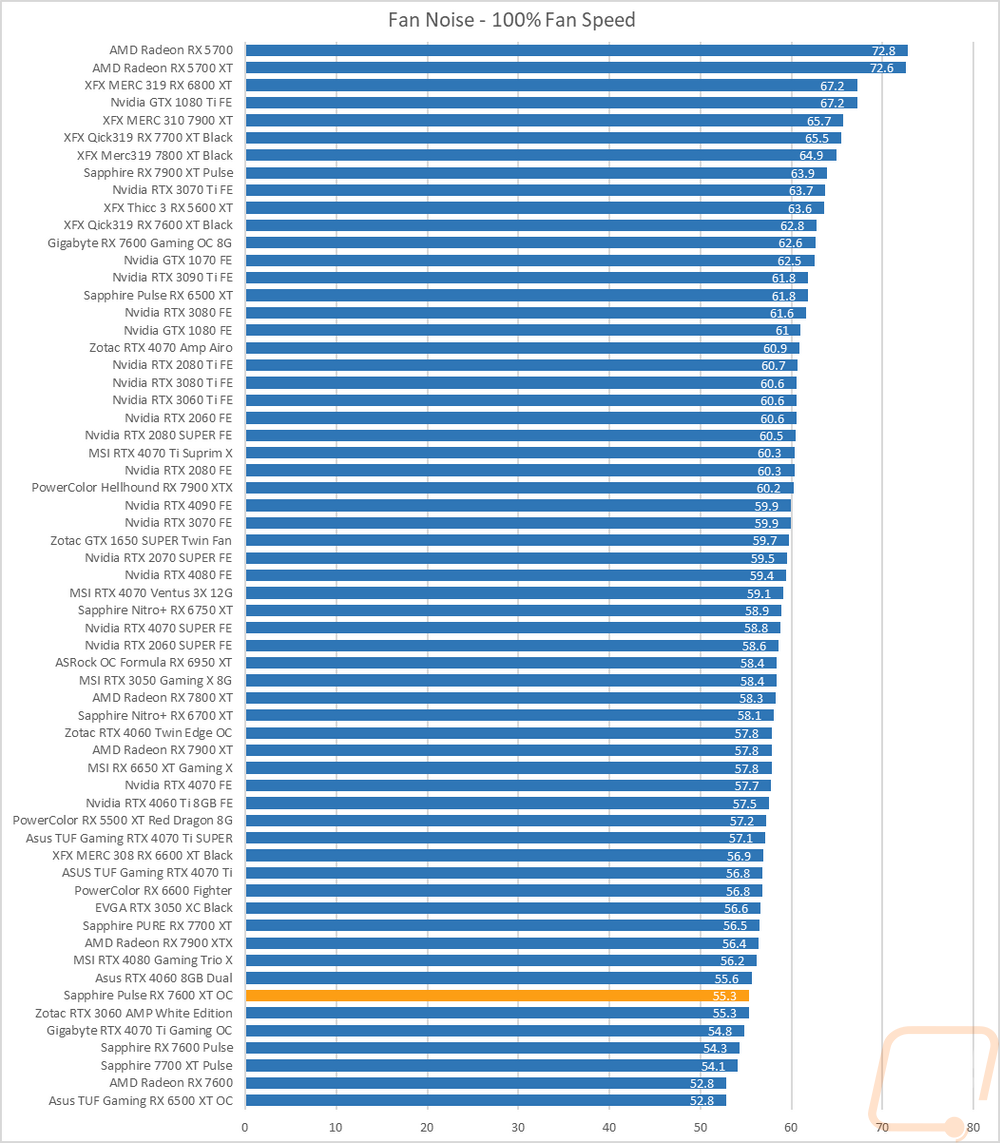
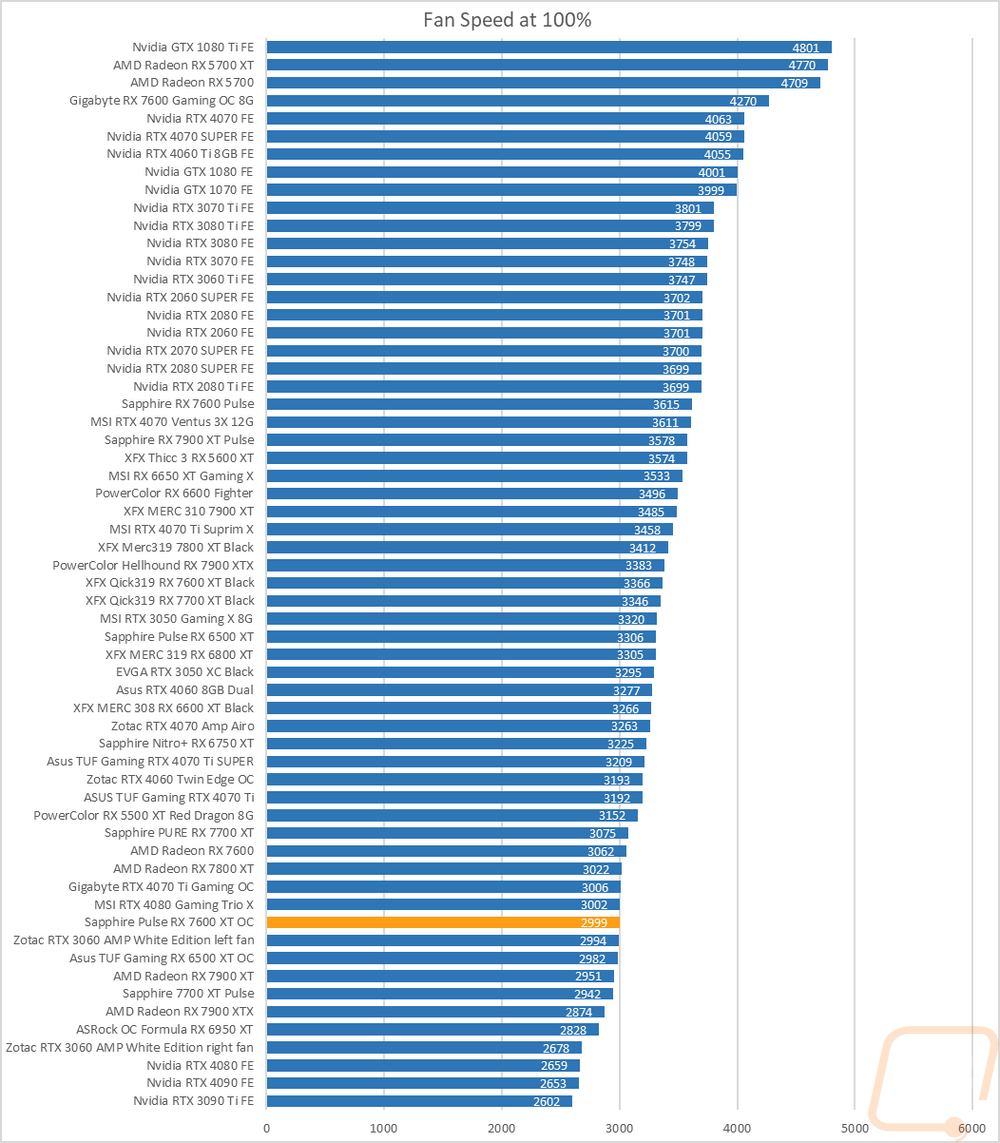
My next round of tests were looking at noise levels. These are especially important to me because I can’t stand to listen to my PC whirling. Especially when I’m not in game and other applications are using the GPU. For my testing, though I first tested with the fan cranked up to 100% to get an idea of how loud it can get, then again at 50% to get an idea of its range. The Pulse RX 7600 XT OC came in at 45.1 decibels at 50% fan speed which put it up in the top 1/3 of the chart but that is still 1.1 dB lower than the XFX 7600 XT. Interestingly though at 100% fan speed the Pulse RX 7600 XT OC dropped down to the bottom of the chart at 55.3 showing there wasn’t much of a noise range when its fans ramp up.
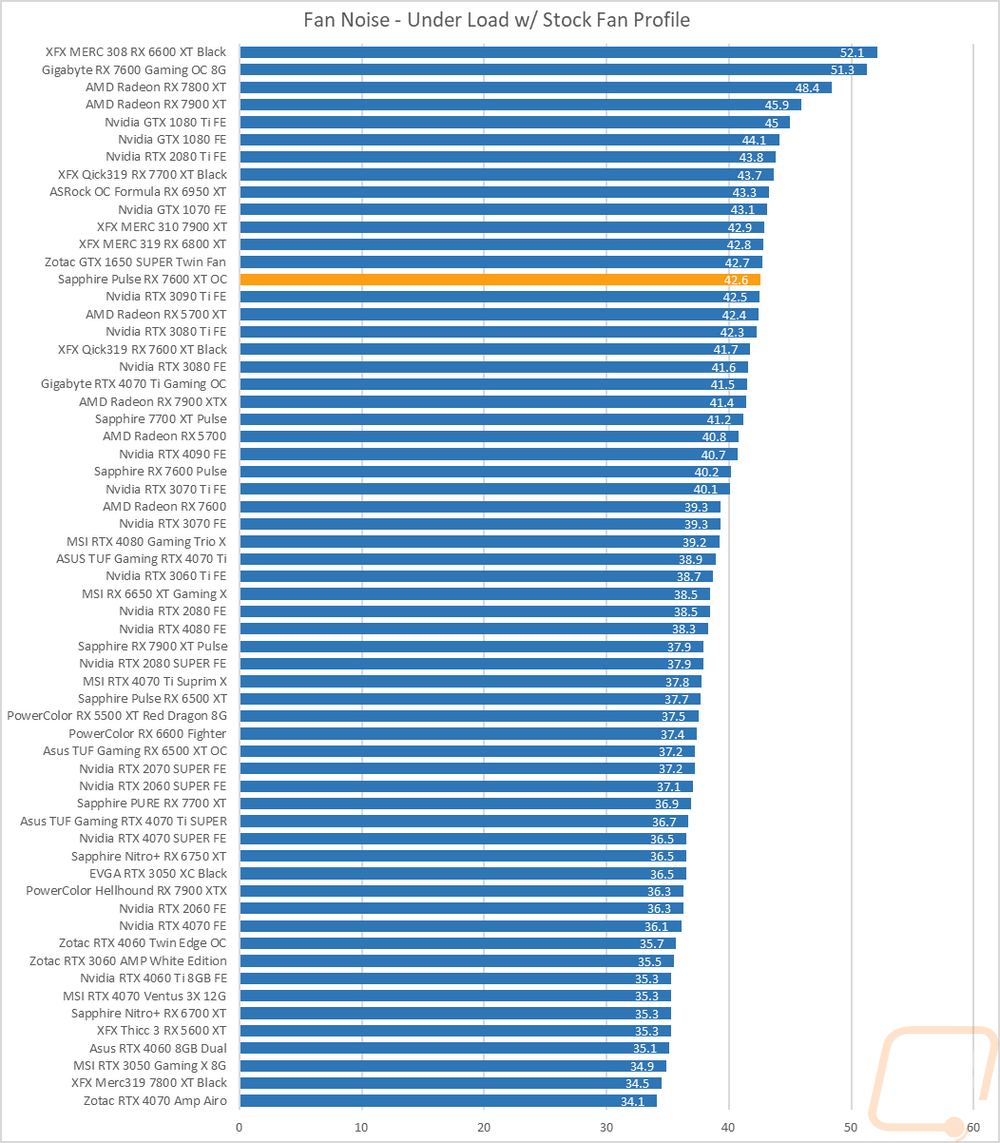
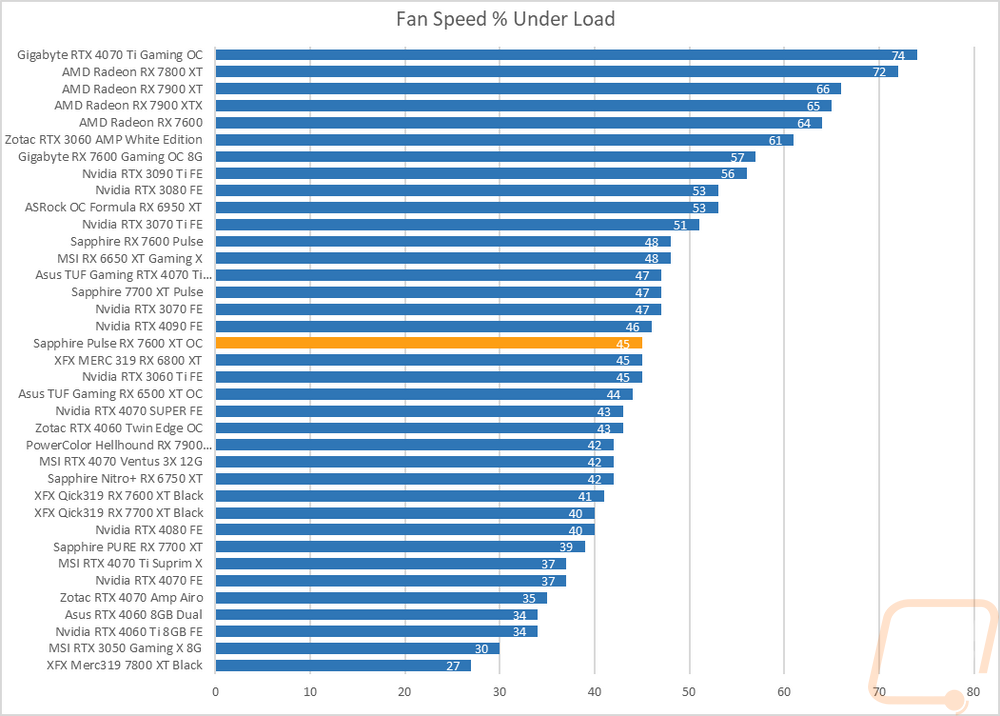
I also take a look at noise performance while under load. For that when running AIDA64’s stress test I wait until the temperature of the card has leveled off and then measure how loud things are when the card is at its worst-case scenario with the stock fan profile. Like with the 50% fan speed tests the Pulse RX 7600 XT OC is up higher in the chart when under load. Under load, it leveled off at 45% fan speed so that shouldn’t be too much of a surprise. This was higher than where the XFX 7600 XT ended up with that card are almost a decibel lower.
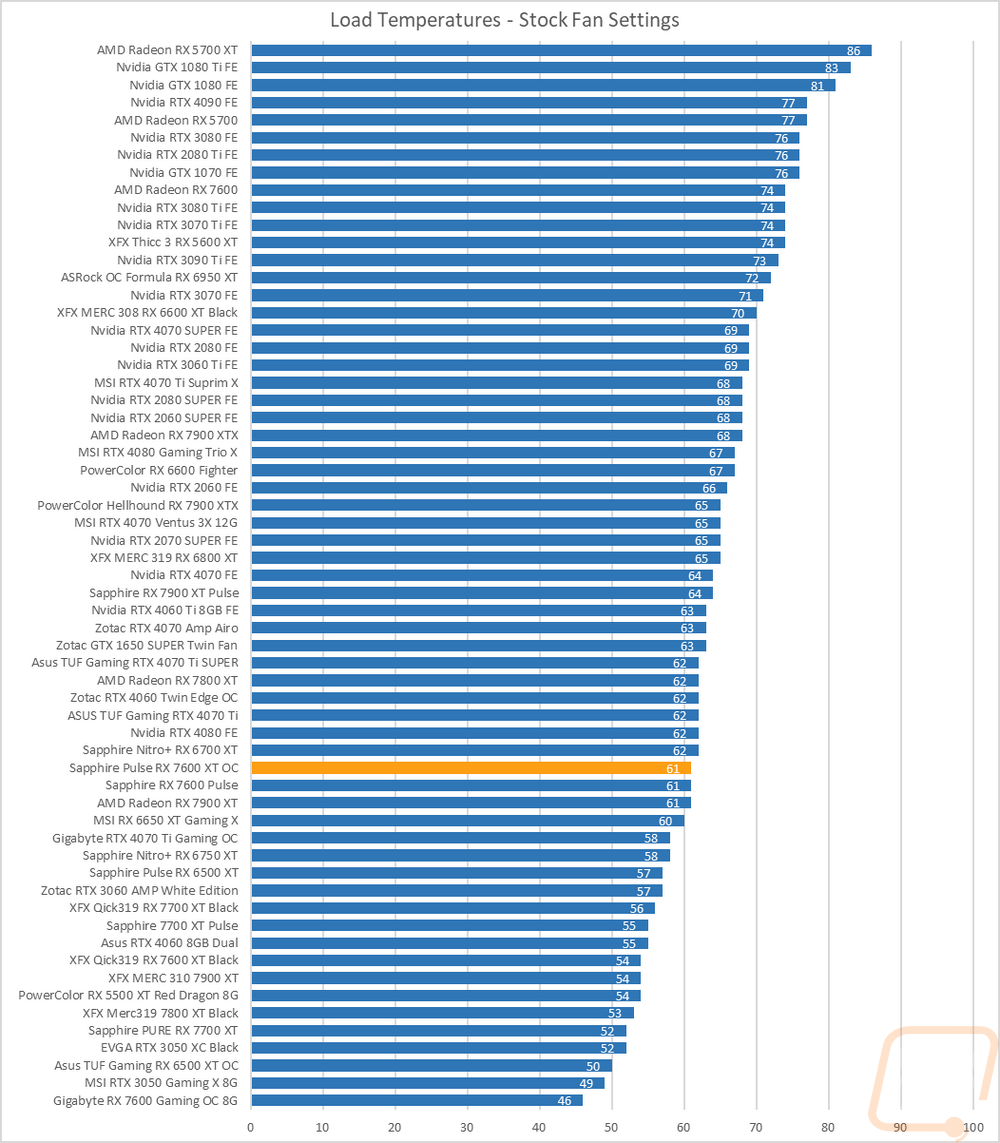
To finish up my testing I of course had to check out the cooling performance. To do this I ran two different tests. I used AIDA64’s Stress Test run for a half-hour each to warm things up. Then I documented what temperature the GPU leveled out at with the stock fan profile and then again with the fans cranked up to 100%. With the stock profile, the Sapphire Pulse RX 7600 XT OC came in at 61c when left under load. This was 7 degrees higher than the XFX with its larger cooler. For the GPU hotspot, the Pulse RX 7600 XT OC came in at 91c and 74c for the memory.
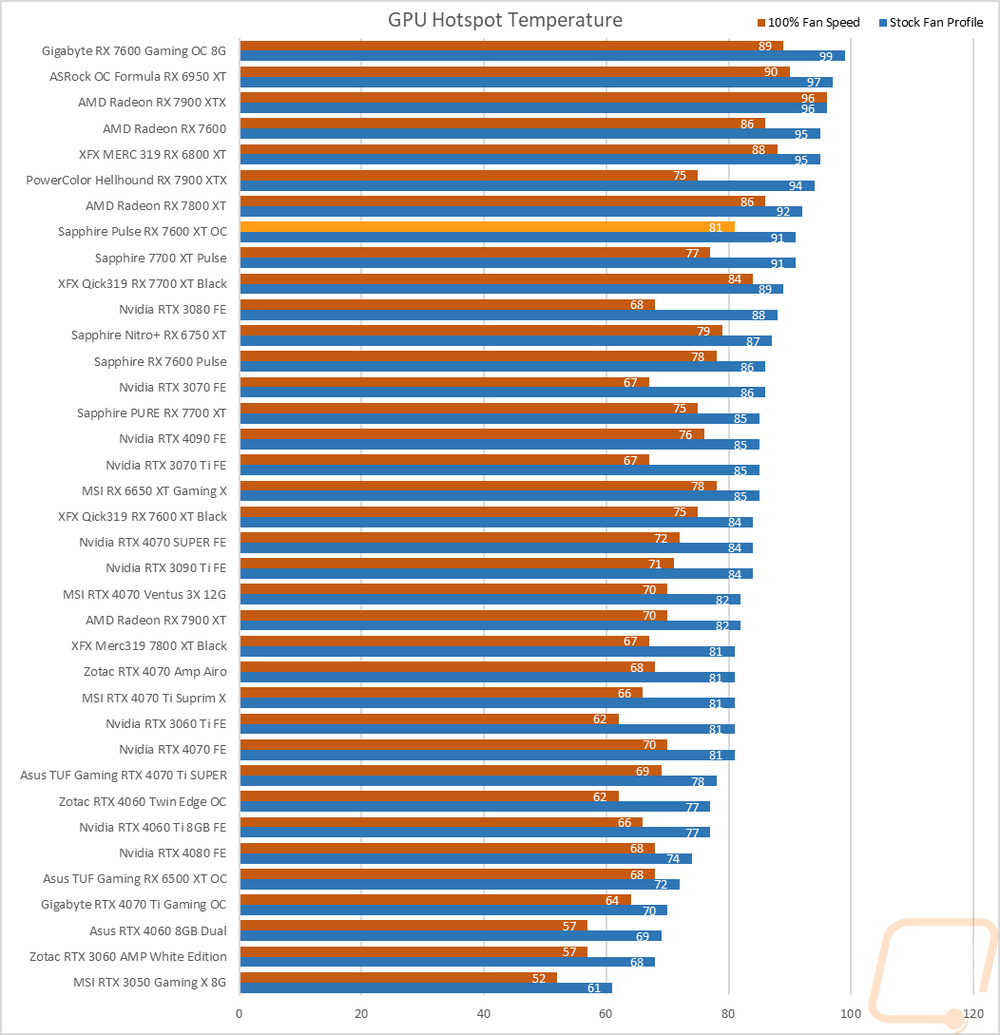
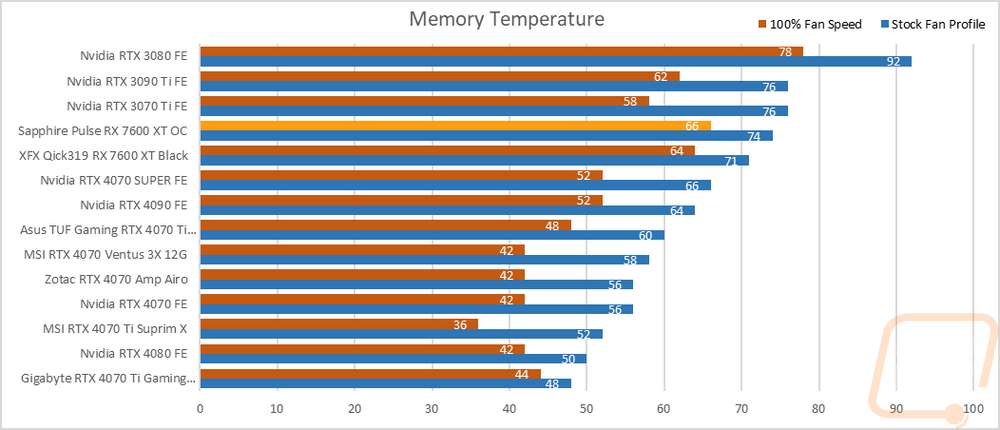
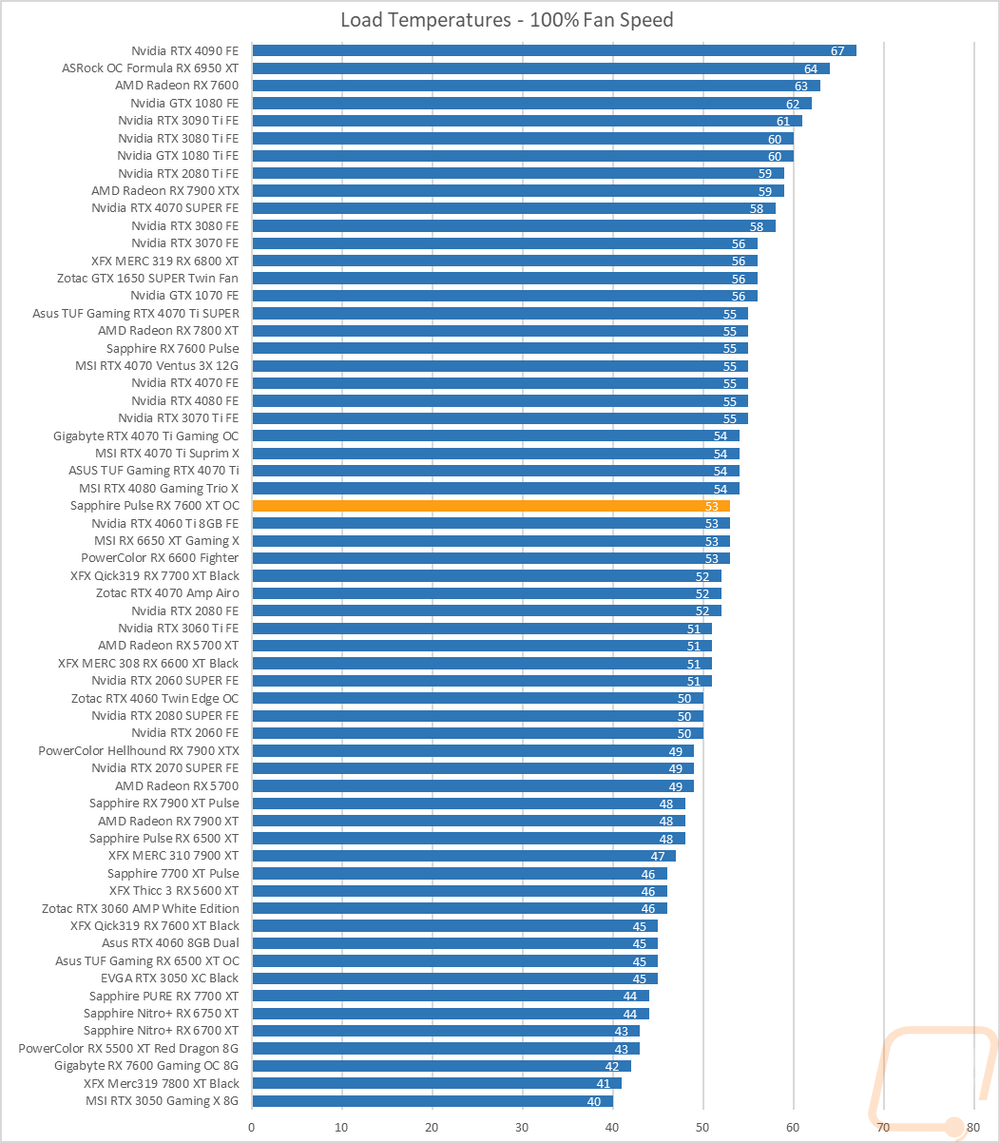
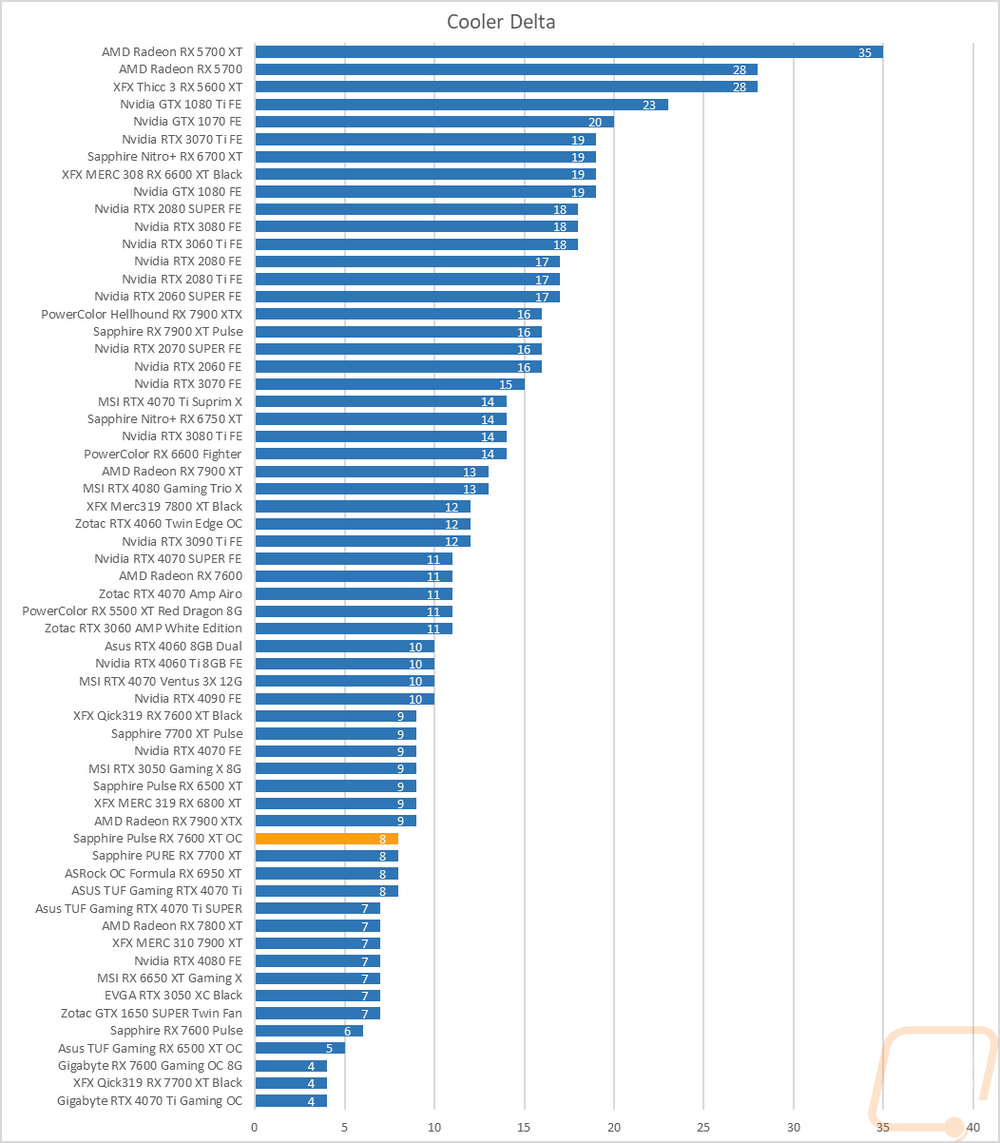
Then with the fans cranked up, the Pulse RX 7600 XT OC dropped down to 53c which made the delta between the stock fan profile and 100% fan speed 8c which is on point for where it should be. At 100% fan speed the GPU hotspot on the Pulse RX 7600 XT OC was still hot but better at 81c and the memory temperatures were the same dropping down to 66c but still higher than most of the other cards tested.
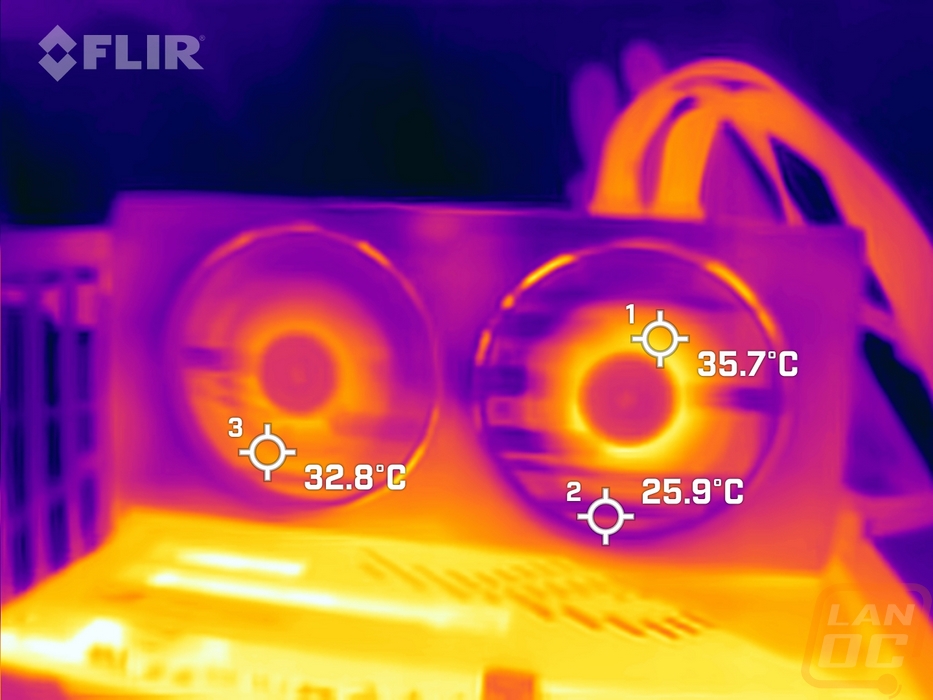
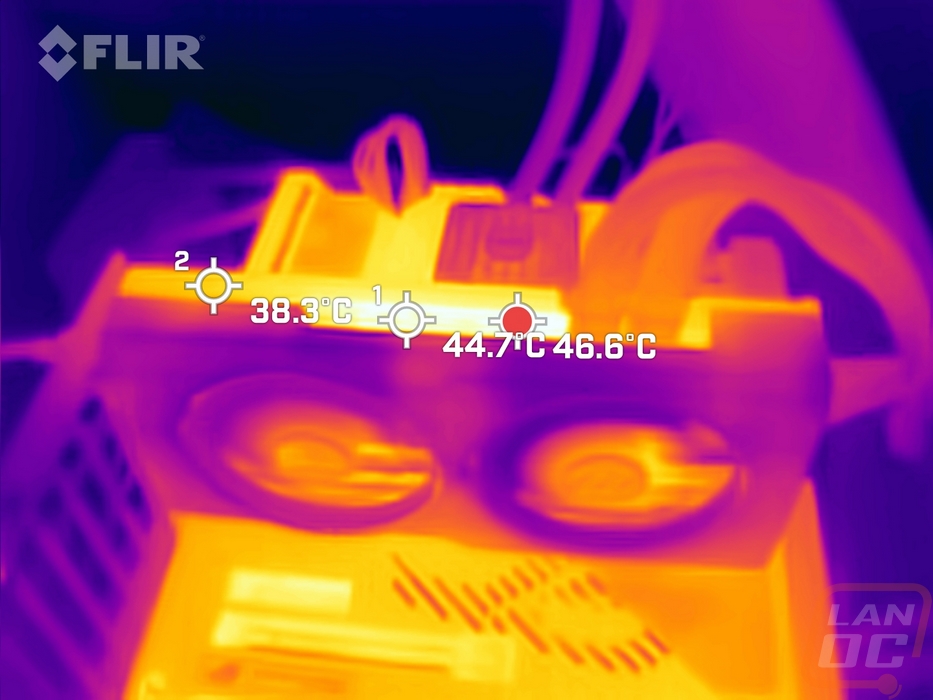
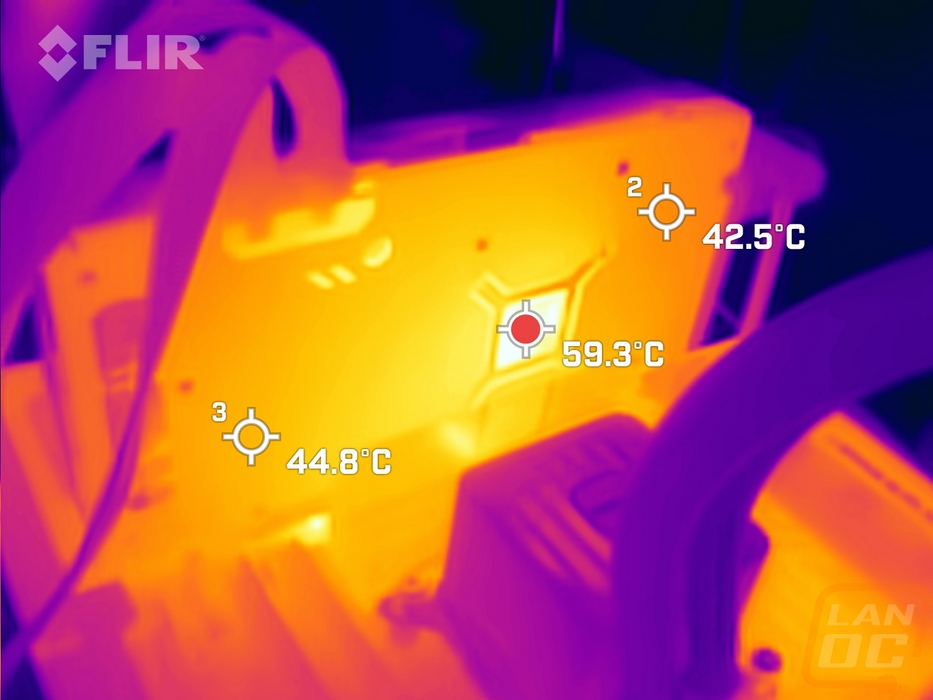
While running the stock fan profile testing I also took the time to get a few thermal images so we could see what is going on. On the fan side, the Pulse RX 7600 XT OC really makes it look like our test motherboard is on fire with the hottest spots here just at 35.7 near the middle behind the fan. Up on the top edge is really where we find any heat at all with the hot spot at 46.6c where the PCB is directly exposed. It is then cooler closer to the front of the card where less of the warmed air from the heatsink vents. Then on the back of the card, the hottest spot on the entire card is the exposed area in the backplate behind the GPU. The rest of the metal backplate does have some heat that radiates from that area but overall it is cool with the backplate at 42.5c on the bracket end of the card and 44.8c down before the blow-through part of the card.