Software
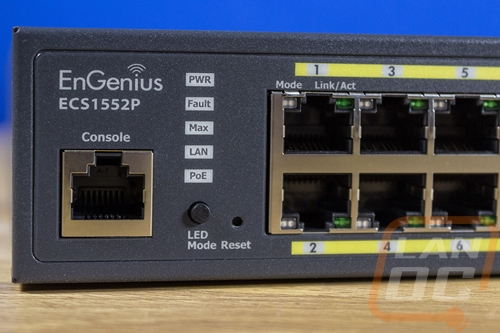
The Engenius ECS1552P is what they are calling a Layer 2+ switch and with that, a good portion of its functionality is all on the software side of things. It doesn’t go to the extent that a layer 3 switch does which are in a lot of ways a router but we do need to dive into the software to get a good idea of the full experience. The ECS1552P has two different software aspects that we need to check out individually, it is part of the EnGenius Cloud and then it has its own web interface as well. So let's start off with the EnGenius Cloud which if you have been around here for a while you have most likely seen a few times as most of our network hardware is EnGenius Cloud compatible. The cloud software can be accessed through a web interface or using their app but functionally they are similar. The app does make adding new hardware easier, however, once you have an account setup you just click the add hardware button and use your phone camera to scan the QR code on the bottom of the ECS1552P to add it as a device. Then once it is powered up and plugged into your network it will automatically connect, update with your location settings, and update its firmware.
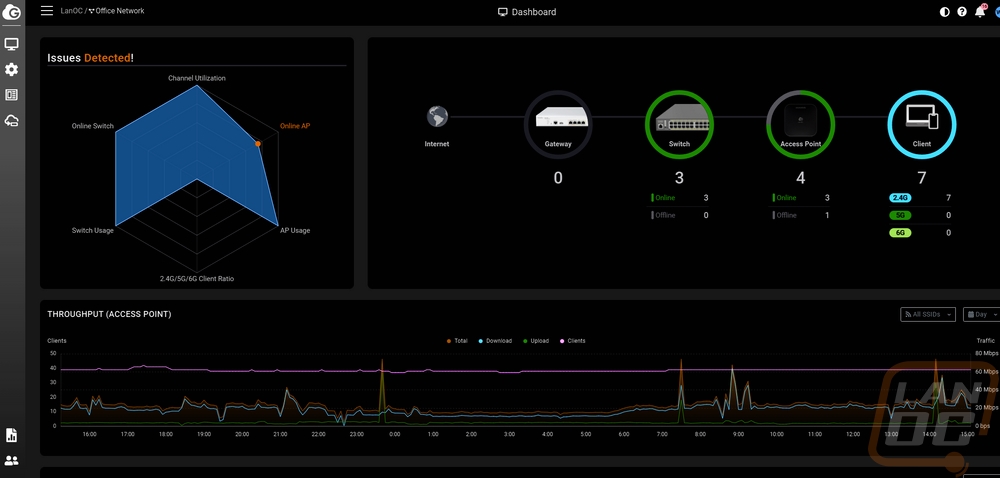
The landing page for the cloud web interface has menus on the far left and up top to let you know the status of your network. For ours, you can see that it is letting me know that one of the access points attached to the account isn’t online and our ratio of 2.4 GHz and 5 GHz clients is bad due to a lot of smart devices. I do wish I could adjust that setting or set IoT devices to be ignored by that calculation. Also up top, they break down all of your devices starting from switches, access points, then clients. Then below that you have a graph of throughput for the past day on your access points, that can be changed to a longer period of time and you can also set it to just a specific SSID to help pinpoint issues. Not in the picture, but below that graph they have pie graphs showing the top access points, top SSIDs, and top clients as well as lists for top operating systems and top applications. Sadly even though we do have cloud supported switches none of the homepage information is really related to them.
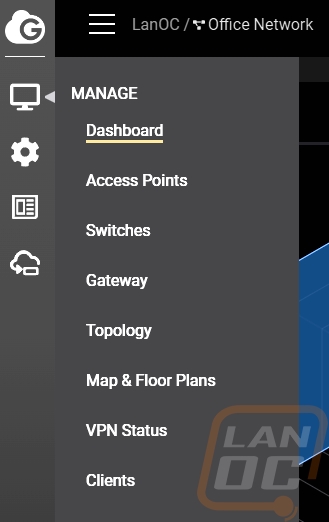
On the left, the menus drop down when you mouse over them and the two main menus are the top two. The PC-shaped icon is the manage menu which has options for APs, switches, and gateway that all will open up a page with a list of your devices of that type. You have the topology page which shows a basic topology of the devices hooked up, pro subscription users can also turn on an “other devices” option which I thought with a switch like the ECS1552P would show all of the connected devices but it does. In fact, turning that on only showed a few devices. It seems like a missed opportunity to not show the connected devices on switches and access points or maybe have the option to add things manually so you can map your entire network. The gear-shaped option is a second menu which is all for configuration. It has the same options but mousing over things like switch, gateway, and access point have more dropdowns that open up for each. These are your settings pages, for example, for an access point, you have an SSID page and radio settings. Switches have “system and protocols” and one for templates which is pro subscriber only. There are also pages like the VLAN page which tie into everything.
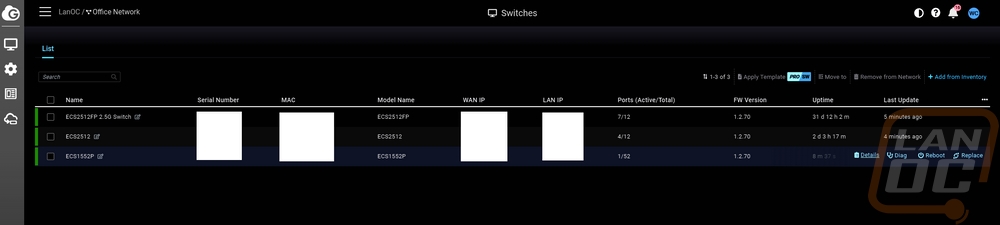
Opening up our switch list we have the ECS1552P as well as the other EnGenius Cloud supported switches that are on our network. This lists out things like the serial number, IPs, and mac addresses which for security I have blocked out. You can also see the uptime and number of ports and devices active. Mousing over a switch also opens up options. You can open up a details page, diagnostics, reboot, and replace.
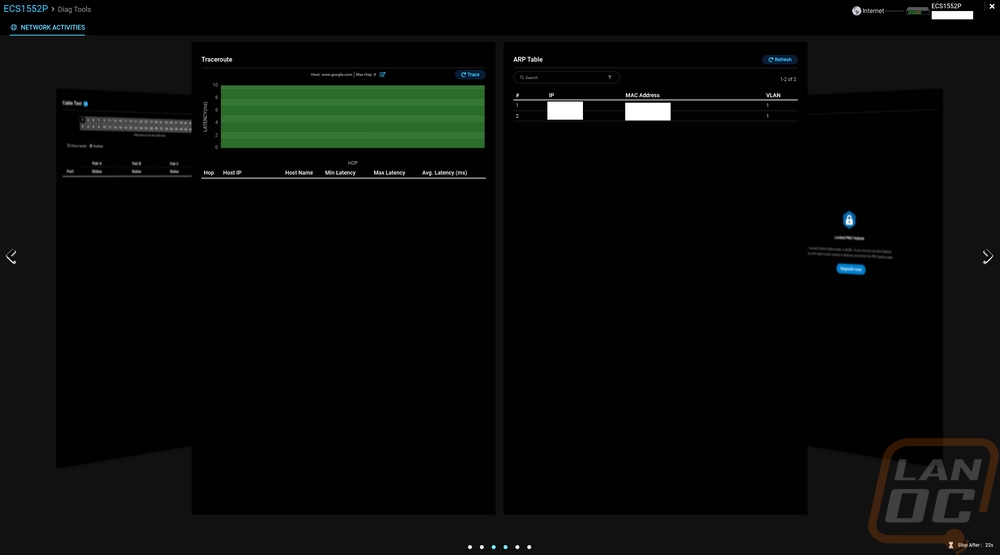
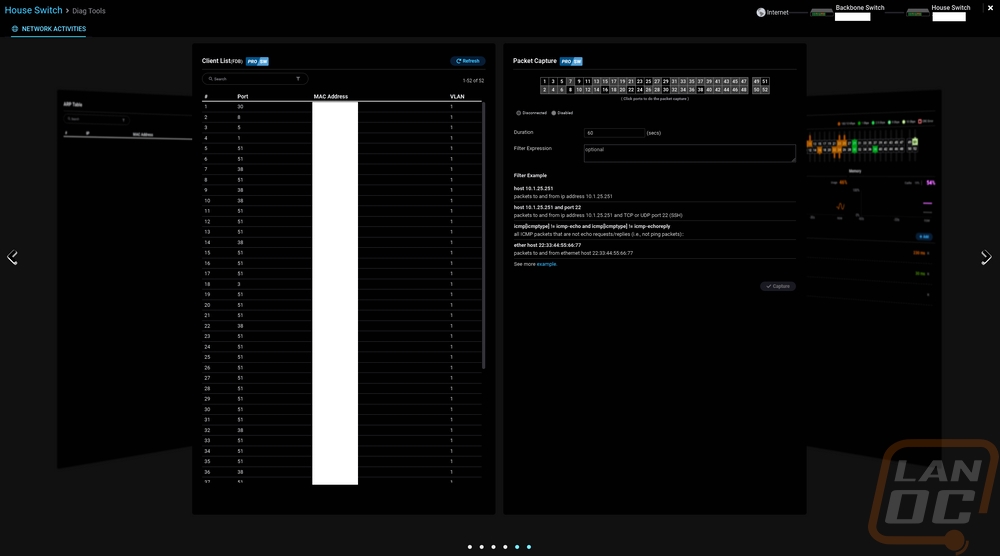
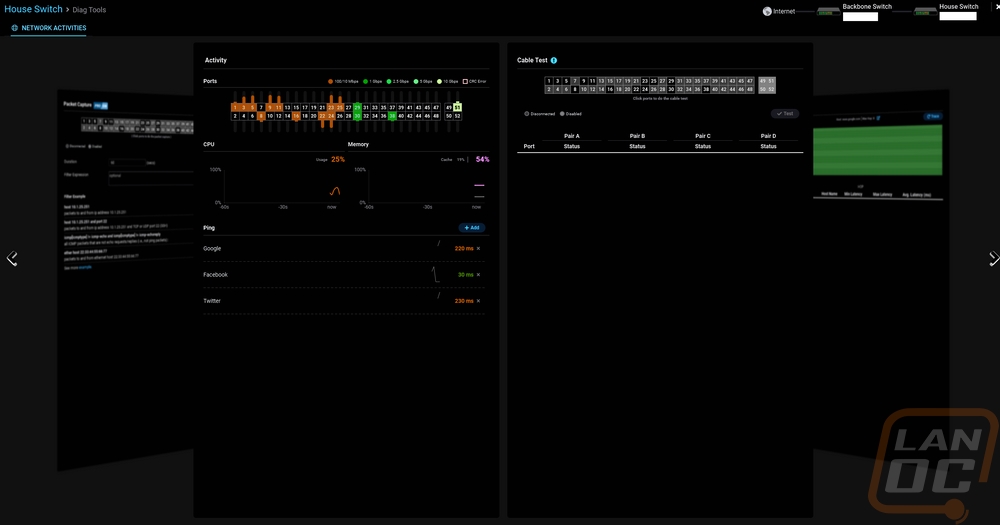
The diagnostic page opens up into a full screen page with flip through pages and is where EnGenius has hidden away a few tools for pinpointing issues. You have a page where you can run a traceroute which also graphs the results out, an ARP listing page, a client list that lists each MAC address that has connected to the switch including what port it was plugged into. The client list is a pro subscription-only feature sadly but it would be nice if your port labels were also listed here, I’ve gone through and tagged each of our ports to what outlet around the house it is plugged into knowing this info could save trouble pinpointing why you have X number of devices that have plugged into one port. Also a pro feature but they have packet capturing as well. You can run cable tests and there is also an activity page that has CPU and memory graphs, graphed out pings to different websites, and up top a picture of all of the ports with bars indicating the port activity and color showing the connection speed. This is the one tool that I think you shouldn’t have to go to the diagnostics page for as it would be great information for your Cloud landing page.
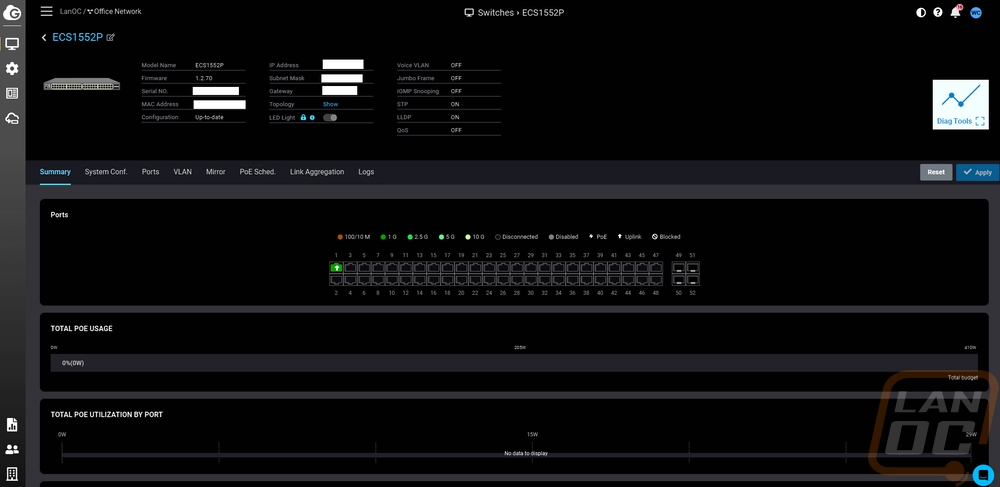
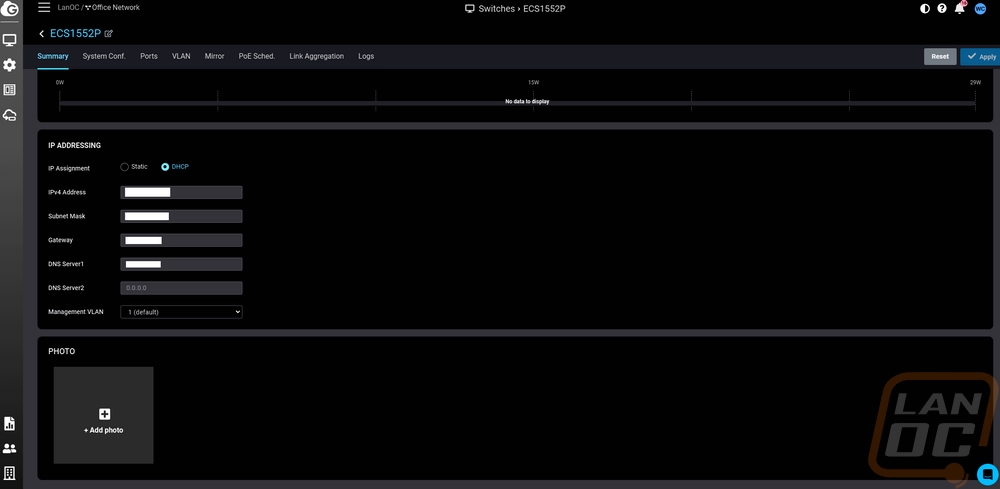
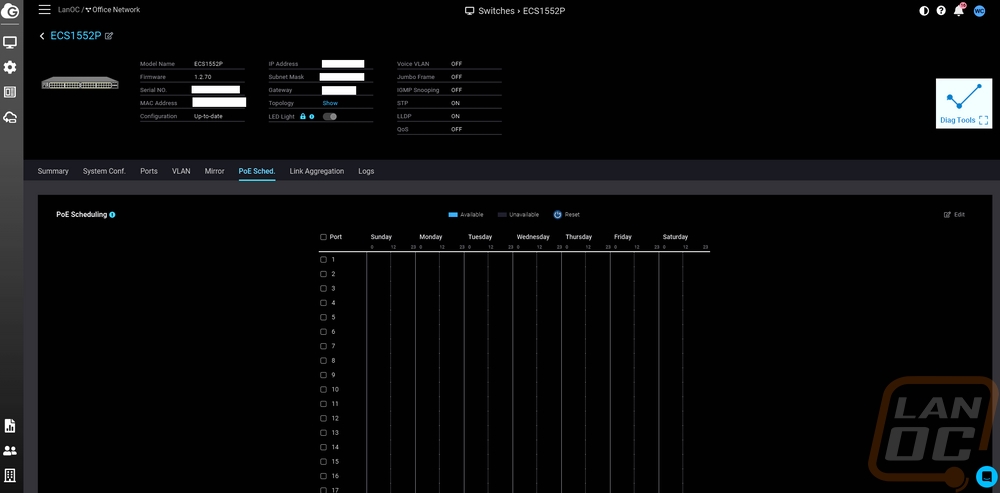
Opening up the details for the ECS1552P opens up a page which has some of the key settings and information up top including your IP address and MAC address. Then below that you have a picture of the ports showing any port with an active connection and its current connection speed. Having that port activity here would be nice as well. Below that you get a total PoE usage and a bar graph below that showing how much power each device is using and what port it is on. Below that you can change the switch to a static IP if needed and add a photo of the switch location or see photos to help find it.
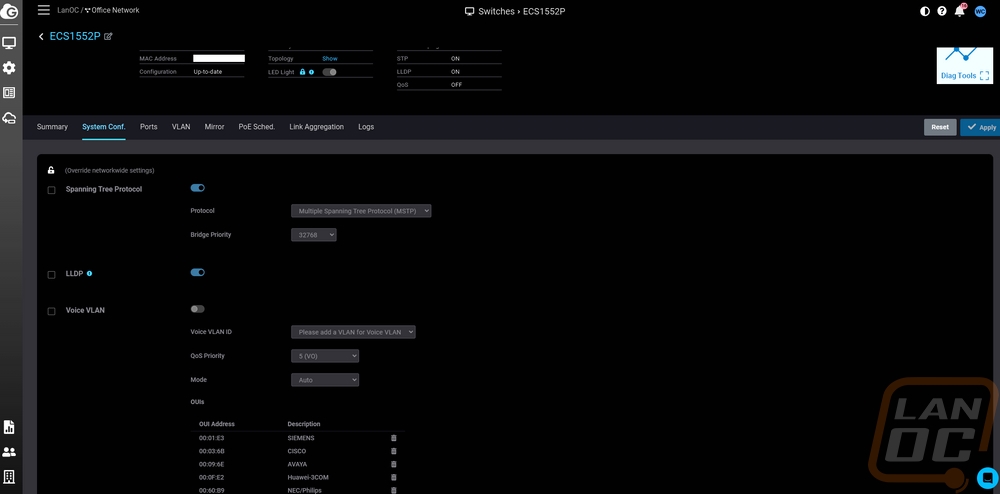
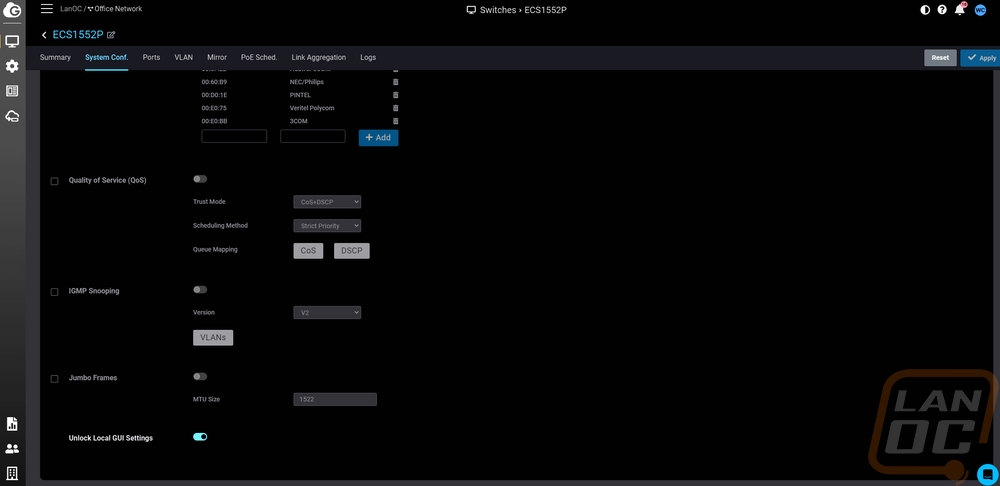
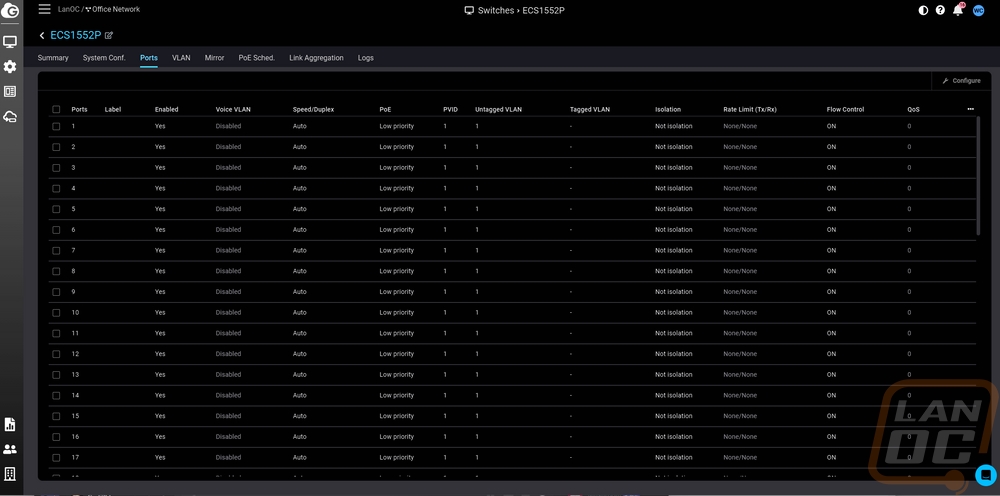
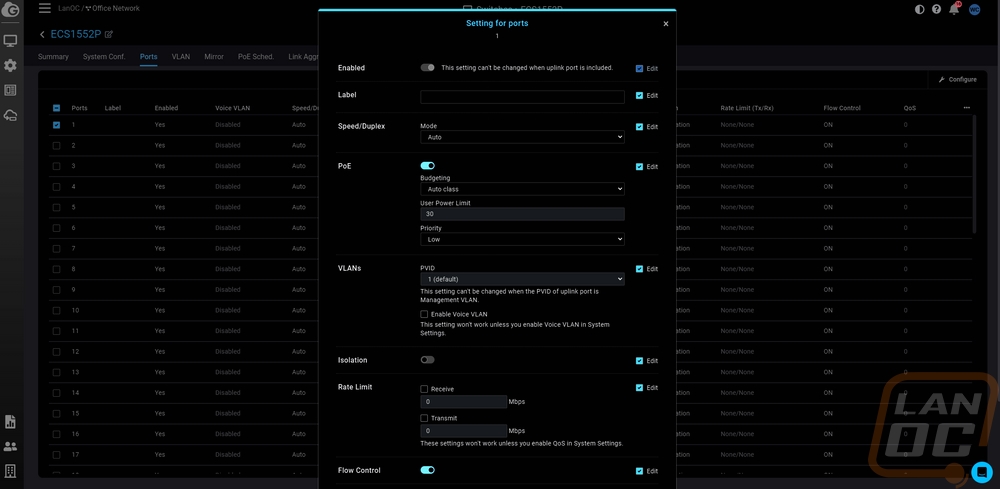
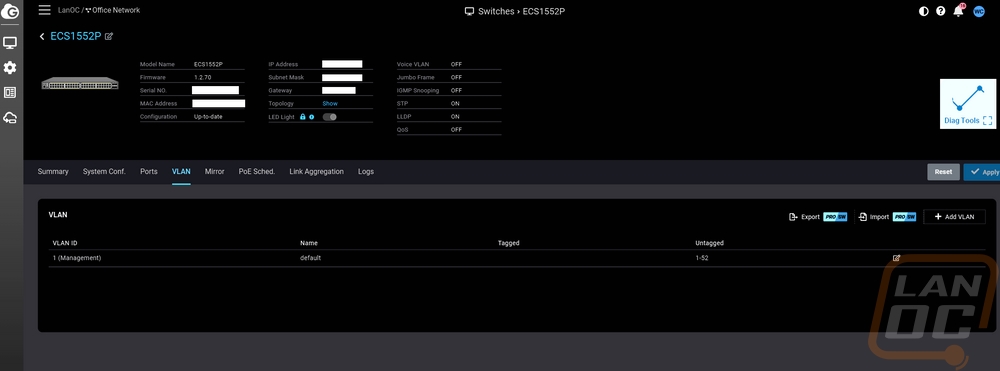
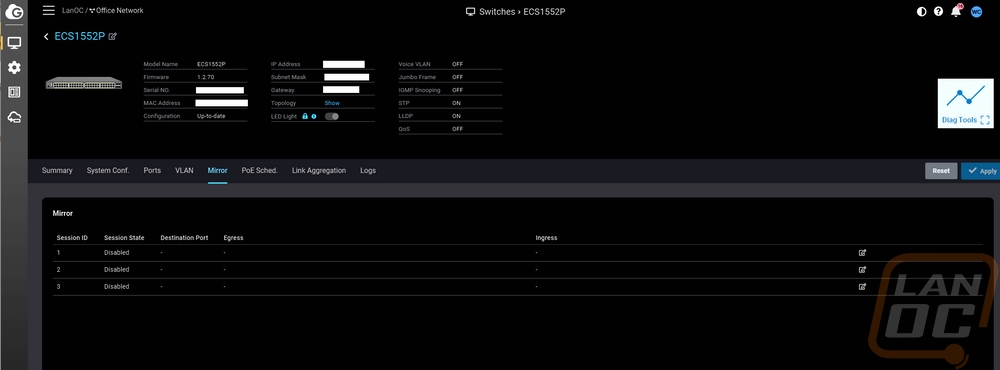
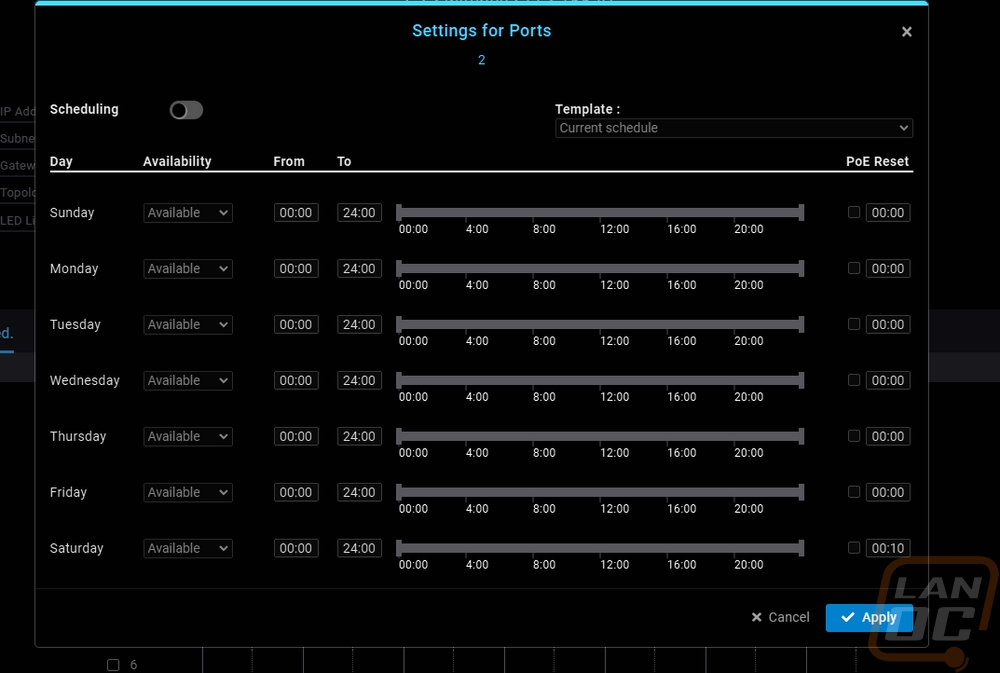
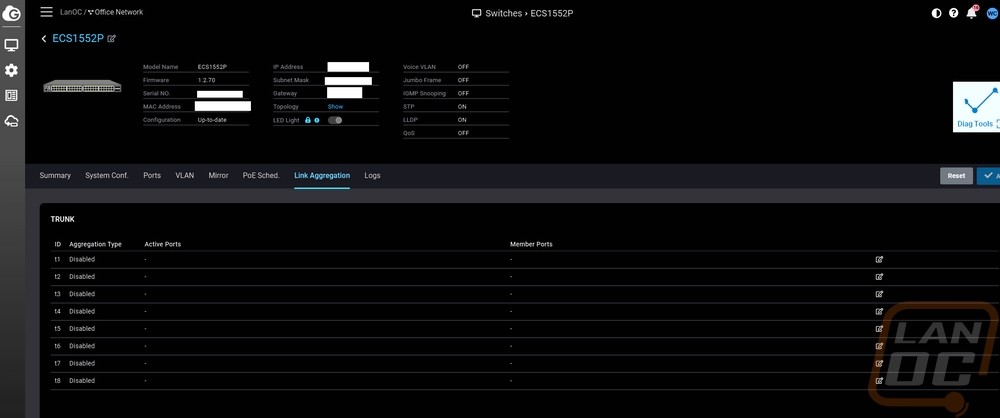
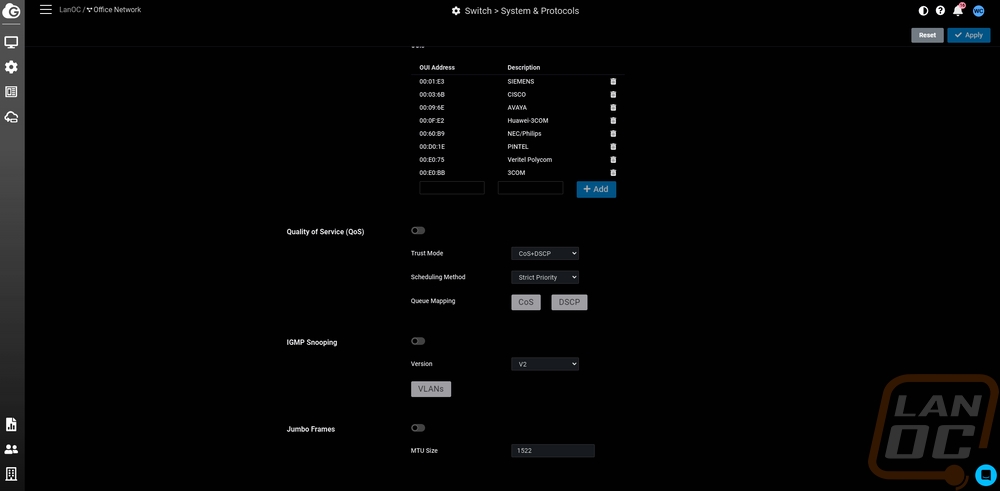
The details page has multiple tabs and the first is a system configuration tab. This isn’t the settings for your entire network, just to this specific switch so any changes here will override your network-wide settings but you can turn on QoS, IGMP, Jumbo Frames, voice VLAN, LLDP, etc. Down at the bottom, you can also turn on the web interface for the switch which you will need to turn on if you want to get into those settings which I will show in just a minute. You have a posts page which lists out every port, the main page shows settings like PoE priority, rate limits, and more. You can click on one or more ports and open up a port setting menu and change these settings to force a port to a specific speed, isolate it from the network, etc. This is also how you can label each port as well. The VLAN page just lists off the network VLANs that you have and you can add them and tag specific ports to that VLAN. The Mirror page slows you to set up Port Mirroring to copy packets from one specific port to another. The PoE scheduling page lists out all of the ports and you can schedule what time of day or days that port will be powered up. You can also set a reset time at a specific time on any or all days. This can be helpful to reset a device to keep it fresh and the scheduling can turn off devices when you are out of the office or the other way around. For example, maybe you don’t want PoE cameras on in some areas when you are there or if your access points aren’t EnGenius Cloud supported you could turn them off outside of business hours to help secure the network. The Link Aggregation page is where you can pair up specific ports for LACP or static link aggregation. Then the last page is a logs page that will list off switch firmware updates and power cycles.
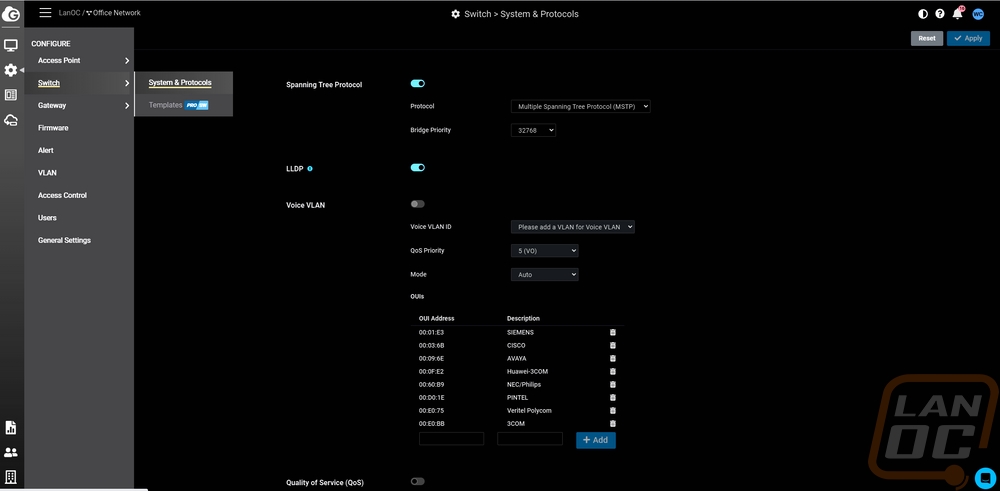
Under the configuration menu, the switch option has the system and protocols page. This is your main network settings for all switches. All of these settings are going to look familiar because these are the same settings on the switch details page. Only any changes here change the setting for ALL switches you connect to the network. You have Spanning Tree Protocol, LLDP, Voice VLAN, Quality of Service, IGMP Snooping, and Jumbo Frames settings each with a few sub-options as well.
For most people, the EnGenius Cloud interface is all you will need. But the ECS1552P does have its own web interface as well just like any other Layer 2+ switch would have. The cloud interface gets you access to some of the switch features but there are other things hidden in the web interface as well.
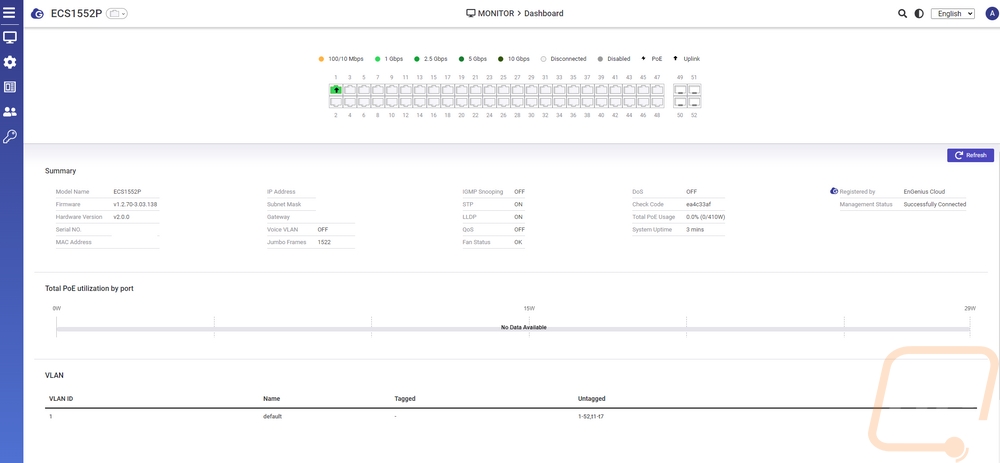
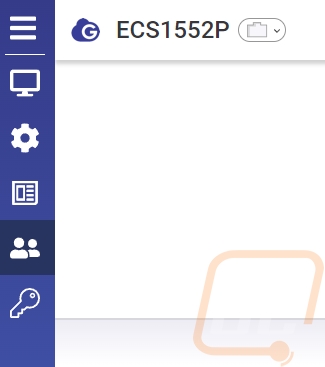
The landing page once you get signed in is the dashboard and like with the details page on the cloud interface this has a line drawing of the switch up at the top which shows the current status of each port including color coding the connection speed and showing which are using PoE and which is the uplink to the rest of the network. I took most of the software images before getting things hooked up to our network so we just have the one port hooked up here. Below that you have a list of some of the main feature settings and things like the IP address and MAC address. Below that you have a breakdown of the PoE use by the port in bar graphs and at the bottom a lit of the VLANs. On the left, the web interface looks a lot like the EnGenius Cloud with its menu icons only mousing over them opening up more options specific to the ECS1552P.
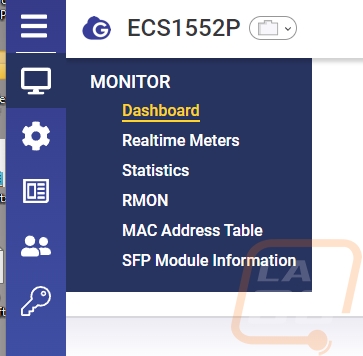
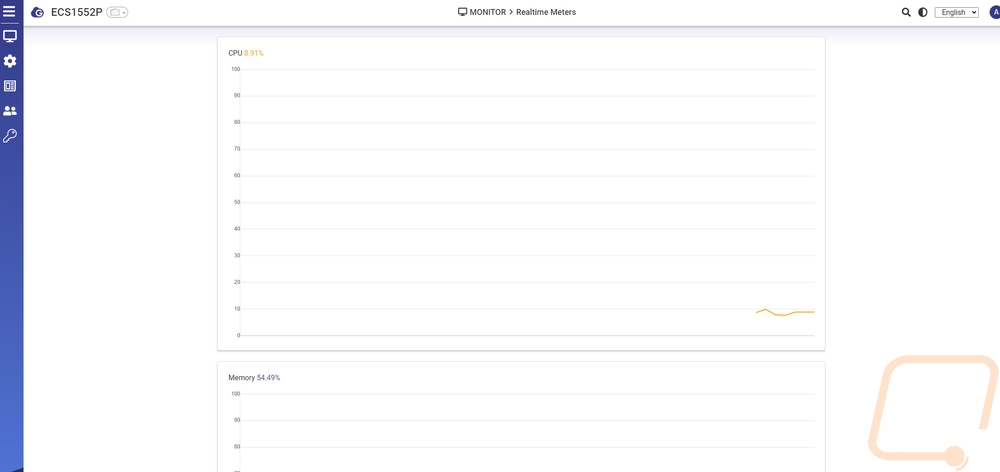
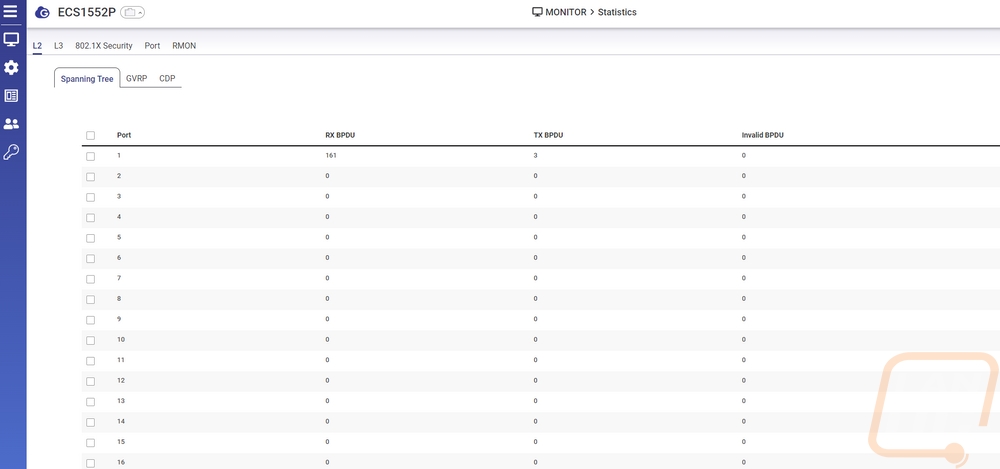
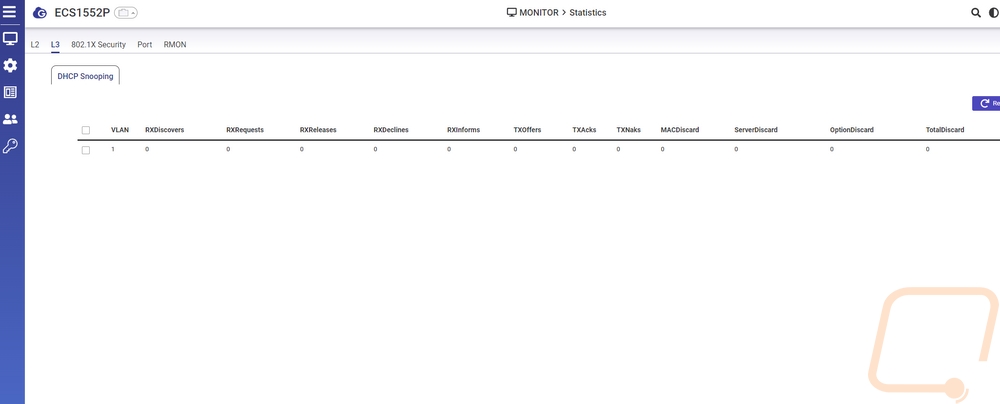
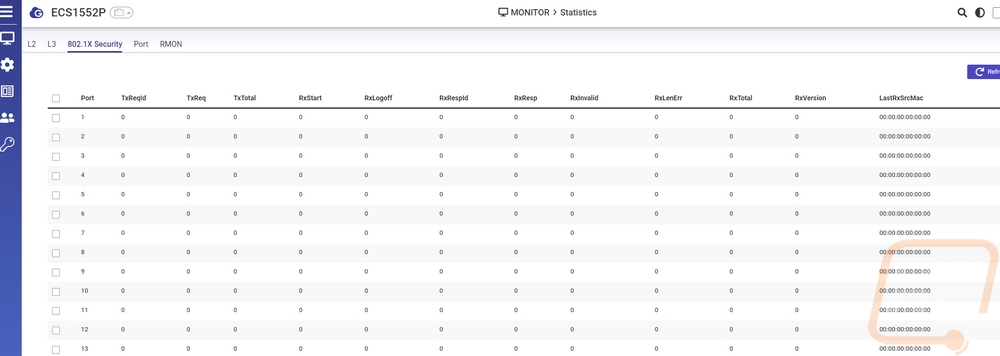
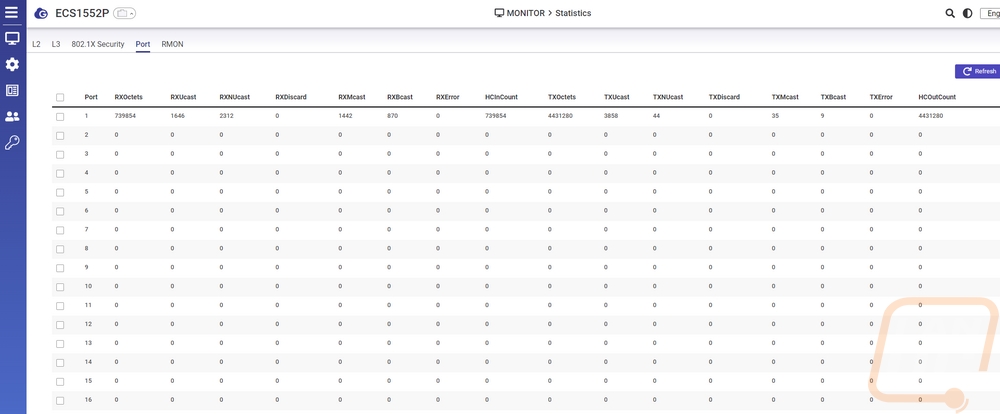
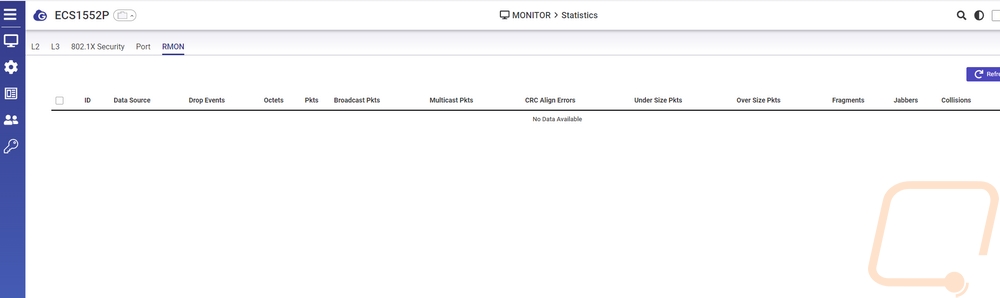
The monitor menu icon has a few options under it including a page that graphs out your real-time meters that show your PCU usage and memory usage. The statistics page breaks things down by layer 2, layer 3, 8702.1X Security, Port, and RMON. Clicking those then opens up a list by the port. For the Layer 2 info for example we can see the BPDU information broken down by transmitted, received, and invalid per port layer 3 dives into DHCP snooping. Then the port page shows the packet counts.
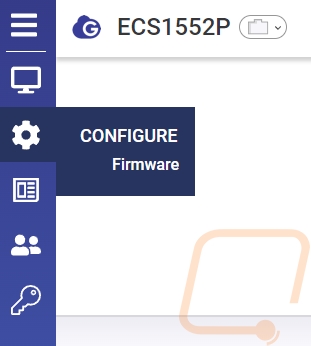
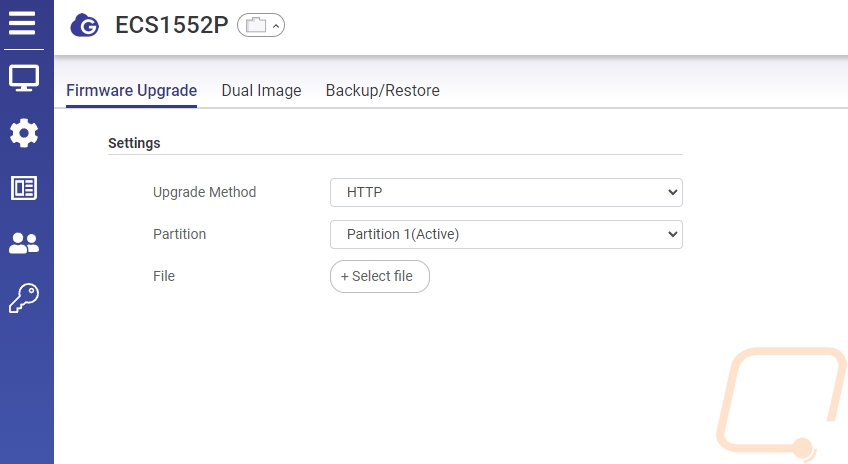
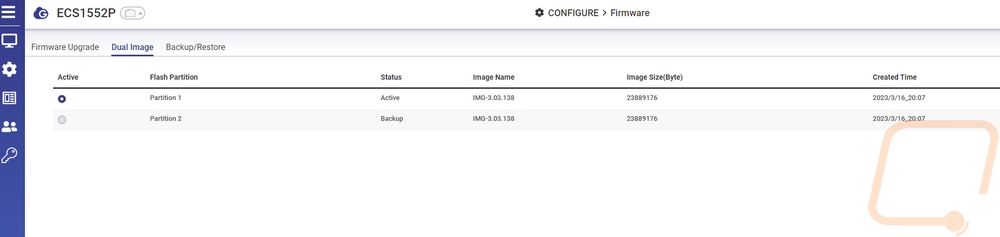
Under the configure menu option you can upgrade the firmware manually which EnGenius does have on their website and it lets us see the dual BIOS images and switch between the two if needed. You can also backup and restore system settings here.
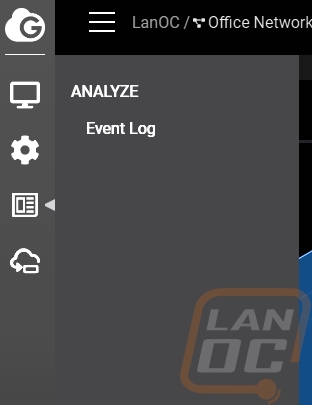
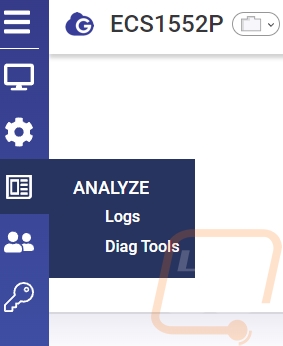
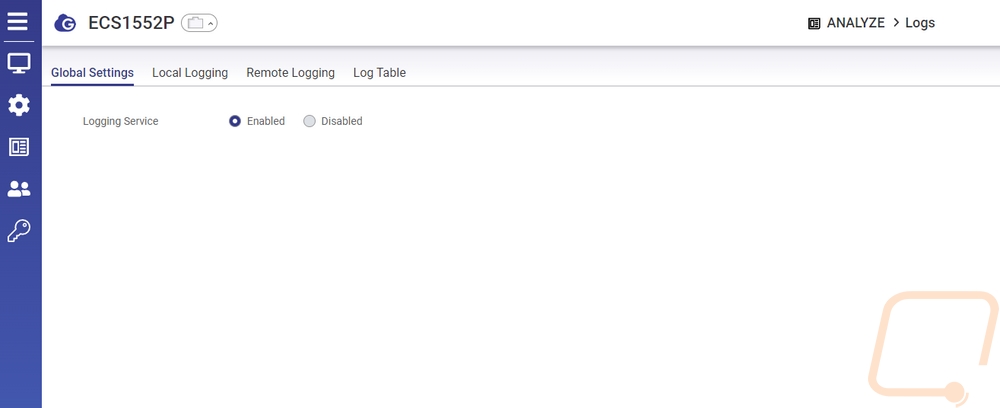
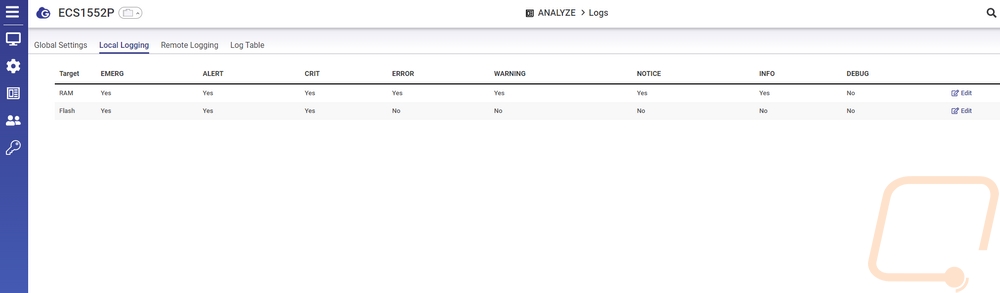
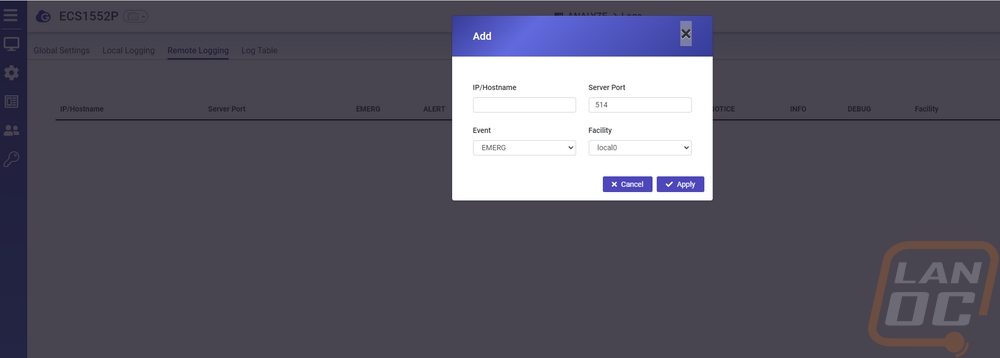
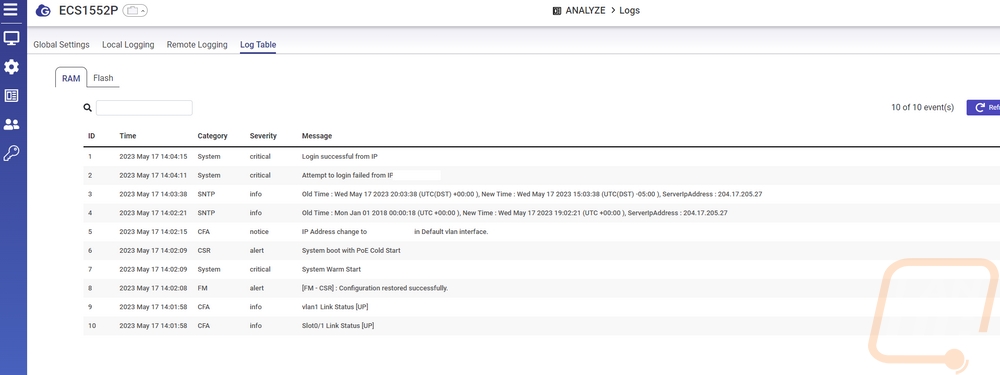
The Analyze page has a whole section dedicated to logs whereas the Cloud just has basic boot, reboot, and firmware updates shown on the logs. Here you can get into the full log table and see each login, IP address change, and more. You can turn the logging service on or off and you can also set up remote logging.
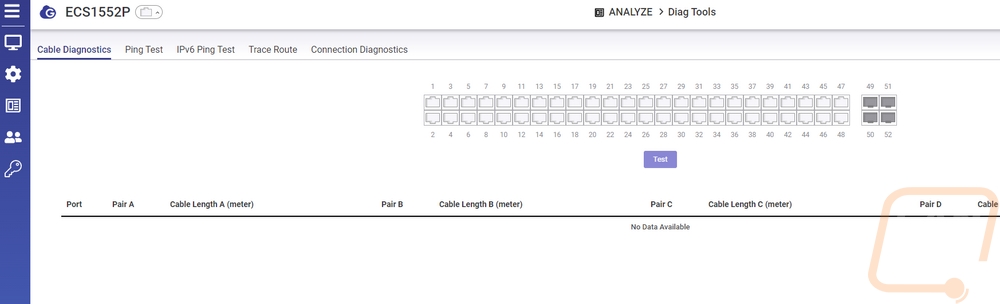
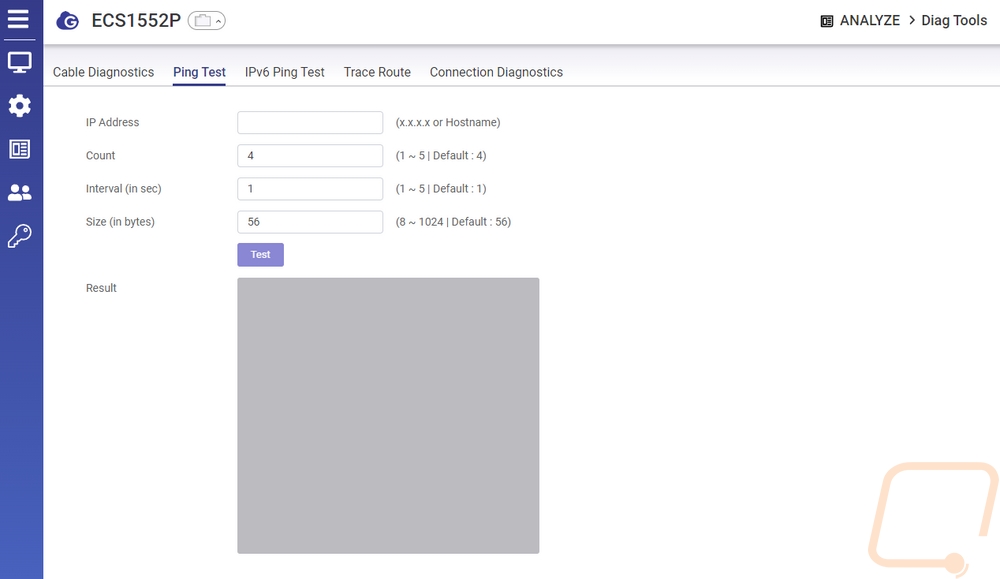
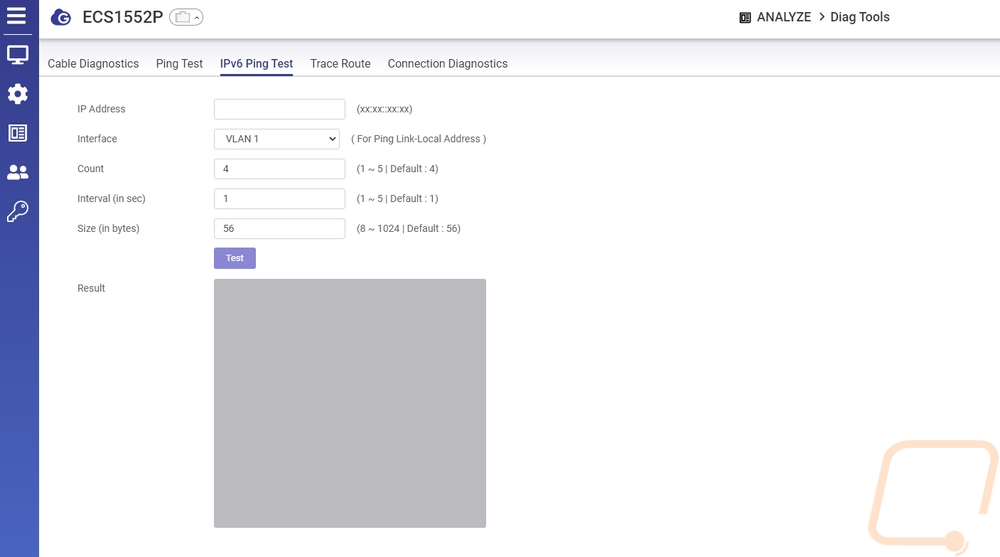
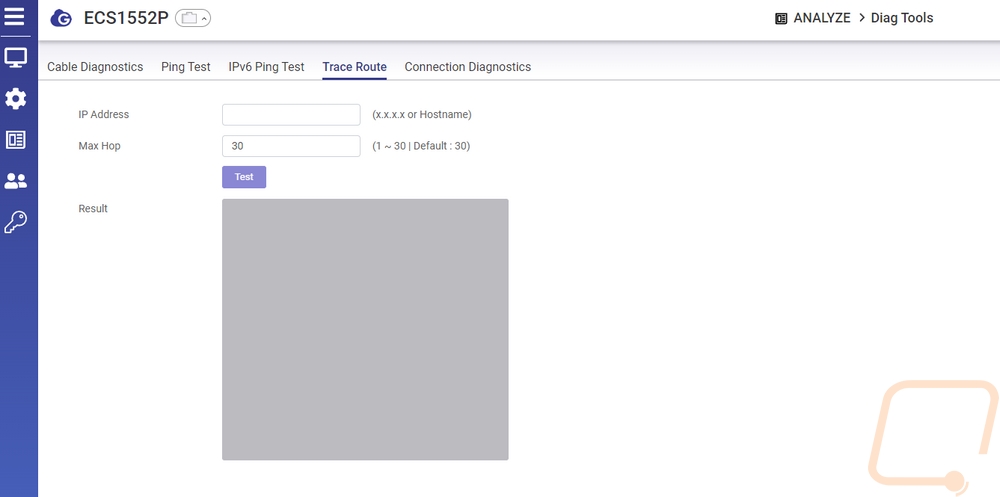
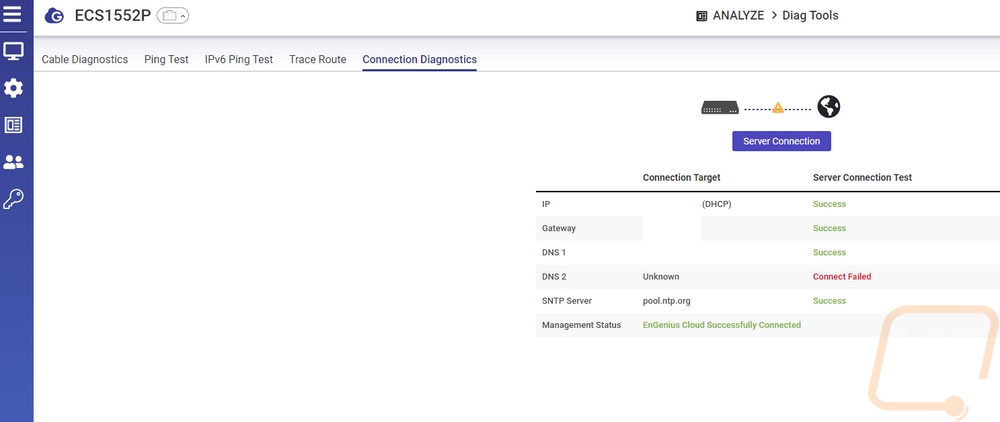
The web interface does have its own diagnostic tool section as well. They just don’t have it opening up to a full screen and each is under its own page. The cable test is there, ping test, and traceroute. There is also a basic page that just tests the connection to servers and checks the cloud service connection.
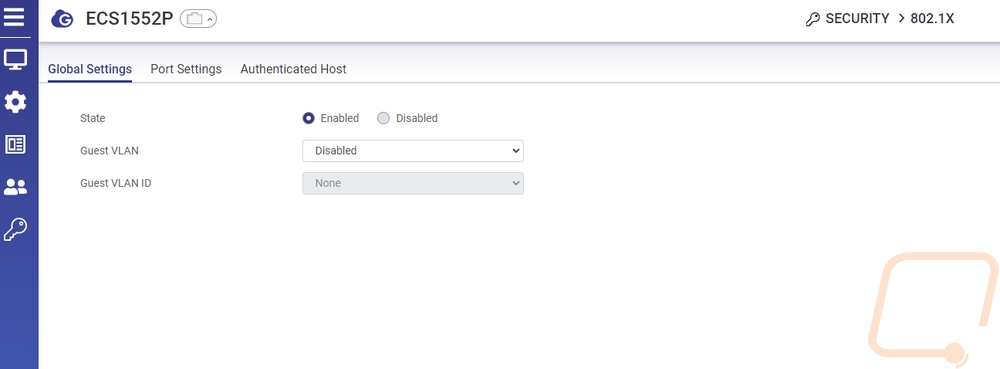
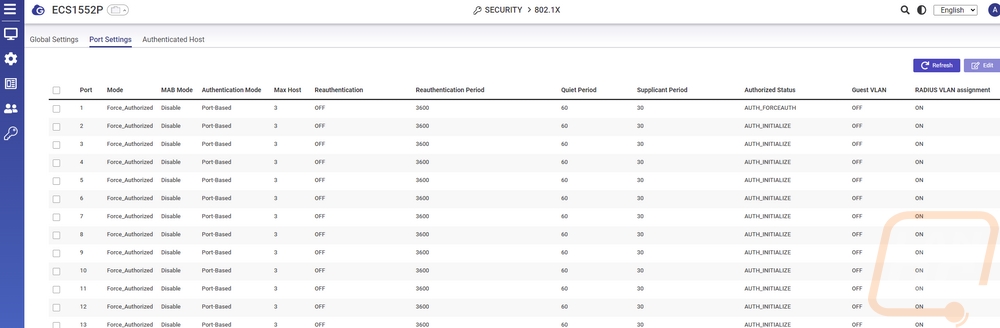
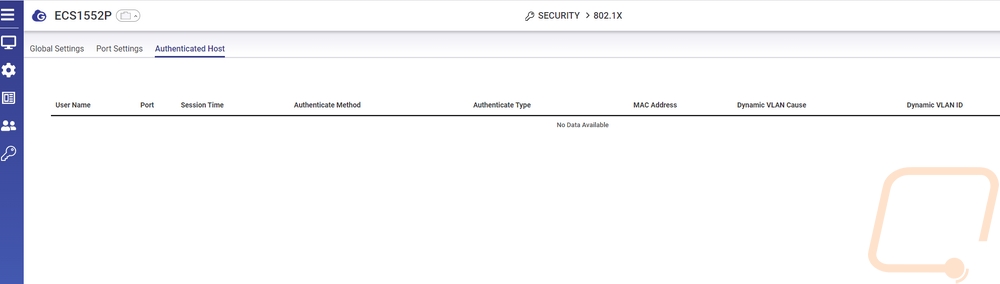
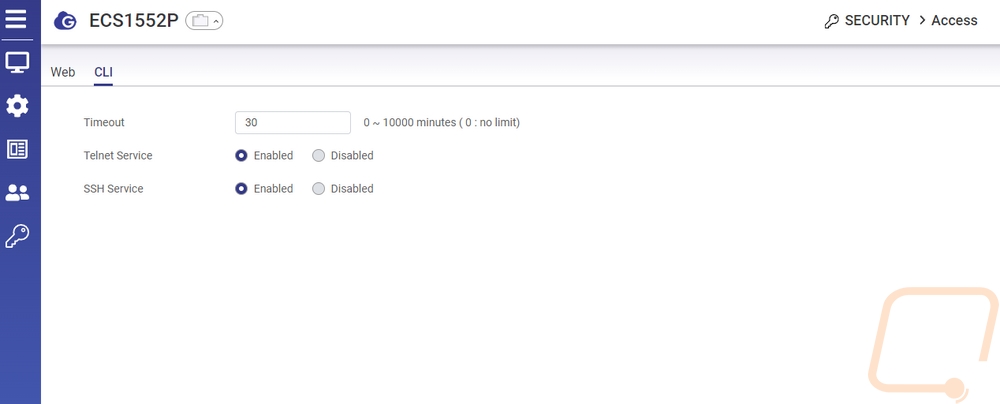
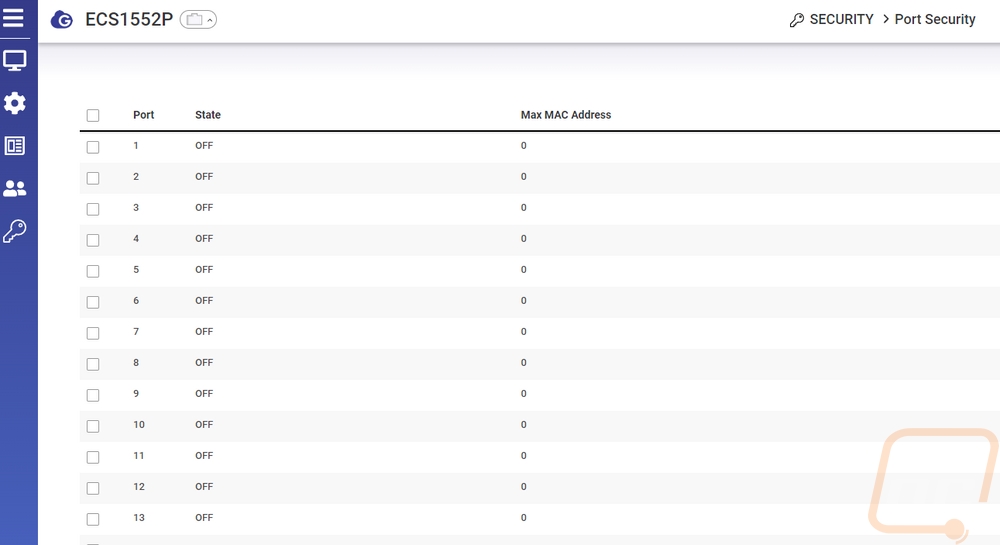
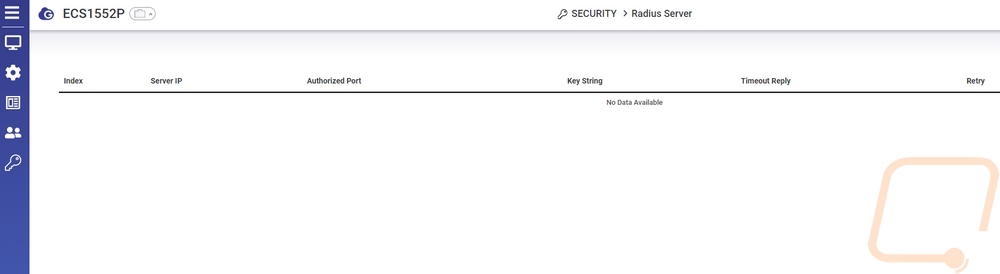
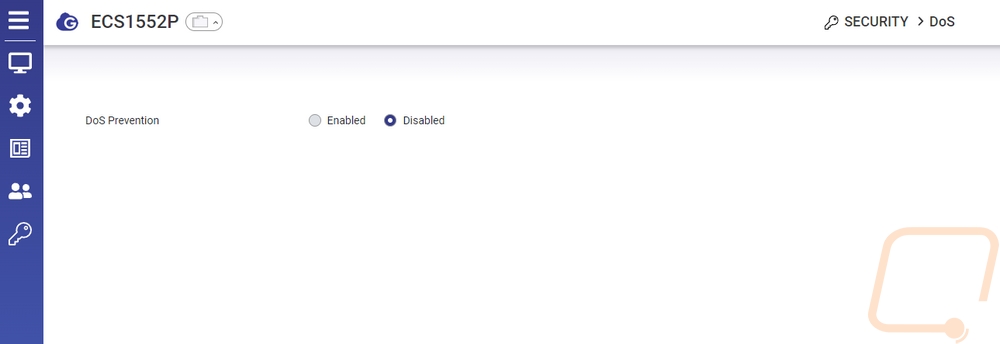
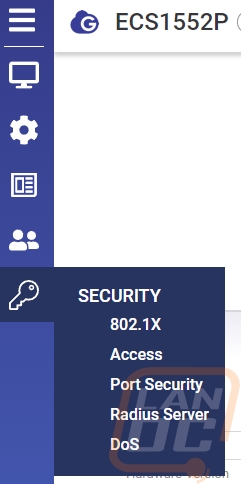
They also have a section focused on security this starts off with the option to set a guest VLAN. The port settings let you set up a quiet period, set up the reauthentication period, and even turn on MAC Authentication Bypass and use a radius server to authenticate your device's MAC address before it will allow traffic.