Performance
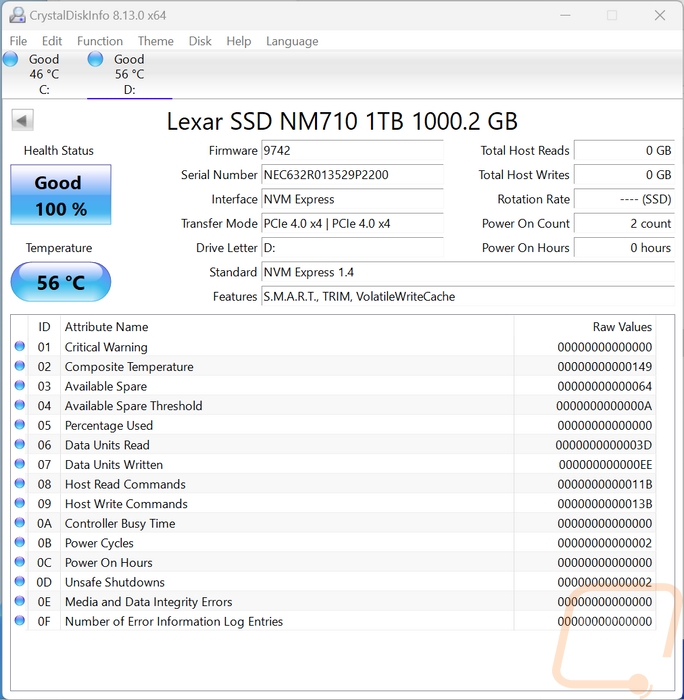
Before getting into testing the Lexar NM710 1TB I did check the drive out using CrystalDiskInfo just to confirm that it was connected using the correct interface. It was connected at PCIe 4.0 x4 so we are good there. I also like to do this to document the firmware revision we are running on for testing because those do change from time to time as well.
My first round of testing was to run the Lexar NM710 1TB through Crystal Disk Mark 8. Sequential testing is usually a best-case scenario and is what companies use for their specifications and on the front of the box to advertise drive speeds which in the case of the NM710 the box and the specifications both touch up speeds of up to 5000 MB/s read speed for the 500 GB and 1TB model with the 2TB model being a little slower so I was curious to see if the NM710 would reach that number in CrystalDiskMark. Surprisingly it came in at 5101 MB/s for its read speeds and 4447 MB/s for the writes out performing expectations for the read speeds and being close on the wrist speeds.
|
PCIe 3.0 |
PCIe 4.0 |
PCIe 5.0 |
||
|
Crystal Disk Mark 8 - Read |
SEQ1M Q8T1 |
SEQ128K Q32T1 |
RND4K Q32T16 |
RND4K Q1T1 |
|
WD Blue SN550 1TB |
2444.53 |
2077.36 |
1075.88 |
57.88 |
|
Sabrent Rocket Q4 2TB |
4939.59 |
2871.47 |
1034.52 |
74.53 |
|
Corsair MP400 1TB |
3432.77 |
1889.56 |
713.28 |
61.42 |
|
Corsair Force MP600 2TB |
4828 |
1543.31 |
901.83 |
41.49 |
|
Sabrent Rocket 4.0 Plus 1TB |
6468.33 |
2712.53 |
455.24 |
54.68 |
|
Crucial P5 Plus 1TB |
6697.19 |
4358.63 |
1113.7 |
69.76 |
|
Kingston FURY Renegade 2TB |
6592.75 |
3093.11 |
1085.23 |
55.14 |
|
Patriot P400 1TB |
5036.9 |
3518.47 |
1059.71 |
88.06 |
|
WD Blue SN570 1TB |
3569.34 |
2681.32 |
1046.46 |
65.75 |
|
WD Black SN770 1TB |
5223.32 |
4958.17 |
1034.35 |
82.24 |
|
MSI Spatium M480 Play 2TB |
6979.03 |
4267.59 |
1315.25 |
81.22 |
|
Viper Gaming VPR400 |
5163.46 |
3880.75 |
1030.81 |
85.35 |
|
Crucial P3 Plus 2TB |
5041.44 |
2799.96 |
1107.97 |
56.56 |
|
Crucial P3 2TB |
3511.18 |
2379.76 |
957.63 |
45.42 |
|
Fantom Drives Venom8 2TB |
6989.96 |
4216.08 |
1086.16 |
79.59 |
|
Lexar Professional NM800 Pro 2TB |
7155.05 |
3479.95 |
781.64 |
84.56 |
|
Crucial T700 2TB |
12399.57 |
9265.64 |
826.54 |
98.49 |
|
Lexar NM710 1TB |
5101.53 |
4683.79 |
839.35 |
72.24 |
|
PCIe 3.0 |
PCIe 4.0 |
PCIe 5.0 |
||
|
Crystal Disk Mark 8 - Write |
SEQ1M Q8T1 |
SEQ128K Q32T1 |
RND4K Q32T16 |
RND4K Q1T1 |
|
WD Blue SN550 1TB |
2007.63 |
2006.4 |
776.4 |
290.25 |
|
Sabrent Rocket Q4 2TB |
3633.71 |
2568.7 |
920.84 |
385.73 |
|
Corsair MP400 1TB |
2021.09 |
2017.63 |
1196.42 |
262.36 |
|
Corsair Force MP600 2TB |
992.38 |
982.78 |
996.22 |
276.26 |
|
Sabrent Rocket 4.0 Plus 1TB |
5241.89 |
5225.25 |
921.51 |
402.26 |
|
Crucial P5 Plus 1TB |
5025.83 |
4880.38 |
884.12 |
240.78 |
|
Kingston FURY Renegade 2TB |
6899.76 |
5831.06 |
1083.12 |
367.6 |
|
Patriot P400 1TB |
4830.94 |
4813.27 |
846.34 |
307.12 |
|
WD Blue SN570 1TB |
3147.13 |
2893.72 |
909.47 |
234.17 |
|
WD Black SN770 1TB |
4983.07 |
4980.59 |
1149.36 |
295.13 |
|
MSI Spatium M480 Play 2TB |
6870.73 |
5863.14 |
1062.32 |
357.02 |
|
Viper Gaming VPR400 |
4780.82 |
4775.74 |
838 |
285.02 |
|
Crucial P3 Plus 2TB |
4388.26 |
4387.54 |
989.42 |
2967.35 |
|
Crucial P3 2TB |
3244.52 |
2712.72 |
630.77 |
261.09 |
|
Fantom Drives Venom8 2TB |
4132.6 |
5850.19 |
844.52 |
315.7 |
|
Lexar Professional NM800 Pro 2TB |
6629.2 |
5645.52 |
589.6 |
274.14 |
|
Crucial T700 2TB |
11692.96 |
9500.07 |
710.93 |
363.19 |
|
Lexar NM710 1TB |
4447.81 |
2640.5 |
686.8 |
283.91 |
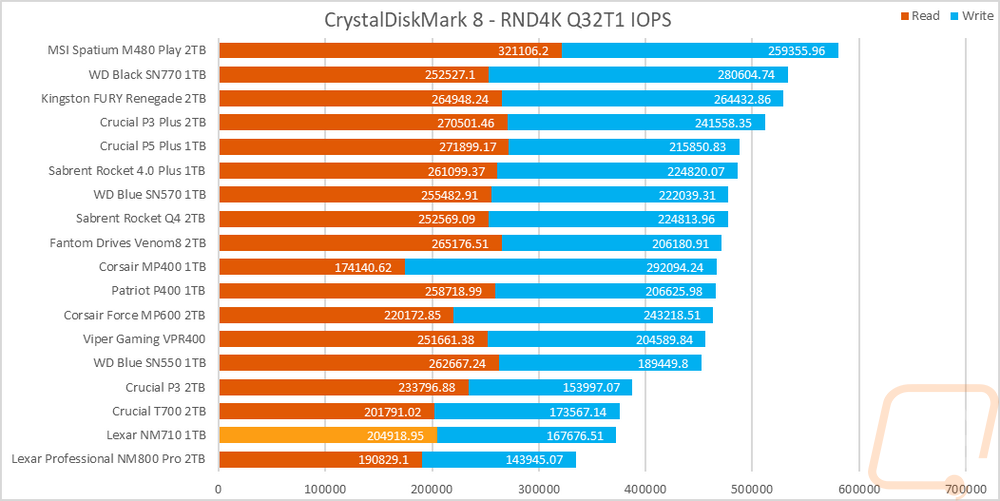
While testing in CrystalDiskMark 8 I did also check out the drive’s IOPS performance with the random 4k queue depth of 32 and 1 thread results. I stacked the read and write performance together here because I do believe that the overall drive performance is important, not just one result or the other. The NM710 is down near the bottom of our chart with just the NM800 pro sitting below it. The read IOPS were higher than the T700 but it was well behind a lot of the other drives there. The write IOPS were faster than the Crucial P3 Plus but when combined it put it down near the bottom.
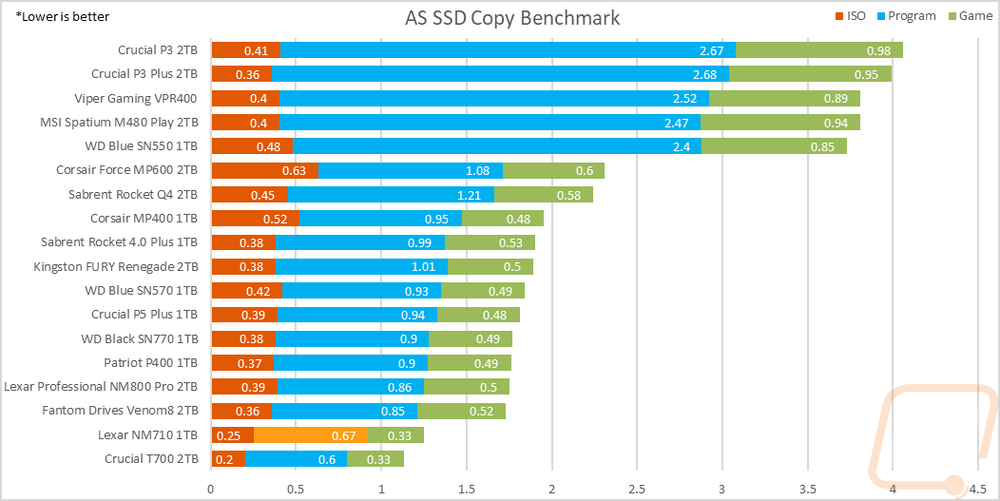
In AS SSD, I skipped over the standard test because it is very similar to the CrystalDiskMark tests I prefer to check out one of its sub-tests, the copy benchmark. This moves three files, one that is an ISO, one that is a program, and then a game, and times how long each takes. With these being timed, lower is better here. I have all three results stacked to see which drives are best overall. The NM710 is down at the bottom of the chart again here but this time around that is a good thing. All three of the file transfers were faster than most with just the new PCIe 5.0 drive performing better and this was WELL beyond the P3 Plus that is it competing with which was one of the slowest drives on this test.
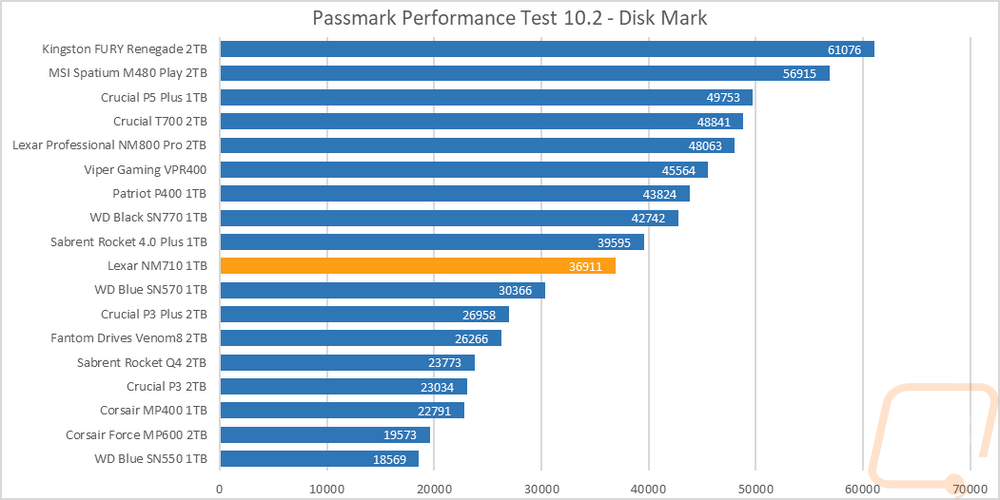
Next up with PassMark Performance Test 10, I ran their combined synthetic benchmark to get a look at their DiskMark rating. The NM710 scored a 36911 which puts it right in the middle of the pack of the drives tested but a full 10,000 points ahead of the Crucial P3 Plus that it is designed to compete with but below the SN770 that it is also competing with.
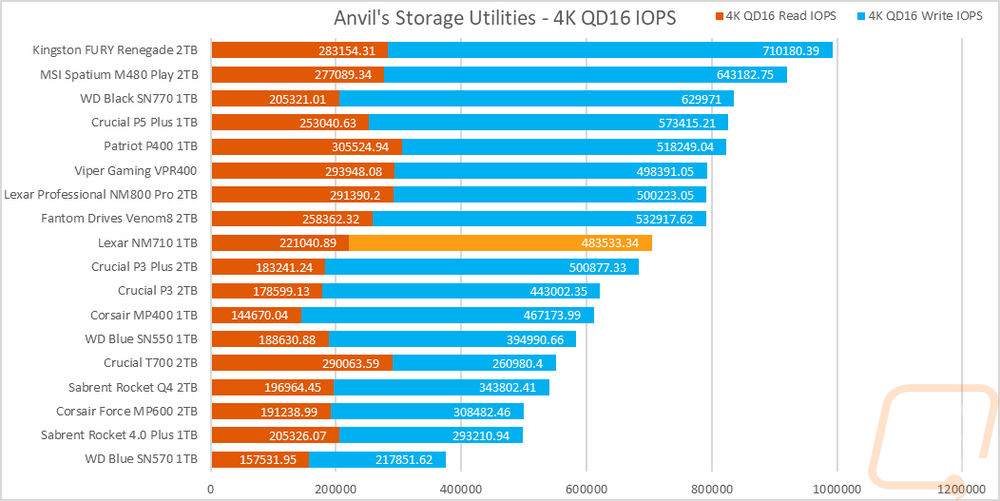
I then changed my focus back over to IOPS performance and ran the NM710 in Anvil’s Storage Benchmark focusing on the 4k queue depth of 16 results from the main test. The read IOPS for the NM710 were middle of the part but its write IOPS here did well which put it right in the middle of the pack overall and sitting just above the P3 Plus.
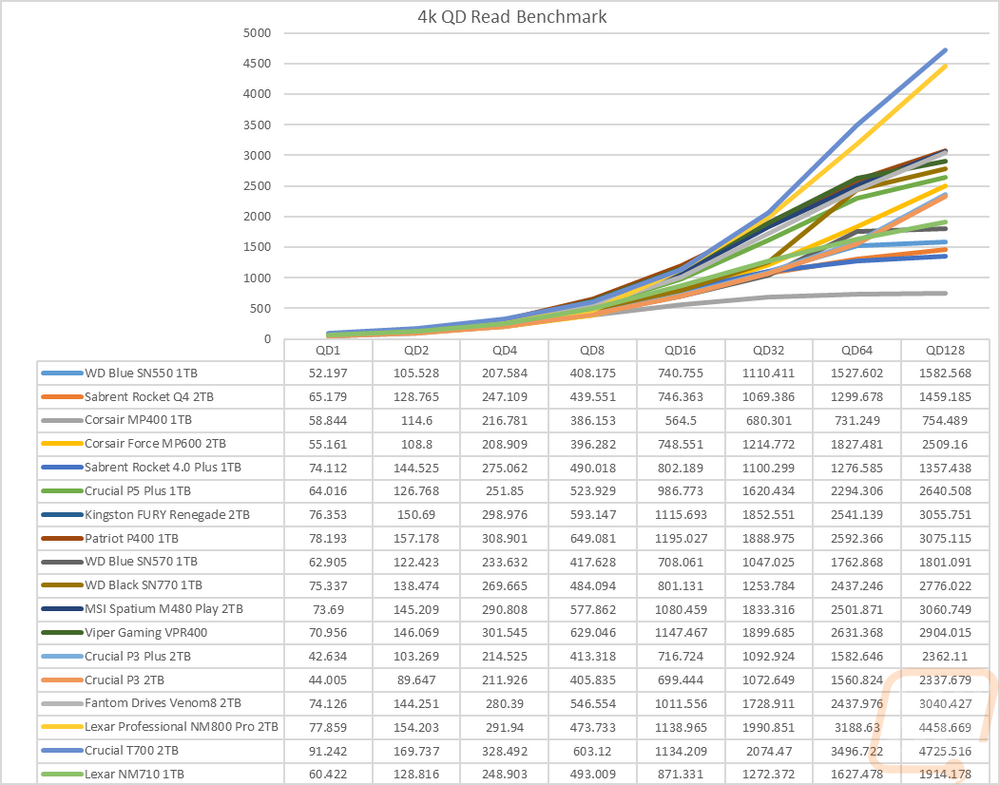
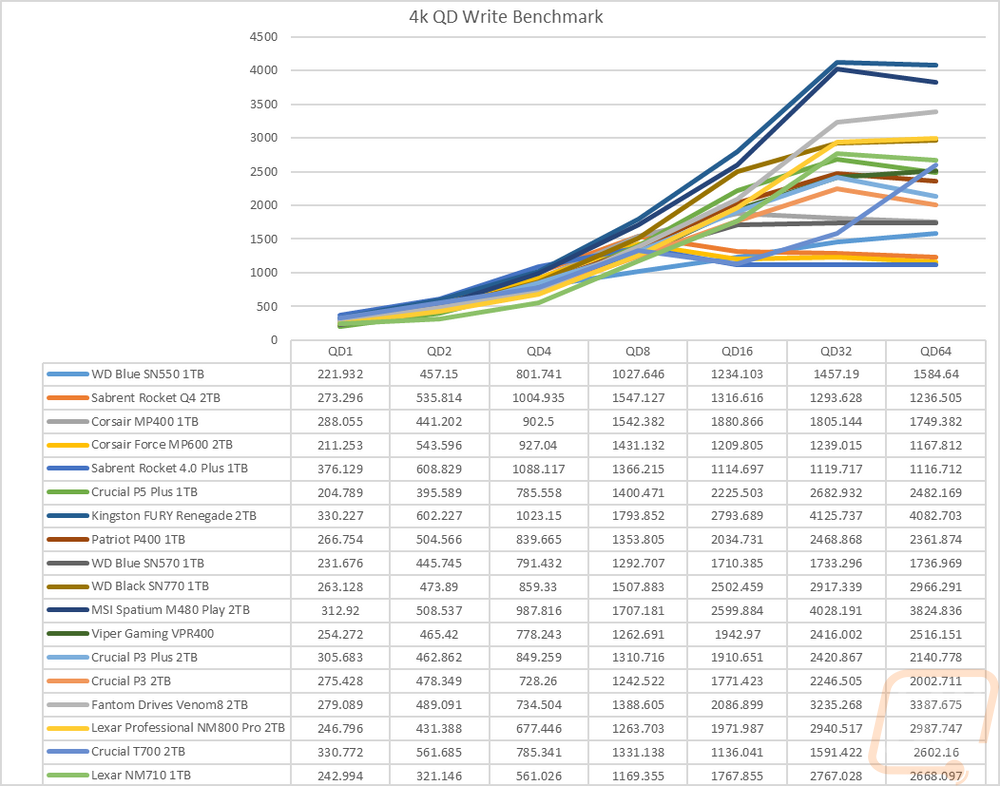
Sticking with Anvil’s Storage Utilities I did a few more tests. Here I wanted to check out how the drive would react to different queue depths so with the file size set to 4K I ran tests ramping up double each time starting at 1 and up to 128 for reads and 64 for writes. This lets us see if the controller gets overloaded. For the read, queue depth tests the NM710 did fine staying in the middle of the pack until after the 8 queue depth test where it then starts to drop off slightly. It is still faster than the P3 Plus but the SN770 is noticeably faster. For the write queue depth test we see the same thing but this time the NM710 is ahead of the middle of the pack slightly on the higher queue depths, still sitting ahead of the P3 Plus and behind the SN770.
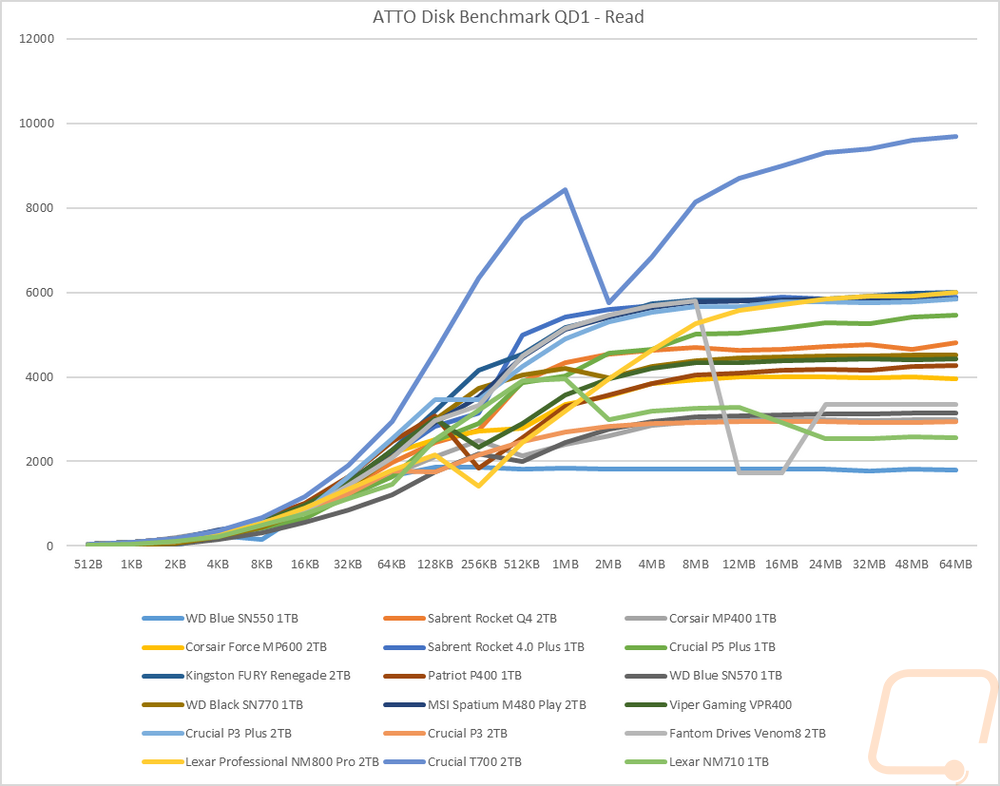
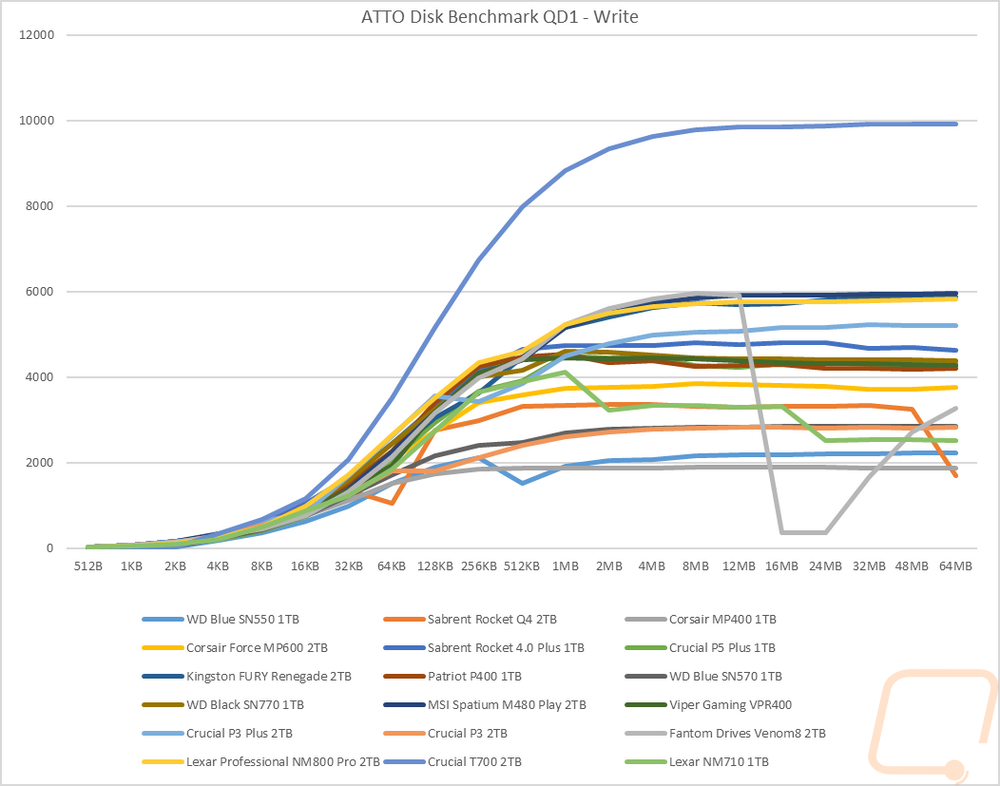
For ATTO Benchmark I set it to a queue depth of just 1 but ramped up the file size slowly to see how it would affect performance. For the read test in ATTO, the NM710 did well up until the 1MB size where it drops down to close to 3000 MB/s and gets even lower as the size increases. The write test performance was almost the same, dropping down at the same point and continuing to drop a few times after that as well.
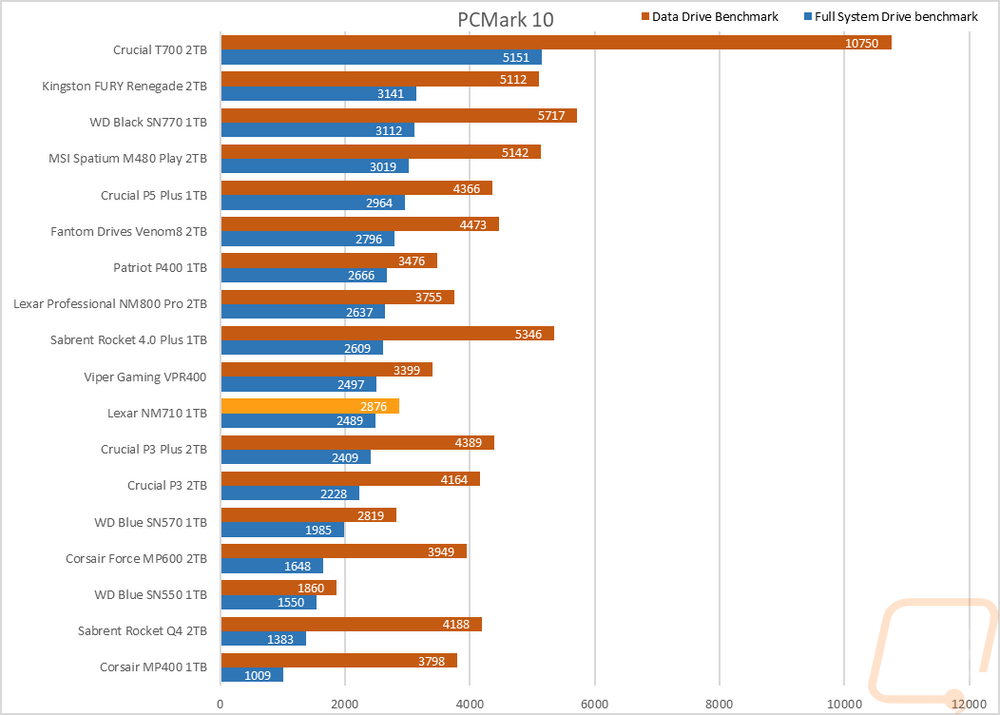
Next up I wanted to look at more real-world performance and for this, I started with PCMark 10 which has an overall full system benchmark for storage, and then one focused on data storage drives. In the full system drive benchmark, the NM710 was middle of the pack. Then for the data drive benchmark, it struggled and was one of the slowest drives tested with just the PCIe 3.0 drives being slower.
For more real-world resting, I did our file transfer tests. You don’t get any more real-world than this. For each drive, I copied the folder filled with files to the drive tested documenting what its transfer rate is near the end of the transfer. I used three file types, movies which are large single files, a folder filled with RAW and JPG photos, and then a folder filled with Word documents. Starting with the movie files the NM710 transferred the files at 2610 Mb/s which is the second fastest of the drive tested. The photos were slower at 1630 MB/s but this was the fastest even outperforming the new PCIe 5.0 drive in both tests. Then for the last test, the NM710 did even better compared to everything else with the document file transfer running at 18.4 MB/s which may sound slow but is quick for small files like that.
|
Windows 11 File Transfers |
Movies |
Pictures |
Documents |
|
WD Blue SN550 1TB |
852 |
937 |
2.42 |
|
Sabrent Rocket Q4 2TB |
2720 |
1140 |
5.75 |
|
Corsair MP400 1TB |
2140 |
996 |
2.57 |
|
Corsair Force MP600 2TB |
1250 |
816 |
2.83 |
|
Sabrent Rocket 4.0 Plus 1TB |
2120 |
254 |
1.63 |
|
Crucial P5 Plus 1TB |
2060 |
1030 |
5.2 |
|
Kingston FURY Renegade 2TB |
2330 |
857 |
2.58 |
|
Patriot P400 1TB |
2070 |
981 |
2.86 |
|
WD Blue SN570 1TB |
602 |
992 |
5.14 |
|
WD Black SN770 1TB |
2260 |
605 |
2.52 |
|
MSI Spatium M480 Play 2TB |
1930 |
905 |
5.62 |
|
Viper Gaming VPR400 |
2360 |
1300 |
2.61 |
|
Crucial P3 Plus 2TB |
2240 |
1080 |
6.92 |
|
Crucial P3 2TB |
1990 |
1100 |
6.46 |
|
Fantom Drives Venom8 2TB |
1750 |
1190 |
4.45 |
|
Lexar Professional NM800 Pro 2TB |
2230 |
879 |
4.39 |
|
Crucial T700 2TB |
2540 |
1520 |
4.57 |
|
Lexar NM710 1TB |
2610 |
1630 |
18.4 |
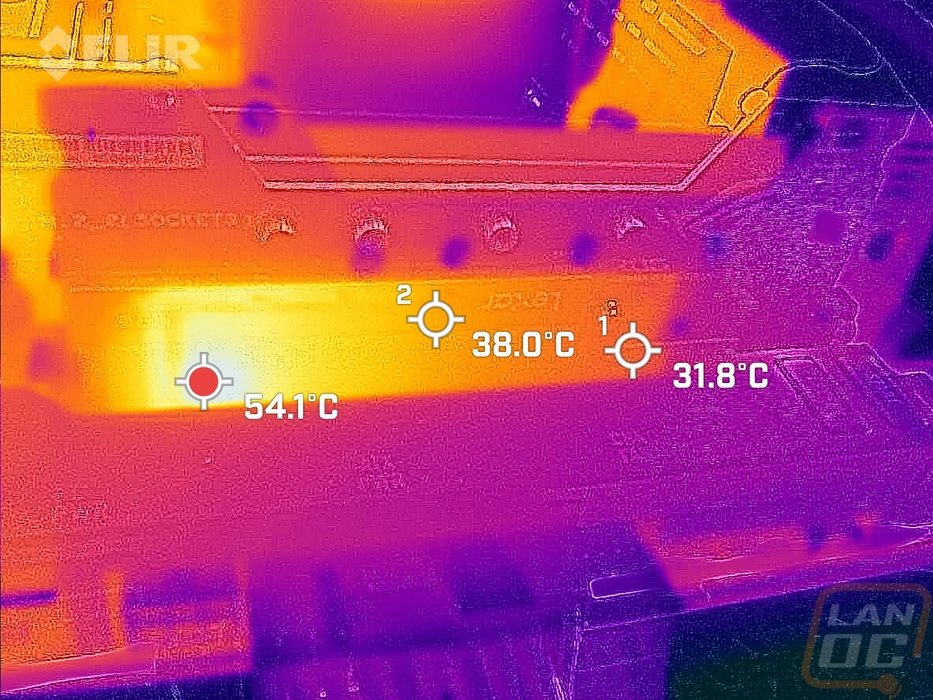
Before finishing up my testing I ran the NM710 for a half hour in a linear read speed test using AIDA64. I did this to heat things up so we could get a look at things through the thermal camera and there weren’t any big surprises here. The controller which is close to the end near the M.2 connection creates all of the heat and is the main hot spot. Even without a heatsink the drive isn’t overheating or having any issues and with the controller on the far end none of the NAND is being heated up by it by much.