Performance
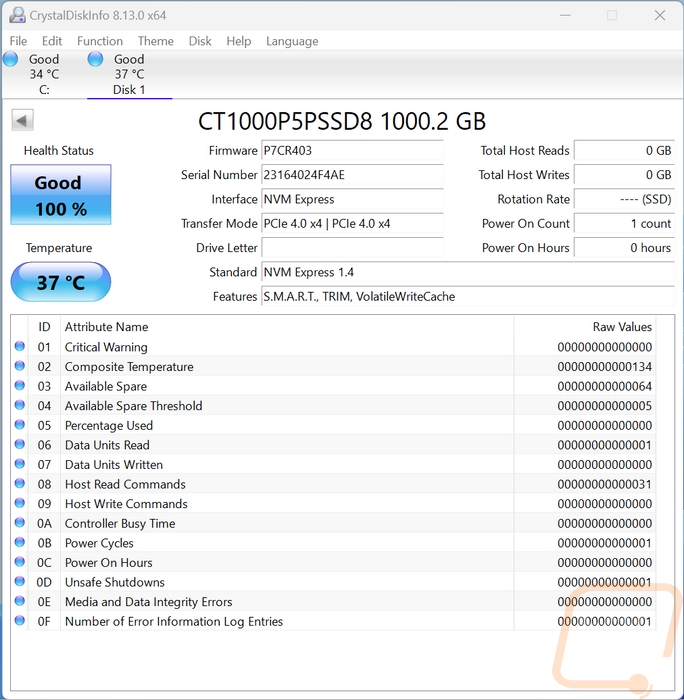
Before getting into testing the Crucial P5 Plus 1TB W/Heatsink I did check the drive out using CrystalDiskInfo just to confirm that it was connected using the correct interface. It was connected at PCIe 4.0 x4 so we are good there. I also like to do this to document the firmware revision we are running on for testing because those do change from time to time as well. I did also check the firmware compared to the original P5 Plus that I covered and it has moved up from P7CR402 up to P7CR403 so it is a new revision.
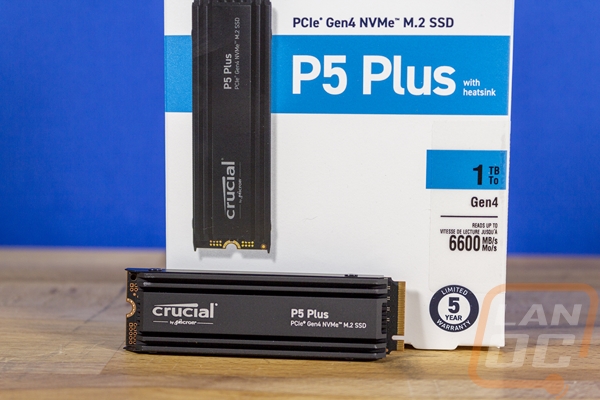
My first round of testing was to run the P5 Plus 1TB W/Heatsink through Crystal Disk Mark 8. Sequential testing is usually a best-case scenario and is what companies use for their specifications and on the front of the box to advertise drive speeds which in the case of the P5 Plus 1TB W/Heatsink the box and the specifications both touch up speeds of up to 6600 MB/s read speed for all three capacities and the specifications have the read speed at up to 5000 MB/s for the 1TB and 2TB models and lower at 4000 MB/s for the 500GB model. For the read speed, the P5 Plus 1TB W/Heatsink reached that mark hitting 6699 MB/s, this was right in line with the original drive as well and above most of the other PCIe 4.0 drives tested. For the wrist speeds the P5 Plus 1TB W/Heatsink hit 5041 MB/s which was a hair faster than the original and not the fastest PCIe 4.0 drive but still up there with the Renegade and the MM800 being faster.
|
PCIe 3.0 |
PCIe 4.0 |
PCIe 5.0 |
||
|
Crystal Disk Mark 8 - Read |
SEQ1M Q8T1 |
SEQ128K Q32T1 |
RND4K Q32T16 |
RND4K Q1T1 |
|
WD Blue SN550 1TB |
2444.53 |
2077.36 |
1075.88 |
57.88 |
|
Sabrent Rocket Q4 2TB |
4939.59 |
2871.47 |
1034.52 |
74.53 |
|
Corsair MP400 1TB |
3432.77 |
1889.56 |
713.28 |
61.42 |
|
Corsair Force MP600 2TB |
4828 |
1543.31 |
901.83 |
41.49 |
|
Sabrent Rocket 4.0 Plus 1TB |
6468.33 |
2712.53 |
455.24 |
54.68 |
|
Crucial P5 Plus 1TB |
6697.19 |
4358.63 |
1113.7 |
69.76 |
|
Kingston FURY Renegade 2TB |
6592.75 |
3093.11 |
1085.23 |
55.14 |
|
Patriot P400 1TB |
5036.9 |
3518.47 |
1059.71 |
88.06 |
|
WD Blue SN570 1TB |
3569.34 |
2681.32 |
1046.46 |
65.75 |
|
WD Black SN770 1TB |
5223.32 |
4958.17 |
1034.35 |
82.24 |
|
MSI Spatium M480 Play 2TB |
6979.03 |
4267.59 |
1315.25 |
81.22 |
|
Viper Gaming VPR400 |
5163.46 |
3880.75 |
1030.81 |
85.35 |
|
Crucial P3 Plus 2TB |
5041.44 |
2799.96 |
1107.97 |
56.56 |
|
Crucial P3 2TB |
3511.18 |
2379.76 |
957.63 |
45.42 |
|
Fantom Drives Venom8 2TB |
6989.96 |
4216.08 |
1086.16 |
79.59 |
|
Lexar Professional NM800 Pro 2TB |
7155.05 |
3479.95 |
781.64 |
84.56 |
|
Crucial T700 2TB |
12399.57 |
9265.64 |
826.54 |
98.49 |
|
Lexar NM710 1TB |
5101.53 |
4683.79 |
839.35 |
72.24 |
|
Crucial P5 Plus 1TB W/Heatsink |
6699.11 |
4267.73 |
826.71 |
68.33 |
|
PCIe 3.0 |
PCIe 4.0 |
PCIe 5.0 |
||
|
Crystal Disk Mark 8 - Write |
SEQ1M Q8T1 |
SEQ128K Q32T1 |
RND4K Q32T16 |
RND4K Q1T1 |
|
WD Blue SN550 1TB |
2007.63 |
2006.4 |
776.4 |
290.25 |
|
Sabrent Rocket Q4 2TB |
3633.71 |
2568.7 |
920.84 |
385.73 |
|
Corsair MP400 1TB |
2021.09 |
2017.63 |
1196.42 |
262.36 |
|
Corsair Force MP600 2TB |
992.38 |
982.78 |
996.22 |
276.26 |
|
Sabrent Rocket 4.0 Plus 1TB |
5241.89 |
5225.25 |
921.51 |
402.26 |
|
Crucial P5 Plus 1TB |
5025.83 |
4880.38 |
884.12 |
240.78 |
|
Kingston FURY Renegade 2TB |
6899.76 |
5831.06 |
1083.12 |
367.6 |
|
Patriot P400 1TB |
4830.94 |
4813.27 |
846.34 |
307.12 |
|
WD Blue SN570 1TB |
3147.13 |
2893.72 |
909.47 |
234.17 |
|
WD Black SN770 1TB |
4983.07 |
4980.59 |
1149.36 |
295.13 |
|
MSI Spatium M480 Play 2TB |
6870.73 |
5863.14 |
1062.32 |
357.02 |
|
Viper Gaming VPR400 |
4780.82 |
4775.74 |
838 |
285.02 |
|
Crucial P3 Plus 2TB |
4388.26 |
4387.54 |
989.42 |
2967.35 |
|
Crucial P3 2TB |
3244.52 |
2712.72 |
630.77 |
261.09 |
|
Fantom Drives Venom8 2TB |
4132.6 |
5850.19 |
844.52 |
315.7 |
|
Lexar Professional NM800 Pro 2TB |
6629.2 |
5645.52 |
589.6 |
274.14 |
|
Crucial T700 2TB |
11692.96 |
9500.07 |
710.93 |
363.19 |
|
Lexar NM710 1TB |
4447.81 |
2640.5 |
686.8 |
283.91 |
|
Crucial P5 Plus 1TB W/Heatsink |
5041.15 |
4906.1 |
747.39 |
204.11 |
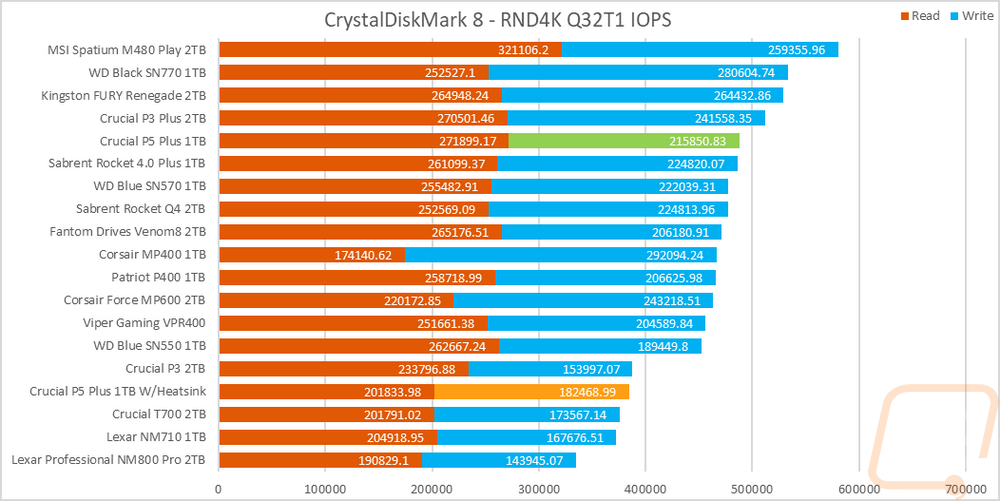
While testing in CrystalDiskMark 8 I did also check out the drive’s IOPS performance with the random 4k queue depth of 32 and 1 thread results. I stacked the read and write performance together here because I do believe that the overall drive performance is important, not just one result or the other. The P5 Plus 1TB W/Heatsink struggled here coming out close to the bottom of the pack when both results were combined. I did highlight where the original came in and while I did this test a few times I don’t know why the performance has dropped other than potentially the different firmware.
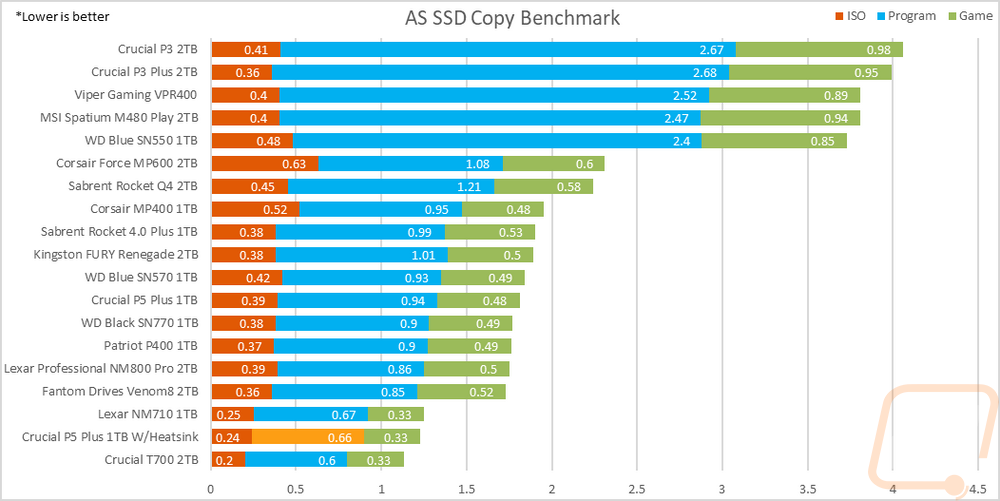
In AS SSD, I skipped over the standard test because it is very similar to the CrystalDiskMark tests I prefer to check out one of its sub-tests, the copy benchmark. This moves three files, one that is an ISO, one that is a program, and then a game, and times how long each takes. With these being timed, lower is better here. I have all three results stacked to see which drives are best overall. The P5 Plus 1TB W/Heatsink did well here, improving on what I saw on our original testing even with just the new T700 PCIe 5.0 drive testing faster.
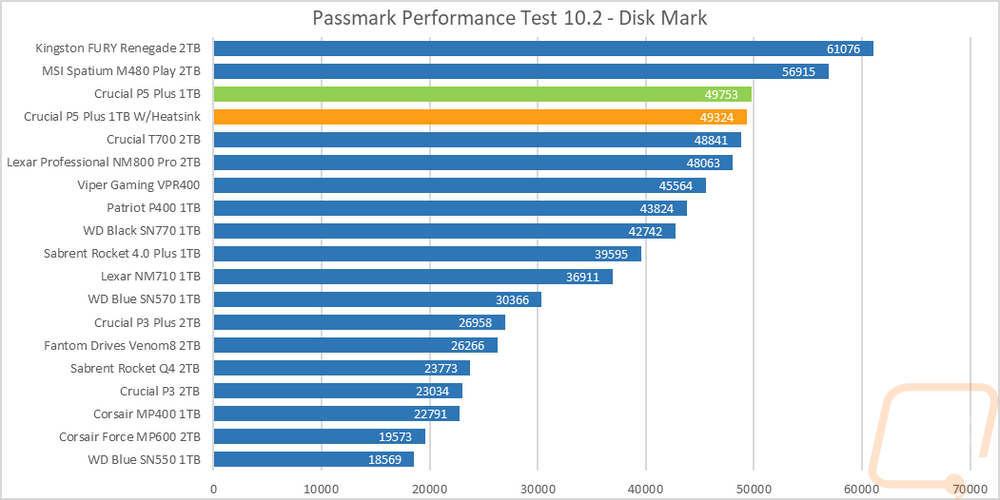
Next up with PassMark Performance Test 10, I ran their combined synthetic benchmark to get a look at their DiskMark rating. The P5 Plus 1TB W/Heatsink was right with the original results for the non-heatsink P5 Plus here which puts both drives up near the top with just two drives testing faster.
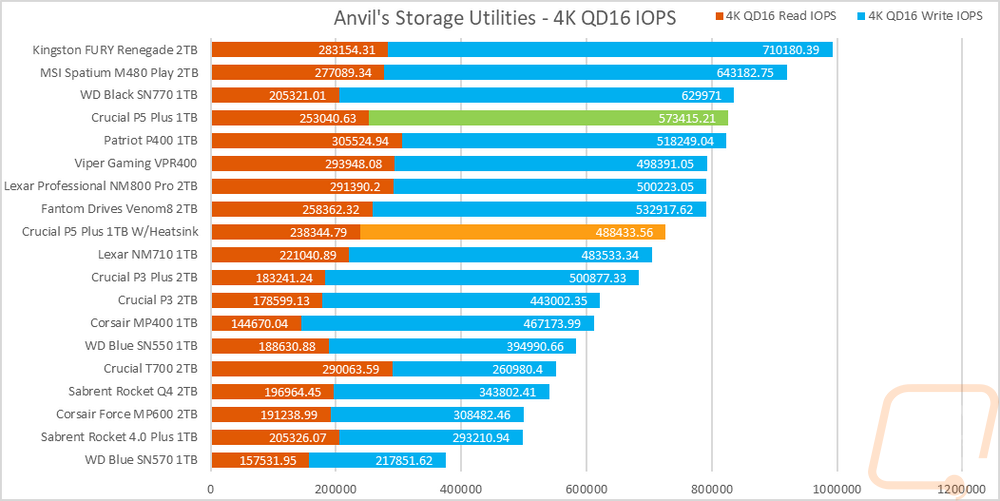
I then changed my focus back over to IOPS performance and ran the NM710 in Anvil’s Storage Benchmark focusing on the 4k queue depth of 16 results from the main test. The read IOPS for the P5 Plus 1TB W/Heatsink dropped noticeably from what I saw when we tested the original drive previously. The write IOPS weren’t too far off but with the read results it dropped the P5 Plus 1TB W/Heatsink from up in the top of the chart down to the middle.
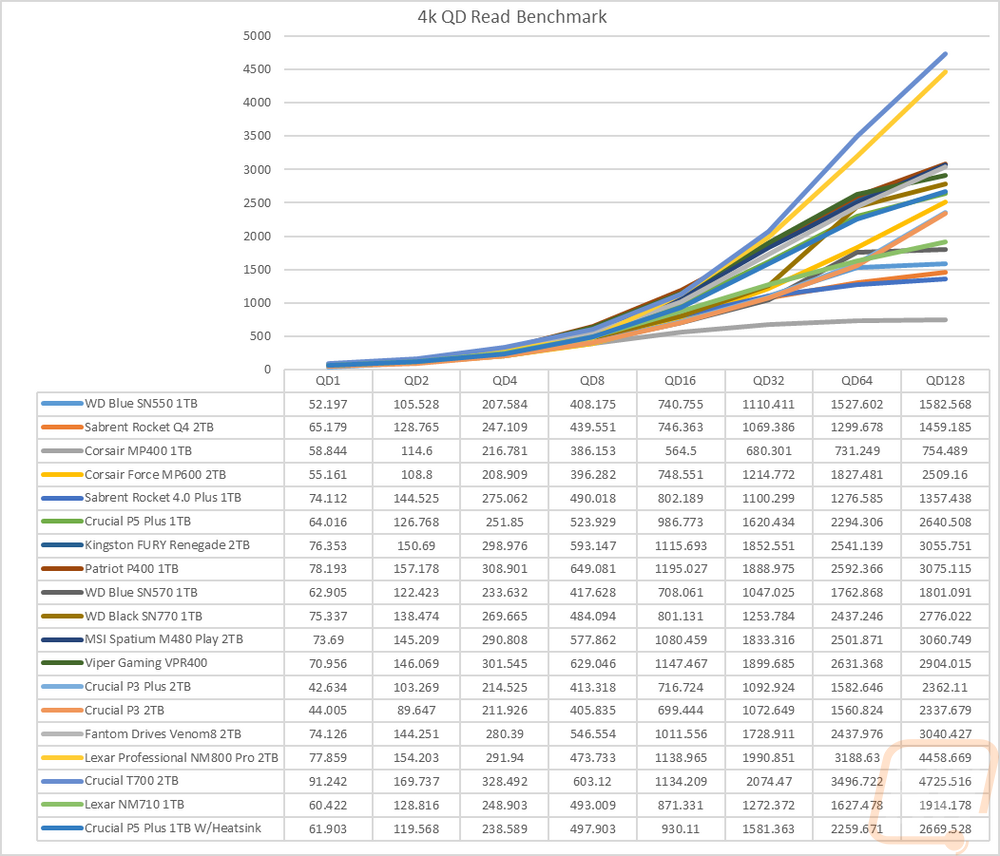
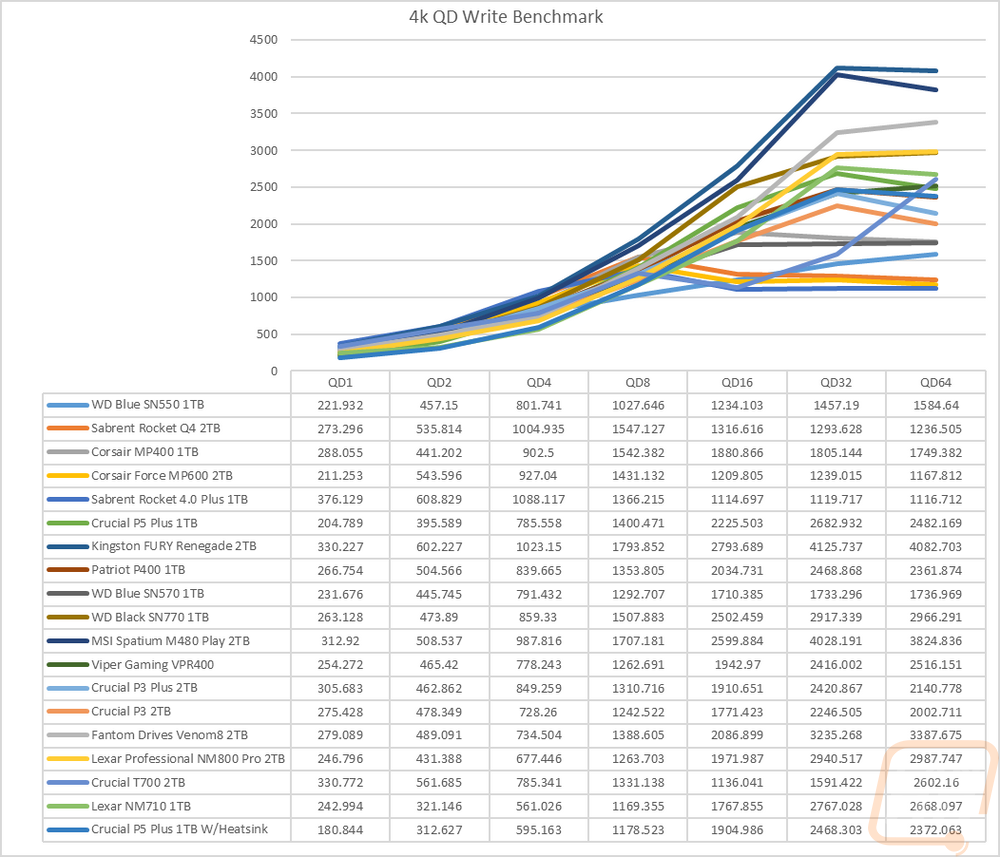
Sticking with Anvil’s Storage Utilities I did a few more tests. Here I wanted to check out how the drive would react to different queue depths so with the file size set to 4K I ran tests ramping up double each time starting at 1 and up to 128 for reads and 64 for writes. This lets us see if the controller gets overloaded. For the read, queue depth tests the P5 Plus 1TB W/Heatsink started off a little slower than the original testing but ended up in the same 2669 MB/s range at the highest queue depth. This put the P5 Plus 1TB W/Heatsink in the main pack of drives but is one of the slower of that group. For the write test, it once again started off a little slower than the original test but this time came in around 100 MB/s lower. Performance does scale up but drops off just slightly when going from a queue depth of 32 up to 64.
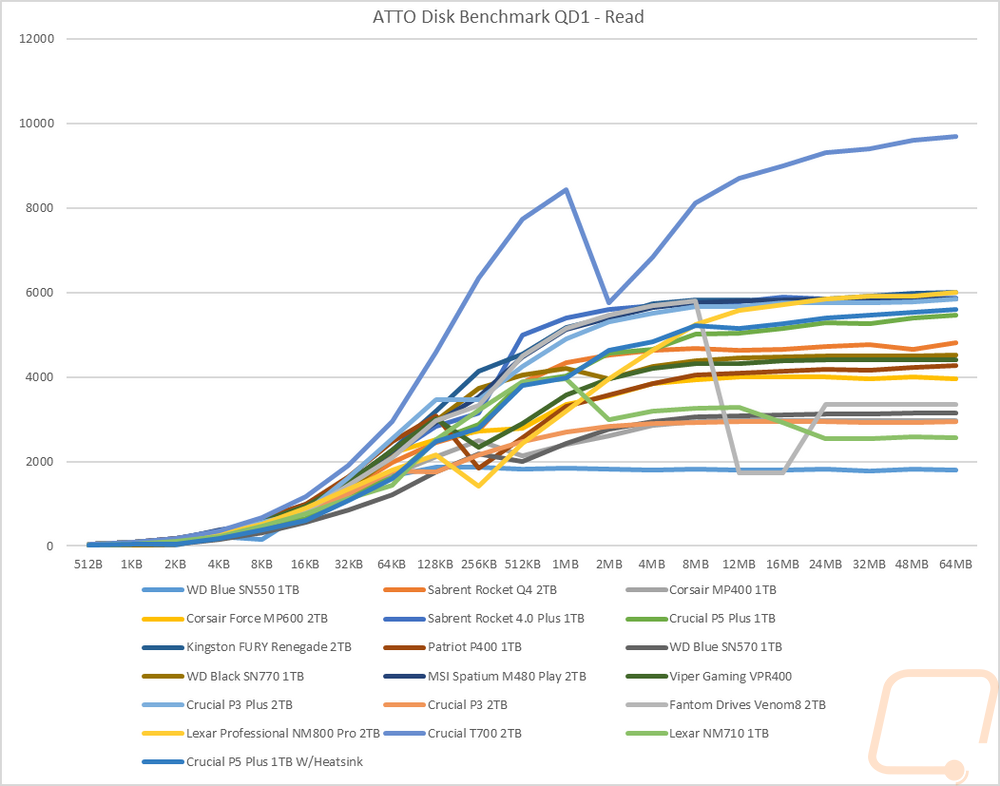
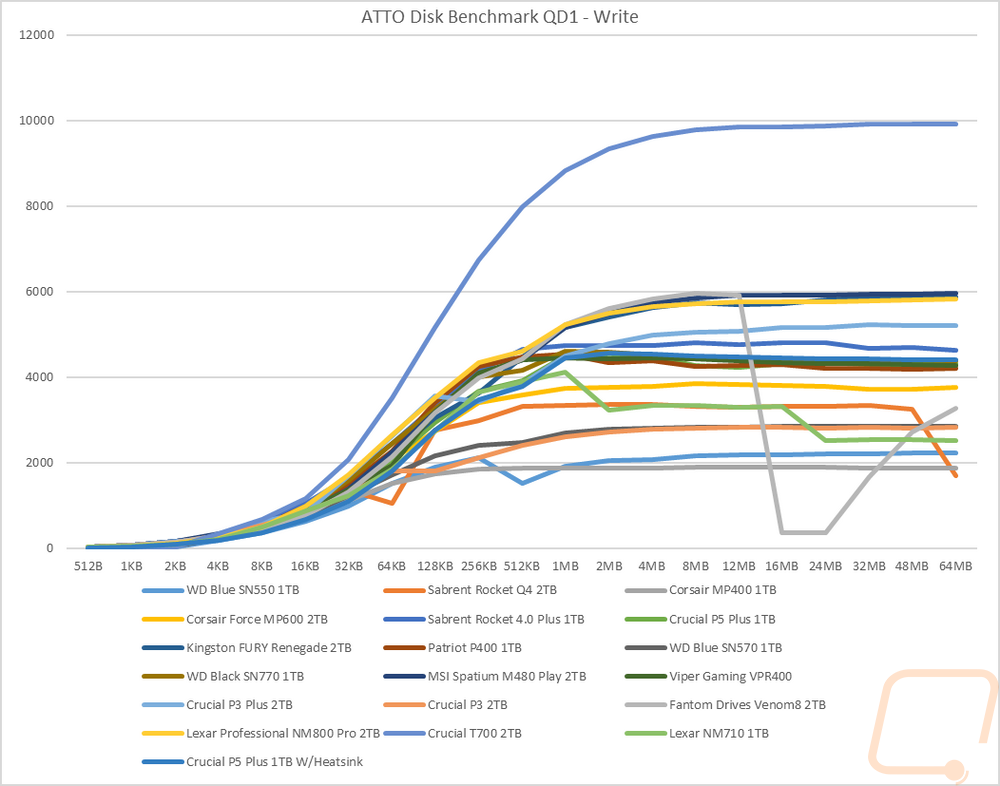
For ATTO Benchmark I set it to a queue depth of just 1 but ramped up the file size slowly to see how it would affect performance. For the read test in ATTO, the P5 Plus 1TB W/Heatsink starts off slow when compared to the lot but runs right with and just slightly ahead of the original P5 Plus 1TB test results. There are a few small hiccups where it doesn’t gain much in performance but only one is a drop in performance. In the end, the P5 Plus 1TB W/Heatsink ends up in that top pack that sits well below the new T700 PCIe 5 drive. The write performance in ATTO was similar only the group that both P5 Plus drives end up in is extremely clumped together and a few of the older PCIe 3.0 drives are up above them all at the top end. The P5 Plus 1TB W/Heatsink does peak out near the 1MB range and drops by a small amount each result after that.
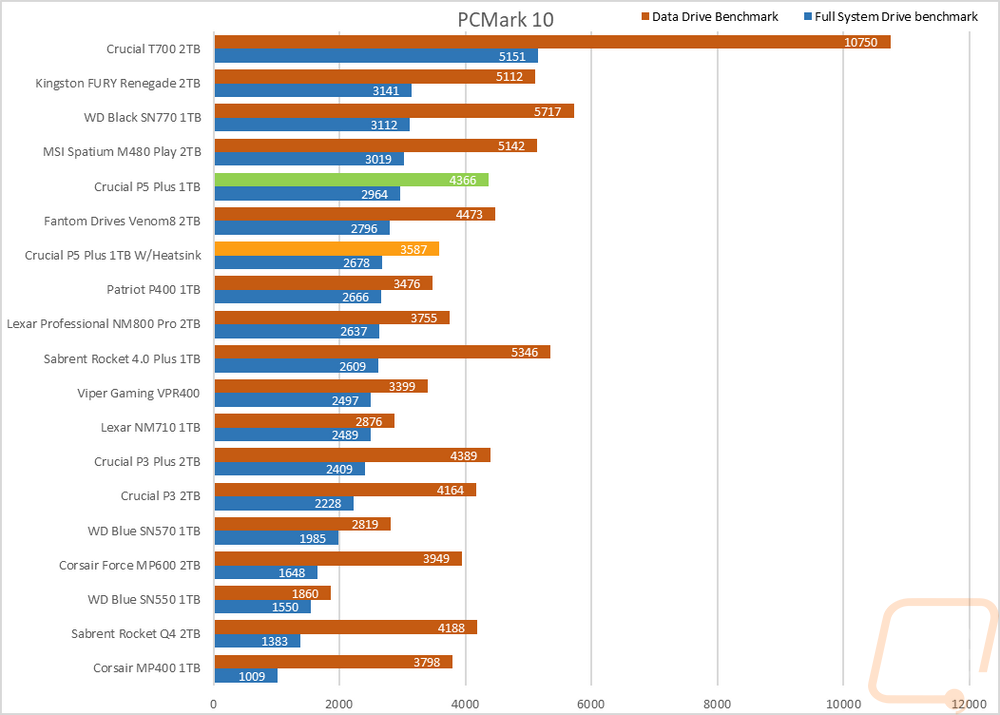
Next up I wanted to look at more real-world performance and for this, I started with PCMark 10 which has an overall full system benchmark for storage, and then one focused on data storage drives. In the full system drive benchmark, the P5 Plus 1TB W/Heatsink dropped in performance in both results compared to the original test results from two years ago. This was especially true on the data drive benchmark. For the full system drive result still puts it up in the top half of the results but it is interesting how performance has dropped.
For more real-world resting, I did our file transfer tests. You don’t get any more real-world than this. For each drive, I copied the folder filled with files to the drive tested documenting what its transfer rate is near the end of the transfer. I used three file types, movies which are large single files, a folder filled with RAW and JPG photos, and then a folder filled with Word documents. Starting with the movie files the P5 Plus 1TB W/Heatsink transferred the movies at 2580 MB/s, this was a lot better than our original testing, and overall while not the highest still up near the top. For the pictures which are smaller but not too small, the speed drops down to 1570 MB/s but this again was 570 MB/s faster than the original P5 Plus 1TB testing and is up with the fastest drives tested. Then the last test was Word documents which are small and always much slower, here it transferred files at 17.4 MB/s which was slower than the MM710 but still solid.
|
Windows 11 File Transfers |
Movies |
Pictures |
Documents |
|
WD Blue SN550 1TB |
852 |
937 |
2.42 |
|
Sabrent Rocket Q4 2TB |
2720 |
1140 |
5.75 |
|
Corsair MP400 1TB |
2140 |
996 |
2.57 |
|
Corsair Force MP600 2TB |
1250 |
816 |
2.83 |
|
Sabrent Rocket 4.0 Plus 1TB |
2120 |
254 |
1.63 |
|
Crucial P5 Plus 1TB |
2060 |
1030 |
5.2 |
|
Kingston FURY Renegade 2TB |
2330 |
857 |
2.58 |
|
Patriot P400 1TB |
2070 |
981 |
2.86 |
|
WD Blue SN570 1TB |
602 |
992 |
5.14 |
|
WD Black SN770 1TB |
2260 |
605 |
2.52 |
|
MSI Spatium M480 Play 2TB |
1930 |
905 |
5.62 |
|
Viper Gaming VPR400 |
2360 |
1300 |
2.61 |
|
Crucial P3 Plus 2TB |
2240 |
1080 |
6.92 |
|
Crucial P3 2TB |
1990 |
1100 |
6.46 |
|
Fantom Drives Venom8 2TB |
1750 |
1190 |
4.45 |
|
Lexar Professional NM800 Pro 2TB |
2230 |
879 |
4.39 |
|
Crucial T700 2TB |
2540 |
1520 |
4.57 |
|
Lexar NM710 1TB |
2610 |
1630 |
18.4 |
|
Crucial P5 Plus 1TB W/Heatsink |
2580 |
1570 |
17.4 |
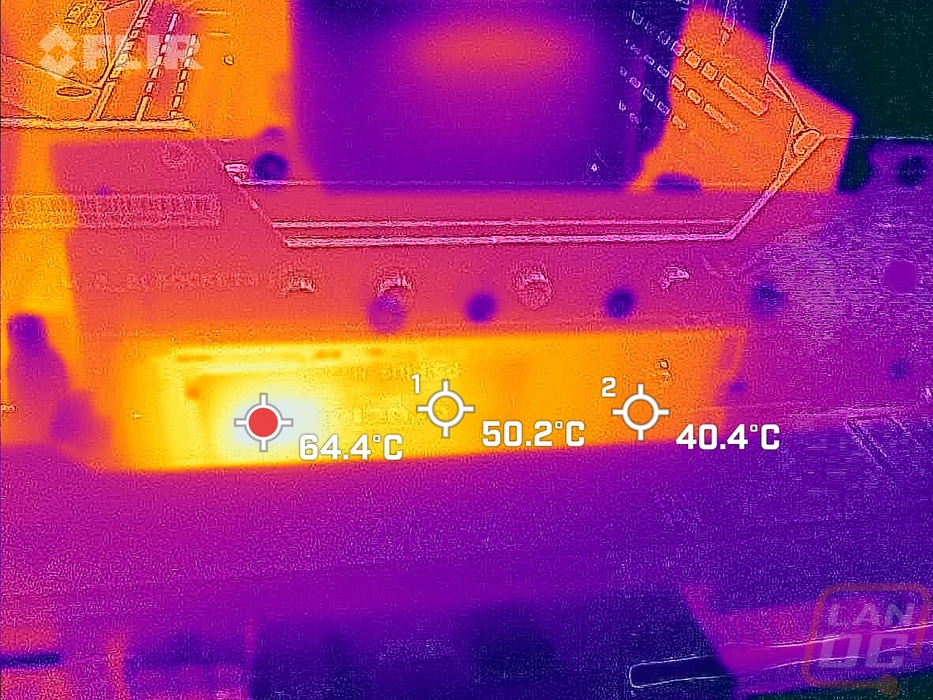
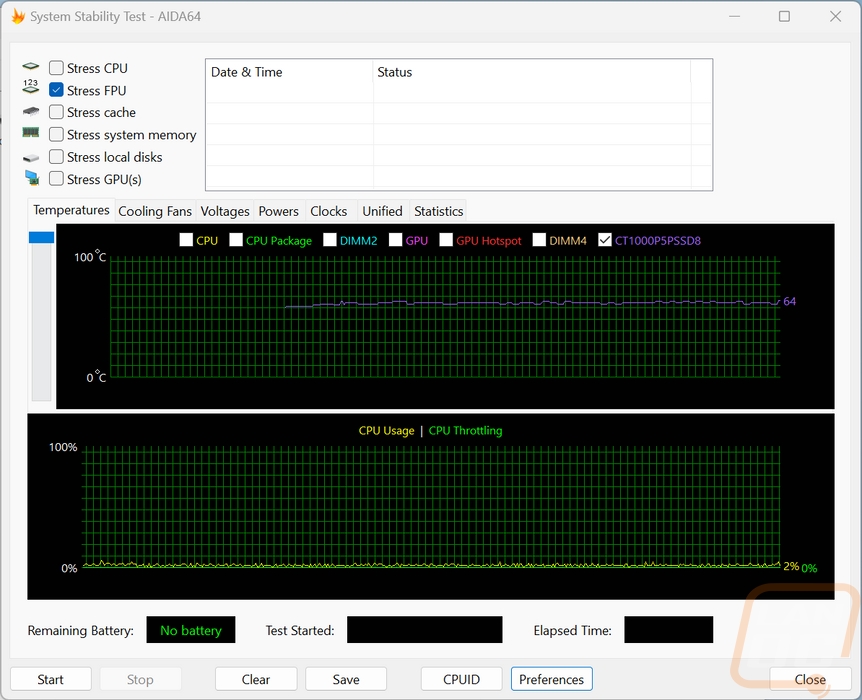
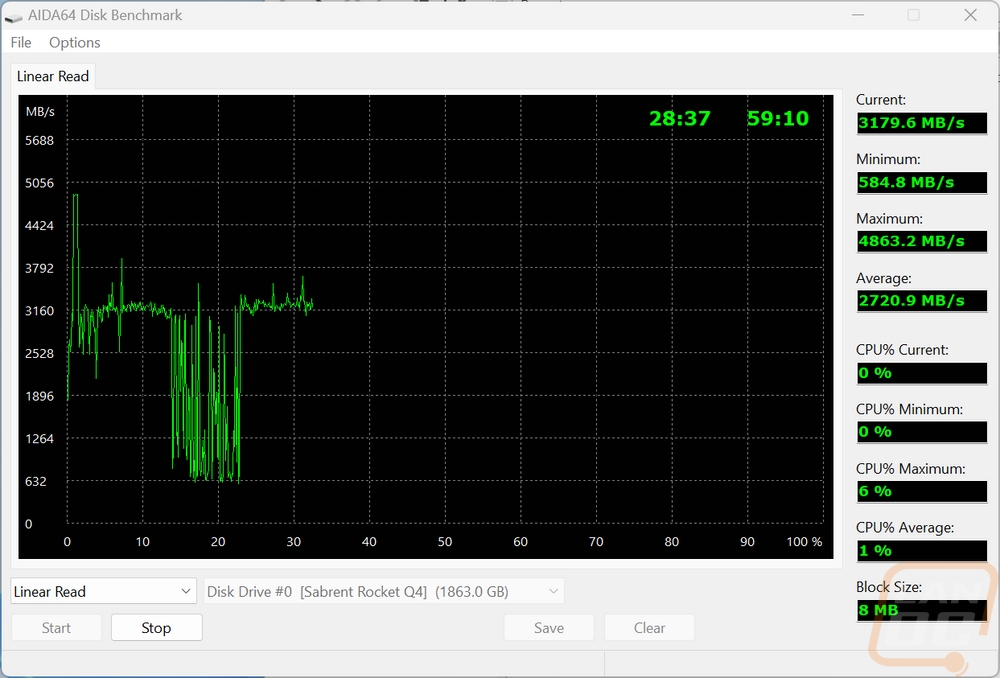
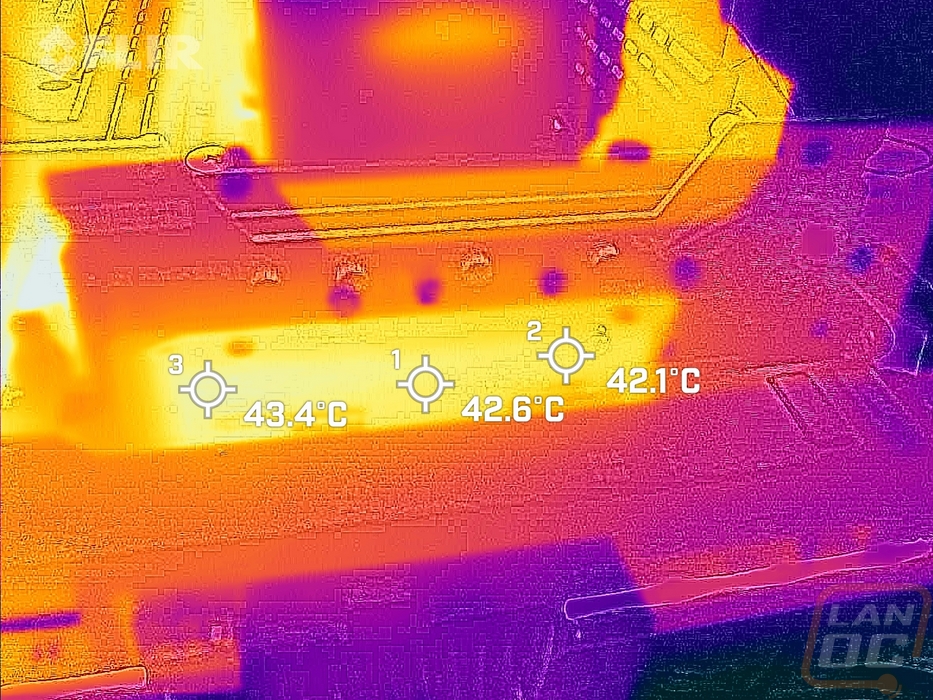
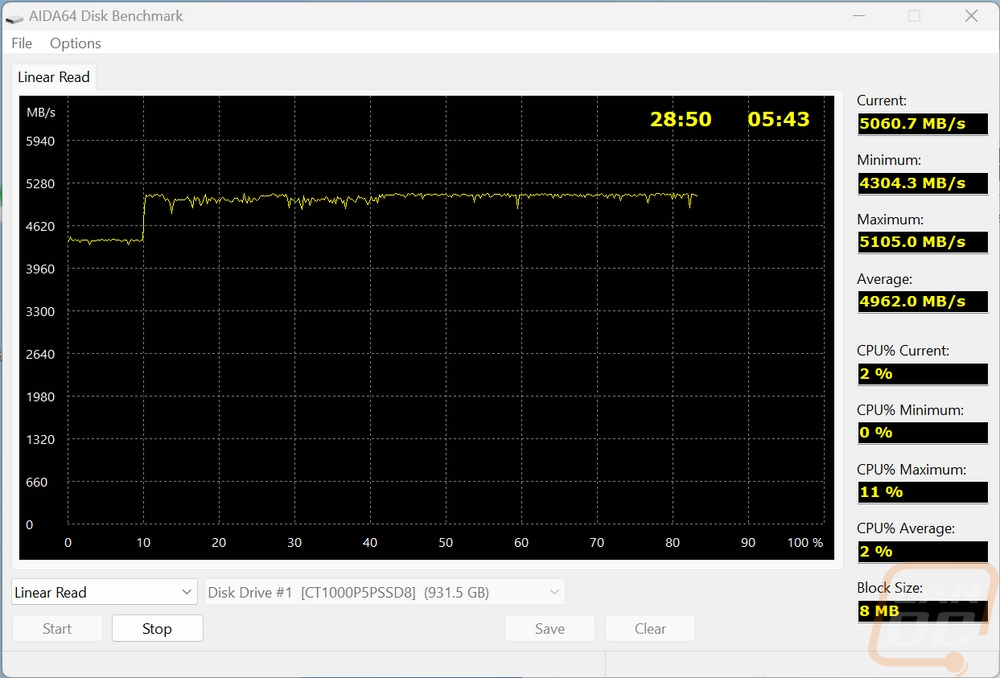
Before finishing up my testing I did of course want to check out if the heatsink was helping at all. For this, I ran a linear read test for a half hour using AIDA64. During that, I tracked the drive temperature and I also took thermal images. I also did the same test using our old heatsinkless drive as well. I included the transfer speeds in the pictures below because it was interesting that the P5 Plus 1TB W/Heatsink had consistent read speeds when running for the half hour but the P5 Plus 1TB without the heatsink started in the same transfer speed but immediately dropped down to the 3100 MB/s range. This would most likely also mean less heat being generated. Given that the P5 Plus 1TB without the heatsink went right to 63/64c where the P5 Plus 1TB W/Heatsink stayed at 44c this is most likely the drive throttling down right away. It would explain why in some of our tests the P5 Plus 1TB W/Heatsink transferred files faster, but doesn’t explain the older drive being much better in IOPS tests. The thermal images also show how the drive without a heatsink has all of its heat concentrated at the controller. With the heatsink, there is heat there but it is spread out more and also 20c lower. The thermal imagines also match up with what the sensor on the drives were showing us in the temperature graphs as well.
P5 Plus 1TB W/Heatsink

P5 Plus 1TB No Heatsink