At the end of last month, both Nvidia and AMD launched their first cards targeted specifically at gamers who are gaming at 1080p. While the resolution’s use is dropping (very slowly at -.19%), 1080p is still by far the most widely used resolution. This is supported by the Steam hardware survey having 64.33% of users running the resolution. Having cards focused on the resolution is a big deal and xx60 cards from Nvidia dominate the top of the charts with five out of the top ten cards on Steams survey being xx60 and the rest being xx50 or xx60 Ti which are also in the same range. Nvidia’s previously launched RTX 4060 Ti was targeted as a higher-end 1080p card, well tomorrow the RTX 4060, which was announced alongside the 4060 Ti, will hit stores and today we can check out how it performs. With an MSRP of $299, I’m excited to see how well it will perform and see how it fits into today's market so let’s dive in and check it out.
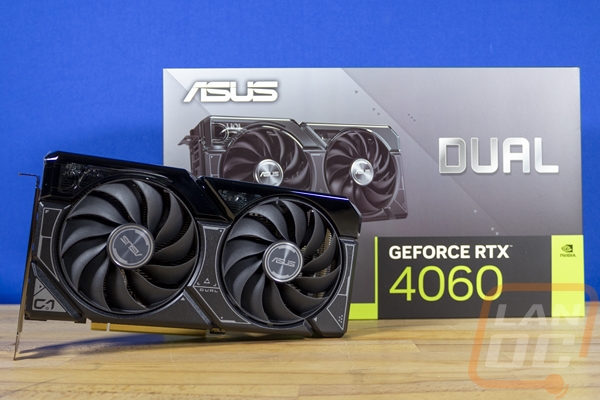
Product Name: Asus Dual RTX 4060 8GB
Review Sample Provided by: Asus/Nvidia
Written by: Wes Compton
Amazon Affiliate Link: HERE
What is the RTX 4060
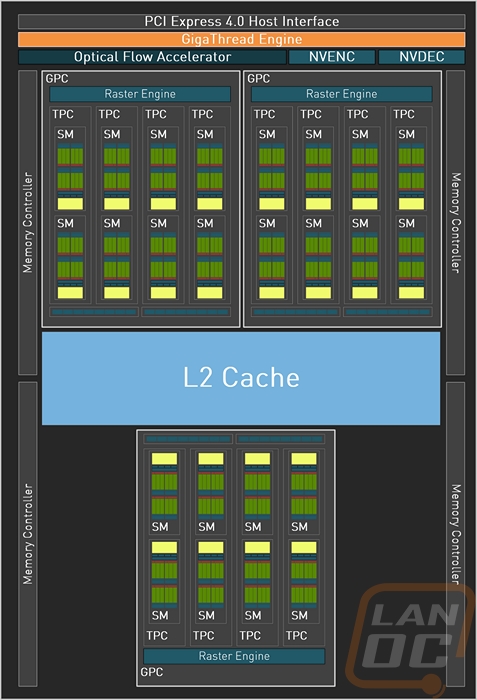
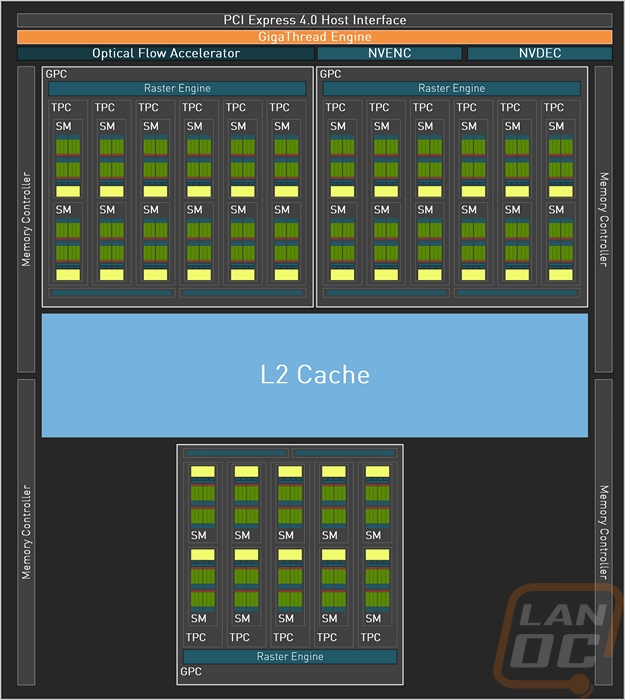
If you took a look at last month's RTX 4060 Ti launch, you would know a lot about the RTX already. Both GPUs are based on Ada Lovelace but the RTX 4060 Ti is based on the AD106 GPU where the RTX 4060 is the AD107 GPU. You can see in the pictures below which represent the RTX 4060 and RTX 4060 Ti GPU diagrams. Where the 4060 Ti has 17 texture processing clusters the RTX 4060 has 12 which takes the SMs from 34 down to 24 and CUDA cores down from 4352 to 3072. The RTX 4060 does have the same 8GB of GDDR6 and the same 128-bit memory interface. The RTX has scaled its L2 cache to match the cut-down GPU and its clock speed is also lower at 2460 MHz to the 2535 MHz of the Ti. The memory clock speed is down to 8500 MHz from 9000 MHz as well which shows in the memory data rate which was 18 Gbps for the 4060 Ti and 17 for the RTX 4060.
|
Specifications |
|
|
Graphics Processing Clusters |
3 |
|
Texture Processing Clusters |
12 |
|
Streaming Multiprocessors |
24 |
|
CUDA Cores (single precision) |
3072 |
|
Shader FLOPS |
15 |
|
Tensor Cores |
96 (4th Generation) |
|
Tensor FP8/INT8 TFLOPS/TOPS w/ Sparsity |
242 |
|
RT Cores |
24 (3rd Generation) |
|
RT FLOPS |
35 |
|
Texture Units |
96 |
|
ROP Units |
48 |
|
Base Clock |
1830 MHz |
|
Boost Clock |
2460 MHz |
|
Memory Clock |
8500 MHz |
|
Memory Data Rate |
17 Gbps |
|
L1 Data Cache/Shared Memory |
3072 K |
|
L2 Cache Size |
24576 K |
|
Total Video Memory |
8 GB GDDR6 |
|
Memory Interface |
128-bit |
|
Total Memory Bandwidth |
272 GB/s (453 GB/sec effective)* |
|
Texture Rate (Bilinear) |
236 GigaTexels/second |
|
Max Display Resolution |
4K at 240Hz or 8K at 60Hz with DSC |
|
Fabrication Process |
4N NVIDIA Custom Process |
|
Transistor Count |
18.9 Billion |
|
Connectors |
3 x DisplayPort 1 x HDMI |
|
Form Factor |
Dual-Slot |
|
Power Connectors |
2x PCIe 8-pin cables (adapter in box) OR 300 W or greater PCIe Gen 5 cable |
|
Required System Power Supply |
550 Watts |
|
Video Engines |
1xNVENC (8th Gen) 1xNVDEC (5th Gen) |
|
Power |
7W Idle, 11W AV1 Video Playback, 110W Average Gaming Power (AGP), 115 W Total Graphics Power (TGP) |
|
Max GPU Temperature |
90° C |
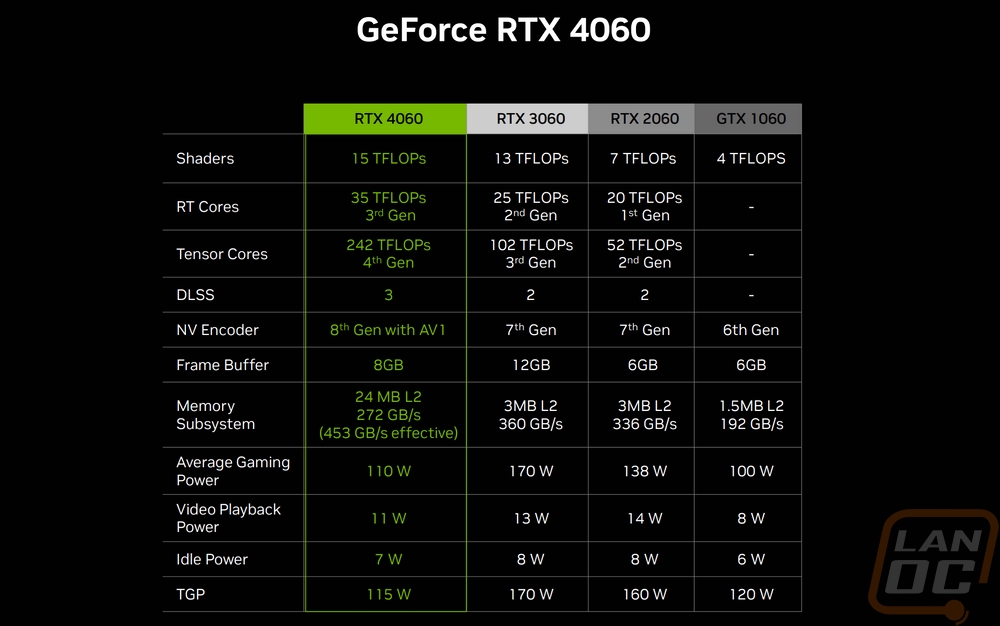
Nvidia’s presentation on the RTX 4060 was of course focused on how the RTX 4060 compares to previous generation cards, not the RTX 4060 Ti and they did put together a nice table showing how the RTX 4060 compares to past xx60 cards from the RTX 3060, to the RTX 2060, and the GTX 1060. It does a good job showing how shader performance has increased over the years from 4 TFLOPS on the 1060 up to 15 TFLOPS for the RTX 4060. It does also show the generation-to-generation increase from the 3060 to the 4060 isn’t as large, at least on shader performance. The ray tracing and tensor core performance on the other hand has much more significant improvements especially the tensor cores which went from 102 TFLOPS to 242 TFLOPS which is interesting because the RTX 3060 had 112 3rd generation tensor cores whereas the RTX 4060 has fewer at 96 but the new 4th generation design does the work to get more than double the performance with a 137% improvement. The 12GB frame buffer on the 3060 is back down to 8GB which is higher than the 2060 and 1060 which both had 6GB. Nvidia is quick to point out that they are able to utilize a much larger L2 cache to use less frame buffer which is why the memory subsystem has the 272 GB/s and 453 GB/s numbers for memory performance. The power numbers are interesting as well with the RTX 4060 being much more power efficient compared to all but the GTX 1060 which was lower in everything except TGP.
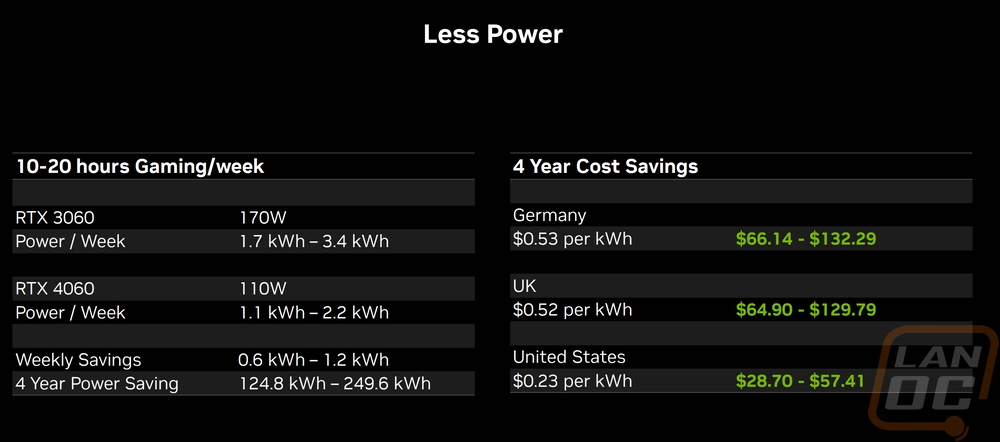
Speaking of power, this part of the presentation was interesting. They broke down what an average of 10-20 hours of gaming a week can cost for power depending on where you are around the world and what the power savings just between the RTX 3060 and the RTX 4060 could get you. The actual power costs are going to vary a LOT depending on where you are even just in the US alone. I know for myself that in my own house in rural Ohio our actual rate per kWh after all fees is lower at .13 a kWh before this year and up to .20 on our last bill. For someone with rates like mine, the power difference might not make a difference, but anywhere it is higher it could start to play a bigger role in your decision.
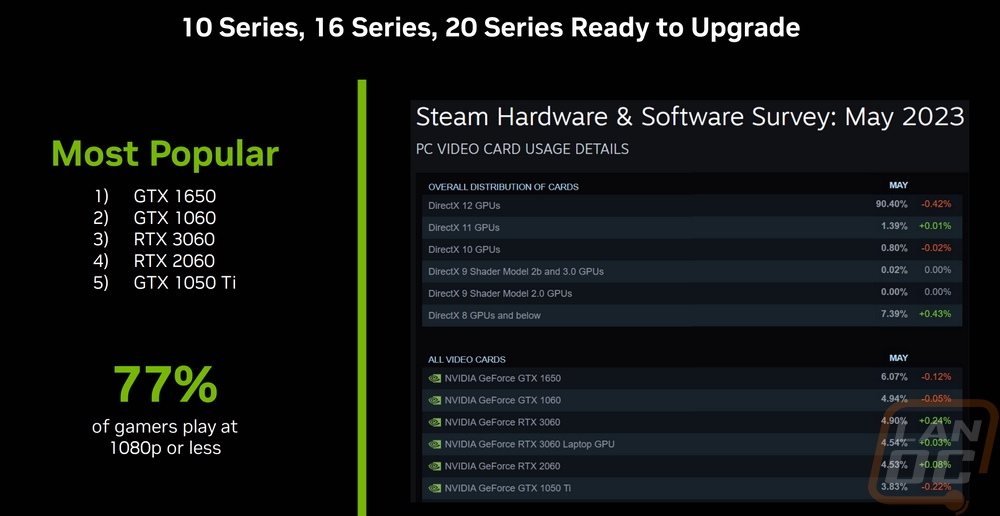
I mentioned it in the opening here and also with the RTX 4060 Ti, the most popular cards on the current Steam Hardware Survey are the xx60 and cards and a lot of those cards are getting a little long in the tooth. Depending on the person some people look at upgrades every few generations and others just use them until they run into performance issues. Both types of gamers were affected by the low availability and high prices caused by the combination of Covid and another mining craze and you can see it on the hardware charts. The GTX 1060 is still the second most popular card on the platform and it launched 7 years ago this July, the 1050 Ti which is also on there was around that time as well. Even the GTX 1660 and the RTX 2060 which are just two generations back officially are 4 years old as well. That is a lot of people who might be considering an upgrade.
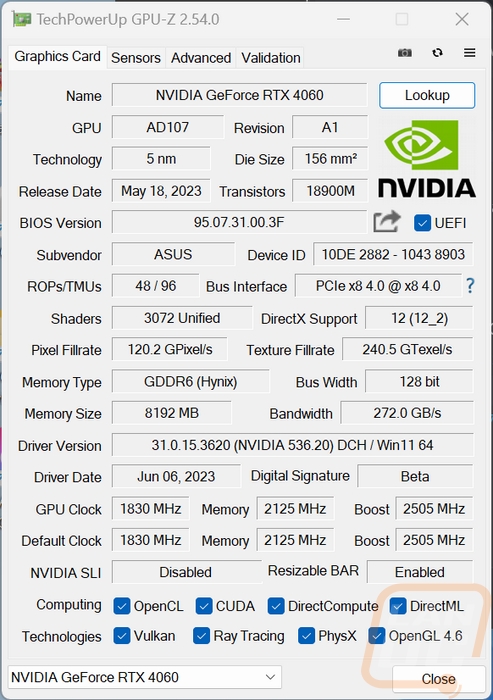
Before getting into testing I did also run GPUz to double-check that our clock speeds match up with the specifications. The Asus Dual RTX 4060 8 GB has the same base clock speed as the specifications for RTX 4060 at 1830 MHz. The same goes for the memory clock speed which is listed here as 2125 MHz which adds up to the same 8500 MHz of the stock 4060 design. As for the boost clock speed which stock would be 2460 MHz, the Dual does have an overclock over the stock speeds at 2505 MHz, 45 MHz higher than stock which isn’t a big overclock but this is an MSRP-focused card. The BIOS used on our card is noted as is the driver I used for testing which is the 536.20 driver that Nvidia provided press ahead of the launch.
Packaging
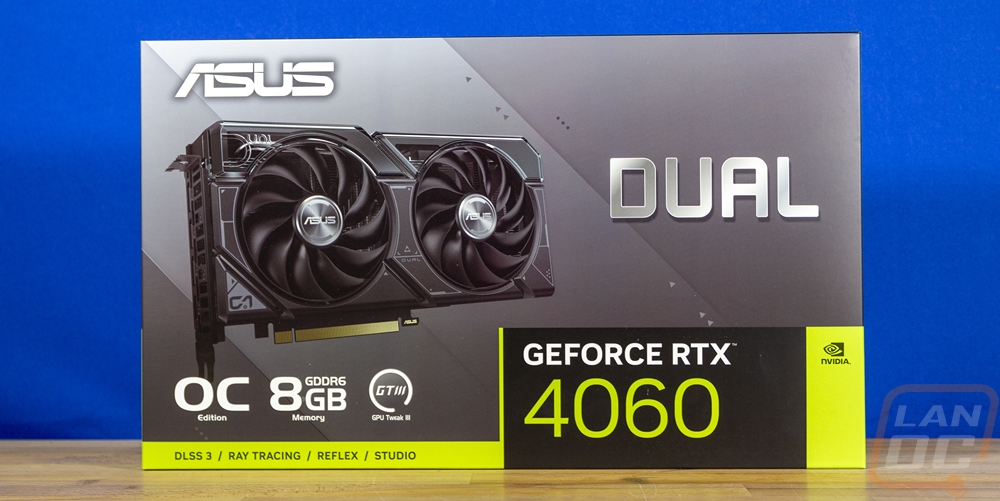
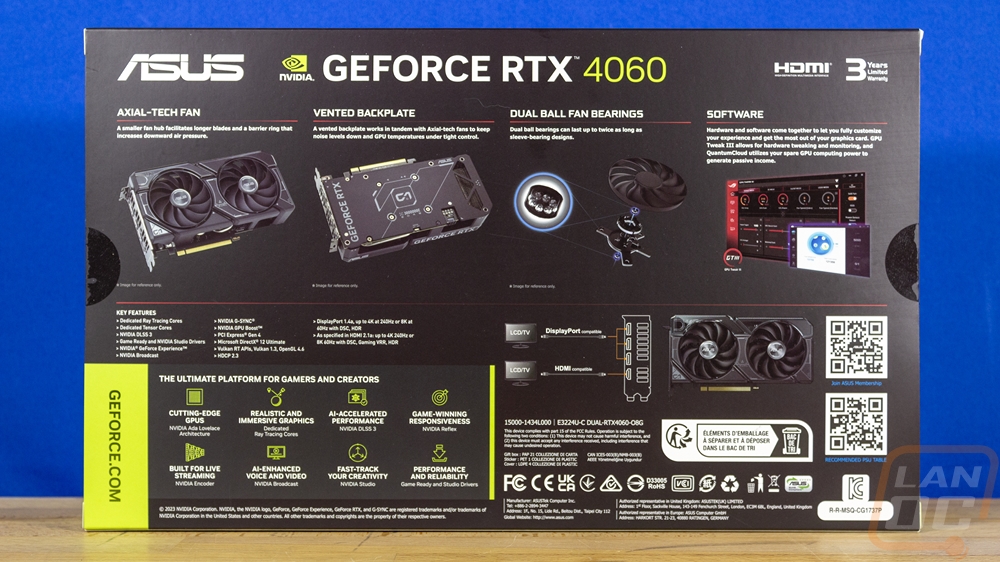
The packaging for the Asus Dual RTX 4060 8GB sticks right with what I’ve seen with past Asus Dual designs. The front has a grey background which has different grey shades for stripes. The Dual branding is in the biggest font and sits next to a large picture of the card on the left. The bottom has the Nvidia required wrap-around that includes the RTX 4060 model name and a list of a few of Nvidia’s biggest features like DLSS 3, Ray Tracing, and Reflex. The front also has badges from Asus that let us know this is an overclocked card, has 8GB of memory, and supports GPU Tweak III which is Asus’s video card software. Around on the back, there is a lot more information including five more pictures and a line drawing. The line drawing shows the display outputs on the Asus Dual RTX 4060 8GB. Then the photos highlight some of the cards features including the fans, backplate, dual ball bearings in the fans, and the software. The 3-year warranty is included in the top corner and along the bottom the Nvidia wrap-around continues by showing some of the features that Nvidia cards have.
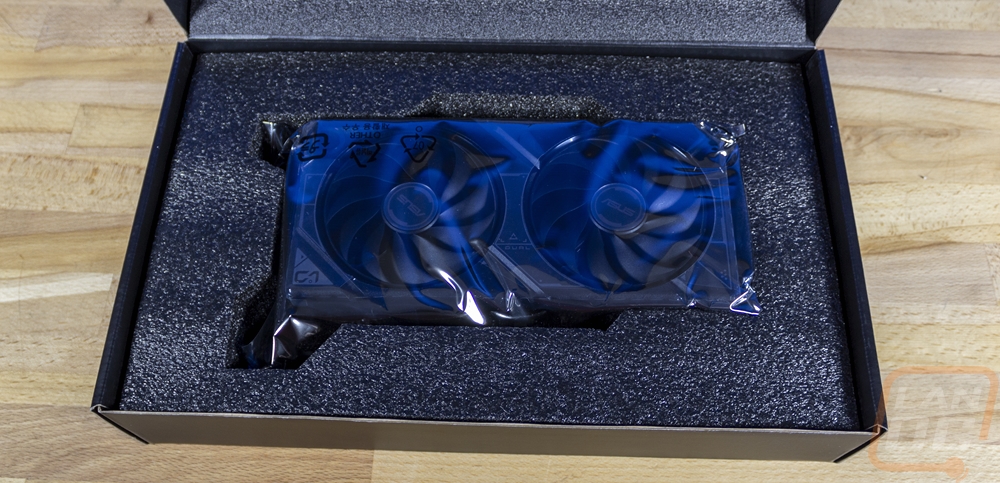
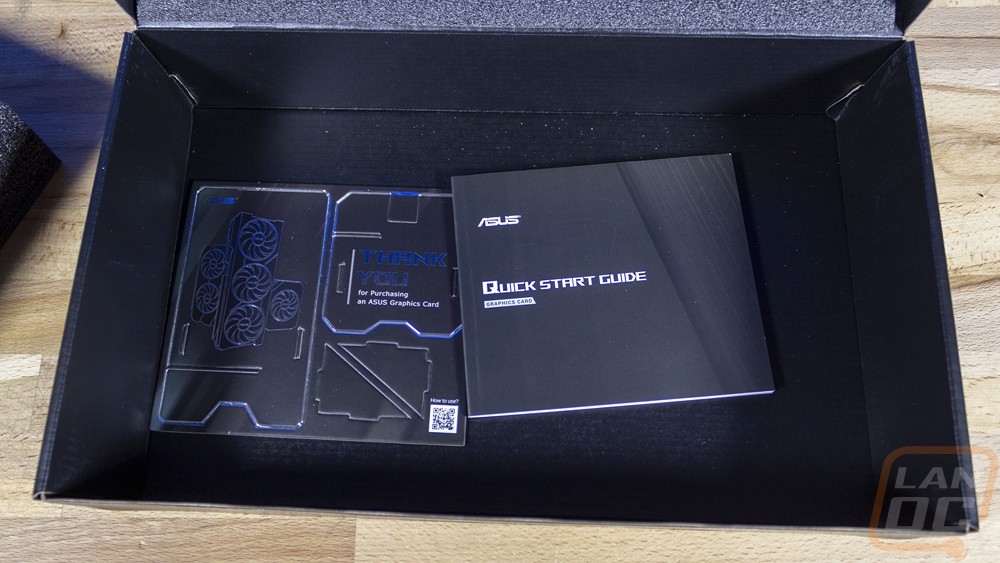
The outer box opens up and inside there is an all-black box with the Asus logo up on top. Inside there is a foam layer on the lid side as well as a thick foam insert in the bottom that has a cutout to fit the card. This along with the static protective bag keep it safe. Then the foam can be lifted out which is where you will find the documentation. You get a quick start guide and a cardboard cutout that can be put together that has a thank you for buying an Asus card. There aren’t any accessories with the Dual RTX 4060 as it doesn’t have the 12VHPWR connection so it doesn’t need an adapter and it is a shorter card so a support bracket isn’t needed.
Card Layout and Photos
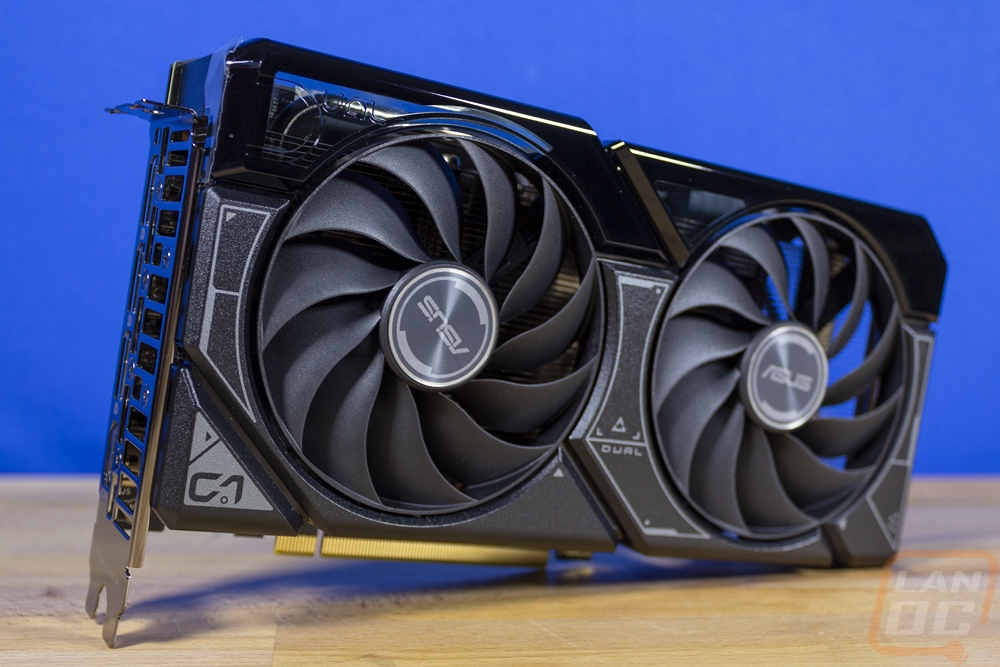
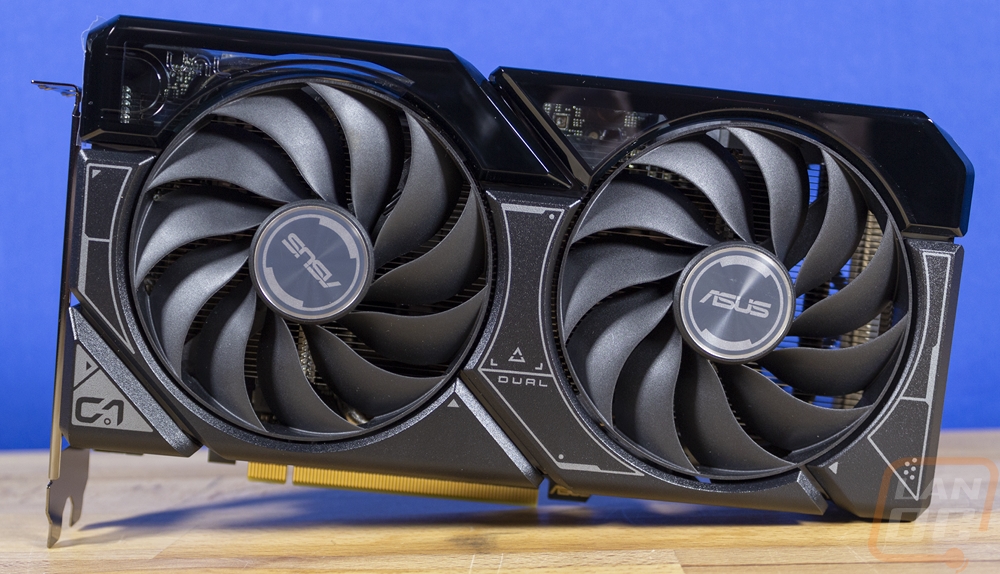
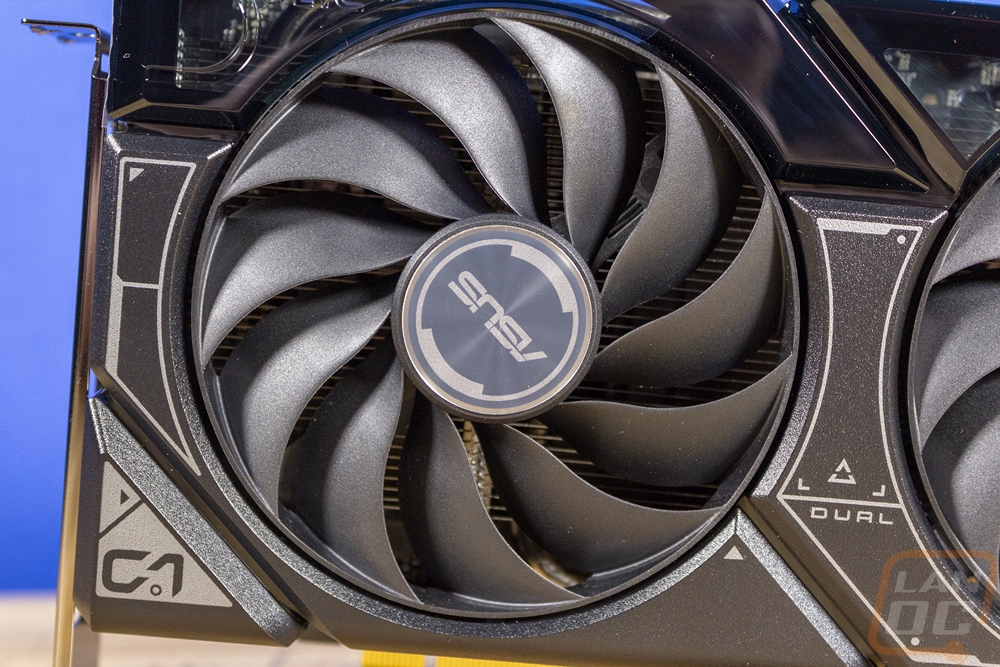
The Dual model in Asus’s lineup is designed to have the essentials while ignoring some of the features you would find on their higher-end cards. They always have a dual fan design, not a triple fan design like other Asus models and they rarely have lighting and on the few models that they do have lighting it is extremely subtle. The Dual RTX 4060 doesn’t have any lighting with it being on the lower end of the Nvidia product stack. It does have the dual fan design as previously mentioned and with that, it manages to be a little more compact in every dimension, but it isn’t a proper ITX form factor either, that is reserved for Asus’s Phenix cards. To keep things simple Asus has given the Dual RTX 4060 a blacked-out design with black axial fans with just a touch of silver on the centercaps along with grey accents printed onto the fan shroud. The shroud is all plastic and continues the black design. The bottom 2/3 is a textured black finish and the top 1/3 is glossy. That glossy section is also translucent which I hadn’t even noticed at all while handling the card for the last few days until looking at our pictures right now. That smoked translucent plastic gives a peak at the heatpipe behind it. None of that is visible until you get good lighting behind it all, it’s a shame this design doesn’t have just one or two small lights to light those areas up and utilize the translucent design a little more. The plastic also has the Dual logo molded into it in the top left corner but it is hard to see here.

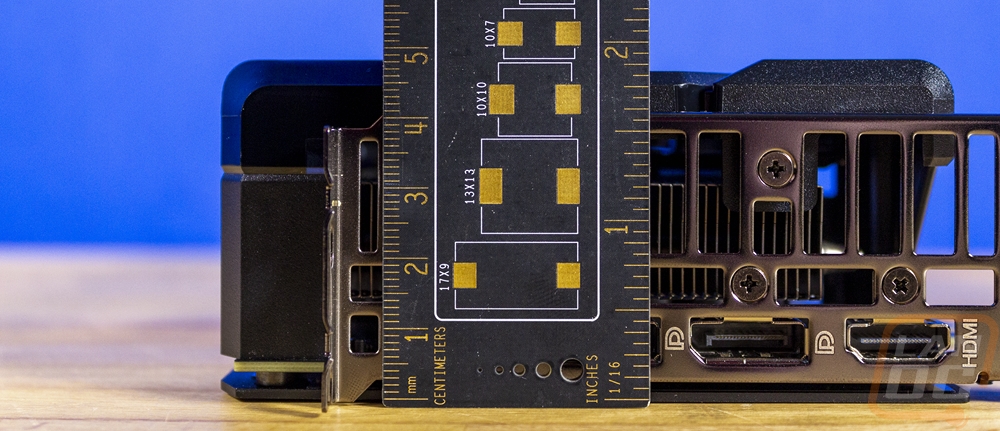
The Dual RTX 4060 has the same dimensions as Asus’s RTX 4060 Ti Dual model. They also have the same styling as well. The card has a length of 227.2 mm long, just long enough to support two full-sized fans. It is 123.24 mm tall which is a little beyond the “standard” PCI height and you can see that with the card extending past the top of the PCI bracket by 19 mm making it 13 mm taller than the standard height. This is shorter than most cards these days, however. Then for thickness, it is 49.6 mm thick making it a 2.5-slot wide card, again, like the height, is wider than the old standards but almost compact when compared to the rest of today's cards other than the lower-end Founders Edition cards, but the RTX 4060 doesn’t have a Founders Edition model.
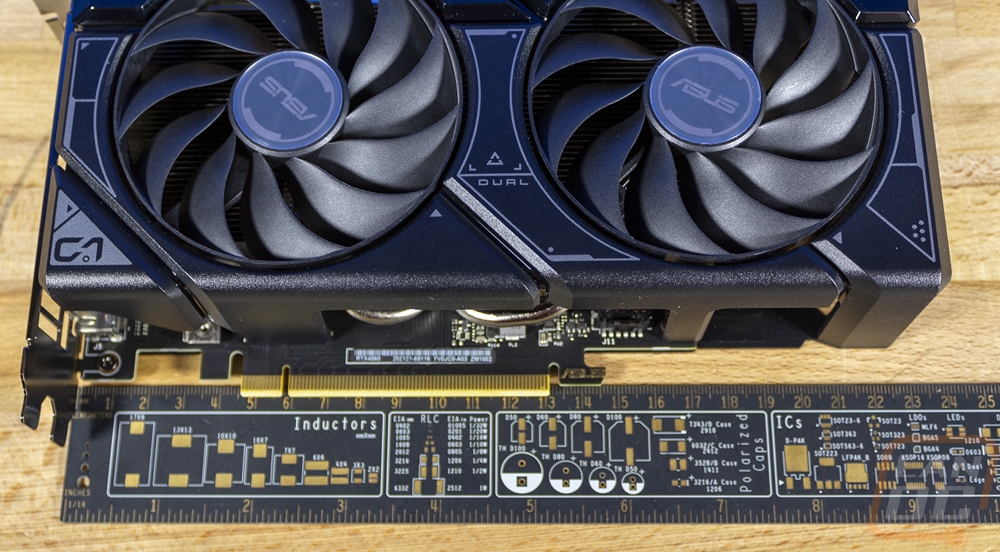
The dual fan design fits perfectly in the length of the card with room around both fans for the shroud especially the left side where the shroud sits a little higher. Both fans are the same size and design and are 90 mm wide at the center. The design has 11 fan blades which then are all linked together with a solid outer ring to give them more strength. They both blow down into the heatsink below and push air across the heatsink to help keep things cool. On the right side part of that heatsink is open to the back and blows through, the rest pushes the air toward the PCB and out to the ends of the card.
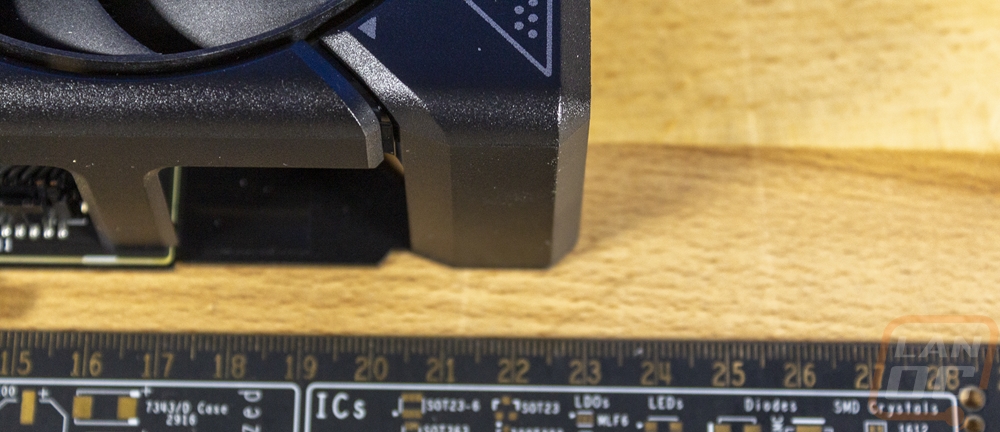
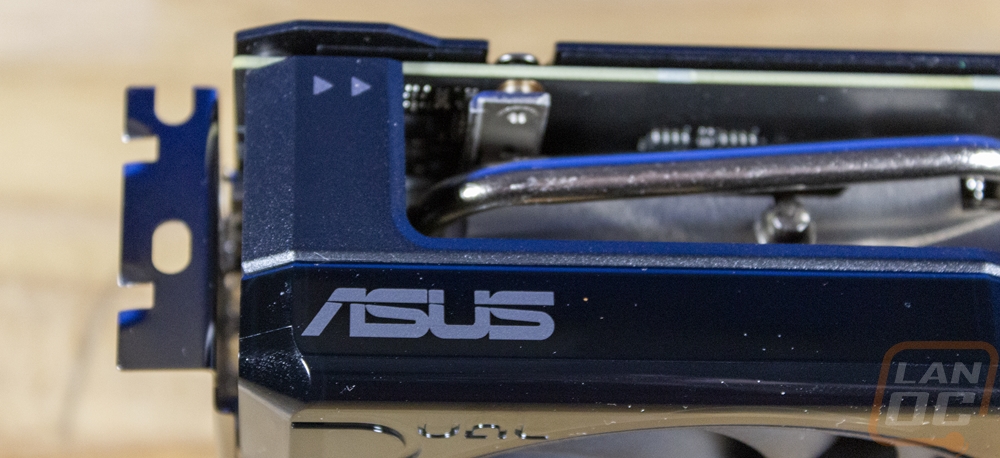
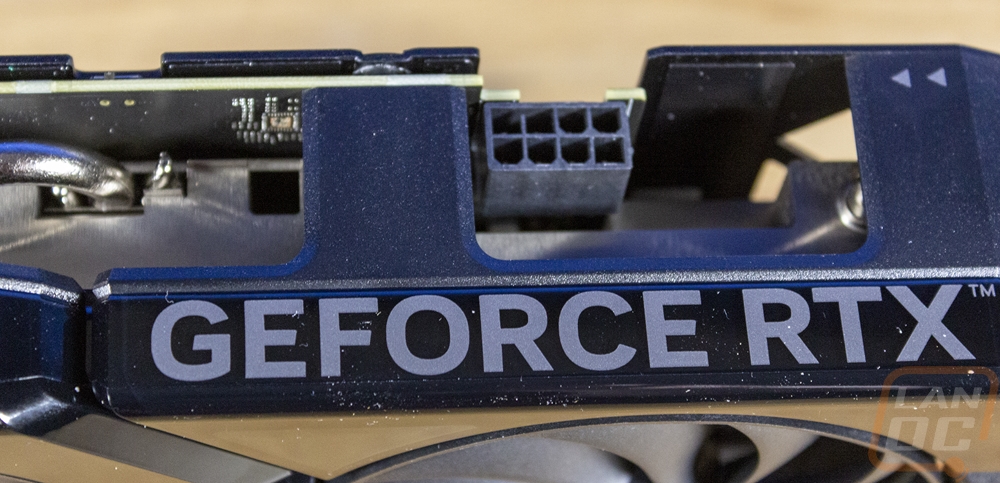
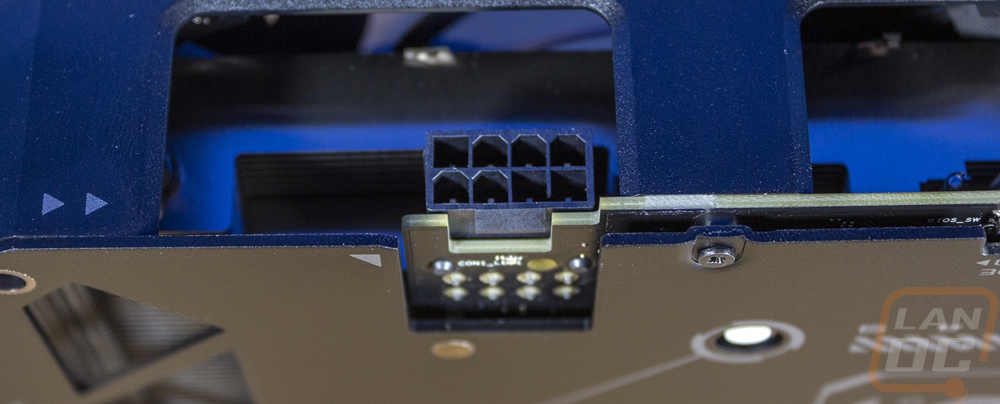
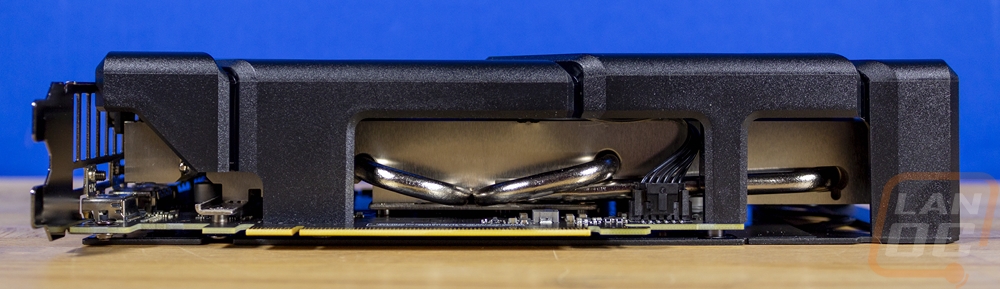
The top edge of the Dual RTX 4060 does continue the plastic fan shroud around from the front of the card but also has openings along the top that expose the heatpipes on the top. The glossy finish wraps around the ends and the rest continues a textured black finish. The glossy section has the Asus brand name on the left and GeForce RTX on the right side. The top edge is also where the power connection is located, it sits at the end of the PCB but 3 inches from the end of the card. The fan shroud also has a larger than expected opening around the power connection which looks like it is there to support two power connections but the Dual RTX 4060 only uses one 8-pin PCIe power connection. The Dual RTX 4060 Ti has the same layout so it isn’t for that design and the 4070 Dual uses a different shroud design altogether so I’m guessing that was designed as a just in case. Sticking with the lower cost theme on the RTX 4060, having the standard PCIe power connection does mean there isn’t a need to get an ATX 3.0 PSU just yet helping keep costs down.
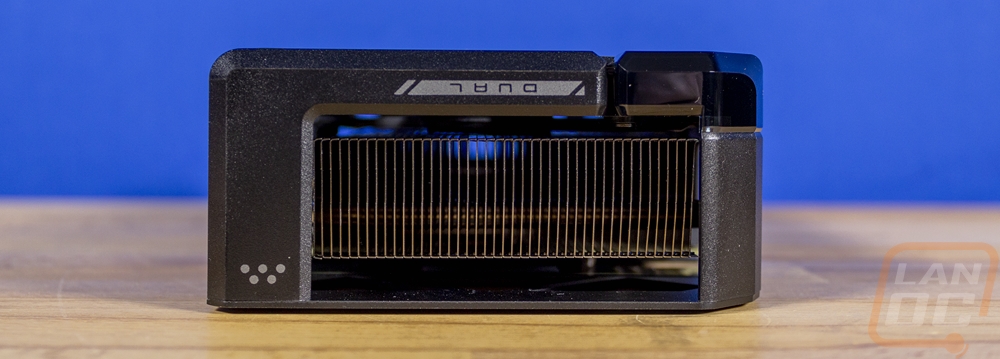
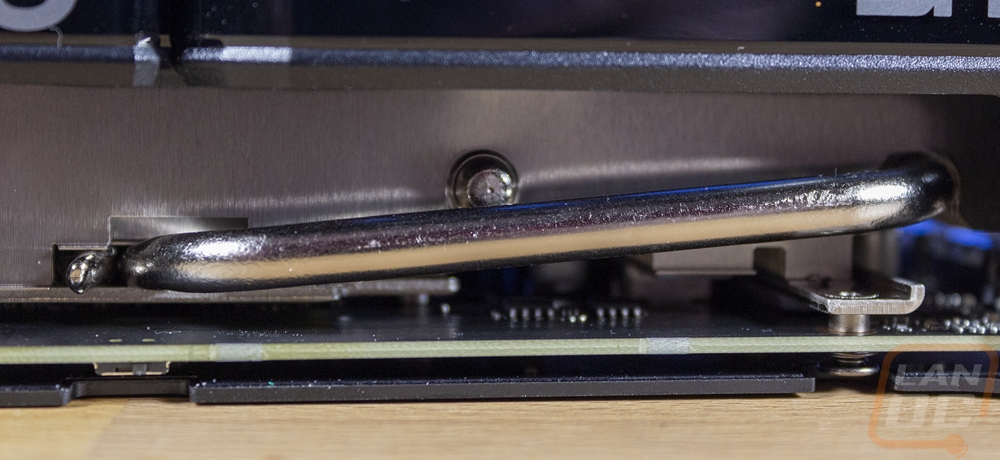
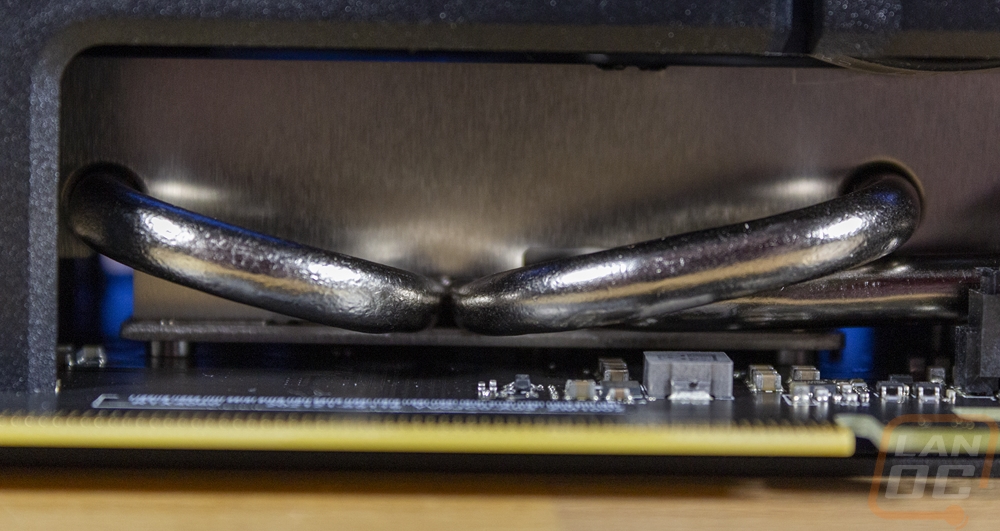
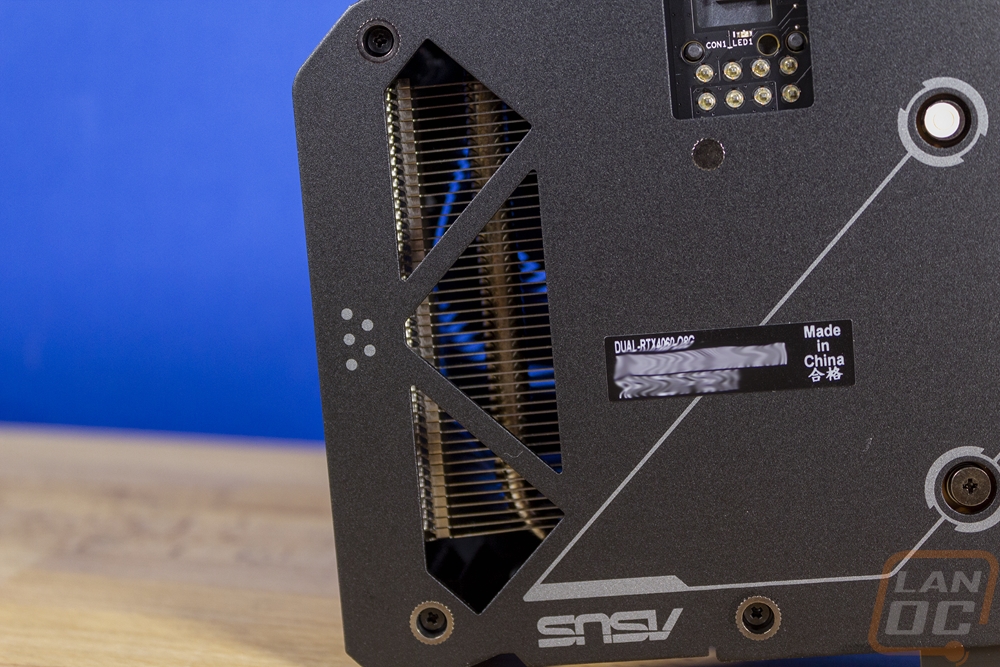
Looking around at the edges of the Dual RTX 4060 gives us a much better idea of the cooling configuration as well. For starters, the cooler design has the standard aluminum heatsink fins but Asus has laid the fins out in a horizontal orientation running from end to end on the card. Most coolers have this facing up and down which keeps the air resistance lower and a majority of this layout often doesn’t cool as well in my experience. It does give us a good look at the heatpipe with one across the top that pulls heat from the GPU over to the PCI bracket end of the card and on the bottom, there are three more than cover the middle and far right end of the card. The heatpipes all sit on top of a heatspreader over the GPU and memory in the center of the PCB. The PCB ends short of the end of the card but the heatsink runs to the end of the fan shroud and is visible on the end of the card where it will blow out some of its heat.
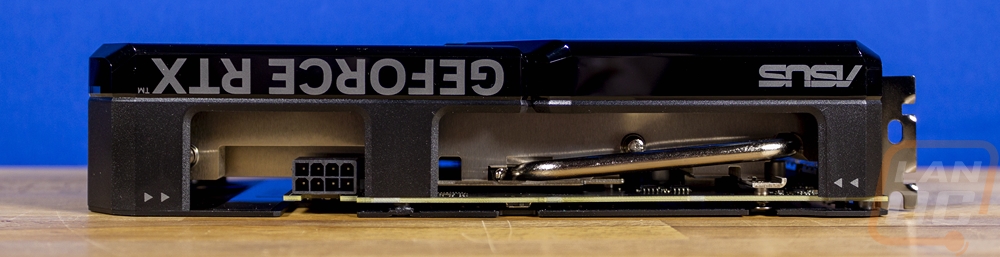
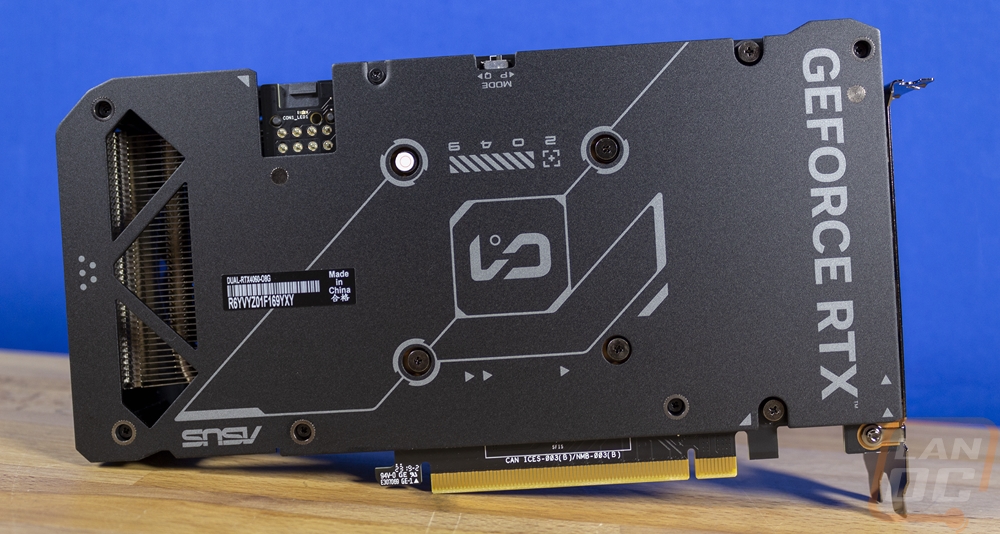
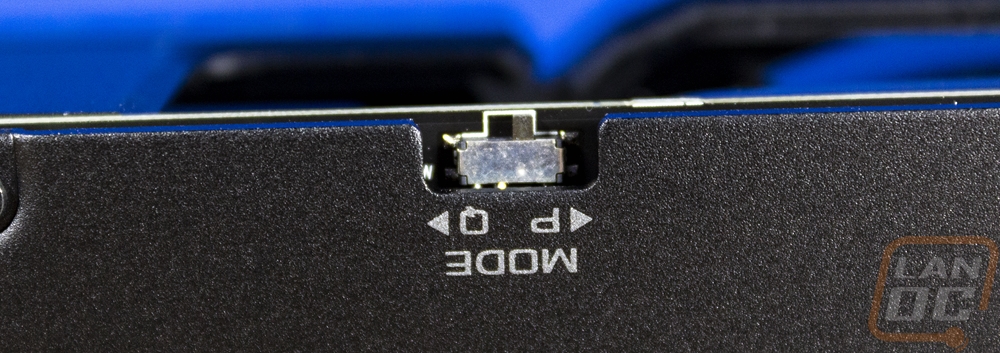
The back of the Dual RTX 4060 does have a full-length metal backplate that offers the PCB some protection and gives the card a cleaner look. The backplate has a textured black finish and has a design printed on it a light grey which includes the Asus brand name and GeForce RTX in a large font. It also has a logo in the center and 2049 which I assume is a date but I have no context on what it stands for. Up on the top edge above the GPU itself, there is a small switch with performance and quiet BIOS options which the backplate has an opening for. The power connection has a large opening as well that goes well belong the power connection clip, down enough to expose some of the black PCB. Then on the end, there is an opening in the area of the cooler beyond the end of the PCB where the heatsink is visible and the right fan can partially blow through the back.
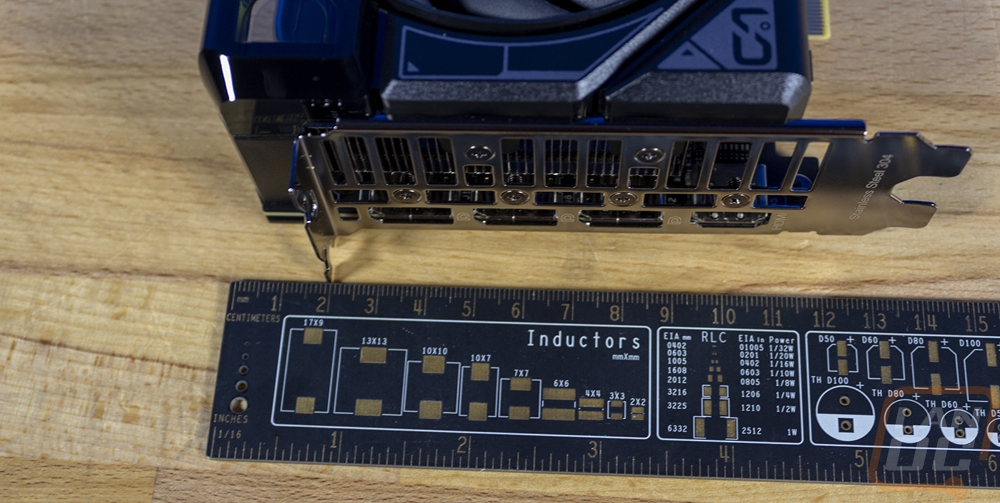
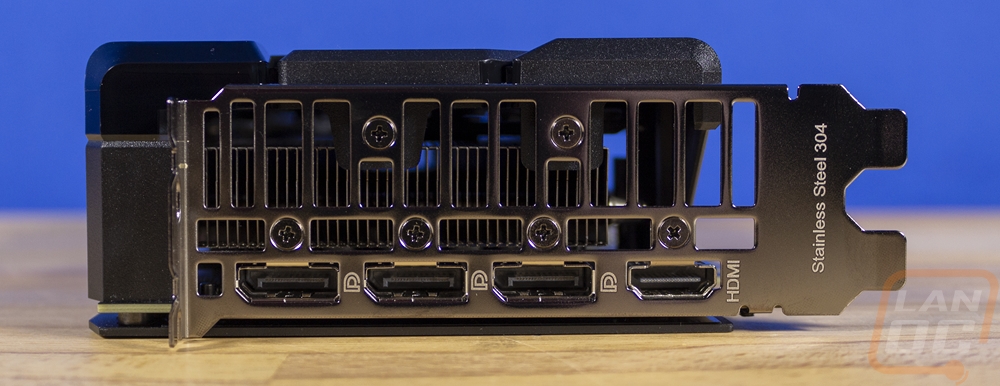
For display connections the rear PCIe bracket has them all lined up along the bottom edge along the PCB. It has three DisplayPort connections as well as one HDMI which is down at the bottom. This is the standard configuration but I do like that the HDMI isn’t just sitting in the middle of the DisplayPorts like in the past. Above that the bracket has rectangular openings across it for ventilation which with the cooling being oriented in a horizontal layout some of the airflow should blow out the back vents.
Test Rig and Procedures
CPU: Intel Core-i9 13900K – Live Pricing
PL1=PL2: 253, τ: 56 / 307A
Motherboard: Asus Z790 Extreme – Live Pricing
Cooling: Corsair H100i Elite LCD Display - Live Pricing
Noctua NT-H1 Thermal Paste - Live Pricing
Memory: Crucial 32GB Kit (2 x 16GB) DDR5-5600 UDIMM– Live Pricing
Storage: Sabrent Rocket Q4 2TB – Live Pricing
Power Supply: be quiet! Dark Power Pro 13 1600W- Live Pricing
Case: Primochill Wetbench - Live Pricing
OS: Windows 11 Pro 64-bit - Live Pricing
|
Our Testing Procedures |
|
|
3DMark |
All 3DMark-based tests are done using the most recent version. We test using all three versions of Fire Strike, Both Time Spy and Time Spy Extreme, and Speed Way. Tests to look at ray tracing performance are done with Port Royal when supported and for Nvidia cards that support DLSS, the DLSS subtest is also done at 1440p with the performance setting and DLSS 2.0 as well as a look at DLSS 1, 2, and 3 at 4K. |
|
Unigine Superposition |
1080p Extreme and 4k Optimized benchmarks along with the VR Future test are done. The VR test is done at the Oculus resolution |
|
VRMark |
Only the Blue room test is run |
|
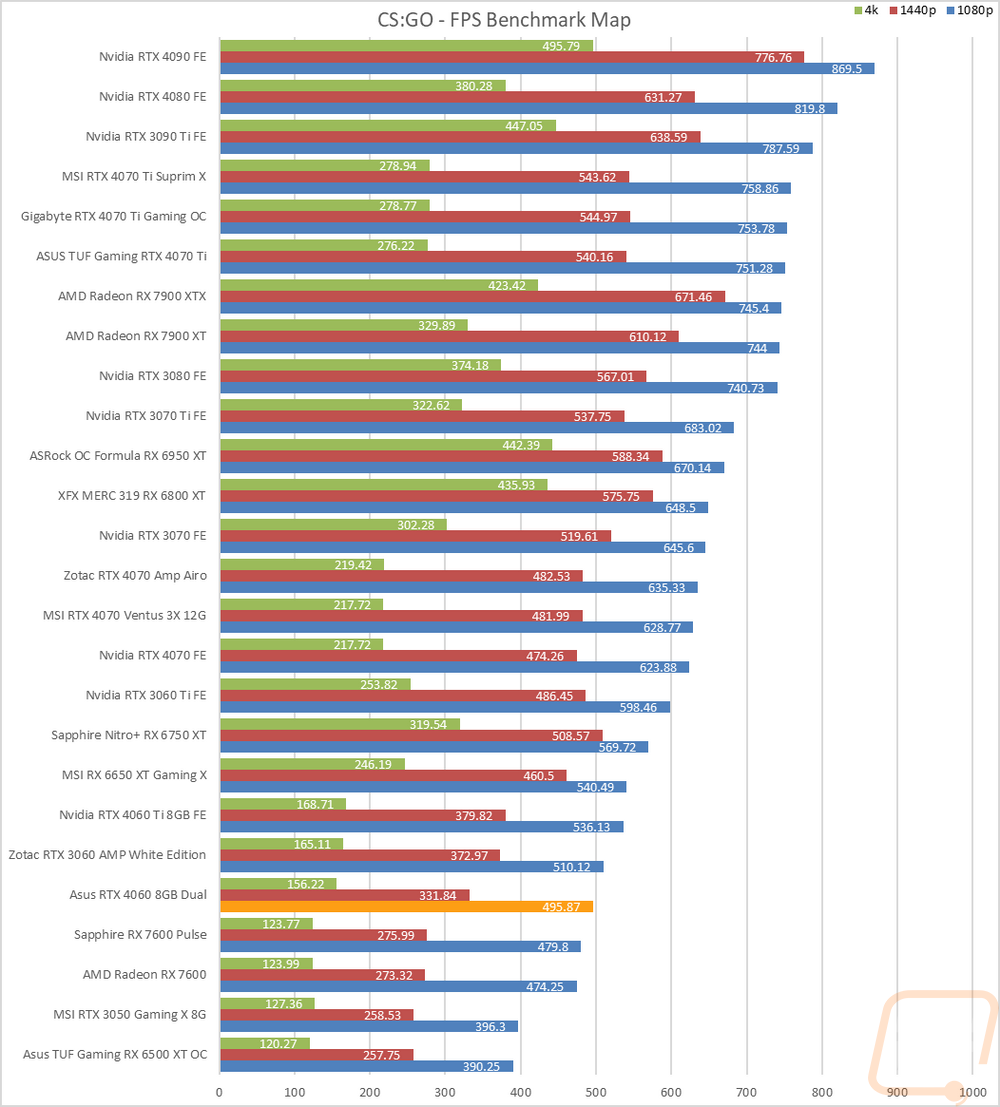
CS:GO |
This test is done using the workshop map called CS:GO Benchmark. You can find more information at this link. https://www.gamingpcbuilder.com/how-to-install-csgo-fps-benchmark-map/ I test at 1080p, 1440p, and 4K resolutions. All auto settings are turned off and detail is set to their highest settings. shadow quality high, model texture detail high, shader detail very high, AA set to 16x, uber shaders enabled |
|
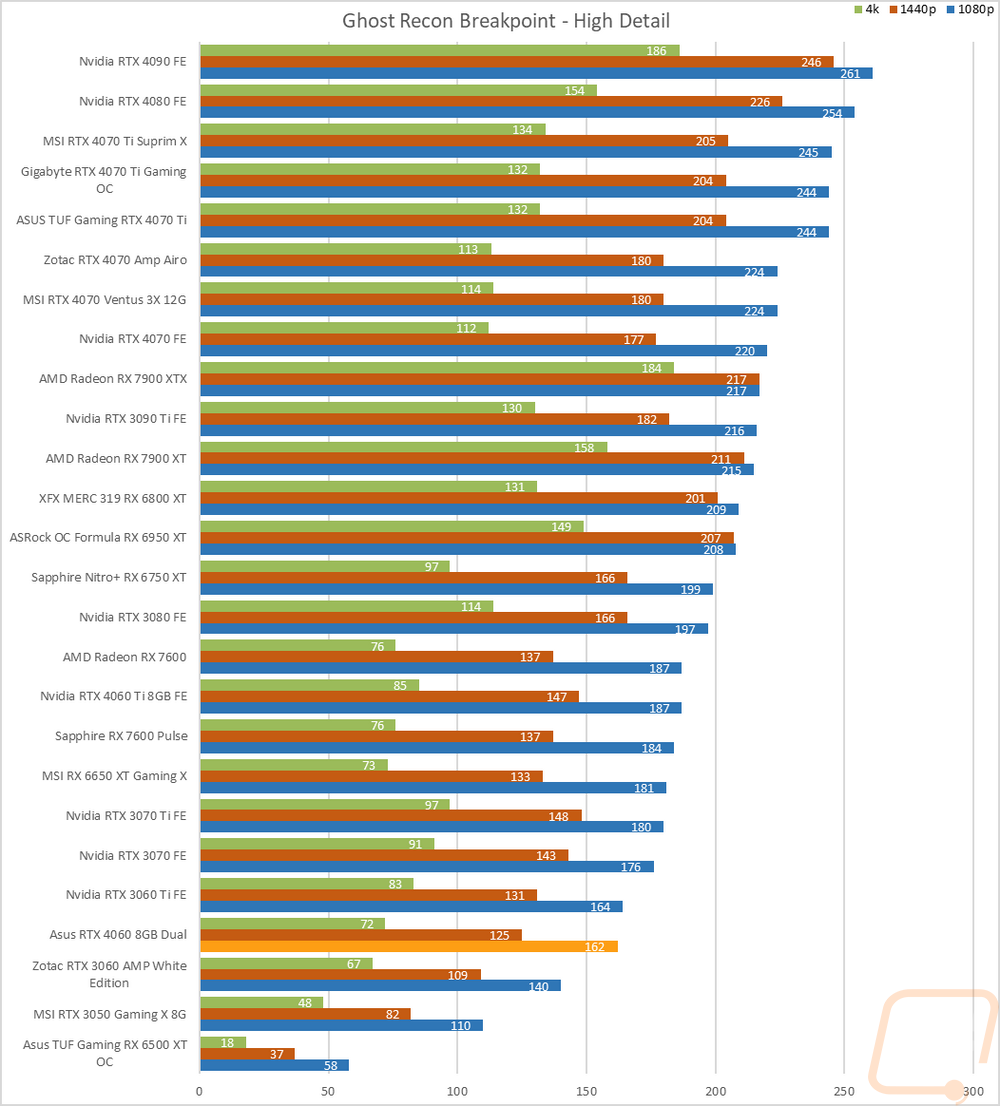
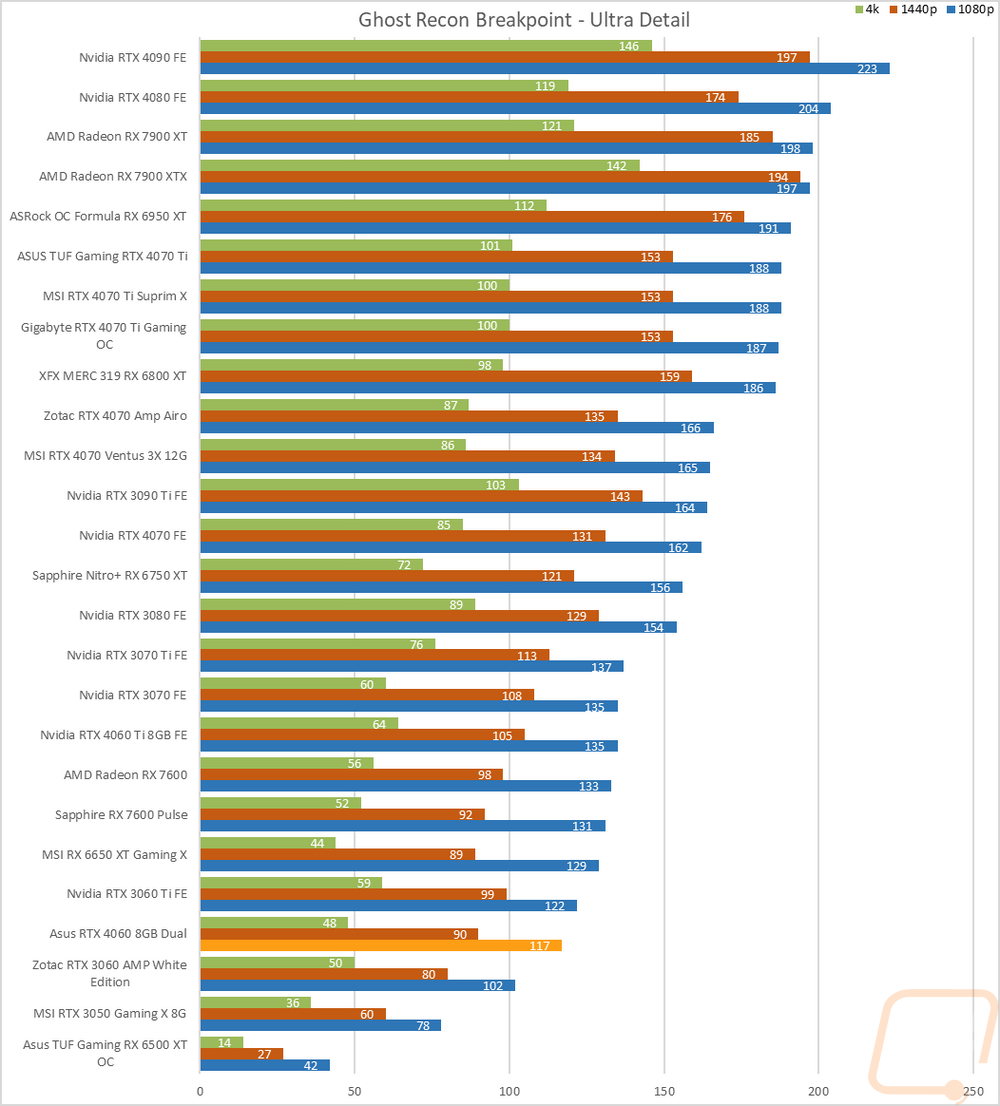
Ghost Recon Breakpoint |
Built-in benchmark tested at 1080p, 1440p, and 4k with the Ultra and Medium detail settings |
|
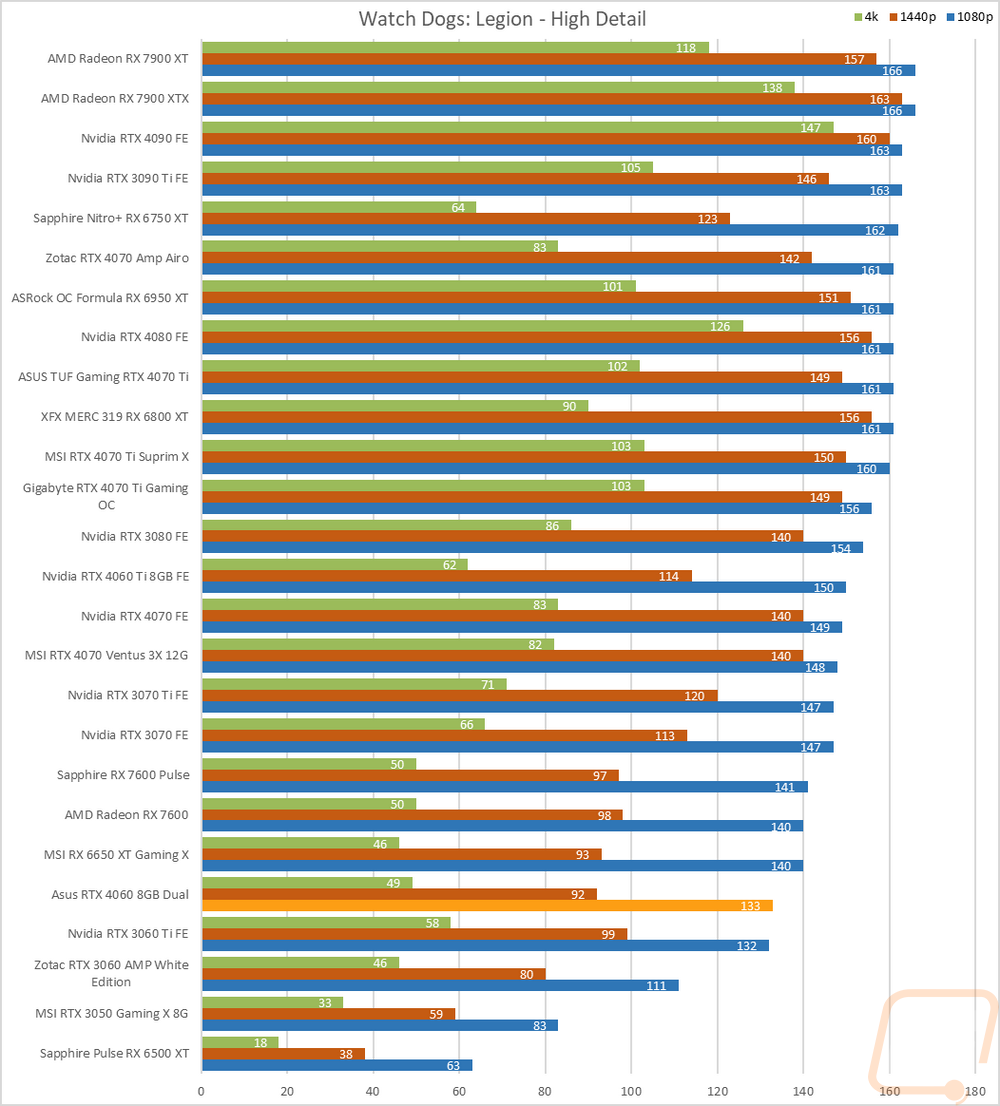
Watch Dogs: Legion |
Built-in benchmark testing at ultra and high details. Tested at 1080p, 1440p, and 4k. I also do RTX and DLSS testing on Nvidia cards at 4K using the Ultra detail settings as a base as well. |
|
Borderlands 3 |
Built-in benchmark testing with the ultra detail setting and medium detail setting, done at full screen with default settings at 1080p, 1440p, and 4k on DX11 |
|
Metro Exodus |
Using built-in benchmark, testing at ultra and normal details at 1080p, 1440p, and 4k. I also do RTX and DLSS testing at 4K with the ultra-detail base settings for Nvidia cards as well. |
|
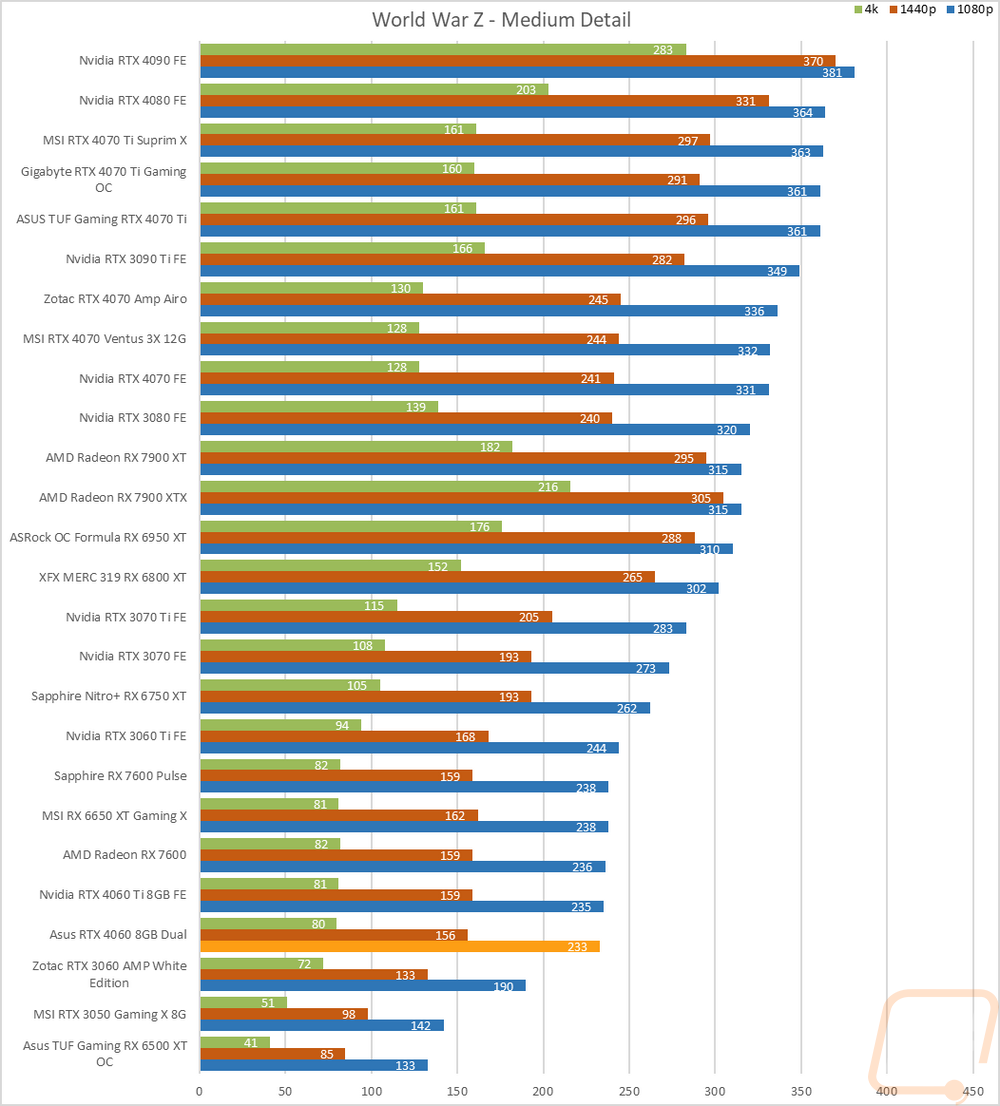
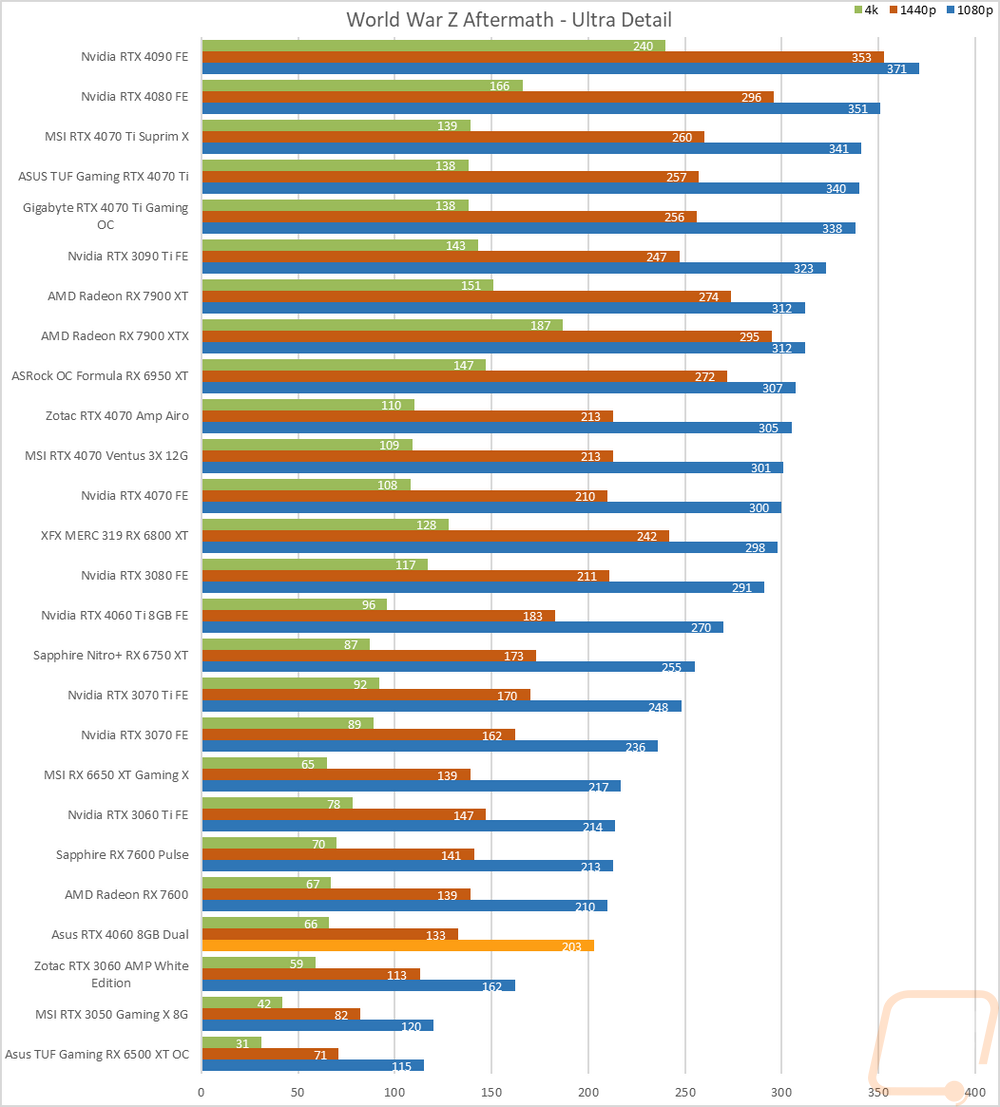
World War Z Aftermath |
Built-in benchmark in DX11 testing both the Ultra detail and Medium detail levels at 1080p, 1440p, and 4K resolutions |
|
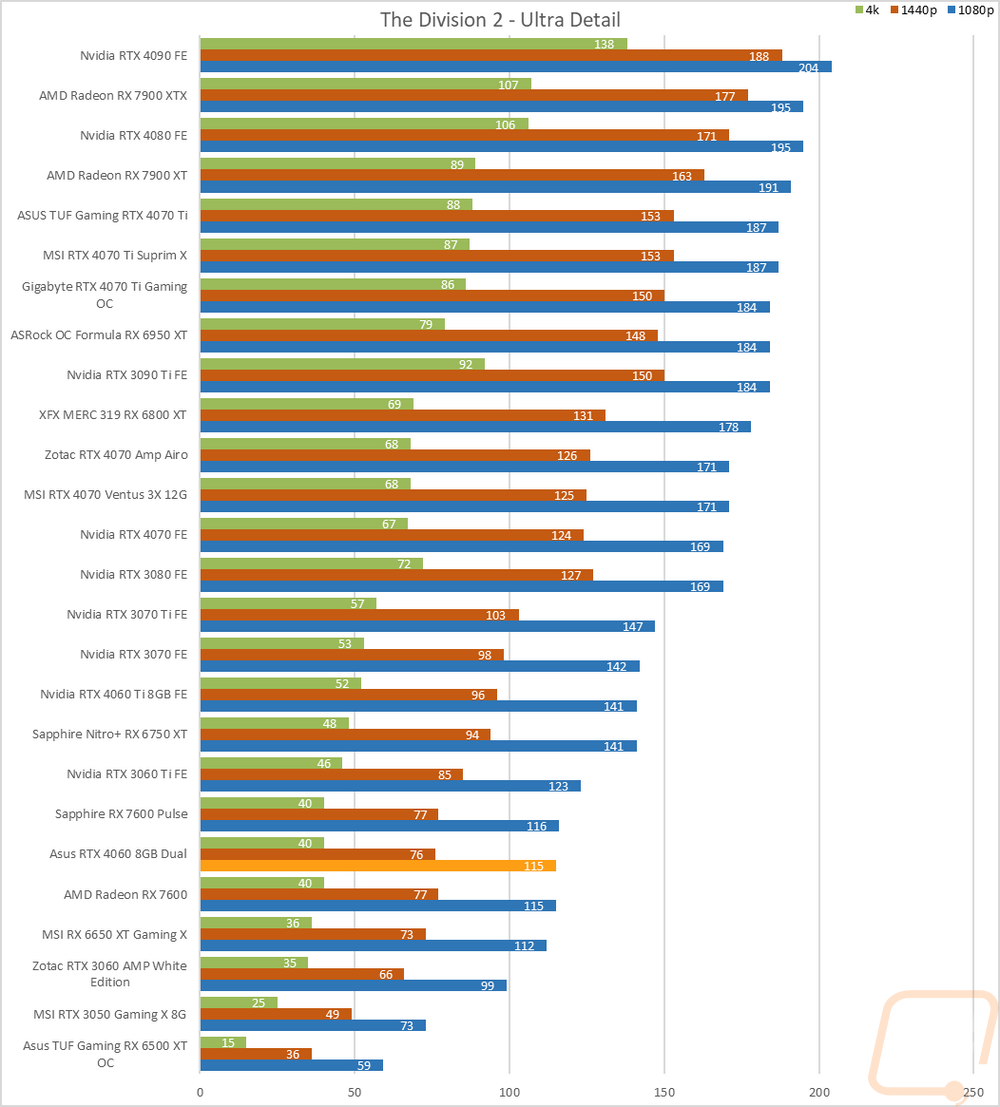
The Division 2 |
Built-in benchmark at Ultra detail with V-Sync turned off at 1080p, 1440p, and 4k resolutions. |
|
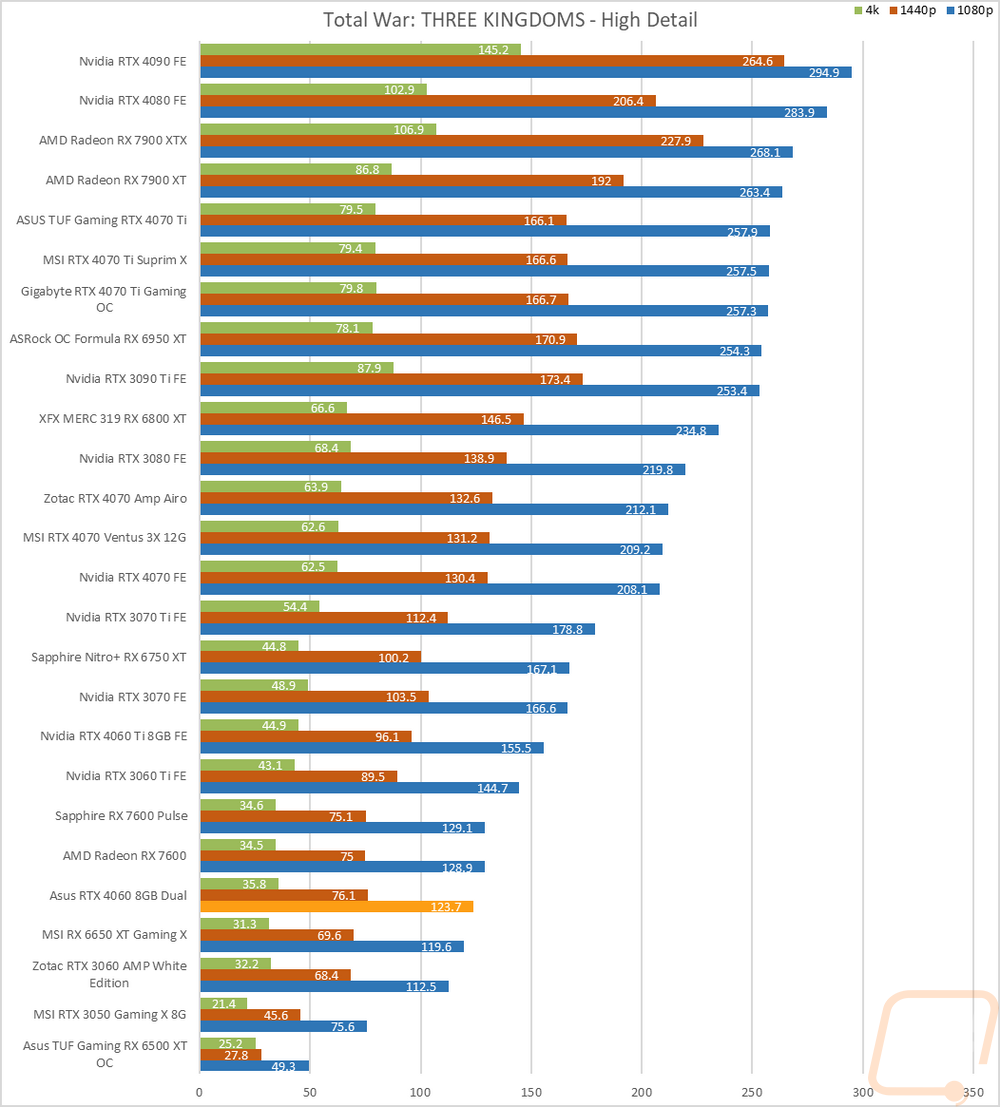
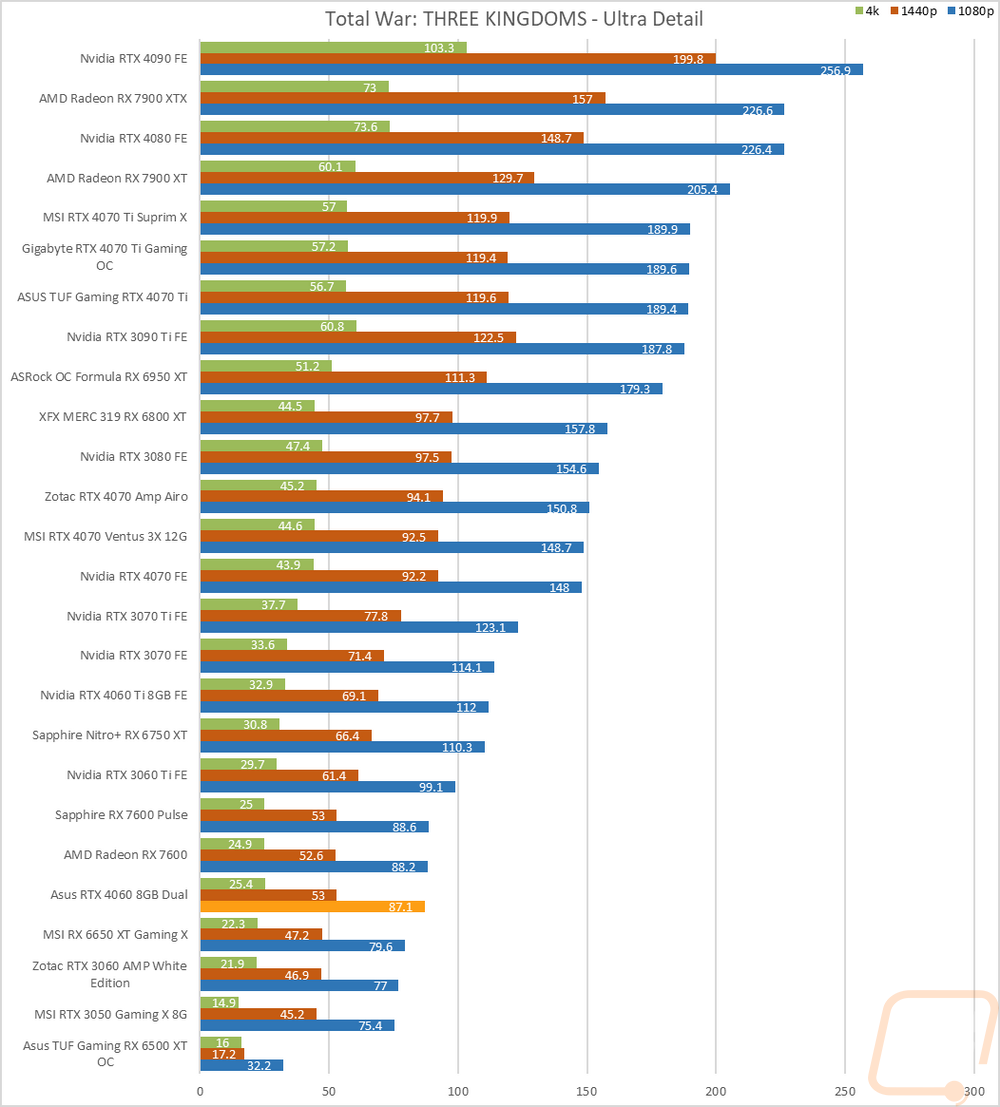
Total War: Three Kingdoms |
Built-in benchmark using the Battle Benchmark setting. Tested at 1080p, 1440p, and 4k at both high and ultra detail settings |
|
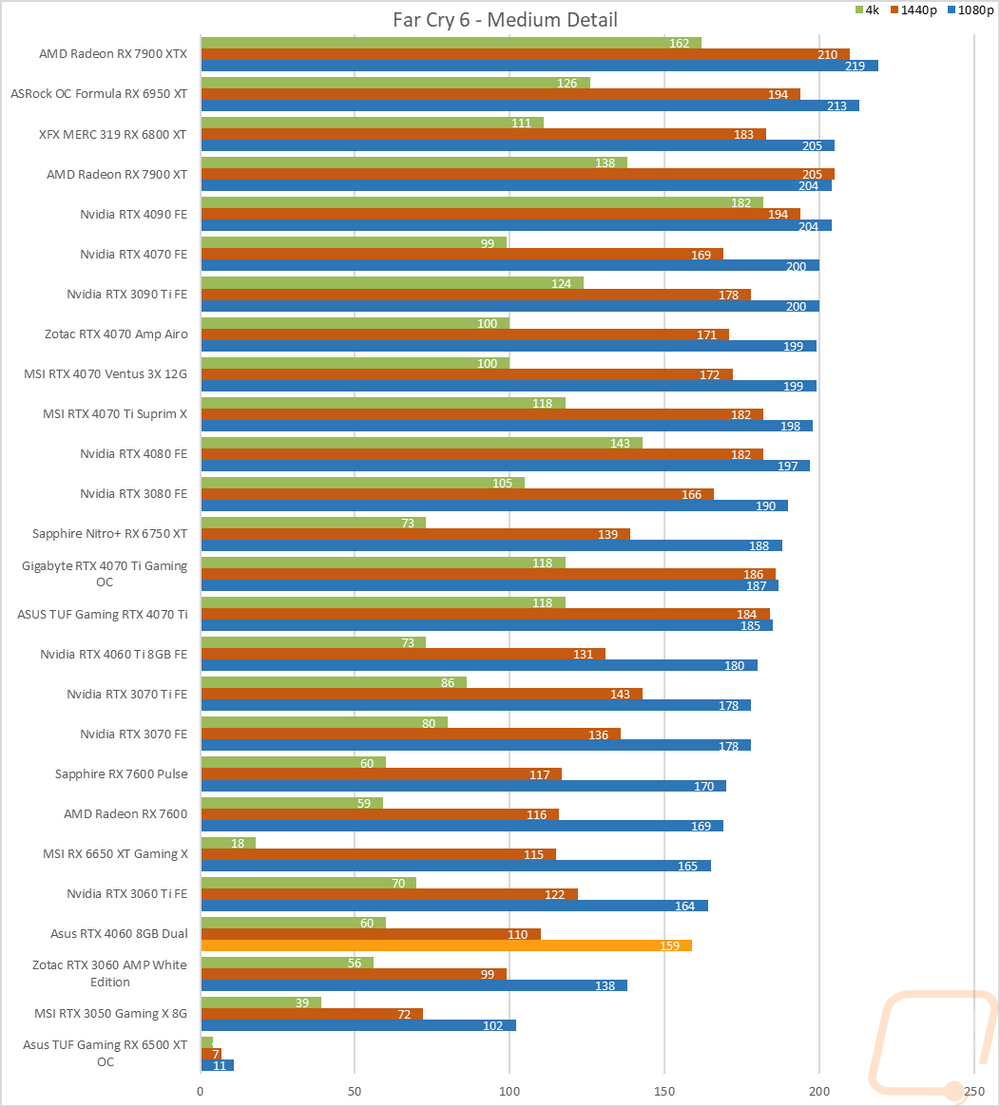
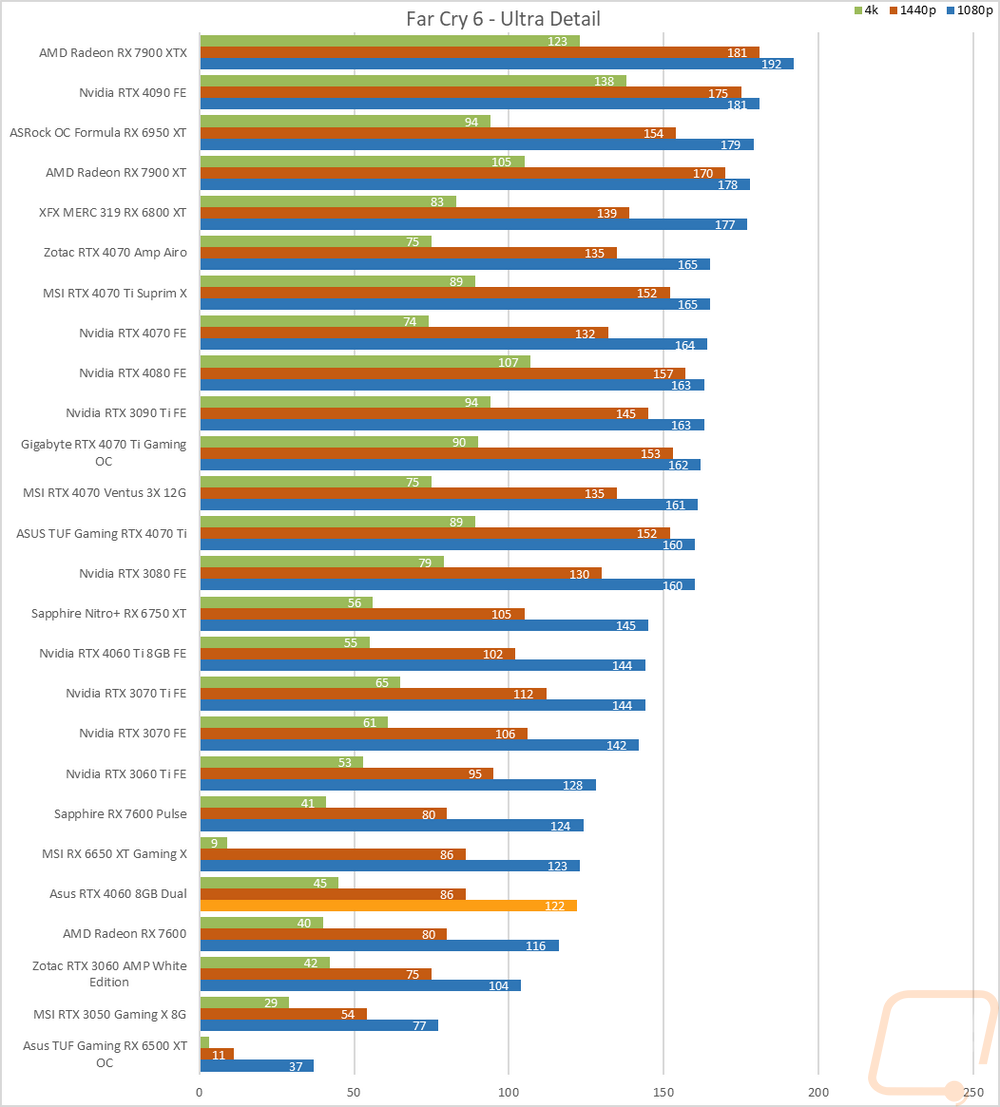
Far Cry 6 |
Built-in benchmark tested at 1080p, 1440p, and 4k with the Ultra and Medium detail settings |
|
V-Ray 5 |
V-Ray 5 benchmark us run with CUDA and RTX settings on cards that support it |
|
Boundary Benchmark |
Testing different DLSS detail levels on cards that support it. All testing is done at 4k with RTX on |
|
Bright Memory Infinite RTX Benchmark |
Benchmark all of the different RTX detail levels. Resolution at 4k and DLSS on balanced for each test |
|
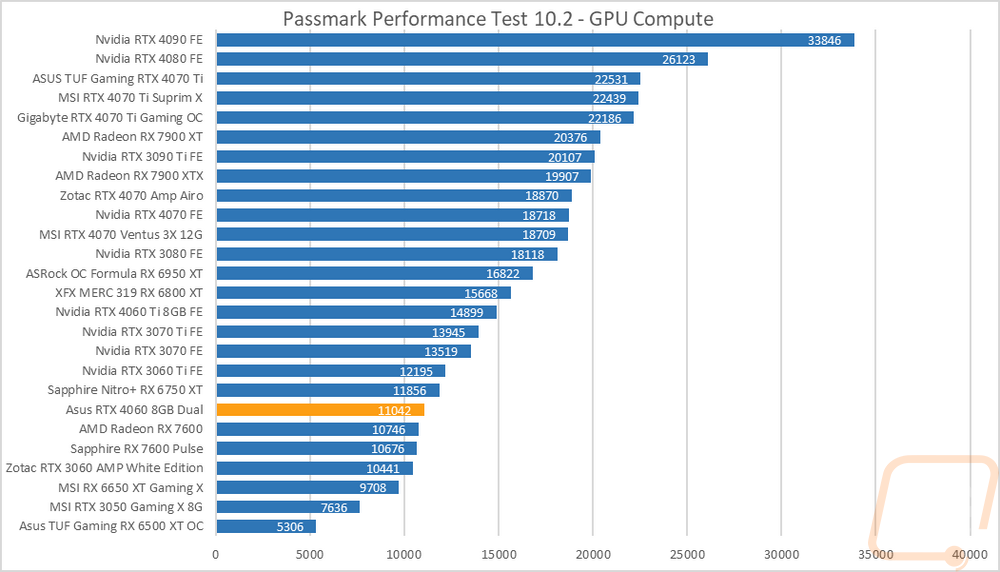
Passmark Performance Test 10.2 |
Test using the GPU Compute Score inside of PassMark's Performance Test 10.2 |
|
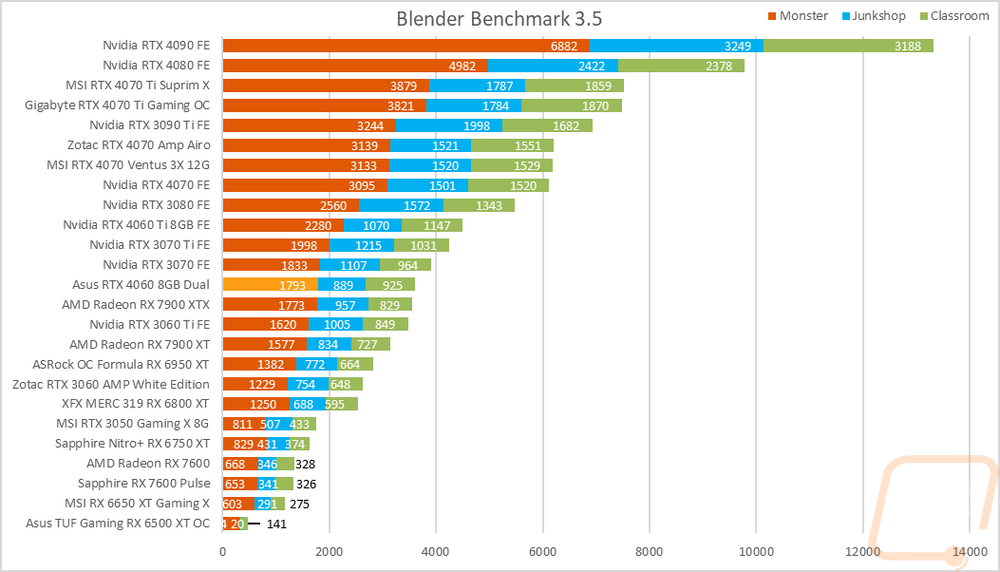
Blender |
Using the standard Blender Benchmark I run the test using the Blender 3.4 setting which tests using the Monster, Junkshop, and Classroom tests. |
|
OctaneBench 2020.1 |
OctaneBench is designed to test rendering in OctaneRender. RTX and non-RTX are both ran. This is a CUDA-only test so only Nvidia cards are tested |
|
Power Testing |
Using a PCat v2 to monitor power between the PCIe slot and the card as well as power through the power cables I test the peak power when running ADIA64, 3DMark Speed Way, 3DMark Time Spy Extreme, FarCry 6 at 4k and Ultra Detail, Watch Dogs Legion at 4K and Ultra detail, and Blender 3.4.0. The results are then averaged as well as the highest result. |
|
Noise Testing |
Our Noise testing is done using a decibel meter 18 inches away from the video card on the bottom/fan side of the card. We test at 50% and 100% fan speeds as well as a third test while under load using AIDA64's stress test. This is done using a Protmex PT02 Sound Meter that is rated IEC651 type 2 and ANSI S1.4 type 2. Tests are done set weighted to A and set to a slow response using the max function. The ambient noise level in the testing area is 33.3 decibels. |
|
Temperature Testing |
Using AIDA64, the GPU stress test is run for 30 minutes or until the result has leveled off. The test is run twice, once with the stock fan profile and a second time with 100% fan speed. During this, I also document the 100% fan speed RPM and document the delta between the fan profile and 100% fan speed as well as get thermal images. |
Synthetic Benchmarks
As always I like to start my testing with a few synthetic benchmarks. 3DMark especially is one of my favorites because it is very optimized in both Nvidia and AMD drivers. It's nice to not have to worry about it being favored too much either way and the repeatability of the results makes it a nice chance to compare from card to card, especially when comparing with the same GPU. In this case with the Asus Dual RTX 4060 8GB we don’t have another 4060 to compare it with. But I am interested in seeing how it compares to the 3060, 3060 Ti, and the 4060 Ti from Nvidia. Then from AMD the 7600, 6700XT, 6700, and 6650XT which are all in that same price range.
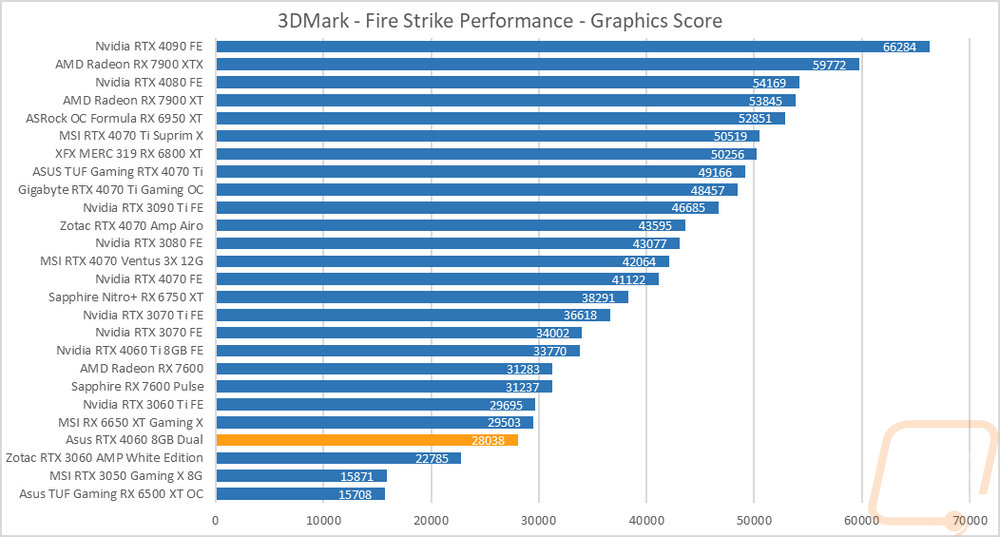
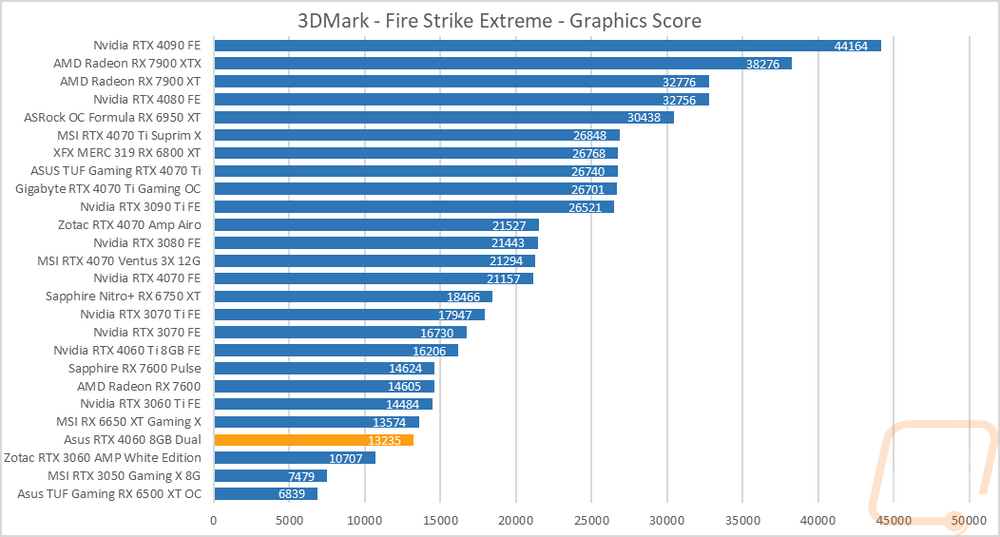
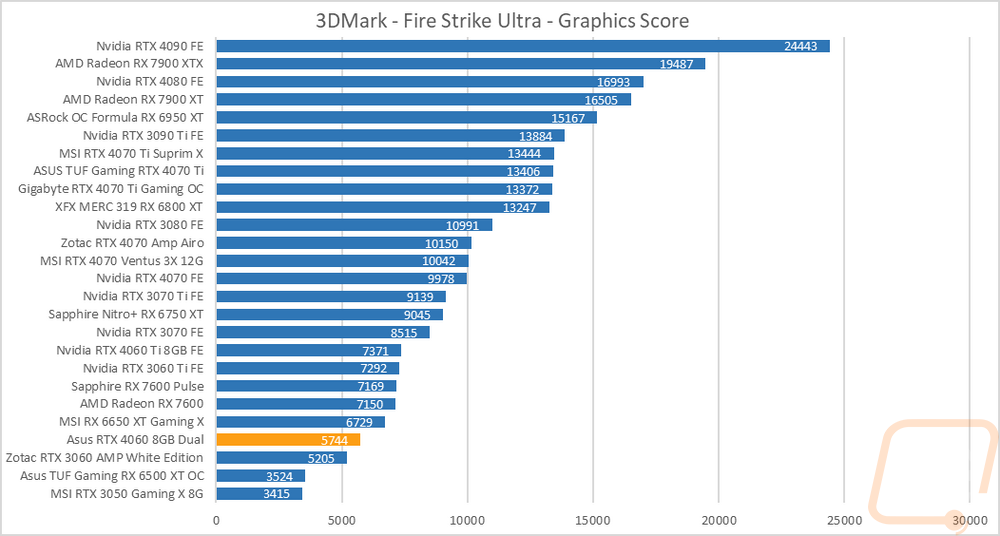
The first round of tests were done in the older Fire Strike benchmark which is a DX11 test. There are three detail levels, performance, extreme, and ultra. The Dual RTX 4060 scored a 28038 on the base Fire Strike benchmark putting it in below the 6650 XT and 3060 Ti but 5253 points in front of the RTX 3060. The extreme and ultra Fire Strike tests were similar but the 6650XT did edge out a little more in front in the ultra test.
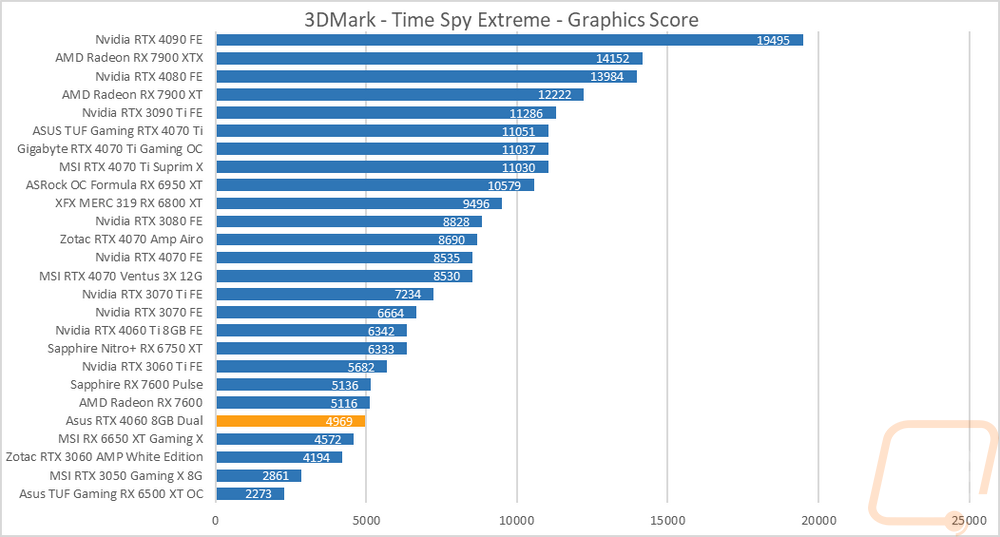
The next two were both based on the Time Spy benchmark. One is the standard test and then there is the extreme detail level. Time Spy is DX12 focused and Nvidia’s cards are known to perform a little better here and we can see that with the Dual RTX 4060 which was behind the 6650XT in Fire Strike sitting ahead of in both Time Spy tests. The Dual RTX 4060 was just a few points behind the RX 7600 in both as well.

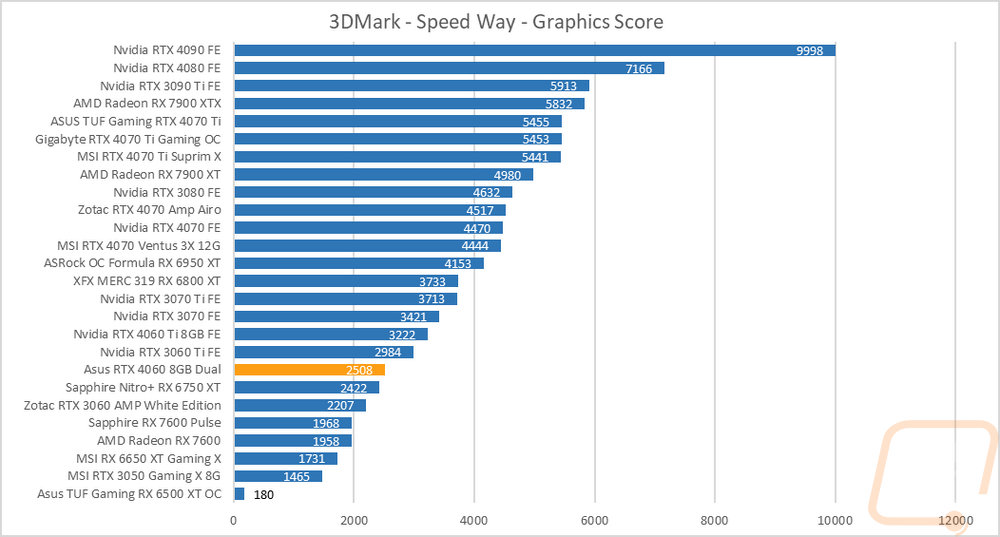
I did also test using the new 3DMark Speed Way which is their latest benchmark. Speed Way is DX12 as well but combines in more future-focused tech like Ray Tracing which up until now 3DMark has only used in feature tests. The Dual RTX 4060 did much better here with it sitting out in front of the RX 6750 XT but there is still a big gap between the Dual RTX 4060 and the RTX 3060 Ti. Overall though, at least compared to the AMD cards this shows Nvidia’s focus on ray tracing performance even in cards like the RTX 4060.
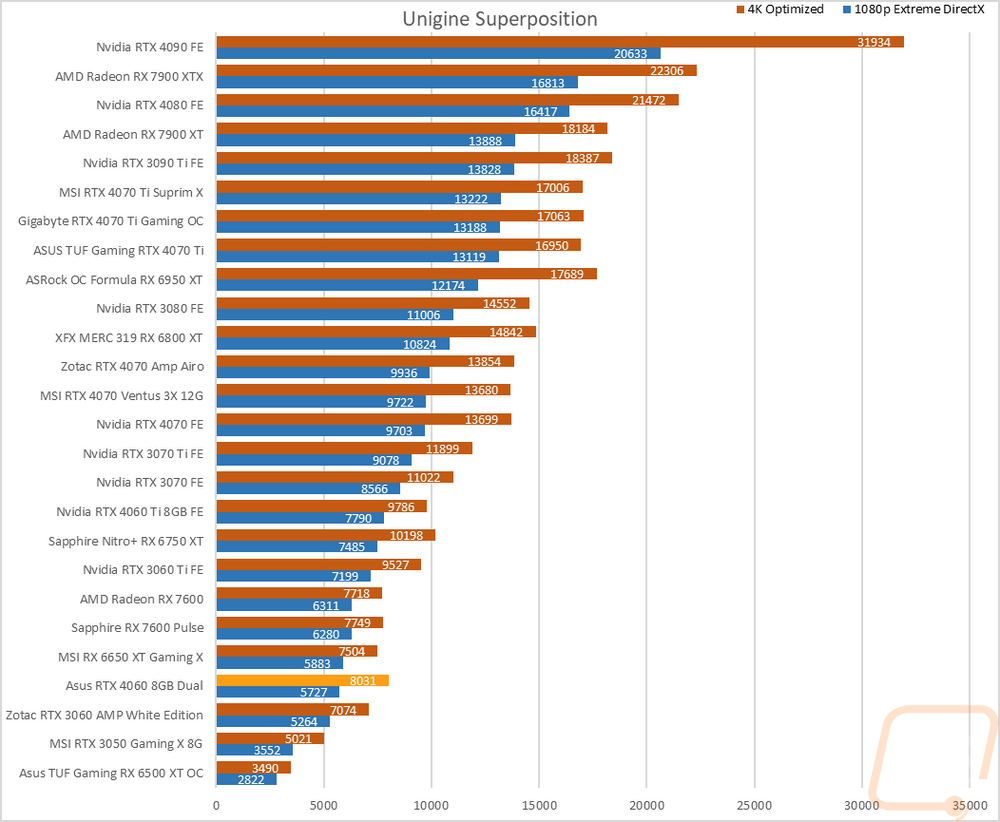
The last test was using the Unigine-based Superposition benchmark and I tested at 1080p with the extreme detail setting as well as the 4K optimized setting. In the extreme detail setting the Dual RTX 4060 and the RX 6650 XT are right with each other, switching to the 4K test however had the Dual RTX 4060 out in front of the 6650XT and the RX 7600. The 3060 Ti is still out in front of both by a good margin, however.
VR Benchmarks
As for Virtual Reality, I love it but it is more demanding than traditional gaming. This is partially because of the resolutions needed to render for two eyes and because they render more than what is immediately visible. But also because of post effects to get the proper “fisheye” effect for it to look proper in your eyes with the HMD. You also have to have much higher expectations for frame rates in VR, skipping frames or lower FPS can cause motion sickness in VR. Because of that, I ran a few tests.
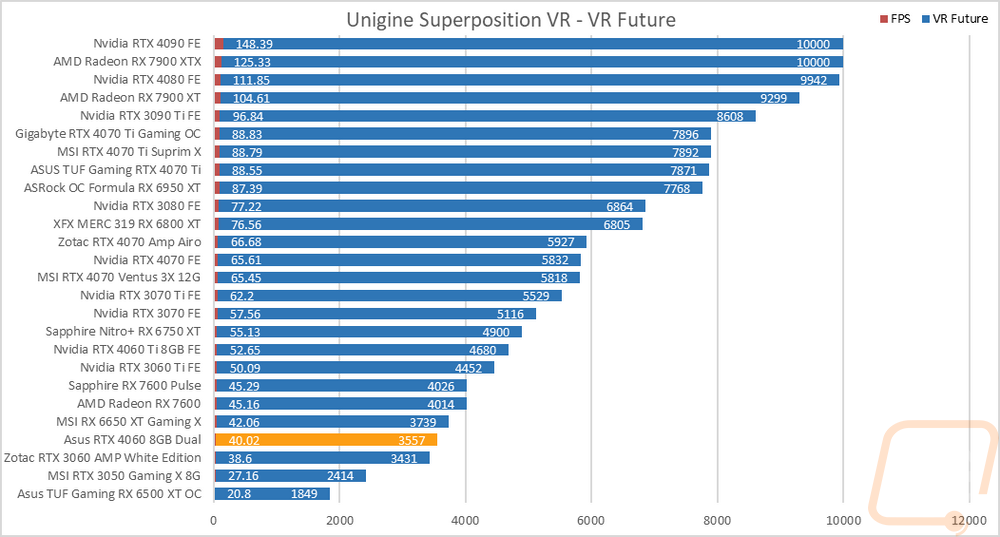
My first test was again in Superposition. This time I tested the VR Future test using the Oculus resolution. I have also included the average frame rate as well which is important for the cards at the top of the chart because for some reason Superposition is capped at 10,000 for its scores and that doesn’t show the performance gap in those cards at the top. The Dual RTX 4060 in 2 FPS and is over 100 points behind the RX 6650 XT here with the 7600 and then the 3060 Ti even farther out ahead. In fact, the Dual RTX 4060 wasn’t far from the RTX 3060 on this one.
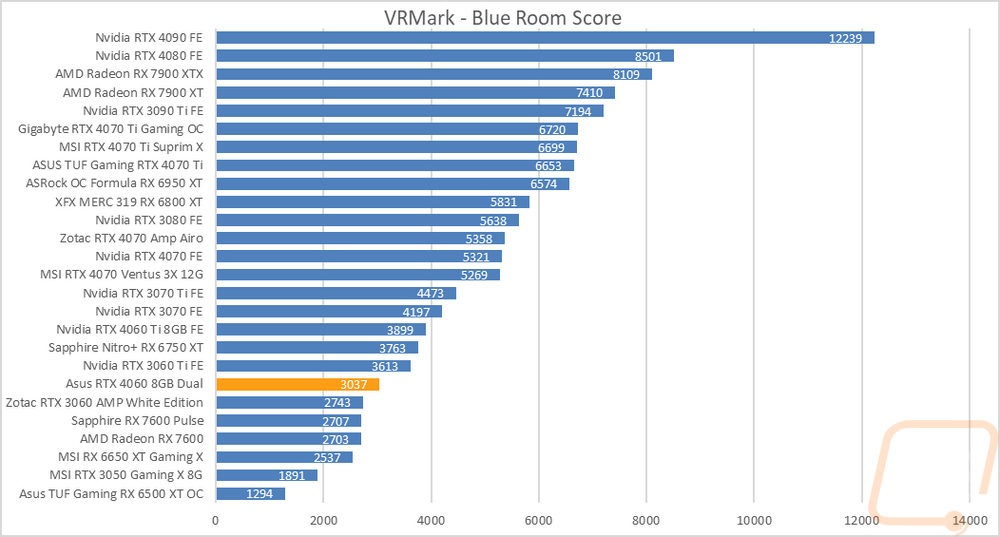
My second round of VR testing was in VRMark which has three tests that are similar to the VR tests in Superposition. I only focused on just the most demanding test called Blue Room which is looking more at future VR performance. The Dual RTX 4060 did better here with it ahead of both RX 7600 that have been tested but it does still end up sitting in between the RTX 3060 and the RTX 3060 Ti with the Ti rather in front than the Dual RTX 4060 is in front of the 3060.
In-Game Benchmarks
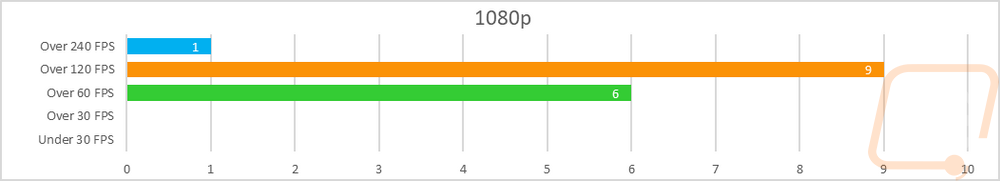
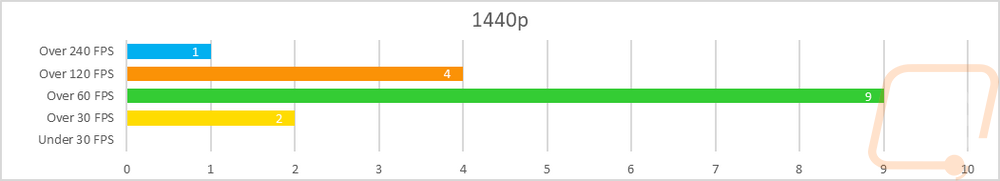
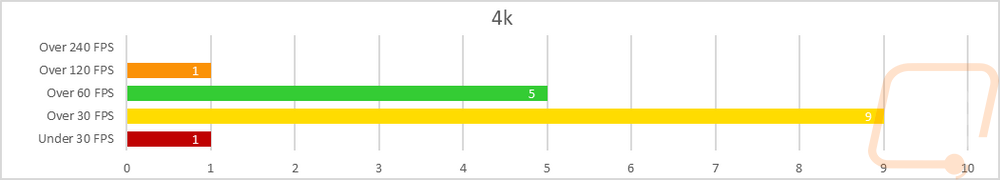
Now we finally get into the in game performance and that is the main reason people pick up a new video card. To test things out I ran through our new benchmark suite that tests 10 games at three different resolutions (1080p, 1440p, and 4k). Most of the games tested have been run at the highest detail setting and a mid-range detail setting to get a look at how turning things up hurts performance and to give an idea of if turning detail down from max will be beneficial for frame rates. In total, each video card is tested 54 times and that makes for a huge mess of results when you put them all together. To help with that I like to start with these overall playability graphs that take all of the results and give an easier-to-read result. I have one for each of the three resolutions and each is broken up into four FPS ranges. Under 30 FPS is considered unplayable, over 30 is playable but not ideal, over 60 is the sweet spot, and then over 120 FPS is for high refresh rate monitors.
So how did the Asus Dual RTX 4060 do? In our overall graphs we can see that at 1080p all of the results were playable or better with 6 results over 60 FPS and under 120 FPS and 9 results over 120 FPS then with CS:GO up over 240 FPS. At 1440p the performance drops some with two results under 60 FPS but still, most of the results are smooth with 9 over 60 FPS and 4 over 120 as well and one result up over 240 FPS. Then at 4K performance slows to a crawl with 1 result in the unplayable range and 9 were over 30 FPS but under 60 FPS. 5 results were still playable and over 60 FPS and CS:GO came in over 120 FPS.
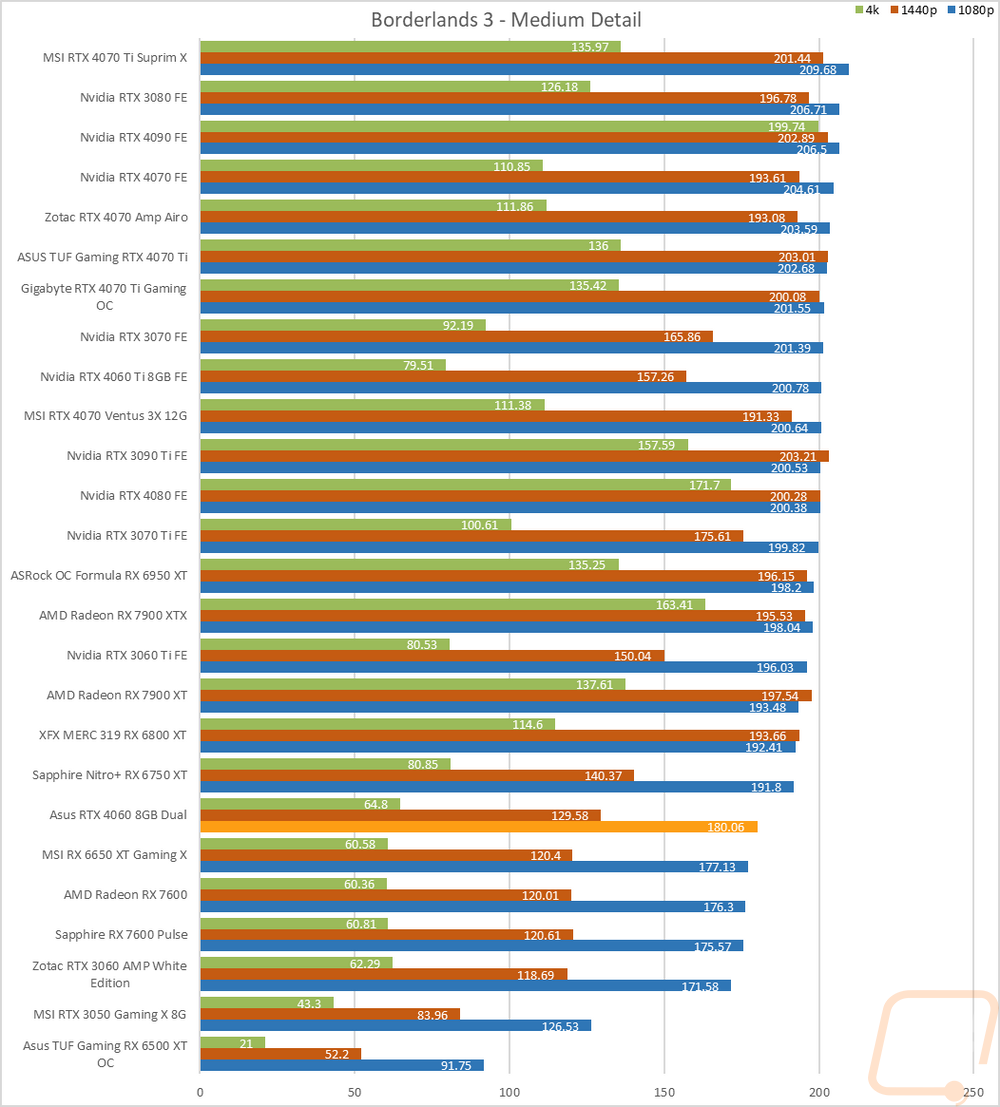
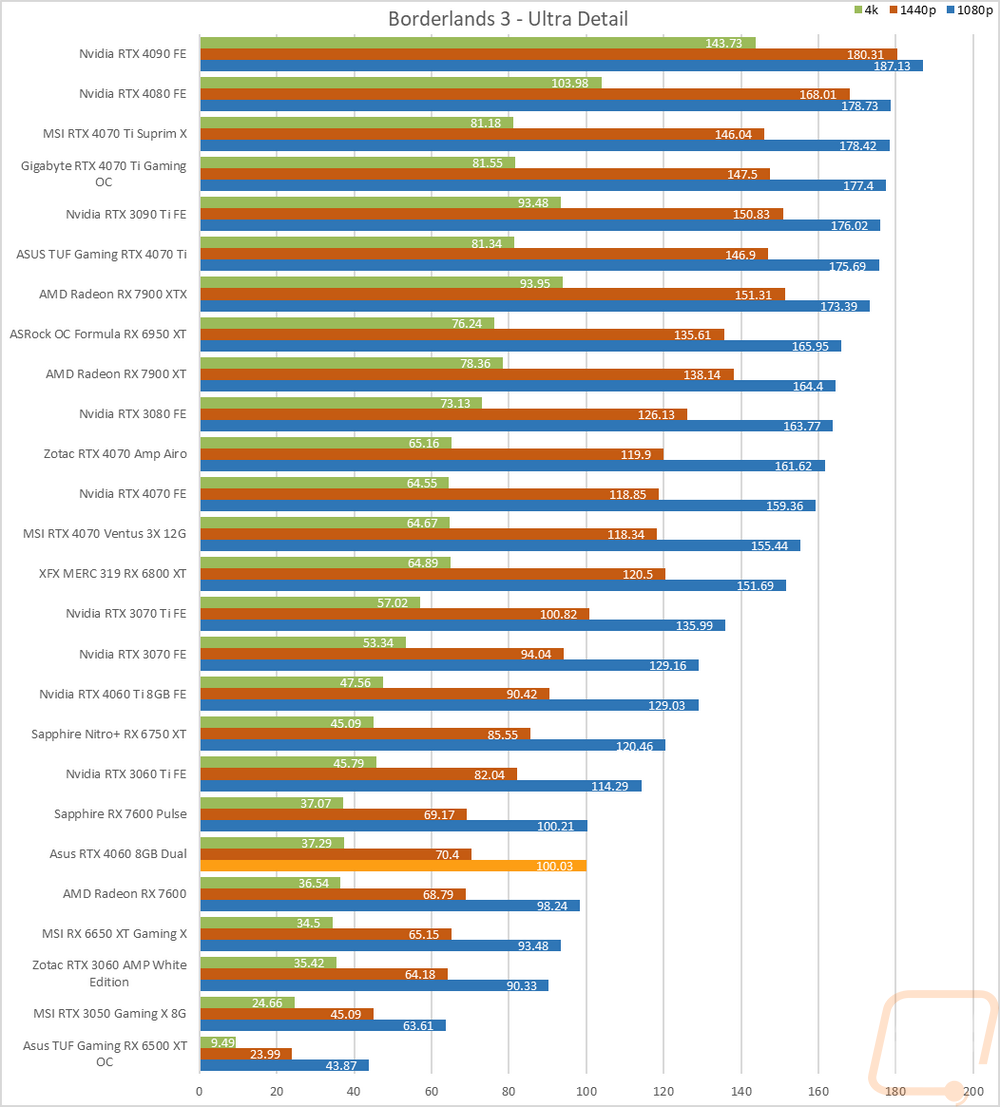
Of course, I have all of the actual in game results as well for anyone who wants to sort through the wall of graphs below. I also put together a few averages of the results with CS:GO removed to prevent it from messing up the results with its always high numbers. This gives us a great look at how the RTX 4060 compares to last generation's Nvidia cards as well as similarly priced cards from AMD. As we have seen in most of our tests so far the 4060 is way out in front of the 3060 but behind the last generation RTX 3060 Ti. The gap between the 3060 and the 4060 gets smaller as the resolution gets higher with it being just 4 FPS at 4k. At 1080p which is the targeted resolution for all of these cards the 4060 is 2 FPS behind the 6650 XT, it does catch up at 1440p and passes it at 4k, not that 4k matters too much in this situation. The RX 7600, AMDs first 1080p 7000 Series card has 5 FPS on the 4060 at 1080p but that gap gets smaller as the resolution goes up and they have the same 50 FPS at 4k.
|
|
1080p |
1440p |
4k |
|
RTX 4060 Ti FE |
160 |
115 |
62 |
|
Nvidia RTX 3060 Ti FE |
145 |
105 |
59 |
|
AMD Radeon RX 7600 |
141 |
97 |
50 |
|
MSI RX 6650 XT Gaming X |
138 |
94 |
43 |
|
Asus RTX 4060 8GB Dual |
136 |
95 |
50 |
|
Zotac RTX 3060 AMP White Edition |
117 |
83 |
46 |
Compute Benchmarks
Now some people don’t need a video card for gaming, they need the processing power for rendering or 2D/3D production, or in some cases, people who game also do work on the side. So it is also important to check out the compute performance on all of the video cards that come in. That includes doing a few different tests. My first test was a simple GPU Compute benchmark using PassMark's Performance Test 10 and the Dual RTX 4060 is sitting ahead of the RX 7600 but behind the 6750 XT and the 3060 Ti.
Blender is always my favorite compute benchmark because the open-source 3D rendering software is very popular and it isn’t a synthetic benchmark. With the latest version of Blender, they redid the benchmark so we now have a new test that runs three different renderings and gives each a score. I have all three stacked together so we can see the overall performance. The Dual RTX 4060, when everything is put together, is out in front of the RTX 3060 Ti as well as the RX 7900 XT from AMD and behind the RTX 3070.
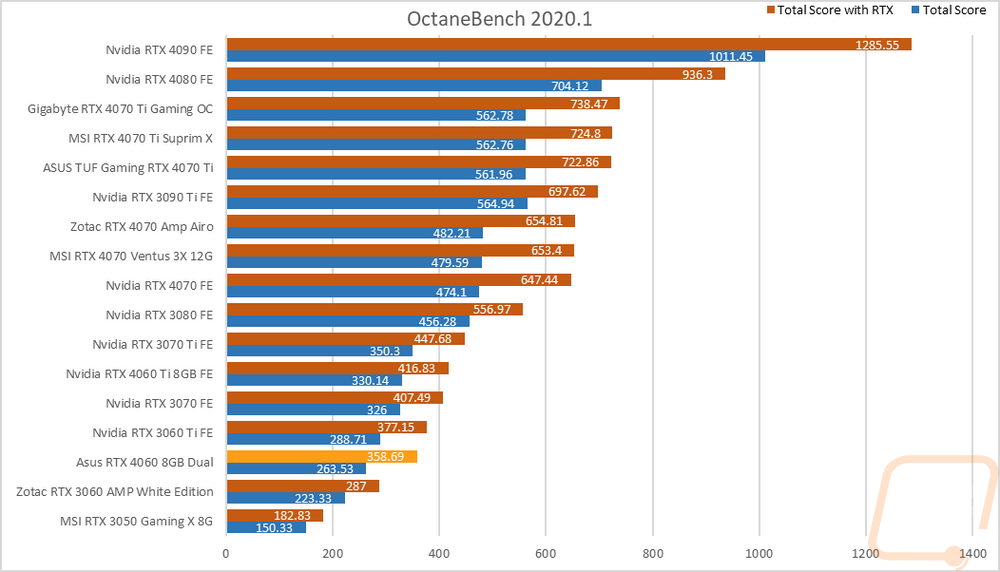
For CUDA-based cards, I also check out OctaneRender performance using their OctaneBench 2060.1 benchmark which allows me to check out both RTX and non-RTX rendering performance. Here the Dual RTX 4060 is behind the 3060 Ti in both tests but is at least closer than in some of the previous tests and has a big margin between it and the RTX 3060.
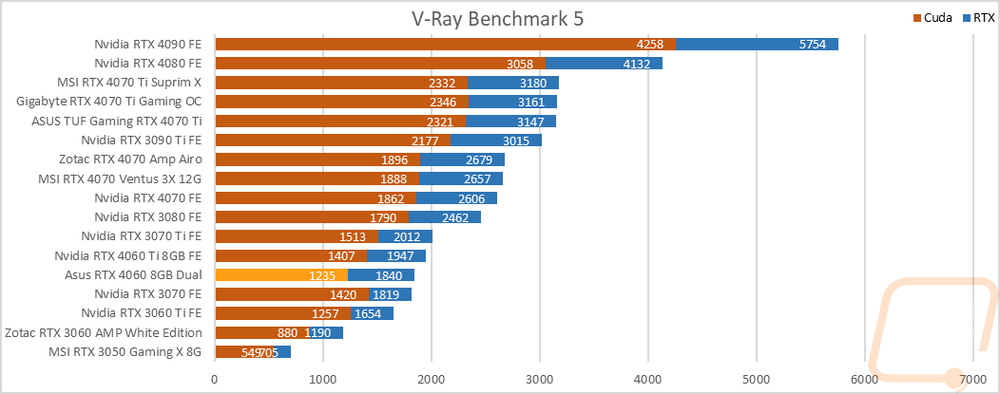
For an additional CUDA-based test I also ran V-Ray Benchmark 5 to check out CUDA and RTX performance in the 3D rendering and simulation software. The Dual RTX 4060 is behind the RTX 3060 Ti on the CUDA test but did well with the RTX test sitting just ahead of the RTX 3070.
RTX and DLSS
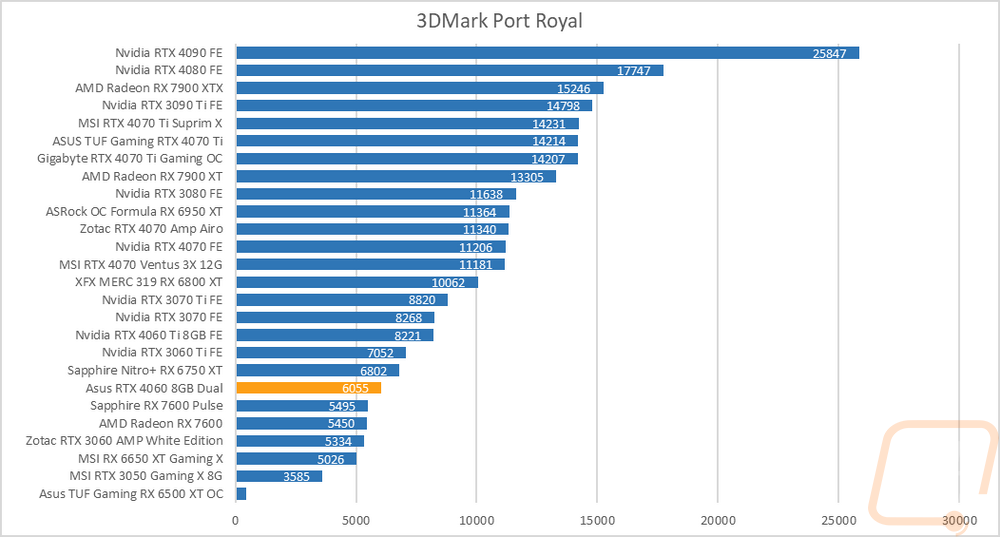
Being an RTX card I also like checking out the performance of some of Nvidia’s features. Namely the ray tracing performance and the performance improvements you can see by using DLSS combined with the tensor cores. My first test goes back to our synthetic benchmarks with 3DMark where I check out their Port Royal benchmark. This is the one test that does also have AMD Ray Tracing support which is great to get a look at how different cards including older non-RTX cards perform. The Dual RTX 4060 sits 11% ahead of the RX 7600 but is behind the 6750 XT and the 3060 Ti by just as big of a margin.
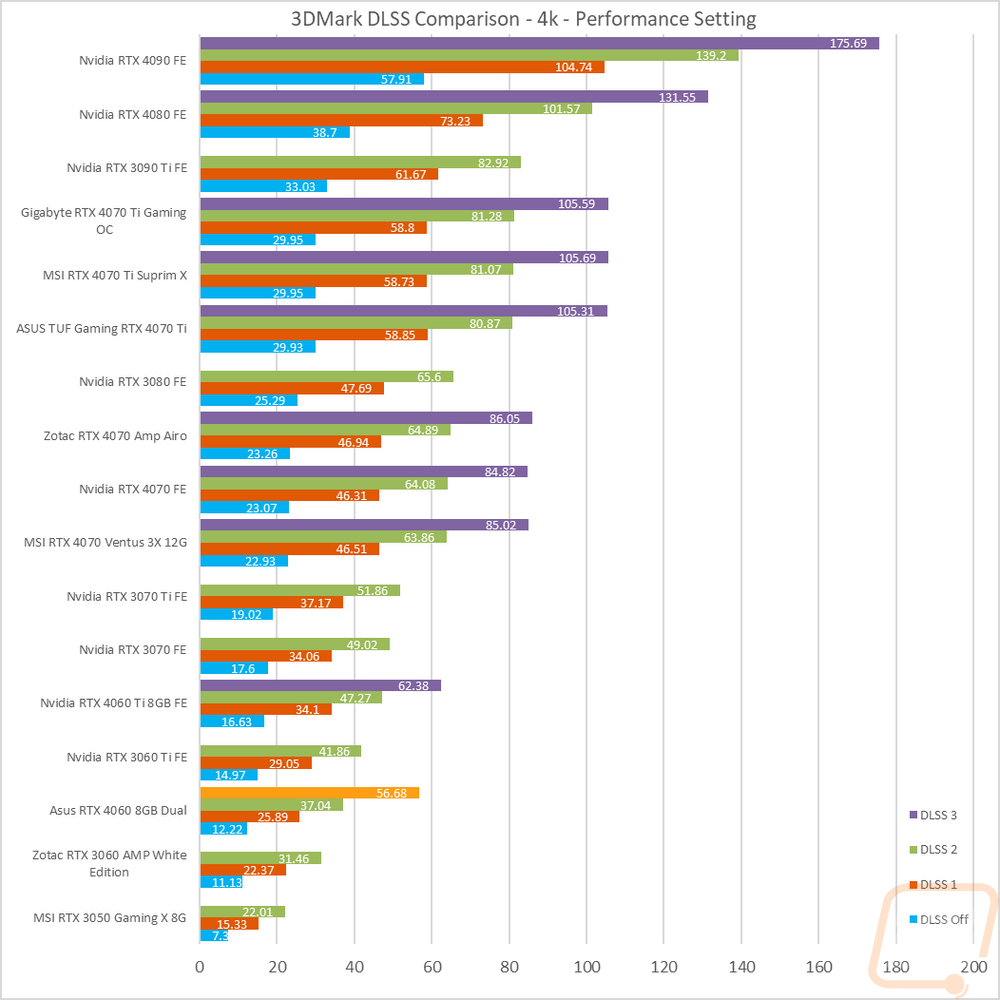
3DMark also has added in a few feature tests, one being a look at DLSS performance. For this one, I have the resolution set to 4K and I test with all three versions of DLSS as well as with it off completely. All DLSS are set to their performance setting as well to keep the results comparable. This gives us a great look at the performance improvements that DLSS has given with DLSS 3 also including frame generation. The Dual RTX 4060 sits above the RTX 3060 and below the 3060 Ti when comparing DLSS 2 performance. Those cards don’t support frame generation so there isn’t any comparison there but the Dual RTX 4060 sits behind the 4060 Ti by 6 FPS. This is also a good look at how DLSS performance has improved and just how much frame generation has to offer over DLSS 2.
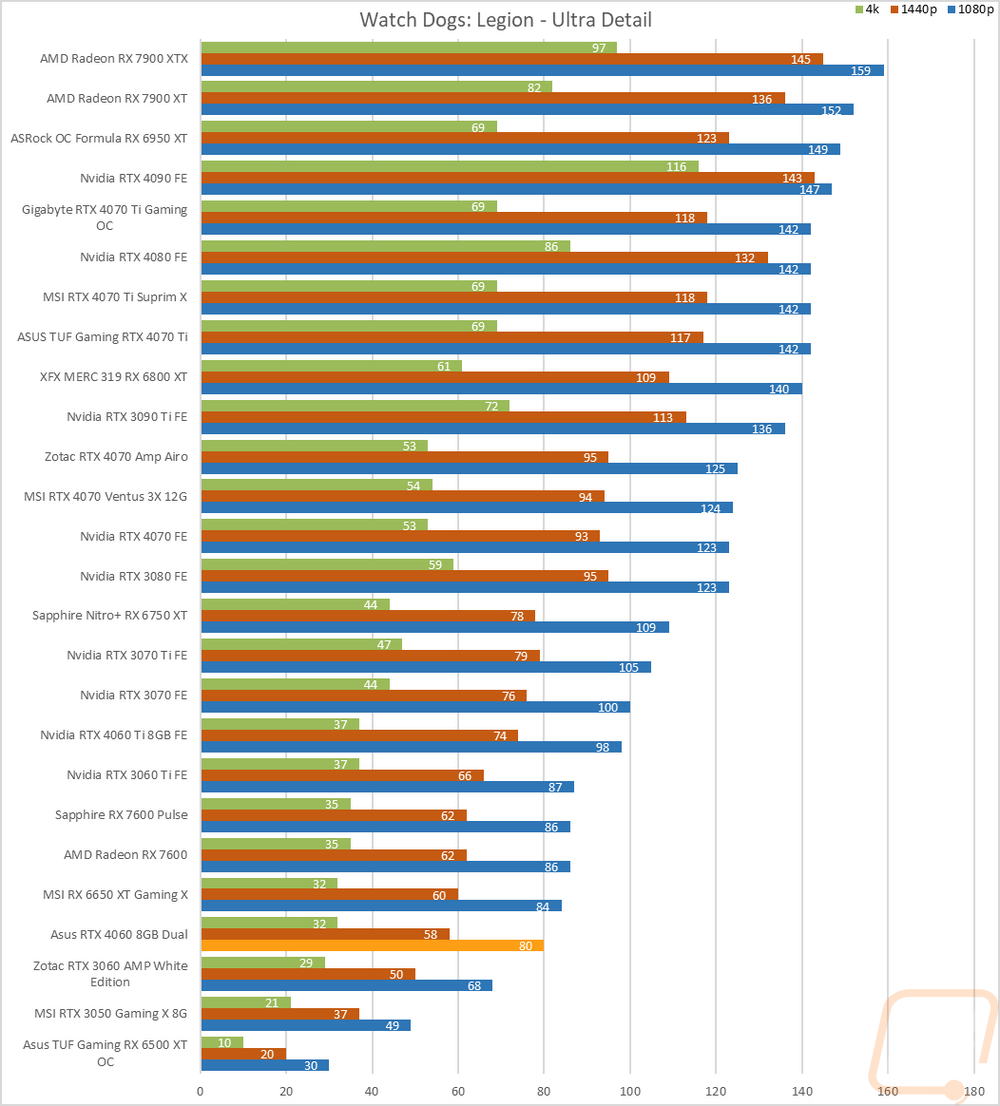
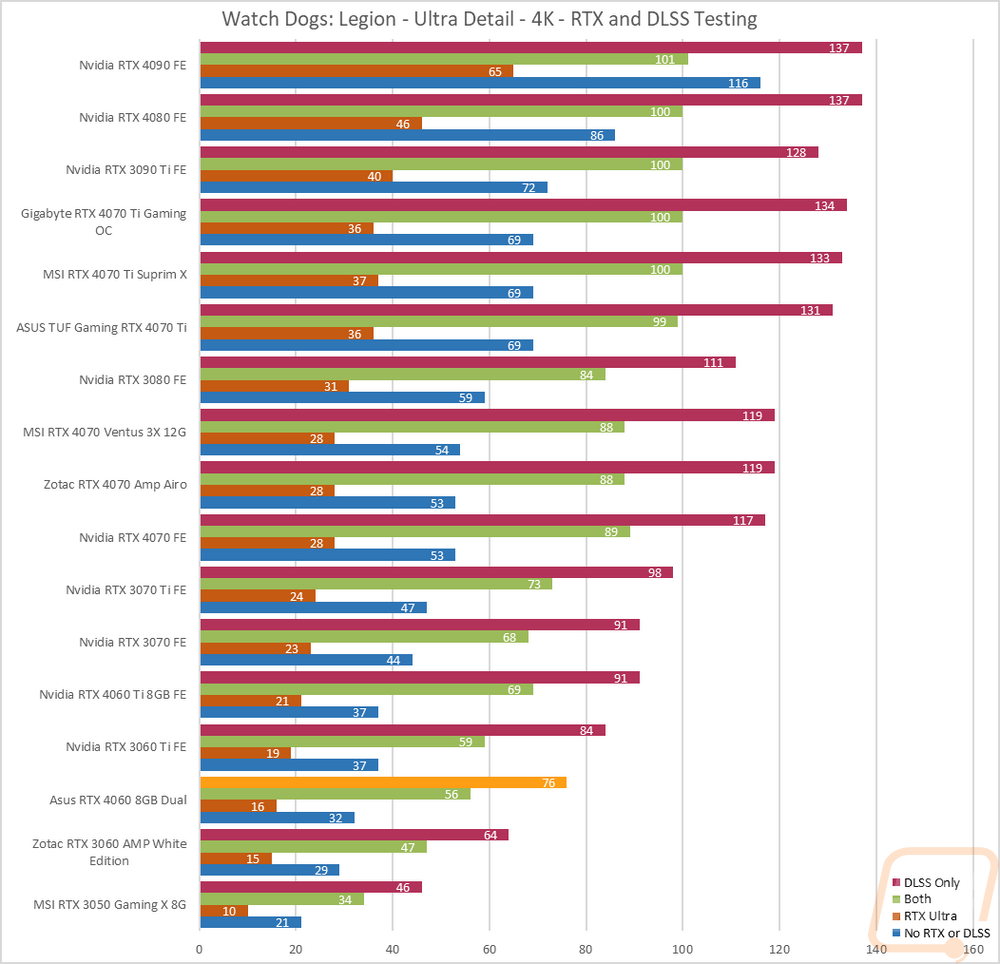
I then jumped into game tests, this time with Watch Dogs: Legion. For this one, I wanted to get an idea of the performance you will see when taking advantage of Nvidia’s RTX and DLSS features. I tested at 4k with the ultra detail setting and with ultra being the setting for DLSS and RTX when they are on as well. I then test with no RTX or DLSS on and then with RTX DLSS on and off and on together. Here the Dual RTX 4060 is once again ahead of the RTX 3060 and behind the 3060 Ti. This test also shows how RTX and DLSS affect performance. For the Dual RTX 4060 without either at 4K with ultra detail which is admittedly not a resolution the 4060 is designed for. But it ran at 29 FPS without RTX or DLSS. Turning RTX on dropped that even lower to 15 FPS. But with DLSS on and RTX it was up to 47 FPS and over 60 FPS with the 64 FPS it did with just DLSS which is a good example of how DLSS can help the Dual RTX 4060 punch above its weight class in games that support it.
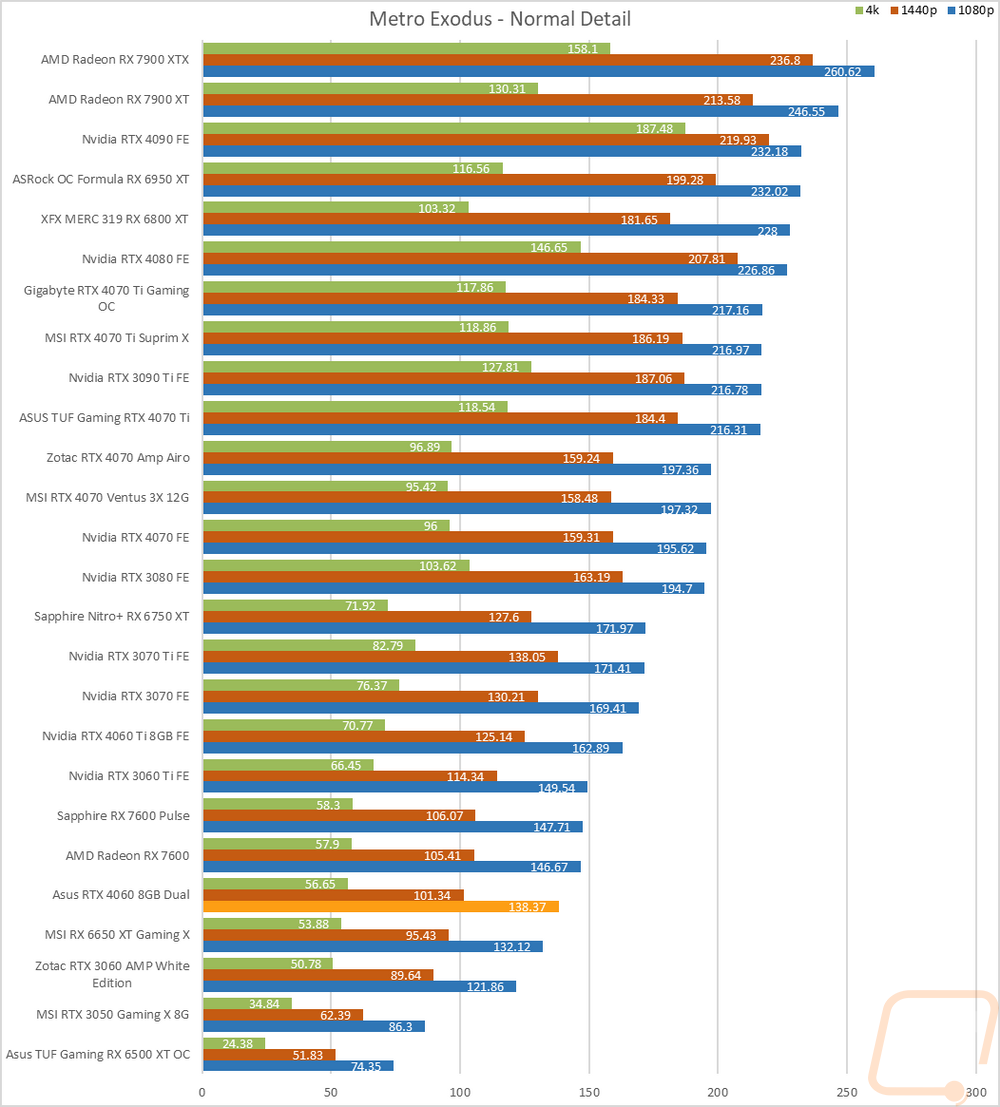
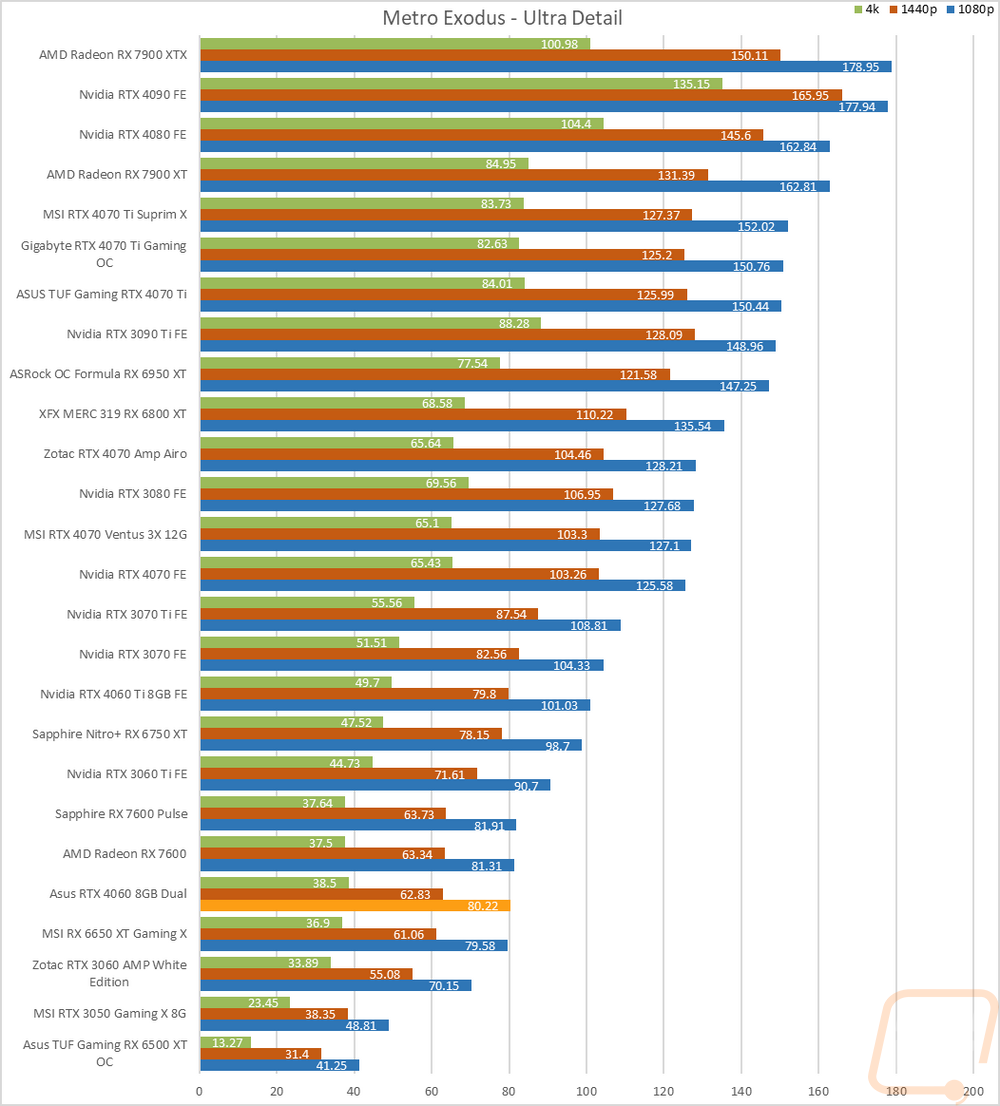
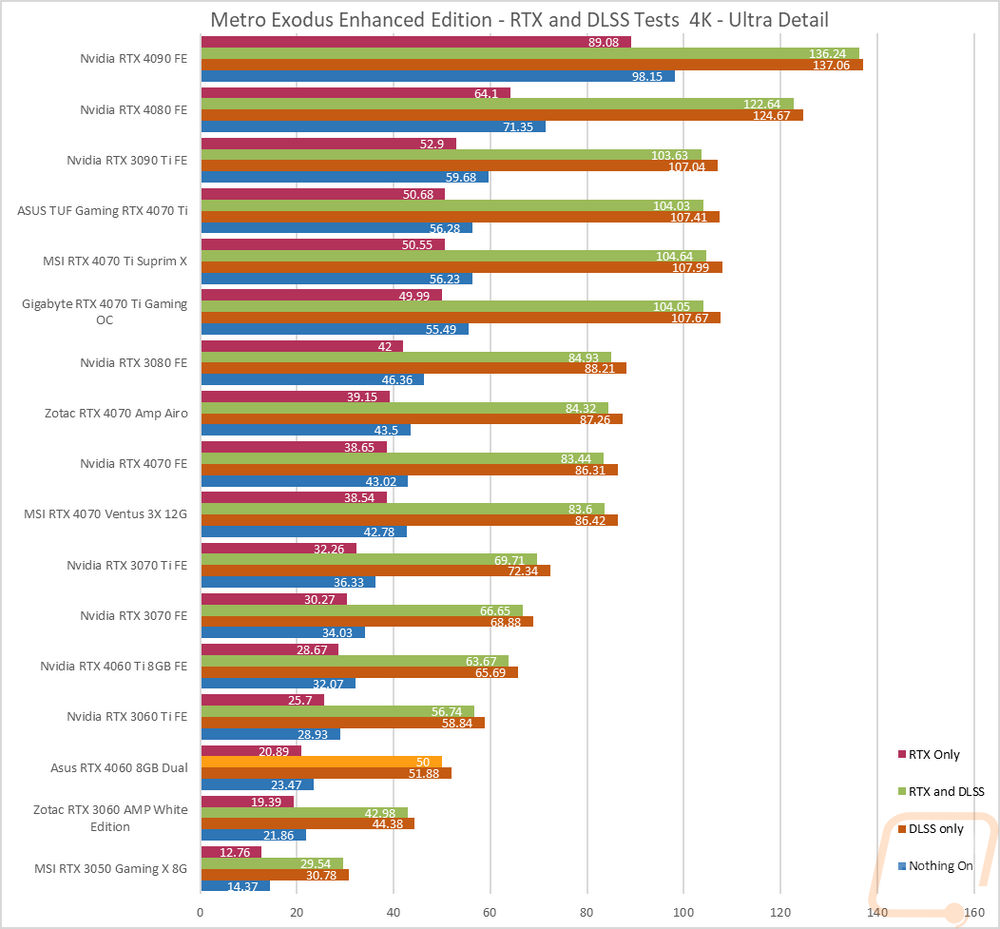
Next, I wanted to check out the performance in Metro Exodus which we have used for testing for a long time now. This test is similar as well with it set to 4K and Ultra detail, I use the included benchmark to test DLSS and RTX individually and then with them both on and both off to give us a look at overall frame rates depending on which direction you go. I should point out that this is using the Enhanced Edition where our normal benchmark uses the standard version for testing with AMD but that version DLSS no longer works. That said the Dual RTX 4060 is sitting above the RTX 3060 and below the 3060 Ti once again. DLSS took performance from a very unplayable 23.47 FPS without RTX and 20.39 FPS with RTX up to 50 FPS with both on.
I also wanted to take a look at DLSS 3 performance as well a little more than my initial look at it with 3DMark’s benchmark. For this, I put Nvidias Frameview to the test to run a few benchmarks using the games that currently support DLSS 3. For games with a built-in benchmark, I ran the benchmark but used frameview so we could get the FPS and 1% lows and because with some of the games frame generation is messing up their in game FPS readouts. V-Sync was turned off on all of the tests because it currently causes problems with frame generation and all of the tests were done at 1080p, 1440p, and 4k with the highest detail settings including the highest RTX settings. DLSS 3 when there is an option was set to performance.
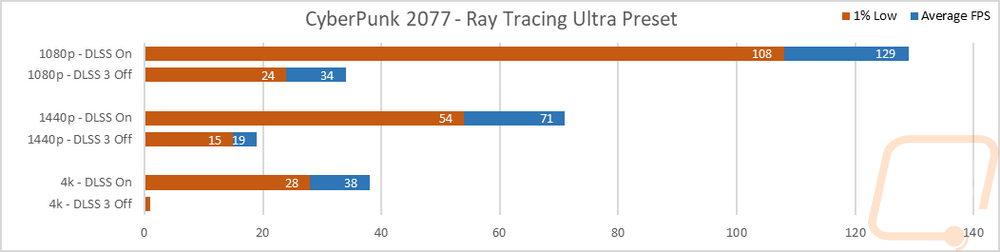
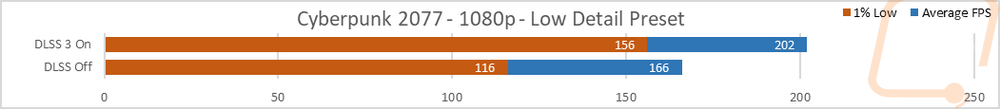
The first game tested was Cyberpunk 2077 and for this one, I tested at 1080p, 1440p, and 4K. I also did a fourth test at 1080p and low settings to get a look at how frame generation helps when CPU limited. At all three resolutions turning DLSS with frame generation on had significant performance improvements. At 4k for example the game wouldn’t even run at all without it but ran at 38 FPS with it. At 1080p, the resolution the Dual RTX 4060 was designed for the card struggled when running the ultra ray tracing detail setting running at 34 FPS. With it on it was up into the high refresh range at 129 FPS with an also impressive 108 1% low. In the fourth test at low detail, the Dual RTX 4060 didn’t have as big of a performance jump as some cards but I was still able to gain 36 more FPS while being CPU limited which means even a 4090 would only get us so far.
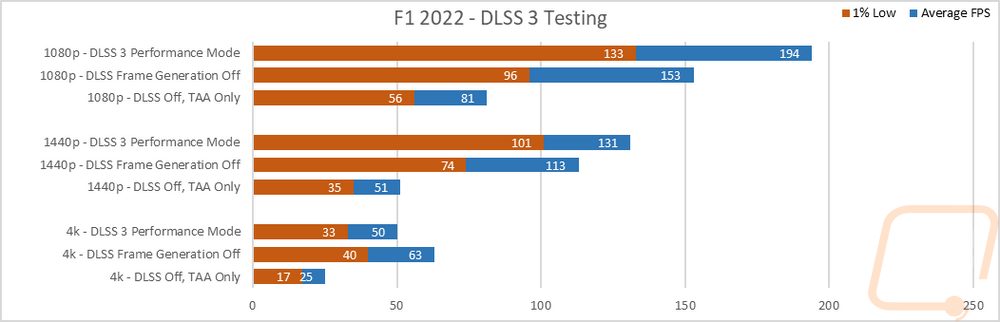
In F1 2022 I ran three tests. I tested with full DLSS, I did it again but turned off frame generation, and then tested with DLSS off and TAA on. Frame generation here was helpful at 1080p and 1440p but we do still see the same performance issue at 4k that I have seen on the higher 4000 Series cards as well. At 1080p DLSS was able to take good performance and push it up over 153 FPS with the 1% lows at 96 FPS and with frame generation on this was even better at 194 with 1% lows at 133 which is buttery smooth.
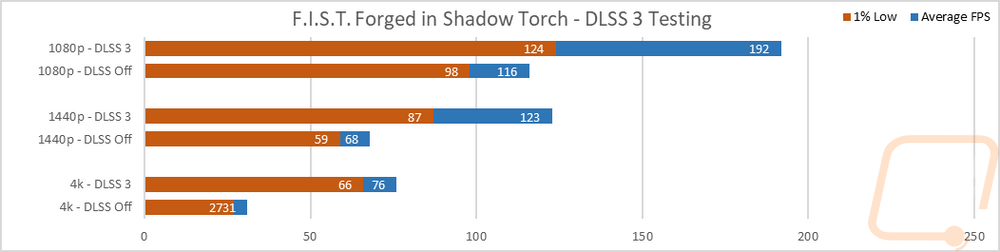
In the side scroller Forged in Shadow Torch DLSS 3 helped the Dual RTX 4060 go from 116 FPS at 1080p up to 192 FPS but the 1% lows didn’t have that big of a jump. At 1440p this was bigger and was once again enough to take things from playable up to smooth. Then at 4k, it was able to take the side scroller from barely playable to playable.
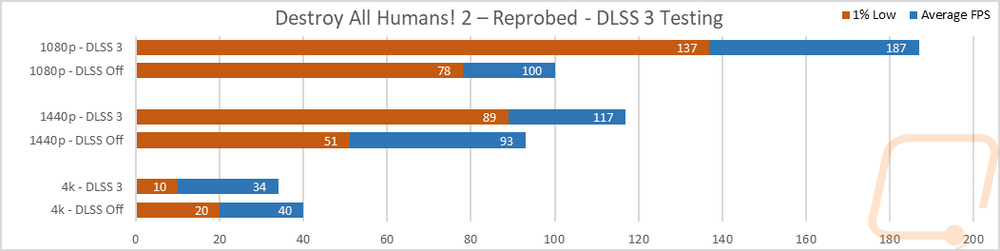
Next up was Destroy All Humans! 2 – Reprobed. The Dual RTX 4060 struggled at 4k both with and without DLSS on, but at 1080p and 1440p it helped step up performance, especially with the 1% lows at 1440p. In both situations, it was enough to improve performance from good up into the high-refresh capable range.
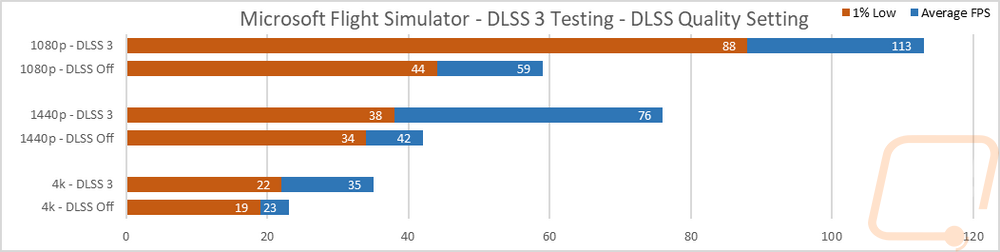
I also took a look at Microsoft Flight Simulator and this is an interesting case because this is a well-known CPU-limited game. To keep things consistent the test used the landing test run over Sydney With DLSS off and again with DLSS and frame generation. This included having DLSS on the quality setting, you can get even better performance by changing that and with the detail settings on their highest settings. I tested at 1080p, 1440p, and 4k. The Dual RTX 4060 struggled at 4k with both DLSS on and of but it did offer an improvement. At 1440p the 1% lows didn’t improve much but the overall average went from 42 FPS which would be rough to 76 FPS, so with the 1% lows in mind it wouldn’t be perfectly smooth but would be a big improvement and playable. Then at 1080p, the Dual RTX 4060 averaged 59 FPS with 44 FPS 1% low, turning DLSS and frame generation on improved that significantly up to 113 average FPS and 88 FPS for the 1% low, not enough to get into the high-refresh range but close.
Last up, because of Diablo IV’s popularity right now and because I just recently took a look at DLSS and frame generation performance in the game I continued those numbers when testing with the Dual RTX 4060. Like with what I saw previously, frame generation didn’t offer its usual big improvements. But DLSS on the other hand did. At 4k for example this took performance from 53 FPS and 31 1% lows up to 102 with a much nicer 65 FPS 1% lows. 1440p was similar as well with its improvement but the 4060 performed well even before DLSS at that resolution but DLSS was able to push things up into the smooth high-refresh monitor range.
|
4k |
DLSS w/FG Average |
DLSS w/FG 1% Low |
DLSS Average |
DLSS 1% Low |
DLSS Off Average |
DLSS Off 1% Low |
|
RTX 4090 FE |
285 |
144 |
338 |
224 |
204 |
136 |
|
RTX 4080 FE |
210 |
182 |
263 |
143 |
142 |
82 |
|
RTX 4070 Ti SuprimX |
174 |
128 |
207 |
158 |
113 |
76 |
|
RTX 4070 FE |
147 |
103 |
116 |
105 |
89 |
47 |
|
RTX 4060 Ti FE |
105 |
54 |
109 |
50 |
57 |
16 |
|
RTX 4060 FE |
86 |
24 |
102 |
65 |
53 |
31 |
|
1440p |
DLSS w/FG Average |
DLSS w/FG 1% Low |
DLSS Average |
DLSS 1% Low |
DLSS Off Average |
DLSS Off 1% Low |
|
RTX 4090 FE |
361 |
247 |
396 |
251 |
362 |
175 |
|
RTX 4080 FE |
303 |
231 |
383 |
249 |
274 |
194 |
|
RTX 4070 Ti SuprimX |
270 |
227 |
329 |
260 |
212 |
112 |
|
RTX 4070 FE |
242 |
185 |
267 |
178 |
177 |
123 |
|
RTX 4060 Ti FE |
197 |
147 |
115 |
79 |
114 |
63 |
|
RTX 4060 FE |
166 |
88 |
168 |
124 |
106 |
68 |
Cooling Noise and Power
For my last few tests, rather than focusing on in game performance, I like to check out other aspects of video card performance. These are also the most important ways to differentiate the performance between cards that have the same GPU. To start things off I took a look at power usage.
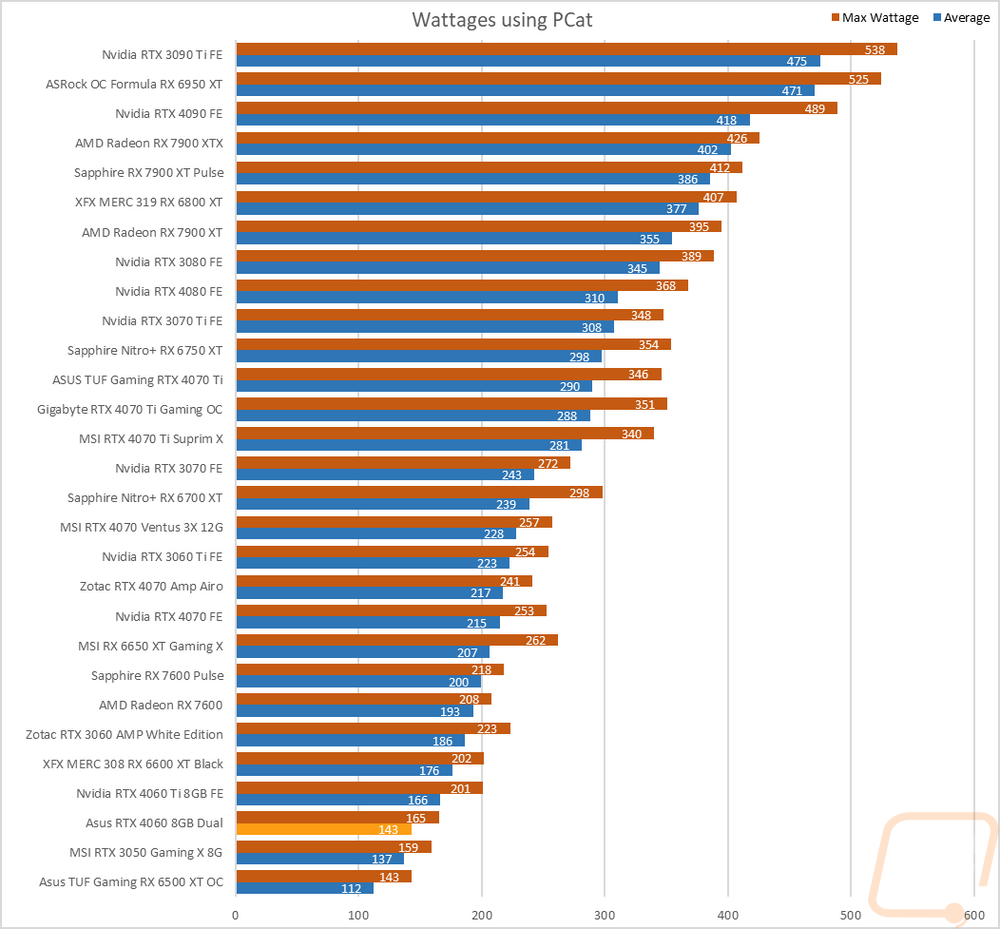
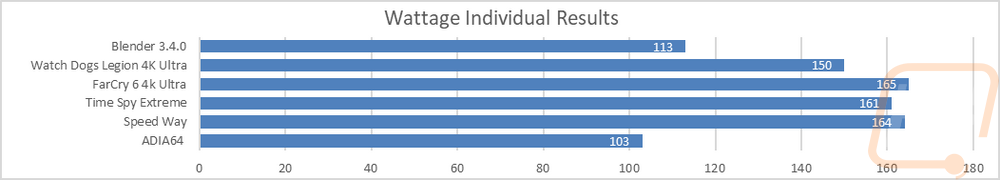
For this, our new test setup utilizes the Nvidia-designed PCat v2 along with cables to handle both traditional 6 or 8-pin connections as well as the new 12VHPWR. The PCat also utilizes a PCIe adapter to measure any power going to the card through the PCIe slot so we can measure the video card wattage exclusively, not the entire system as we have done in the past. I test with a mix of applications to get both in game, synthetic benchmarks, and other workloads like Blender and AIDA64. Then everything is averaged together for our result. I also have the individual results for this specific card and I document the peak wattage results as well which is almost always Time Spy Extreme but this time was FarCry 6. The Dual RTX 4060 is down near the bottom of the chart here with its 143-watt average putting it right with the RTX 3050 and almost 60 watts lower than the RX 7600 and even more to the older 6650 XT.
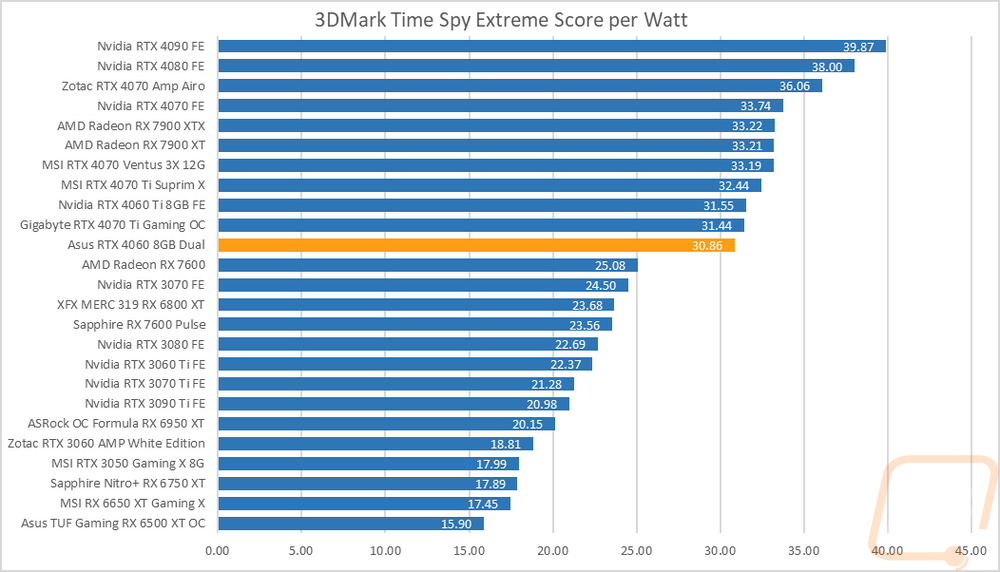
With having exact peak wattage numbers when running Time Spy Extreme I was also able to put together a graph showing the total score for each watt that a card draws which gives us an interesting look at overall power efficiency in the popular and demanding benchmark. The Dual RTX 4060 scored 30.86 points for each watt that it used which put it right with the overclocked RTX 4070 Ti and the RTX 4060 Ti Founders Edition. This is at the bottom of the 4000 series cards but there is still a big gap between this and all of the older cards as well as AMDs new 7600.
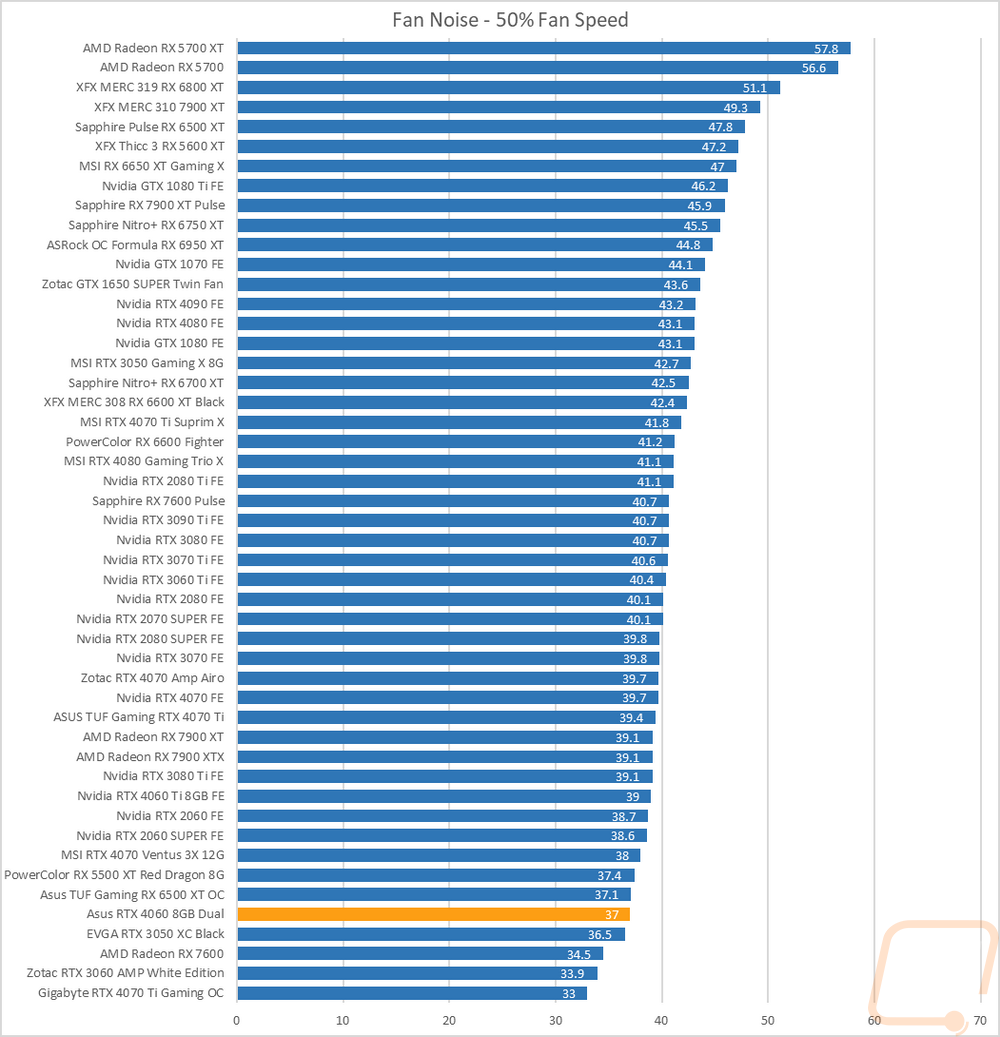
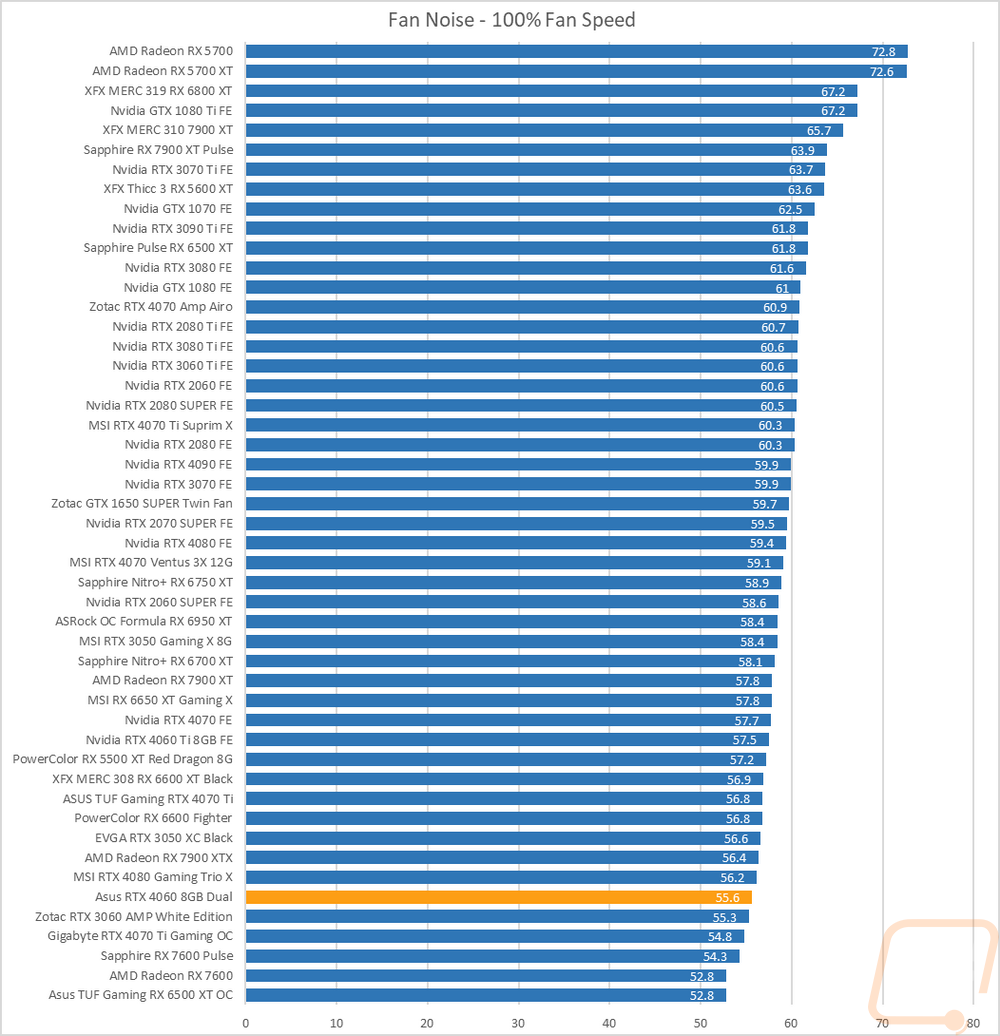
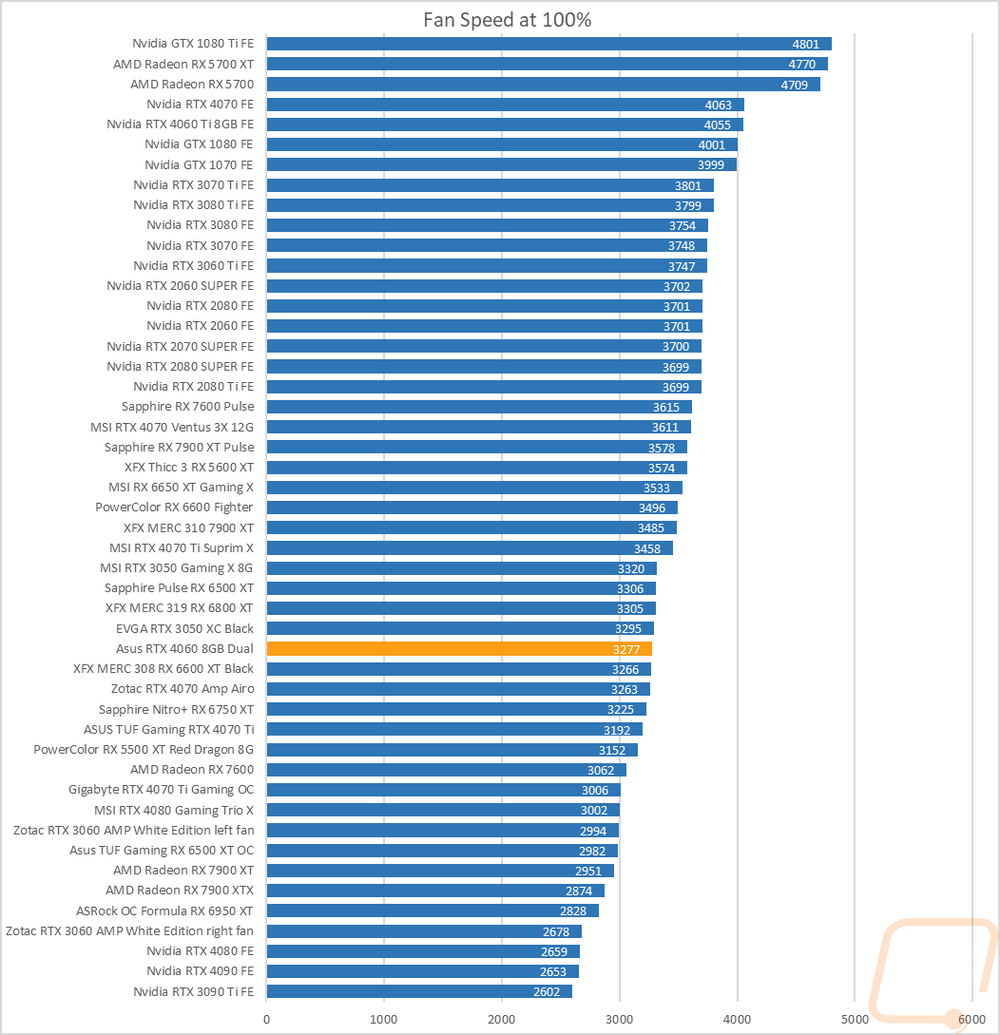
My next round of tests were looking at noise levels. These are especially important to me because I can’t stand to listen to my PC whirling. Especially when I’m not in game and other applications are using the GPU. For my testing, though I first tested with the fan cranked up to 100% to get an idea of how loud it can get, then again at 50% to get an idea of its range. The Dual RTX 4060 is down at the bottom of the chart for both with 55.6 db at 100% fan speed and 37 db at 50% fan speed. The fan RPMs on the other hand show the dual fan Asus Dual RTX 4060 at 3277 RPM which is a lot higher up in the chart than the noise levels showing how well Asus did with the design.
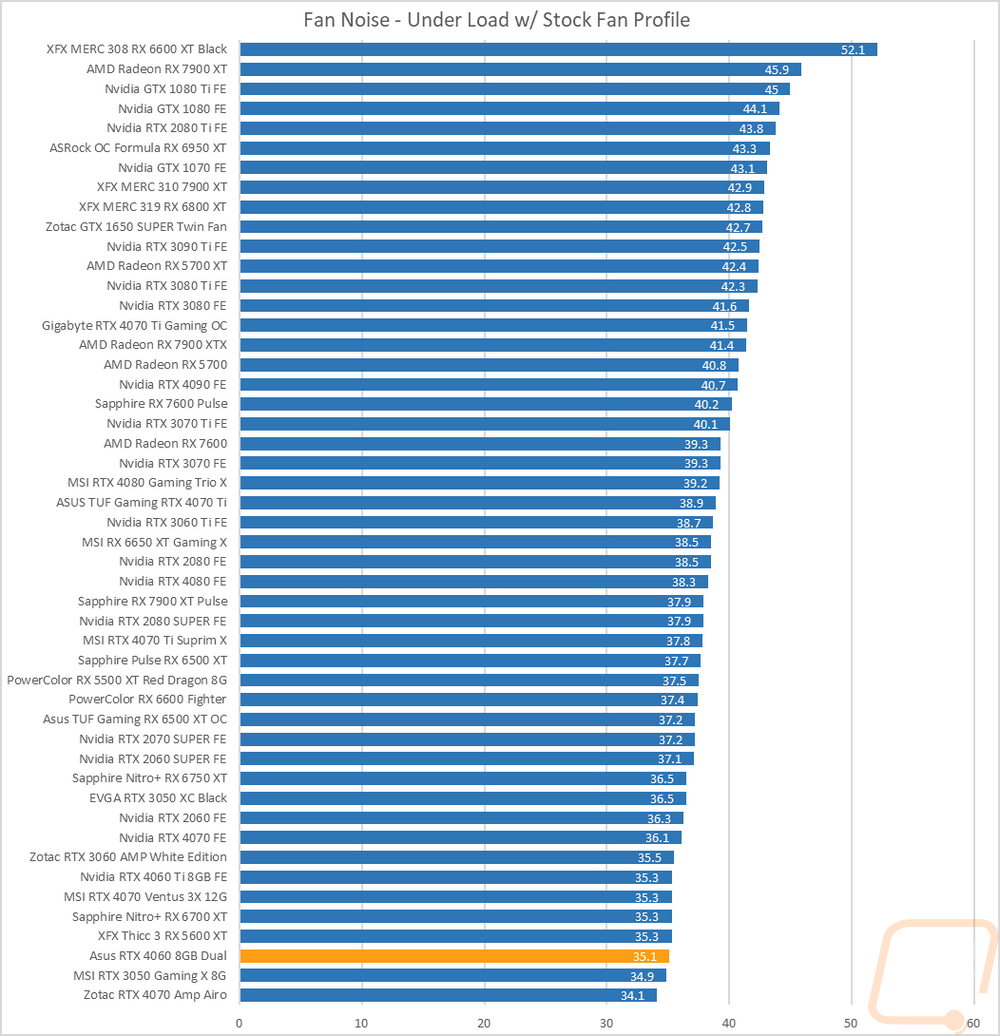
I also take a look at noise performance while under load. For that when running AIDA64’s stress test I wait until the temperature of the card has leveled off and then measure how loud things are when the card is at its worst-case scenario with the stock fan profile. Here the Dual RTX 4060 was even a little lower in the chart with just two cards quieter.
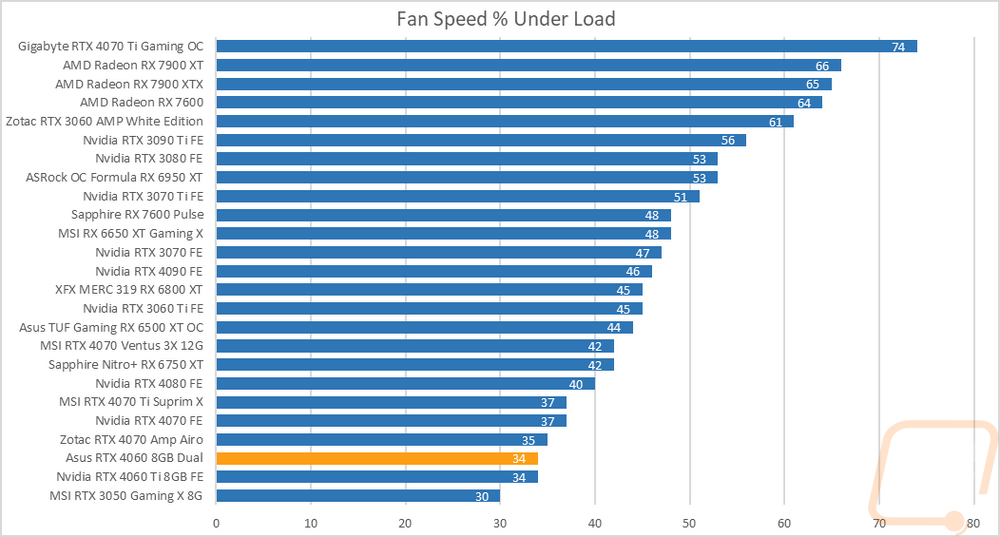
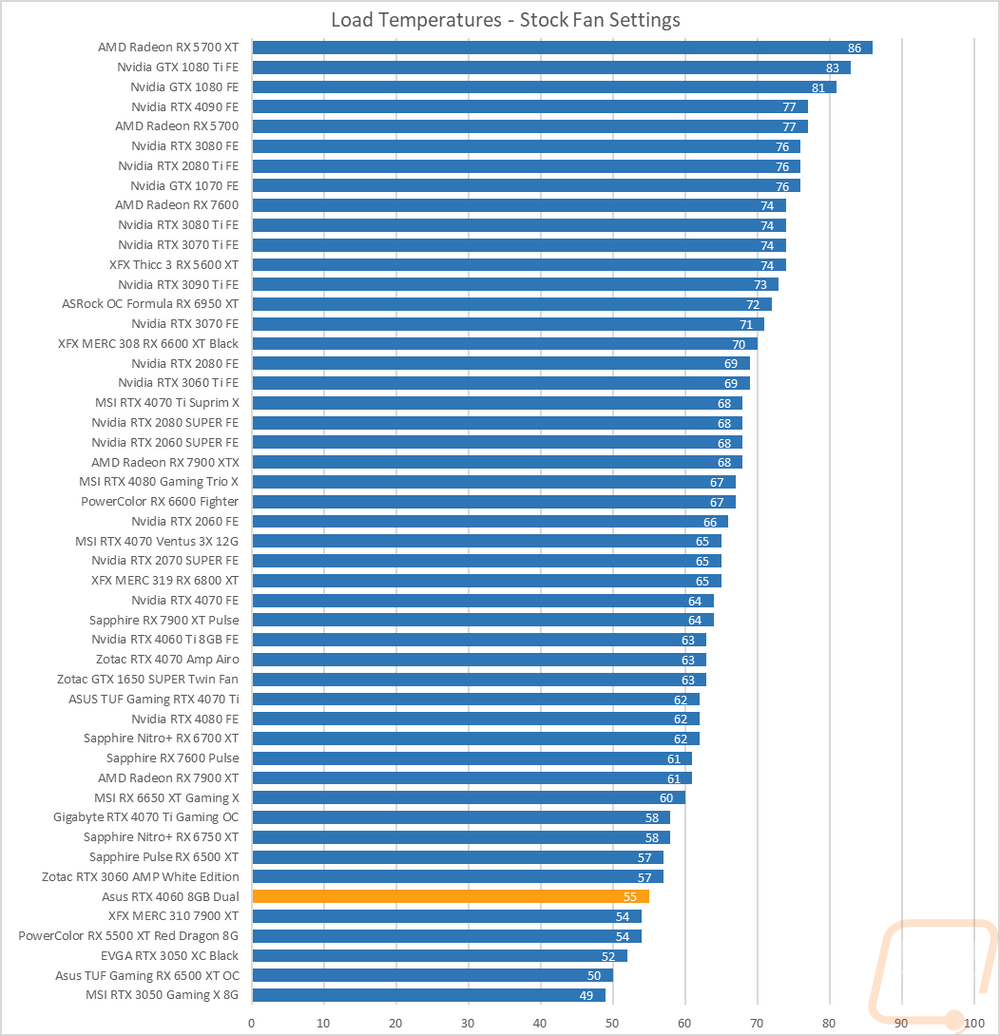
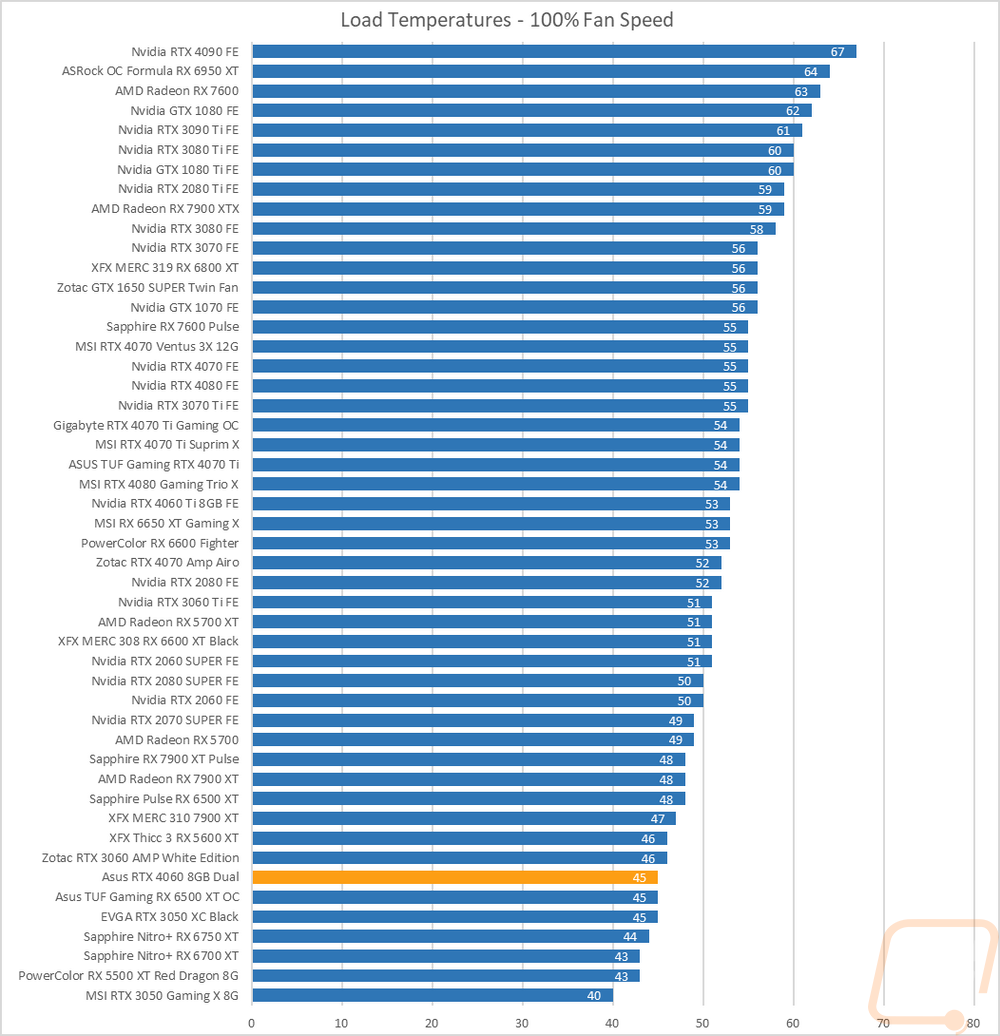
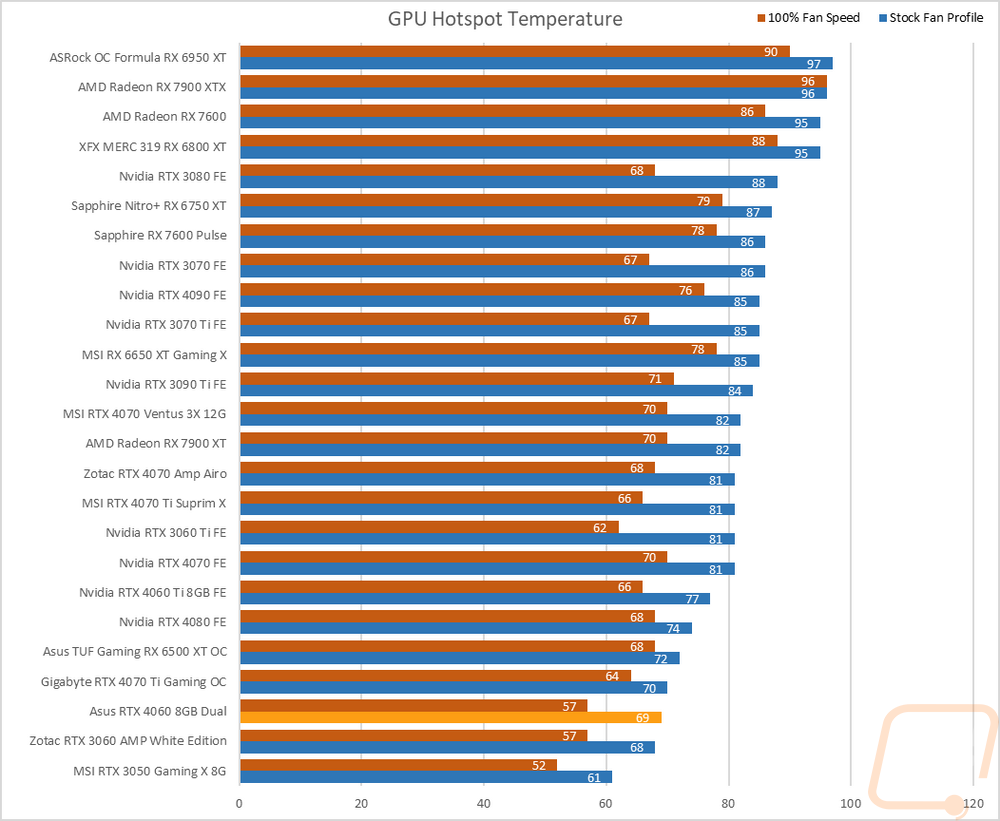
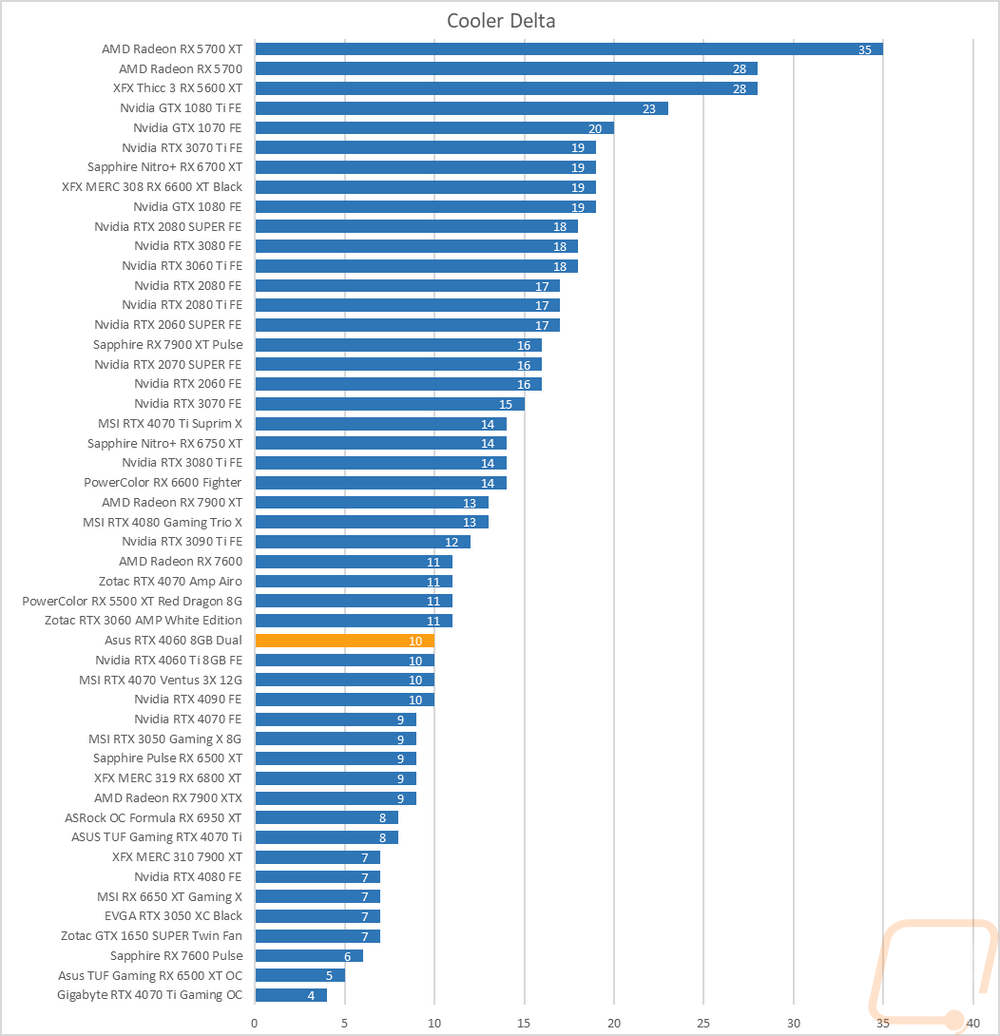
To finish up my testing I of course had to check out the cooling performance. To do this I ran two different tests. I used AIDA64’s Stress Test run for a half-hour each to warm things up. Then I documented what temperature the GPU leveled out at with the stock fan profile and then again with the fans cranked up to 100%. With the stock profile, the Dual RTX 4060 was running at 55c which puts it near the bottom of the chart. Even more impressive though is when you figure in how fast the fans were running at the time with the stock fan profile running at just 34% explaining why it was so quiet under load as well. The GPU hotspot was warmer at 69c. Then with the fans cranked up, the GPU hotspot was improved to 57c and the overall temperature was down to 45c which was again down near the bottom of our charts and near the RTX 3050 XC Black. The delta between the stock fan profile and 10)% fan speed was 10c which is average but with the low fan profile we know that the Dual RTX 4060 wasn’t working too hard, it doesn’t however have a huge upside to cranking the fans up too much.
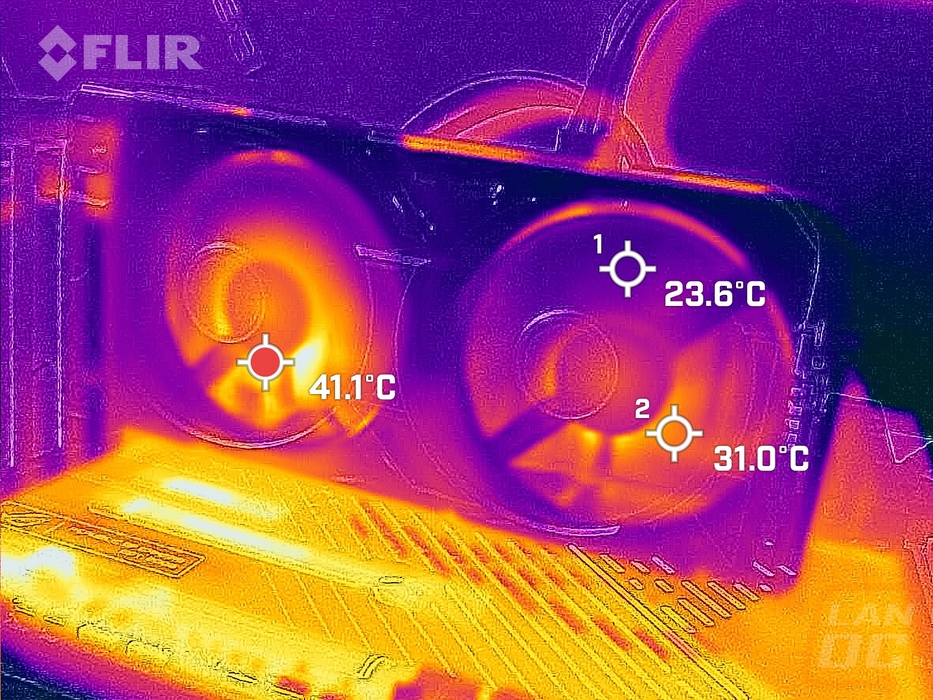
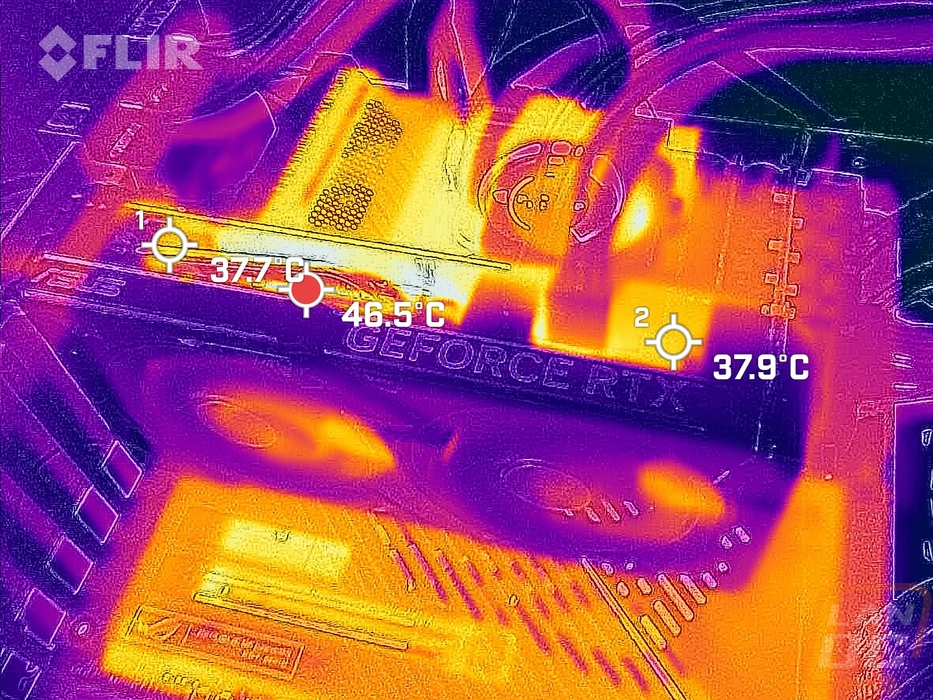
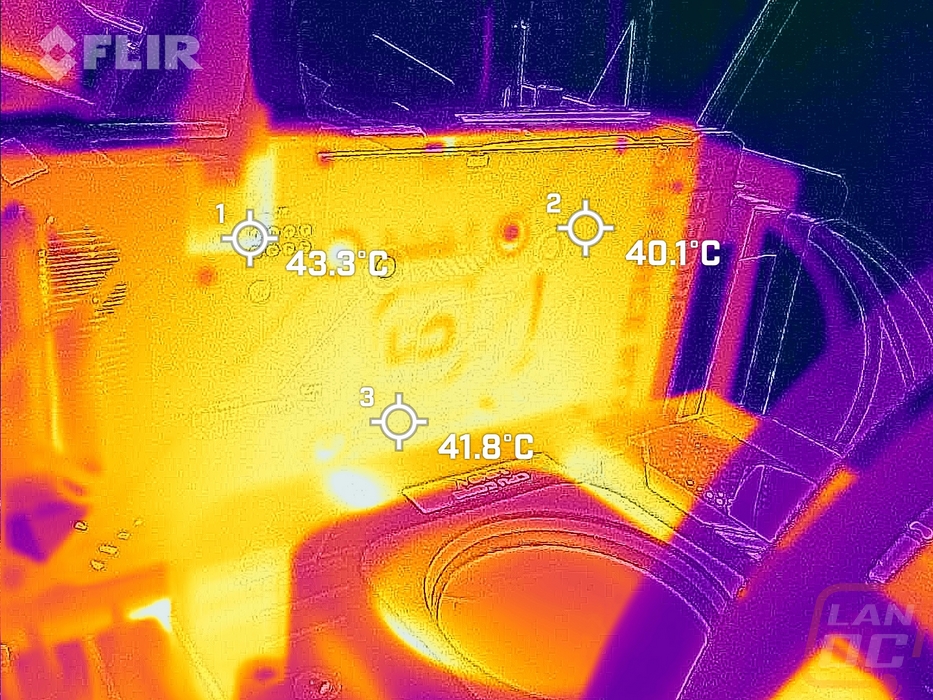
While running the stock fan profile testing I also took the time to get a few thermal images so we could see what is going on. The Dual RTX 4060 had just one warm spot on the fan side on the bottom right corner of the left fan which is closest to the GPU and gets a little less airflow but overall that side was very cool. The top edge shows the hotspot right on the heatpipe up top which isn’t a surprise at all and the PCB is warmer but there isn’t too much heat coming out this side with the horizontal heatsink layout. Then on the back, the metal backplate doesn’t have any main hot spots. There is a warmer down under the card and some on the exposed PCB near the power connection.
Overall and Final Verdict
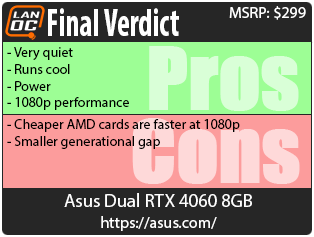
With our testing out of the way and having taken a look at the Asus Dual RTX 4060 8GBs design we can sit back and reflect on everything. The Asus Dual RTX 4060 design, while very simple, looks good with its blacked-out styling and I was surprised how long it took me to even notice that the card has the smoked translucent section at the top of the fan shroud that gives a peak behind the covers. As an 80-90s child, translucent where you can see what is going on behind it is ALWAYS awesome. Asus’s design isn’t a giant card but with the RTX 4060’s power usage being low, the Dual design kept things running cool in all of my testing and was surprisingly quiet under load spinning the fans at just 34% fan speed. While still being an MSRP card the Dual RTX 4060 did still manage to get us a nice metal backplate and a small overclock over Nvidia’s original clock speeds as well. It doesn’t have lighting which helps keep costs down and depending on the person this might be a big pro or a con.
Looking beyond Asus’s design to the RTX 4060 itself. This is a card designed for 1080p which the 8GB memory is designed around. Like with the RTX 4060 Ti, if you have plans on upgrading to a higher resolution monitor during the time you have this card, this isn’t the card you should be looking for. But with 1080p having the largest number of users it makes sense for Nvidia to target the resolution. With that 1080p performance in all of our tests was great, and 1440p wasn’t too bad as well with the average across the games tested at 95 FPS. I know a lot of people are concerned with the lower memory, especially when you compare it against the 3060 which had 12GB. Nvidia’s larger cache does seem to help alleviate some of the load there with the 4060 outperforming the RX 7600 and 6500XT at higher resolutions while both of those cards have the same VRAM and are faster at 1080p. But we also know that some extra demanding applications like some emulators will struggle and for those the 3060 is still going to be the better option.
This brings me back to raster performance, like with the RTX 4060 Ti, the RTX 4060 does still run behind AMDs 7600 at 1080p and on par with the 6650XT with both being priced lower than the 4060. Nvidia does make up that difference once you get into DLSS and Ray Tracing performance. In games that support it, the 4060 punches well above its weight class. Performance compared to the 3060 and 3060 Ti do show a much smaller generation-to-generation improvement when it comes to raster performance. I think most people would have liked to see the 4060 land right in line with last generations RTX 3060 Ti and it falls short there. That isn’t to say it isn’t an improvement over the 3060, it is just smaller than I would like to see. The DLSS and ray tracing performance however did see a big performance jump.
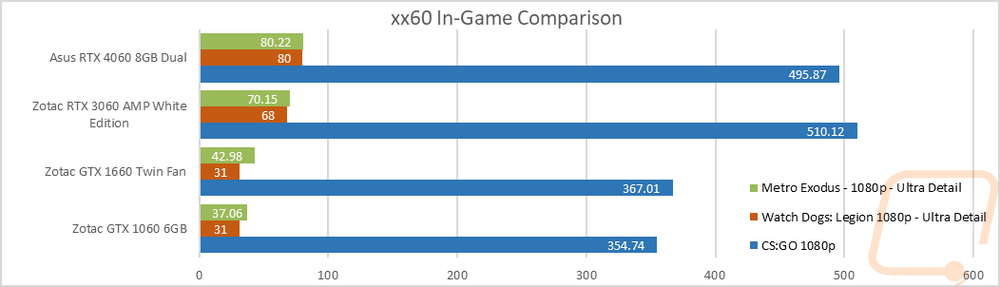
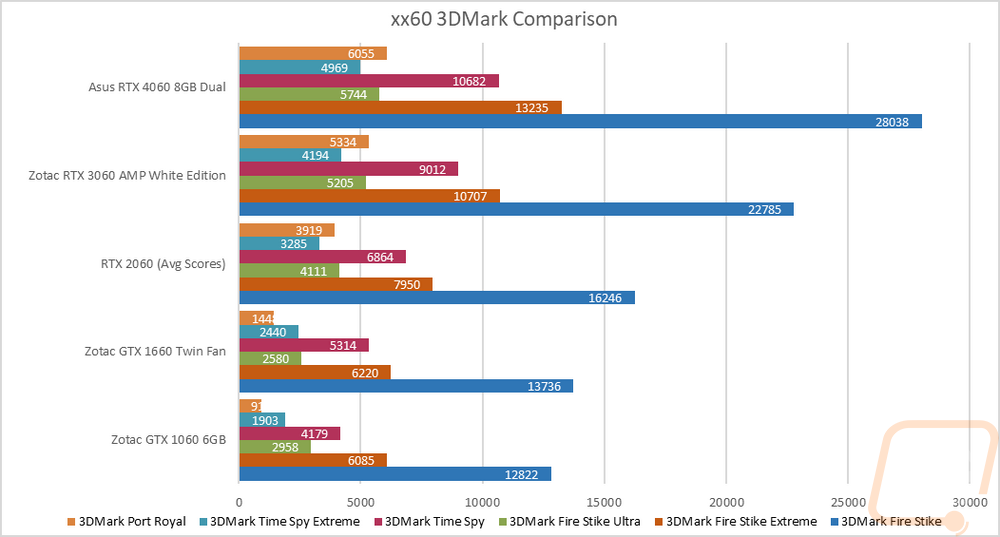
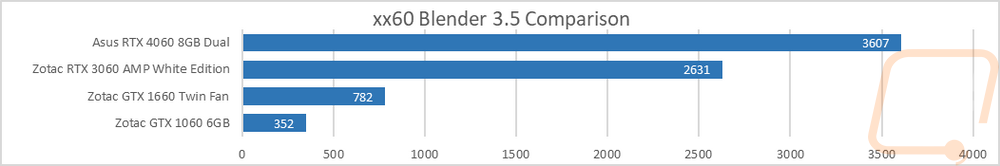
I did also go a little beyond our normal testing with the 4060 to get a look at how it compares to past xx60 models but our RTX 2060 was eluding me so I have numbers comparing the 4060 with the 3060, 1660, and 1060. I did include average 3DMark scores for the 2060 when possible as well. The truth is 3060 owners aren’t and shouldn’t be looking at the RTX 4060 as an upgrade. But those cards that have been out for up to 7 years now (GTX 1060) that are in the top 10 of Steams hardware survey are the users who might be looking to upgrade. Without taking RTX or DLSS into account at all, for those users in game, they could be going from 31 FPS in Watch Dogs Legion at 1080p on ultra detail up to 80 FPS on the RTX 4060. The performance improvement in Blender is significant as well with the 1060 to the 4060 showing a 925% improvement.
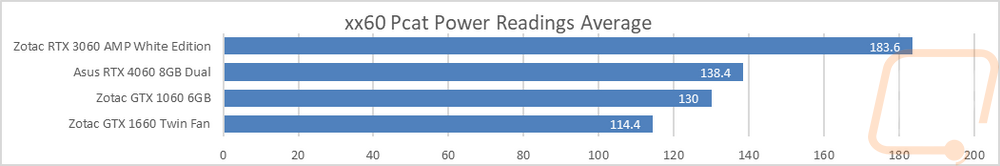
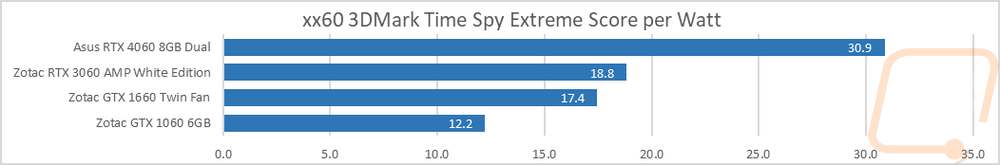
With those huge performance increases the RTX 4060 is still averaging very close to the same power across our power tests (minus Speedway which isn’t supported on the older cards) with the 4060 averaging 138.4 and the 1060 averaging 130 watts. That is also reflected in the Time Spy Extreme score per watt results as well with the 4060 getting 30.9 points for each watt it uses whereas the 1060 is at 12.2.
I was curious about launch pricing for all of the xx60 cards as well so I put together a chart for that as well that shows the launch MSRP as well as a Time Spy Extreme score per dollar launch MSRP as well just to see how the 4060 compared. The $299 launch MSRP is in line with most of the other xx60 models except for the GTX 1660 which was an impressive $219. So Nvidia’s pricing isn’t really out of line, it’s the performance not at least surpassing the next model up from the last generation that hurts things. The GTX 1060 for example, when it launched, ran right with the GTX 980, the RTX 2060 was well ahead of the GTX 1070 and nearly running with the 1070 Ti. The 3060 on the other hand was a little behind the 2060 SUPER.
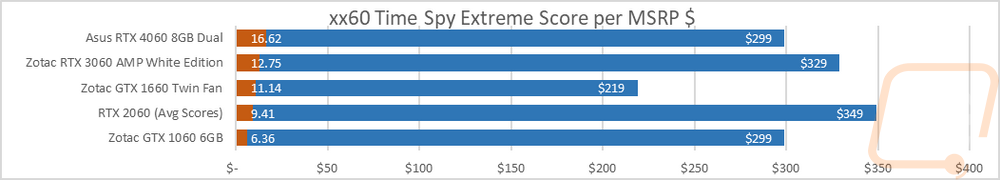
Overall the RTX 4060 does replace the RTX 3060 as the go-to card for 1080p gaming at a value except for emulation. Like with previous 4000 Series cards, the 4060 does struggle to keep up in overall value when it comes to just raster performance compared to the similarly priced AMD cards. Ray tracing performance and DLSS both help even that out assuming the games that you are looking to play support them and that list is getting longer almost daily. In the end, Nvidia faithful who loved their GTX 1060 or similar card are going to love the upgrade but they will pay a premium for the Nvidia-specific technology. Value-focused customers who blow whichever way the wind is blowing however will have to figure out if the games they are planning on playing have or will be getting DLSS and/or ray tracing, without that those customers are going to be looking at the lower prices and better rater performance at 1080p from the RX 7600 and the older RX 6650XT while it is still available.
Live Pricing: HERE


