In-Game Benchmarks
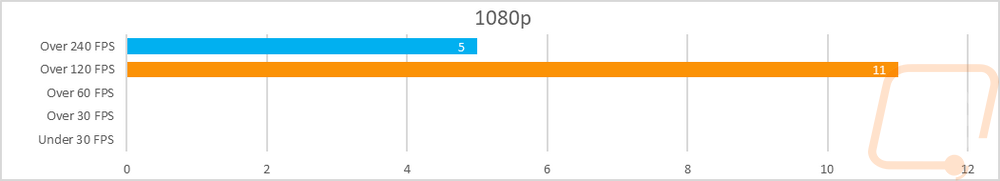
Now we finally get into the in game performance and that is the main reason people pick up a new video card. To test things out I ran through our new benchmark suite that tests 10 games at three different resolutions (1080p, 1440p, and 4k). Most of the games tested have been run at the highest detail setting and a mid-range detail setting to get a look at how turning things up hurts performance and to give an idea of if turning detail down from max will be beneficial for frame rates. In total, each video card is tested 54 times and that makes for a huge mess of results when you put them all together. To help with that I like to start with these overall playability graphs that take all of the results and give an easier-to-read result. I have one for each of the three resolutions and each is broken up into four FPS ranges. Under 30 FPS is considered unplayable, over 30 is playable but not ideal, over 60 is the sweet spot, and then over 120 FPS is for high refresh rate monitors.
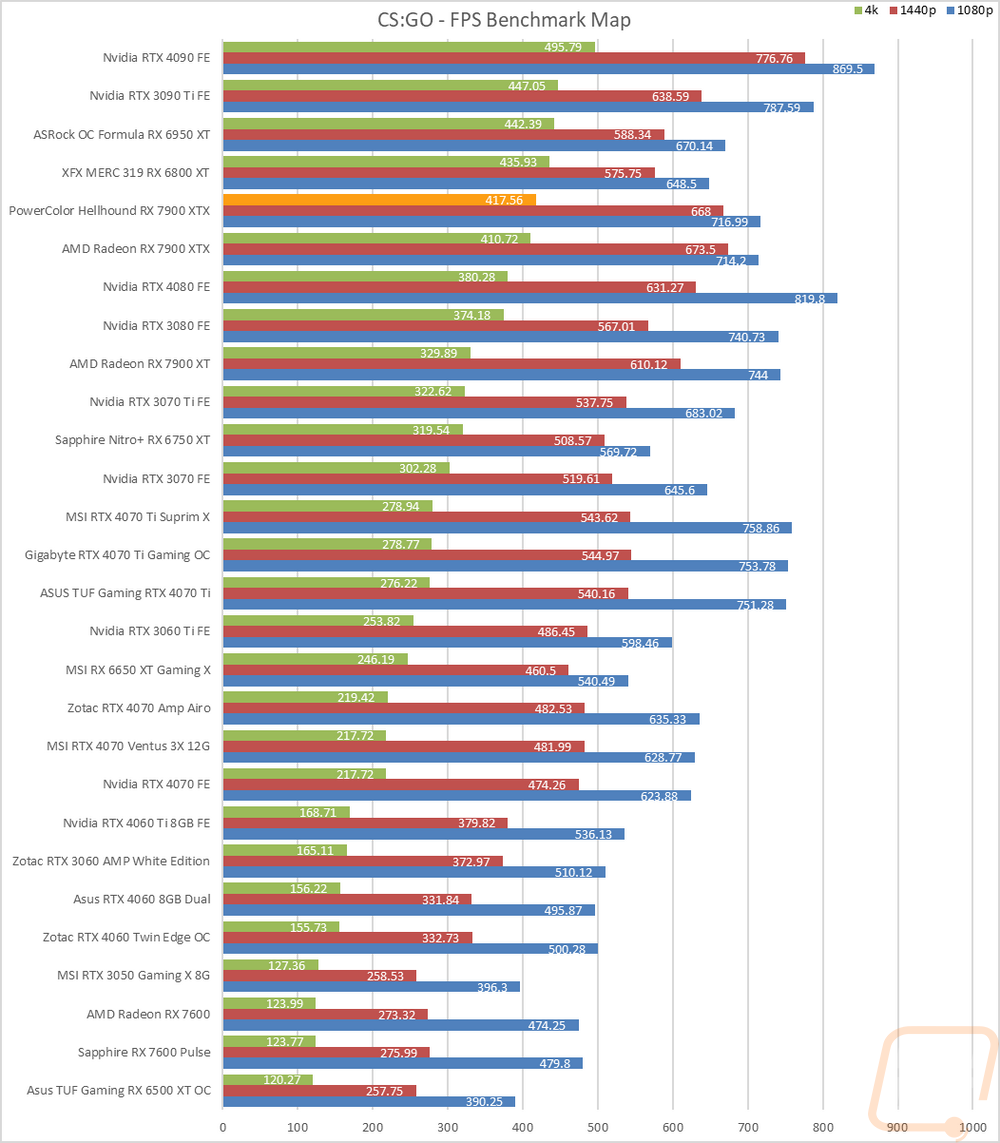
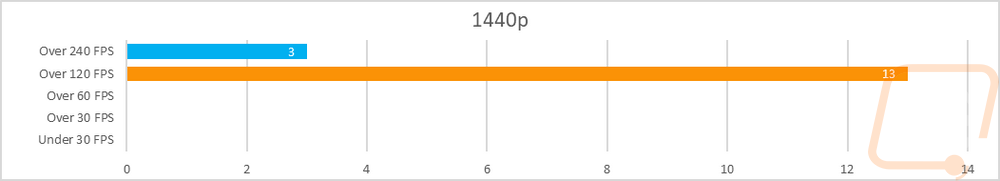
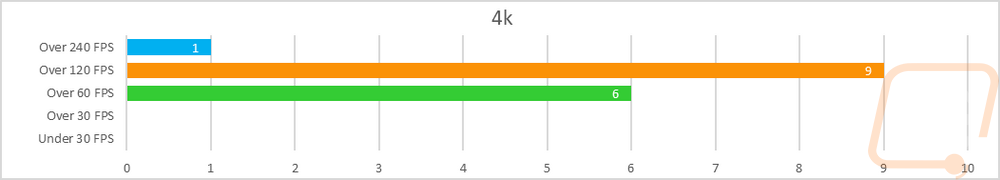
So how did the Hellhound RX 7900 XTX do in the overall playability by resolution? No big surprises but at 1080p it didn’t have any performance troubles with everything playing at 120 FPS or higher with 11 over 120 FPS and 5 results over 240 FPS. Even still a majority of these are CPU limited, not completely showing the overall performance. The 1440p results were similar with everything over 120 FPS once again, this time with 13 over 120 FPS and 3 up over 240 FPS, and like with 1080p some of these were CPU limited as well. It is only at 4k that we really see the full performance of the Hellhound RX 7900 XTX and this is the resolution that AMD has designed the card for. Everything was smooth with nothing below 60 FPS and a majority of the results were over 120 FPS with 9 in the 120-239 FPS range. Then CS:GO was up over 240 FPS and the only result to do that at 4k.
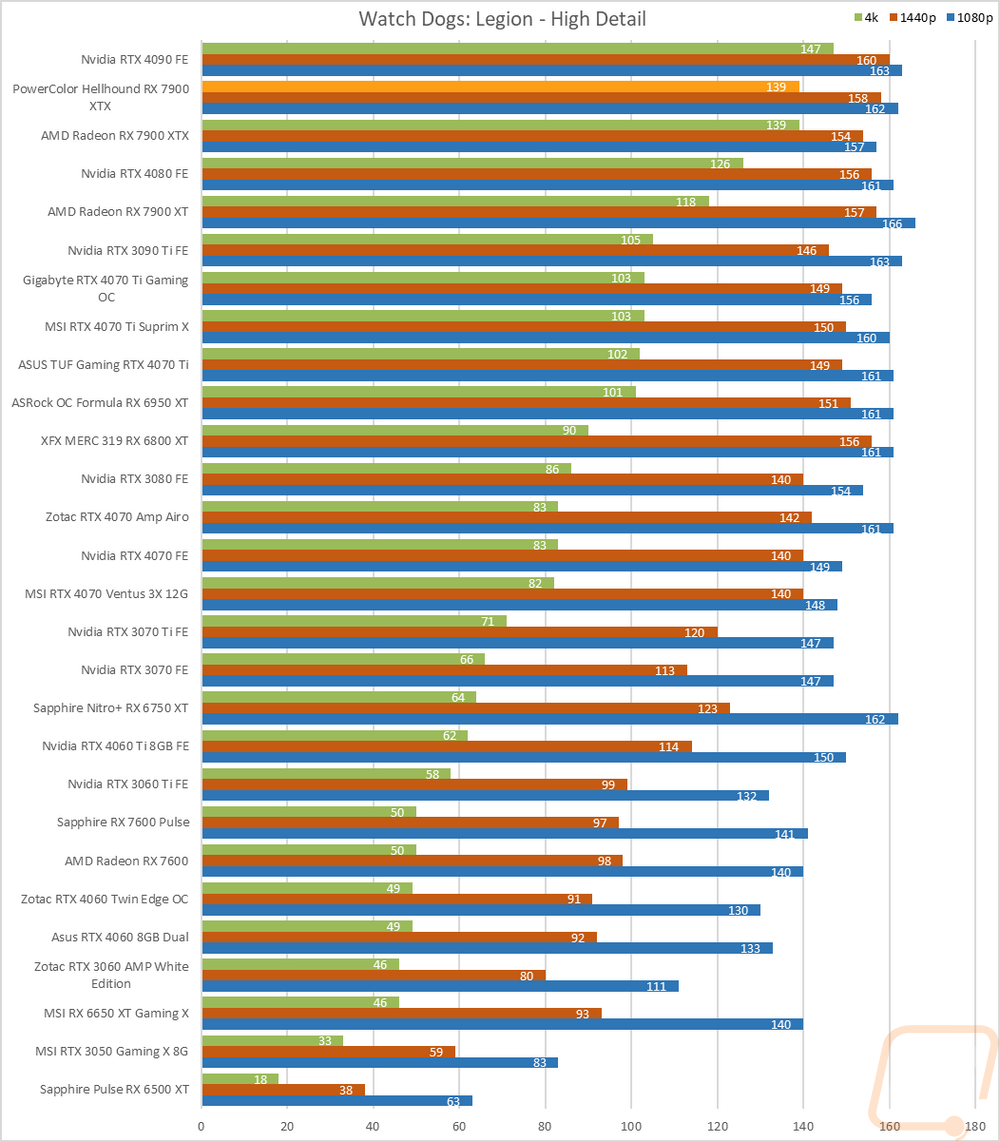
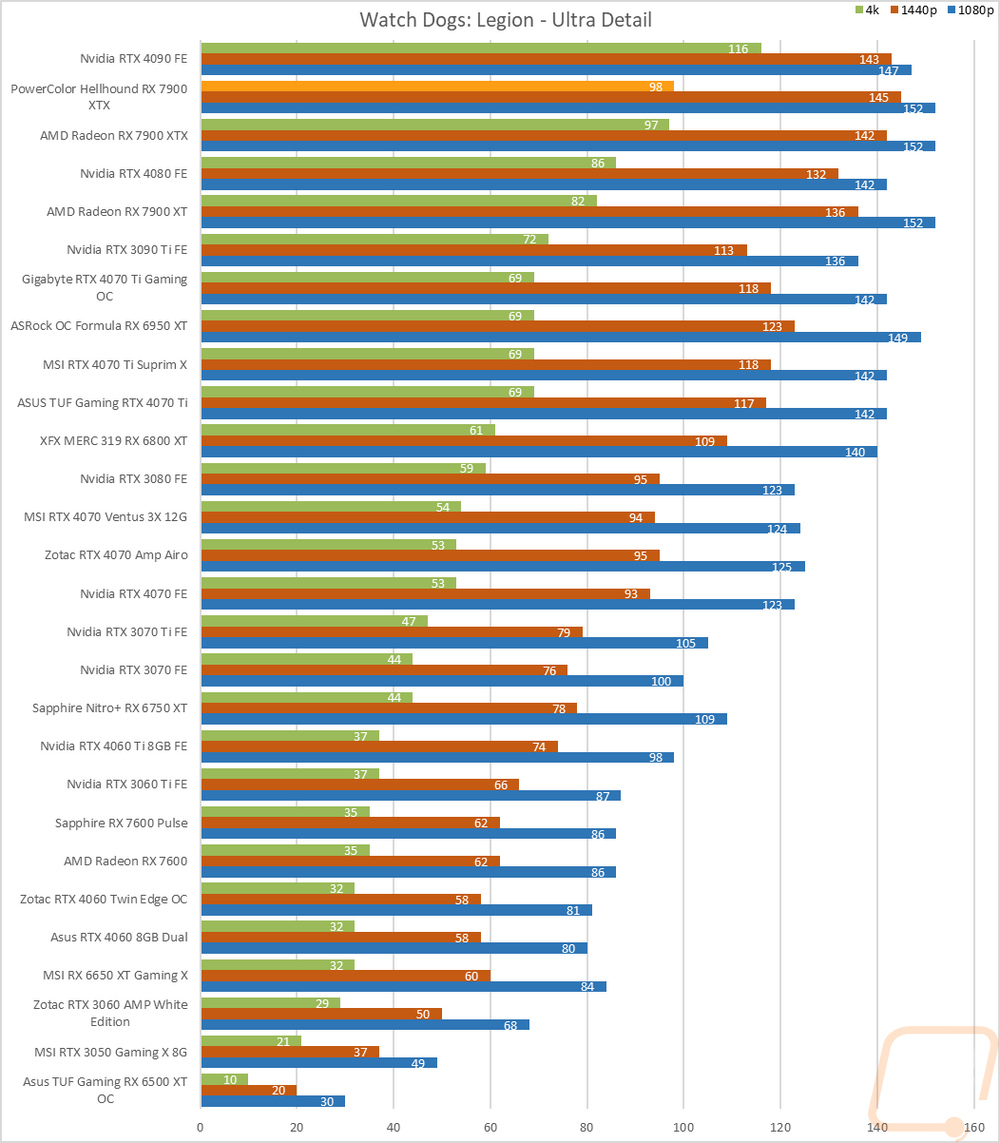
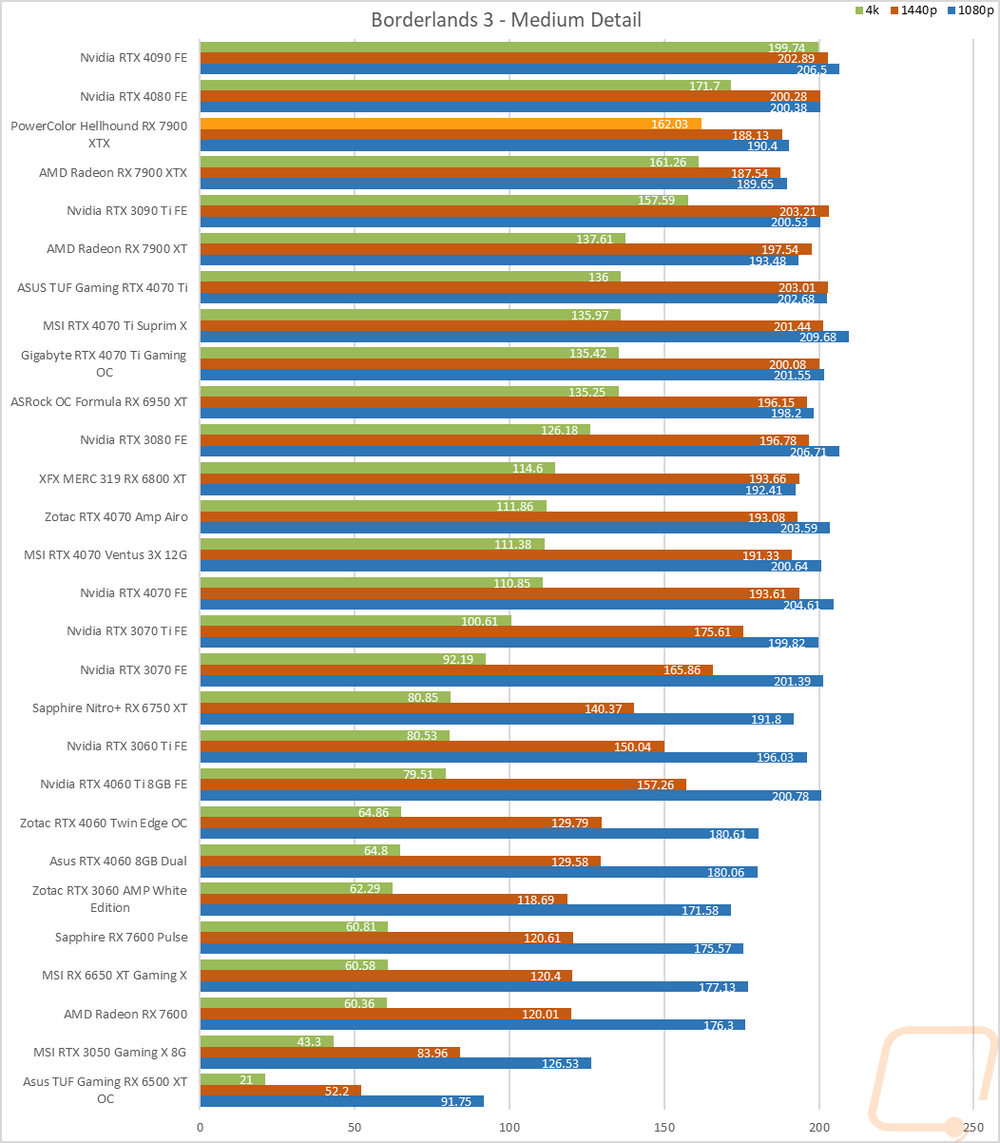
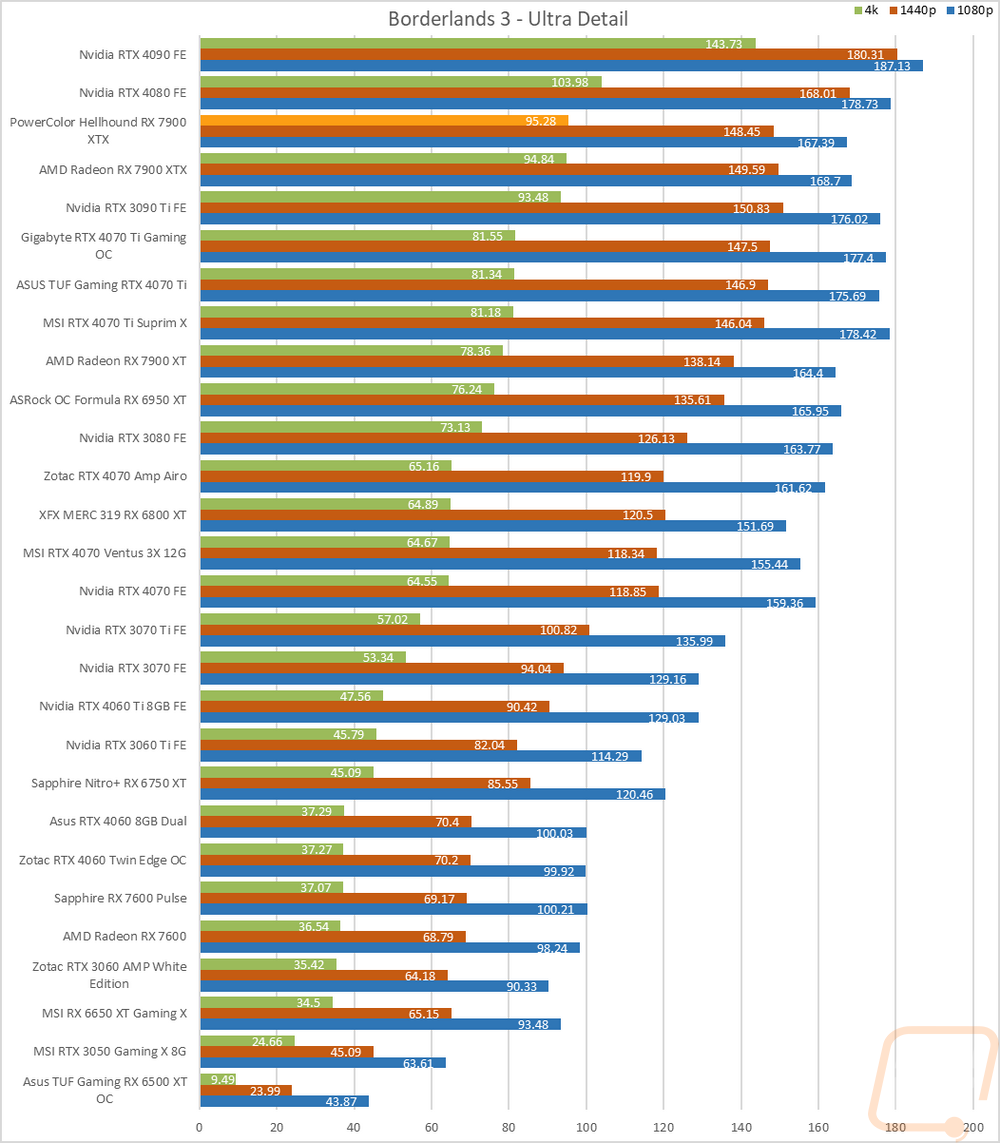
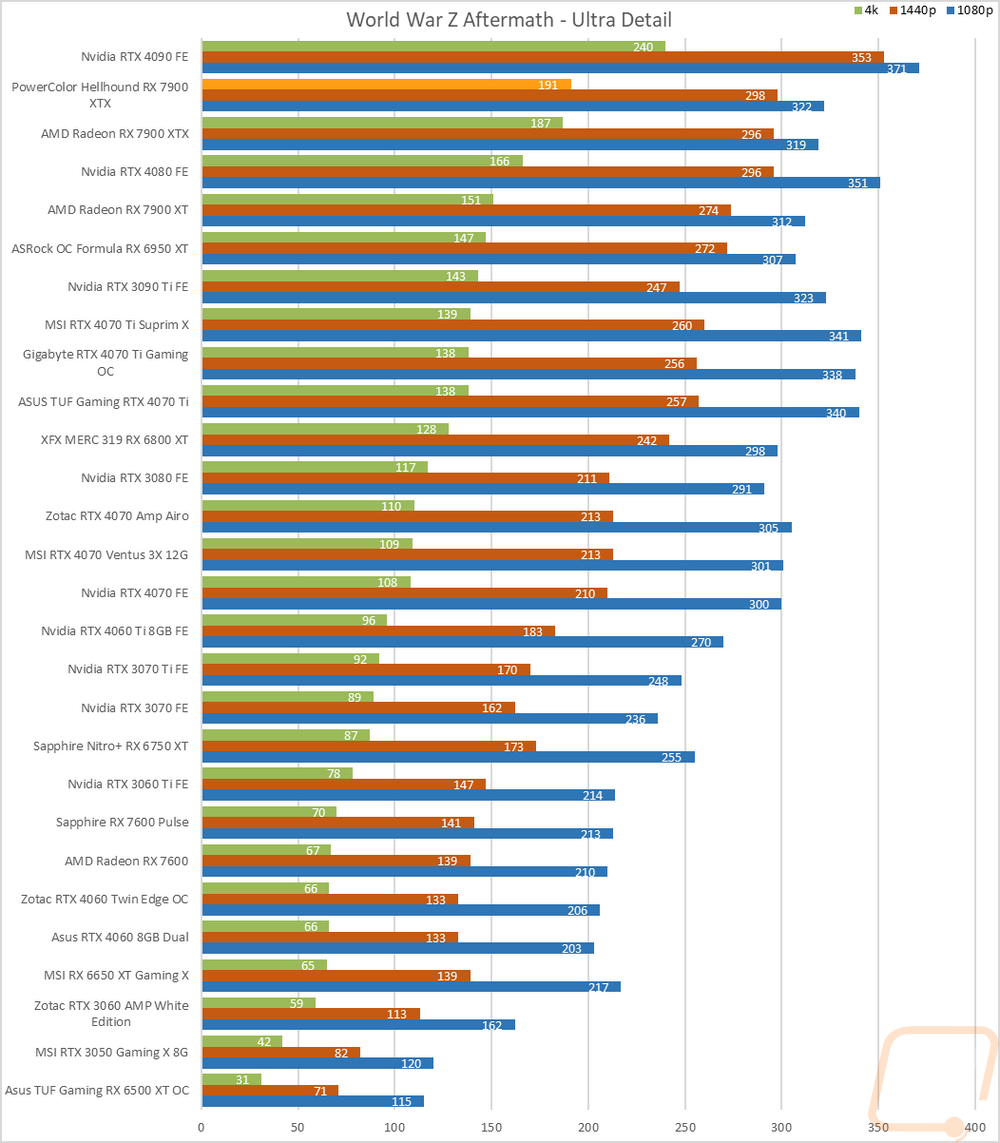
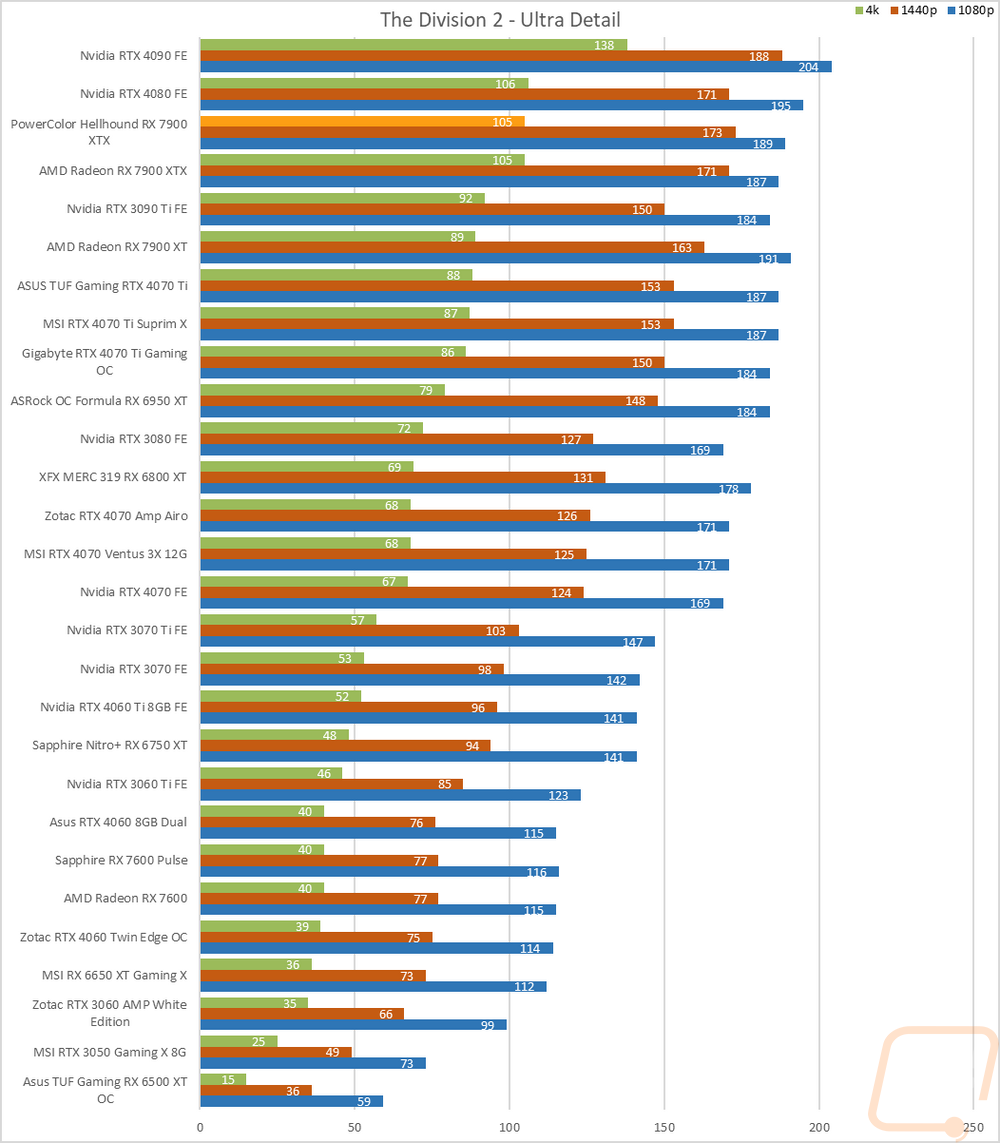
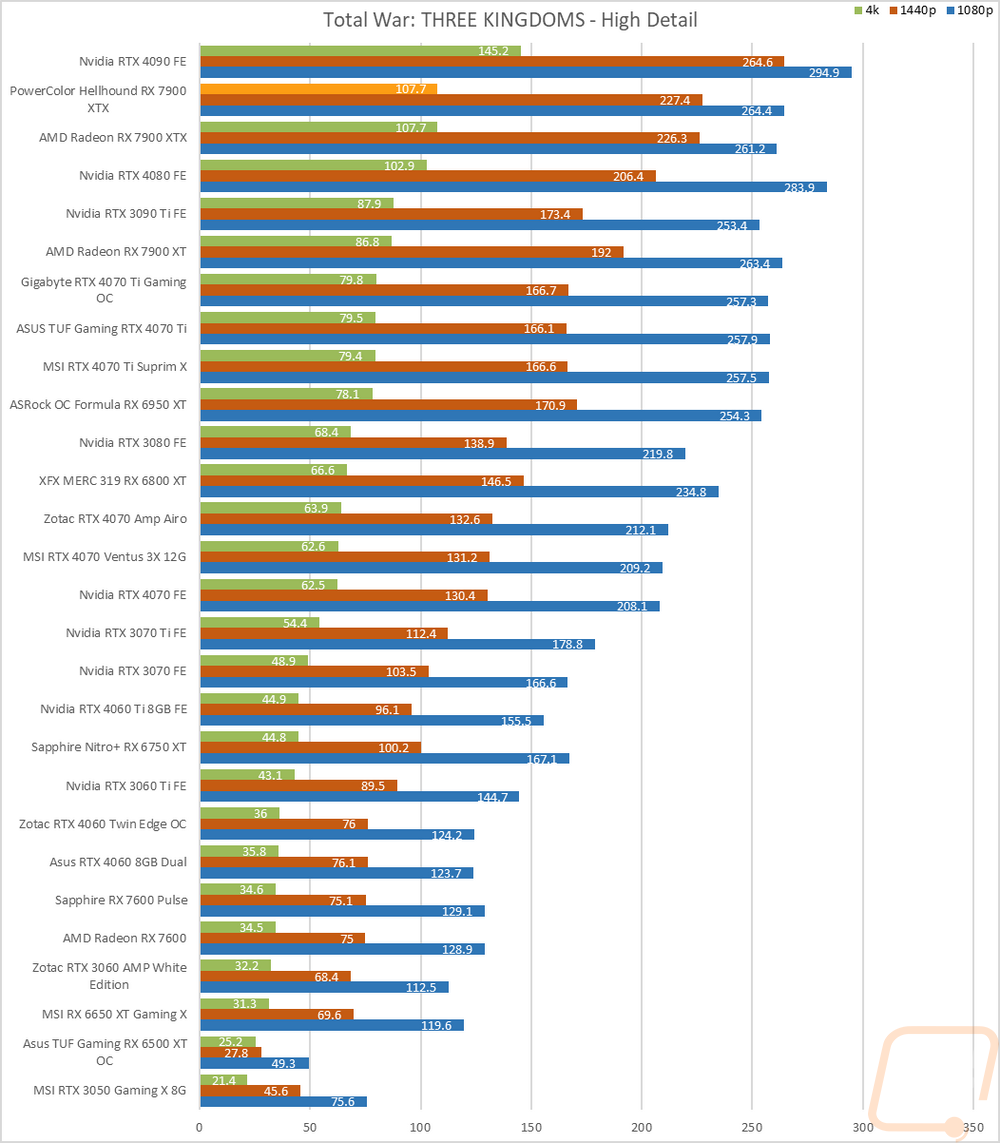
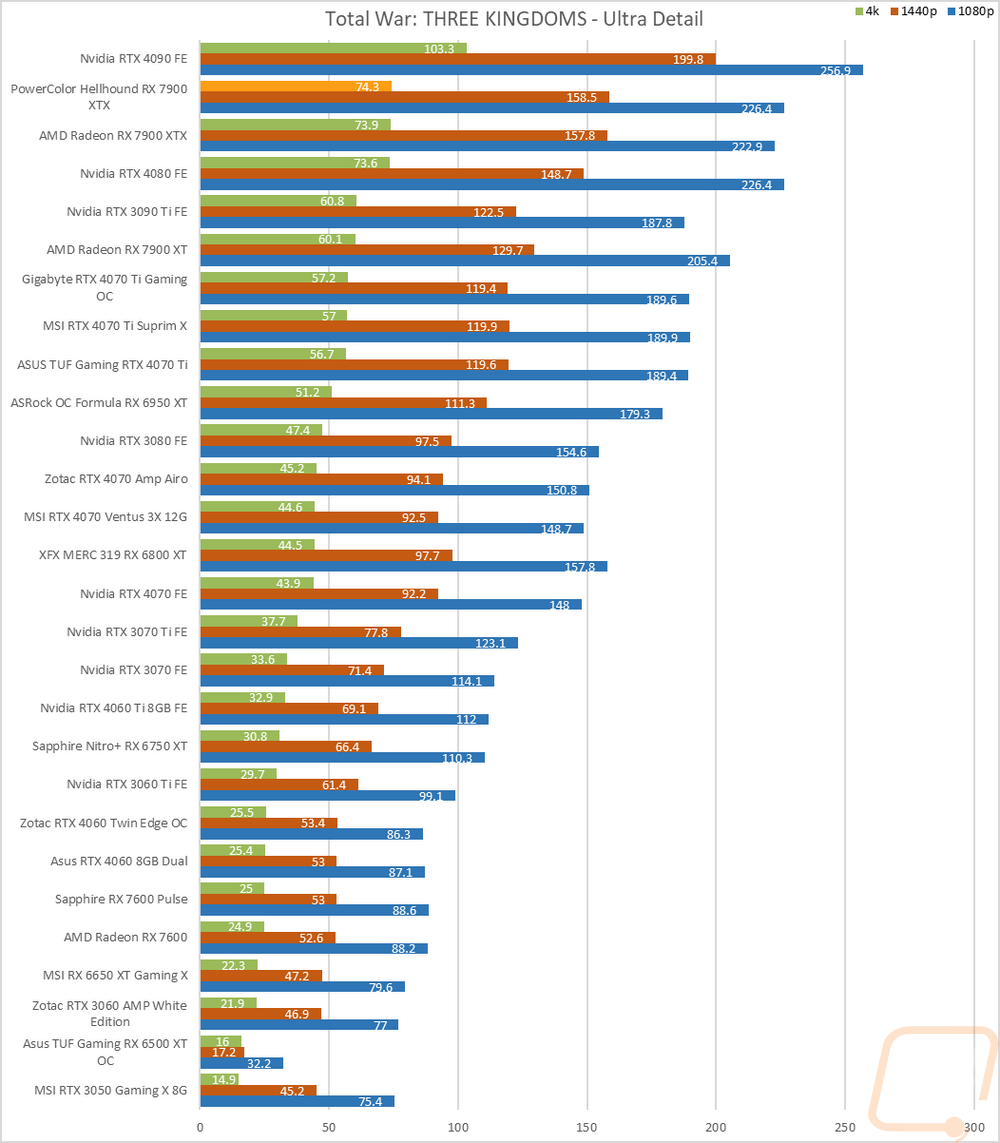
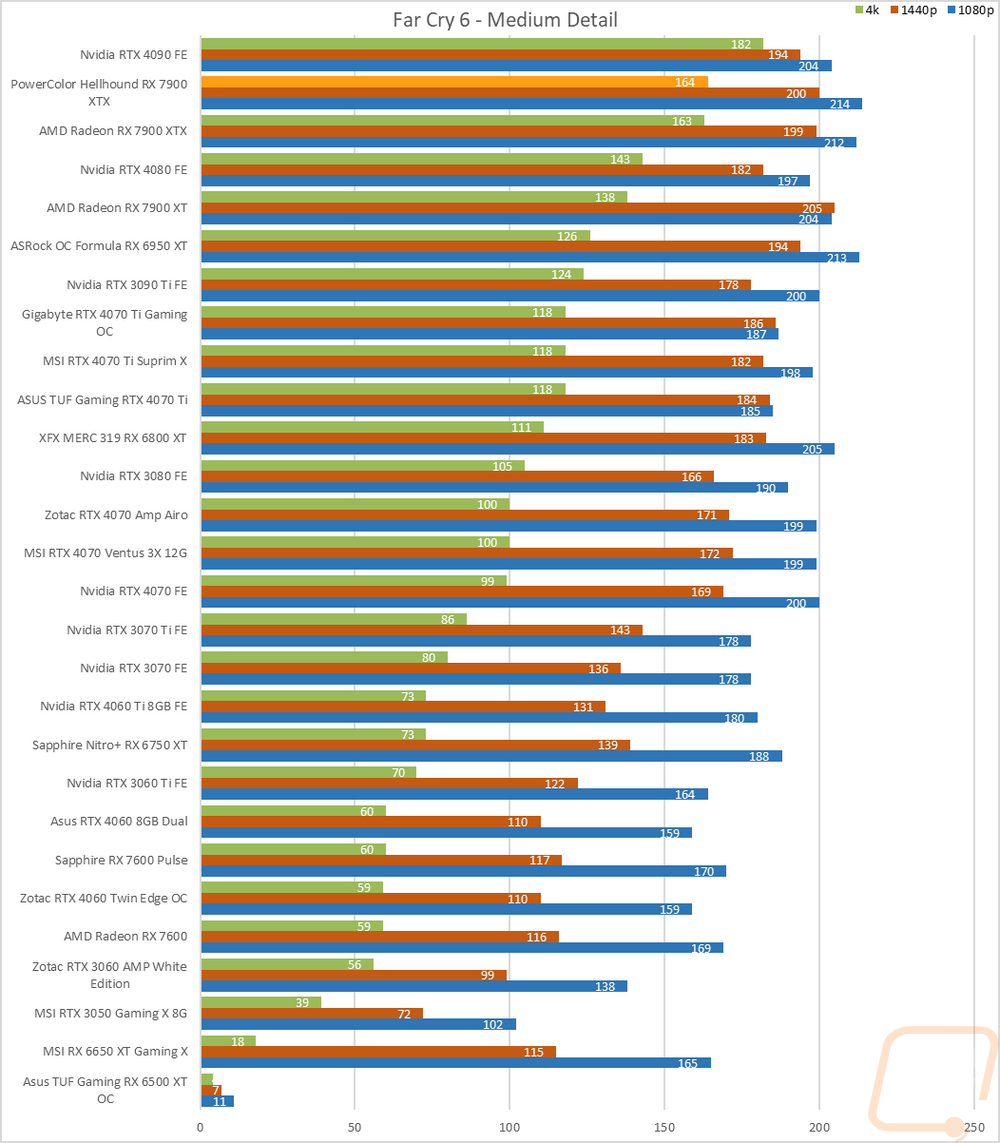
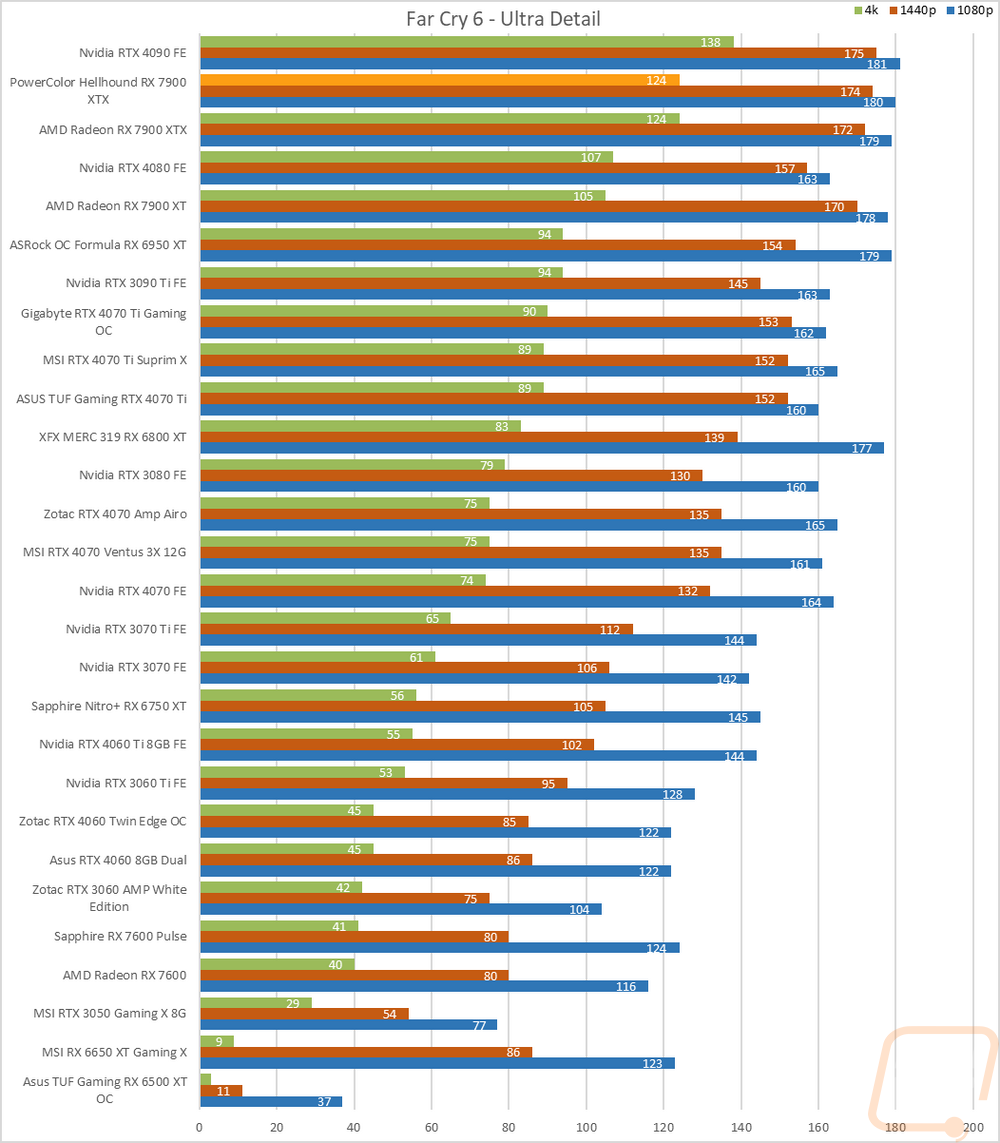
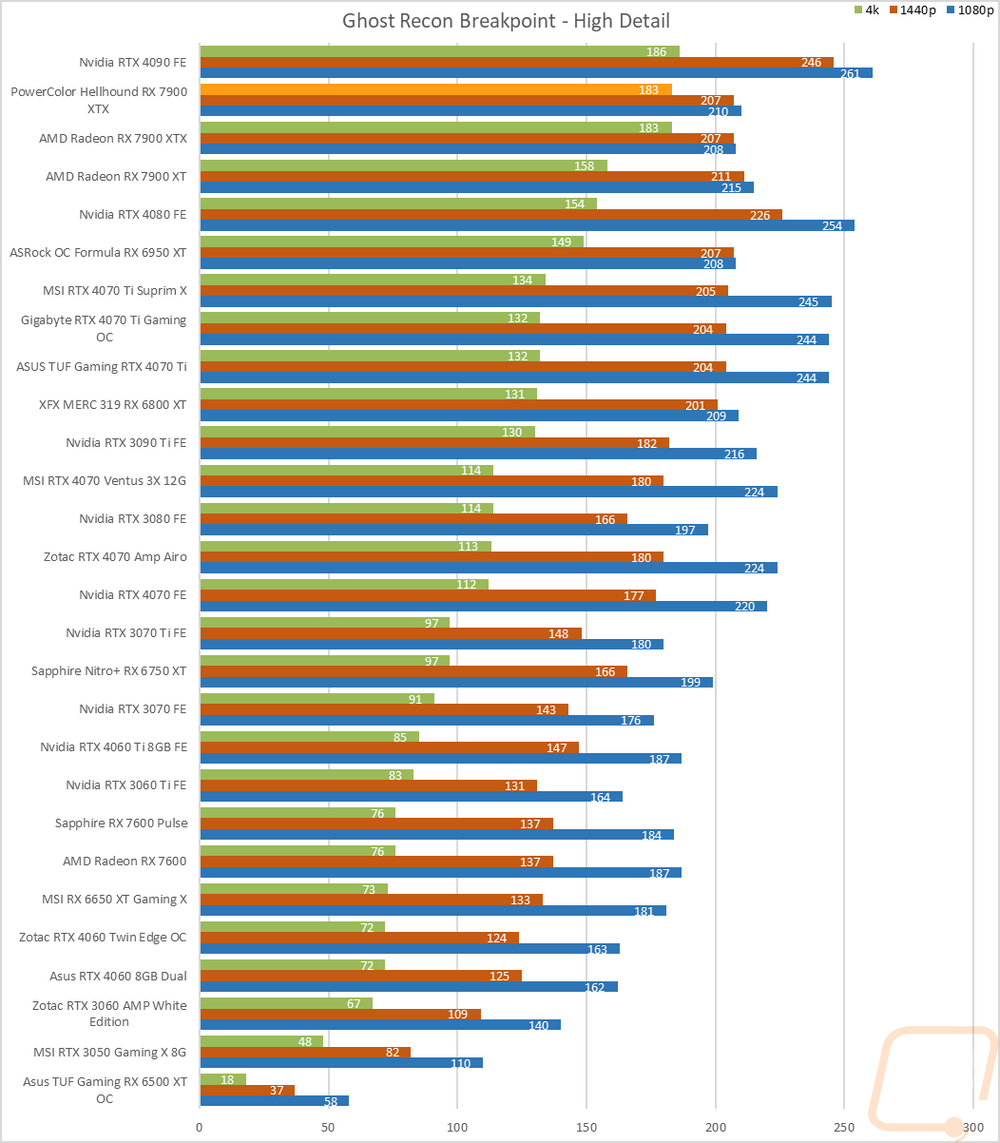
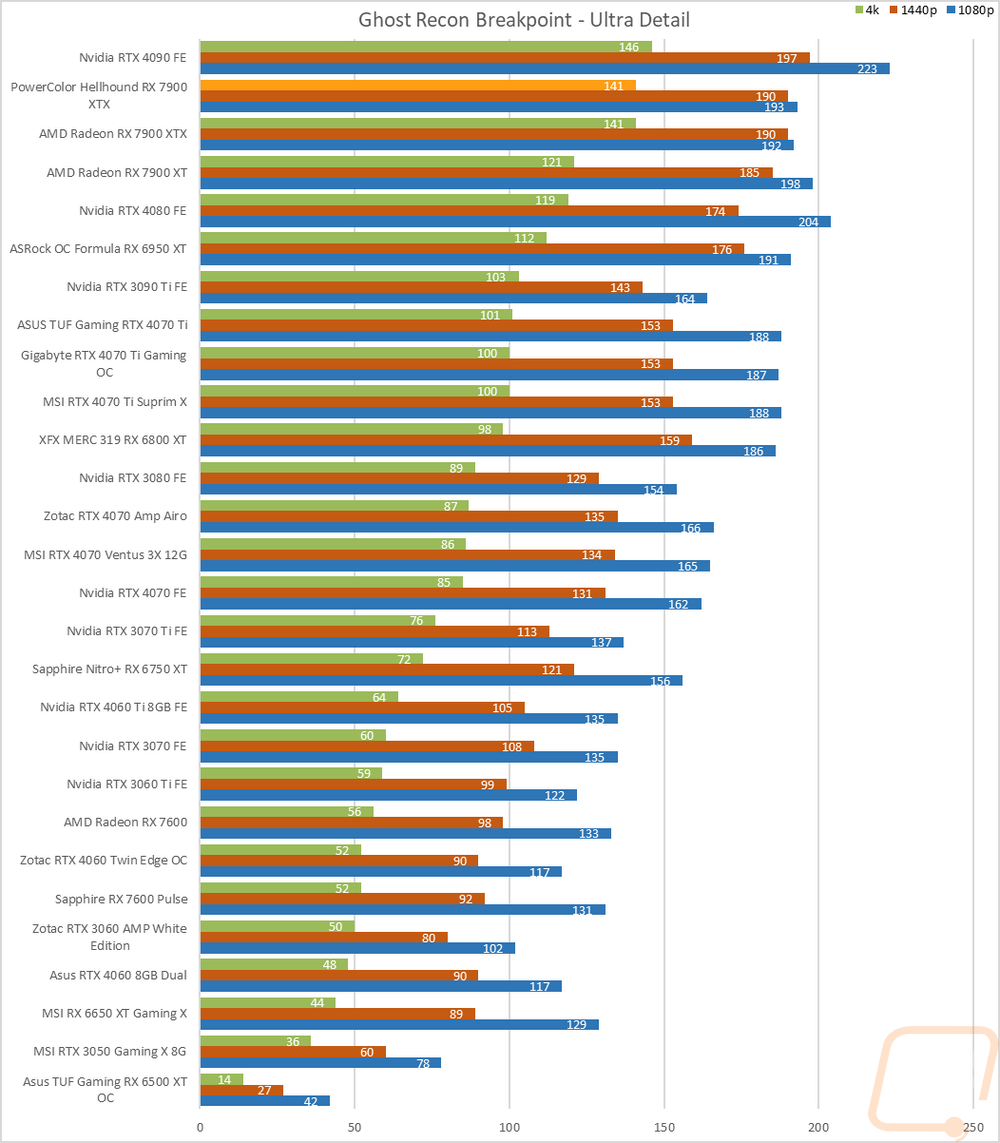
Of course, I have all of the actual in game results as well for anyone who wants to sort through the wall of graphs below. I have also averaged out the results for the Hellhound RX 7900 XTX, the 7900 XTX reference card, and the RTX 4080 sorted by resolution excluding CS:GO which can skew the results. This gives us a good look at where the Hellhound RX 7900 XTX fits. As I have already mentioned at 1080p and 1440p to a lesser extent a lot of the results are CPU limited so those results aren’t as indicative of overall performance. But you can see at 1440p that the Hellhound RX 7900 XTX does still edge out in front of the reference card and both are 4 and 5 FPS in front of the 4080. That gap is larger at 4k where both 7900 XTX have the same averaged FPS. For reference, though the Hellhound RX 7900 XTX did come out to 137.27 where the reference card was 136.72, rounding up and down makes the performance look the same but the small overclock and improved cooler on the Hellhound RX 7900 XTX does have some improvement. Both are then 9 FPS up over the RTX 4080. Looking at the full graphs you will see the Hellhound RX 7900 XTX bounces back and forth between 2nd and 3rd in the charts depending on the game with the 4080 jumping ahead of it in Borderlands 3 for example but as the averaged numbers show overall the Hellhound RX 7900 XTX and the 7900 XTX reference card are in front of the RTX 4080 in most tests at 4k.
|
|
1080p |
1440p |
4k |
|
PowerColor Hellhound RX 7900 XTX |
215 |
198 |
137 |
|
AMD Radeon RX 7900 XTX |
213 |
197 |
137 |
|
Nvidia RTX 4080 FE |
221 |
193 |
128 |