In-Game Benchmarks
Now we finally get into the in game performance and that is the main reason people pick up a new video card. To test things out I ran through our new benchmark suite that tests 10 games at three different resolutions (1080p, 1440p, and 4k). Most of the games tested have been run at the highest detail setting and a mid-range detail setting to get a look at how turning things up hurts performance and to give an idea of whether turning detail down from max will be beneficial for frame rates. In total, each video card is tested 48 times and that makes for a huge mess of results when you put them all together. To help with that I like to start with these overall playability graphs that take all of the results and give an easier-to-read result. I have one for each of the three resolutions and each is broken up into four FPS ranges. Under 30 FPS is considered unplayable, over 30 is playable but not ideal, over 60 is the sweet spot, and then over 120 FPS is for high refresh rate monitors.
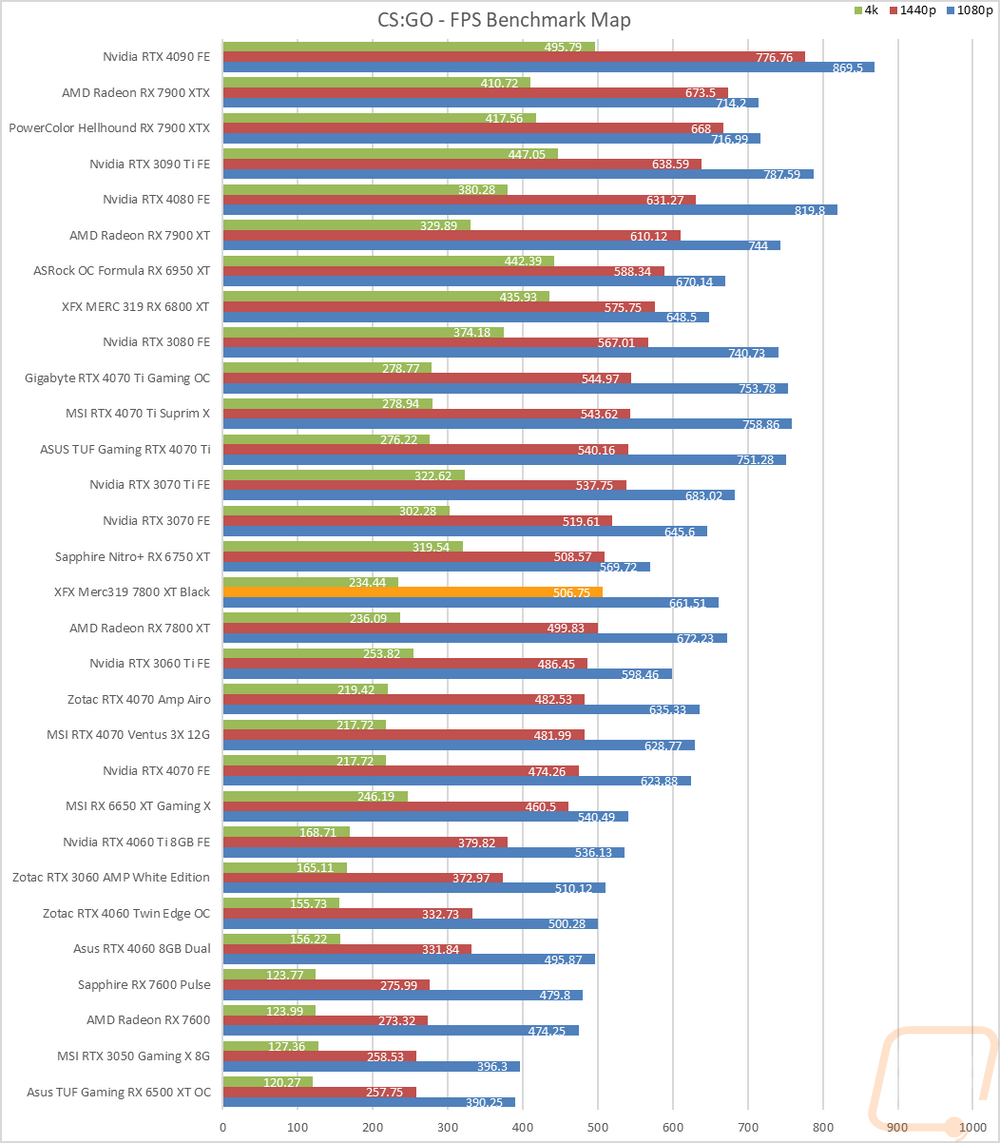
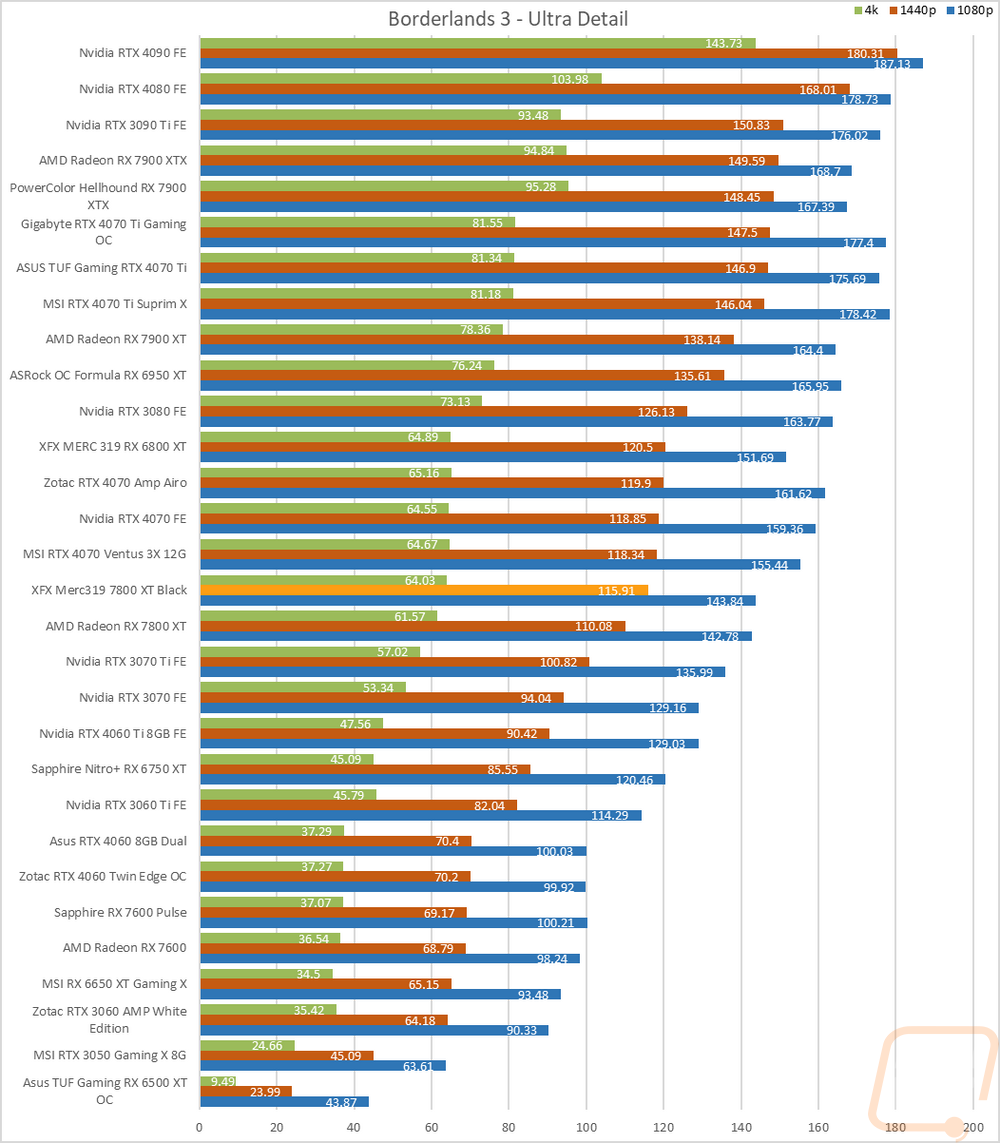
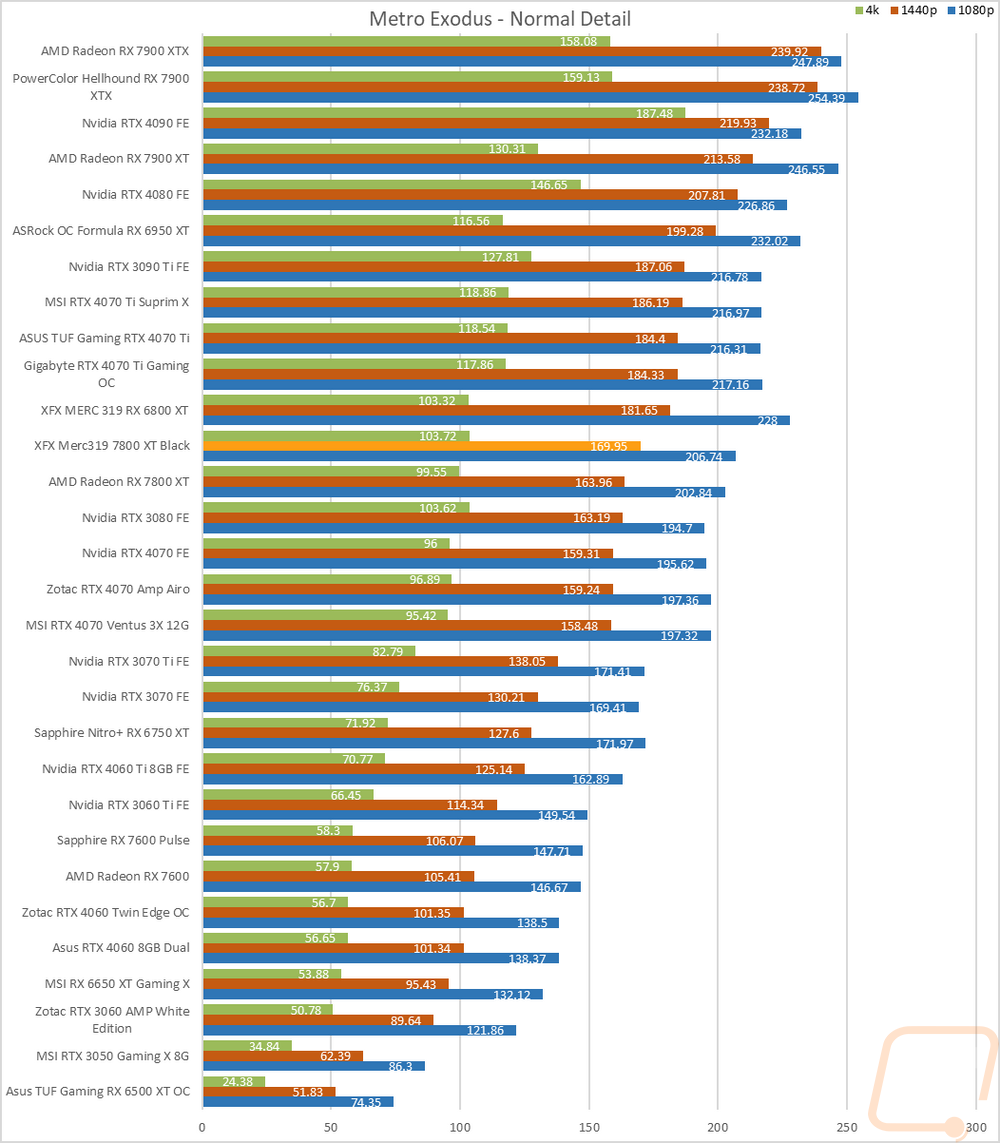
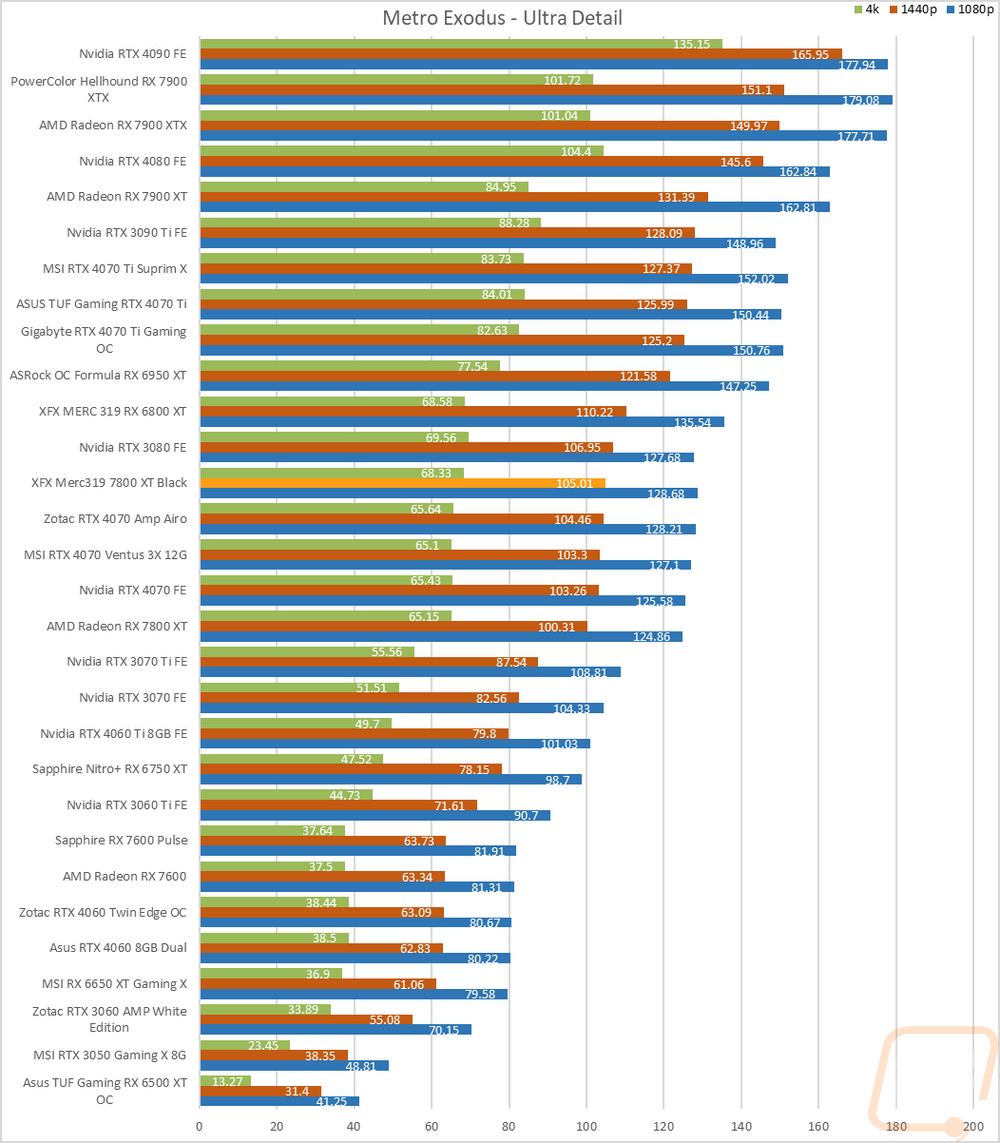
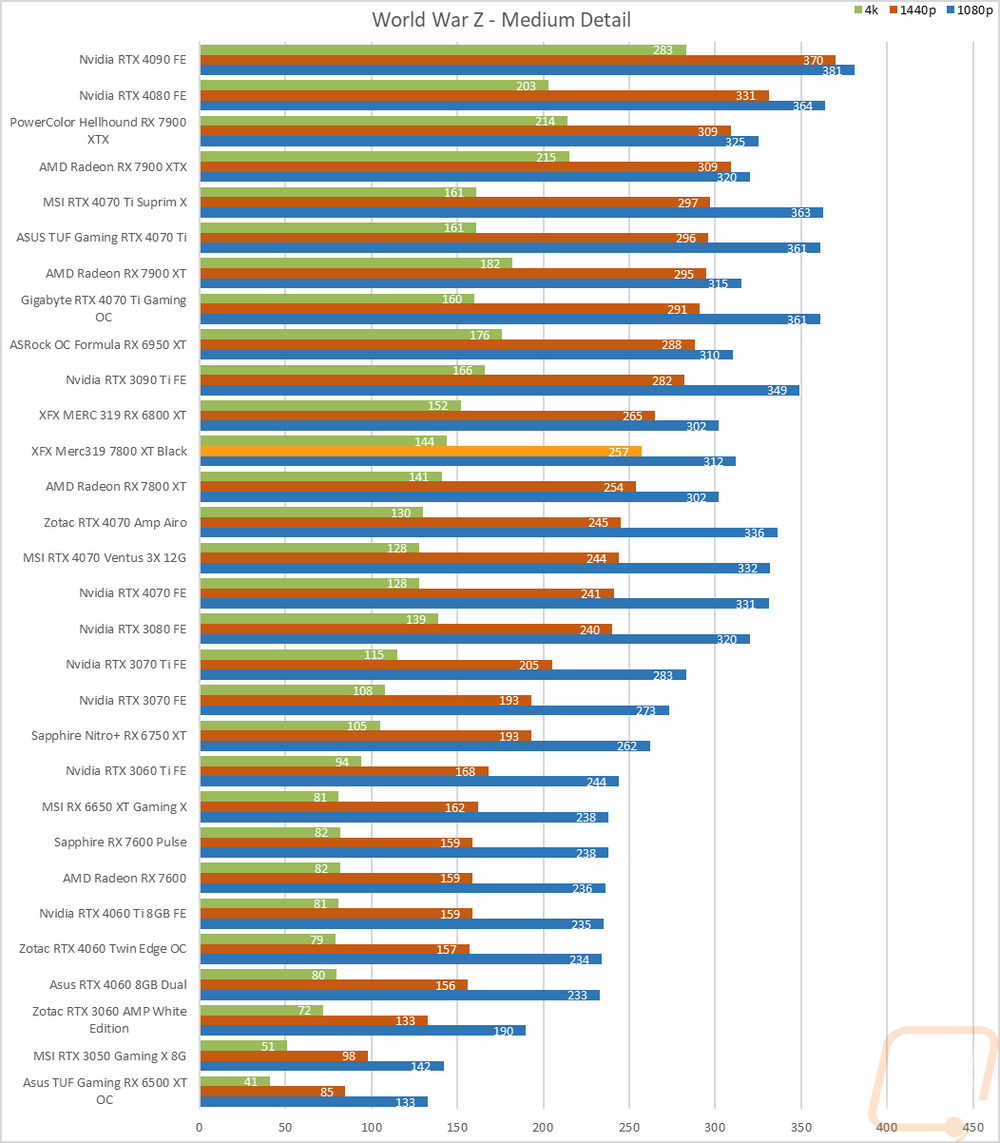
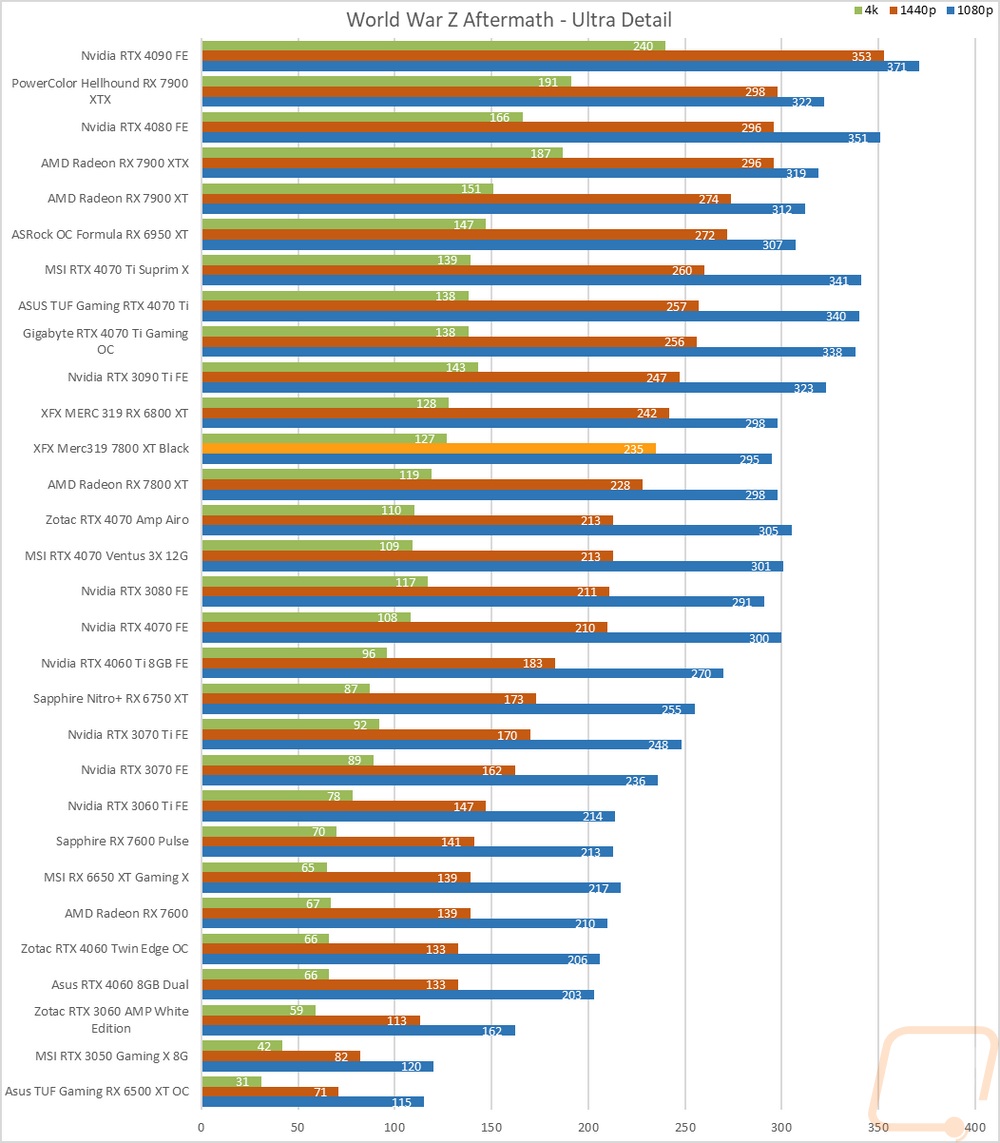
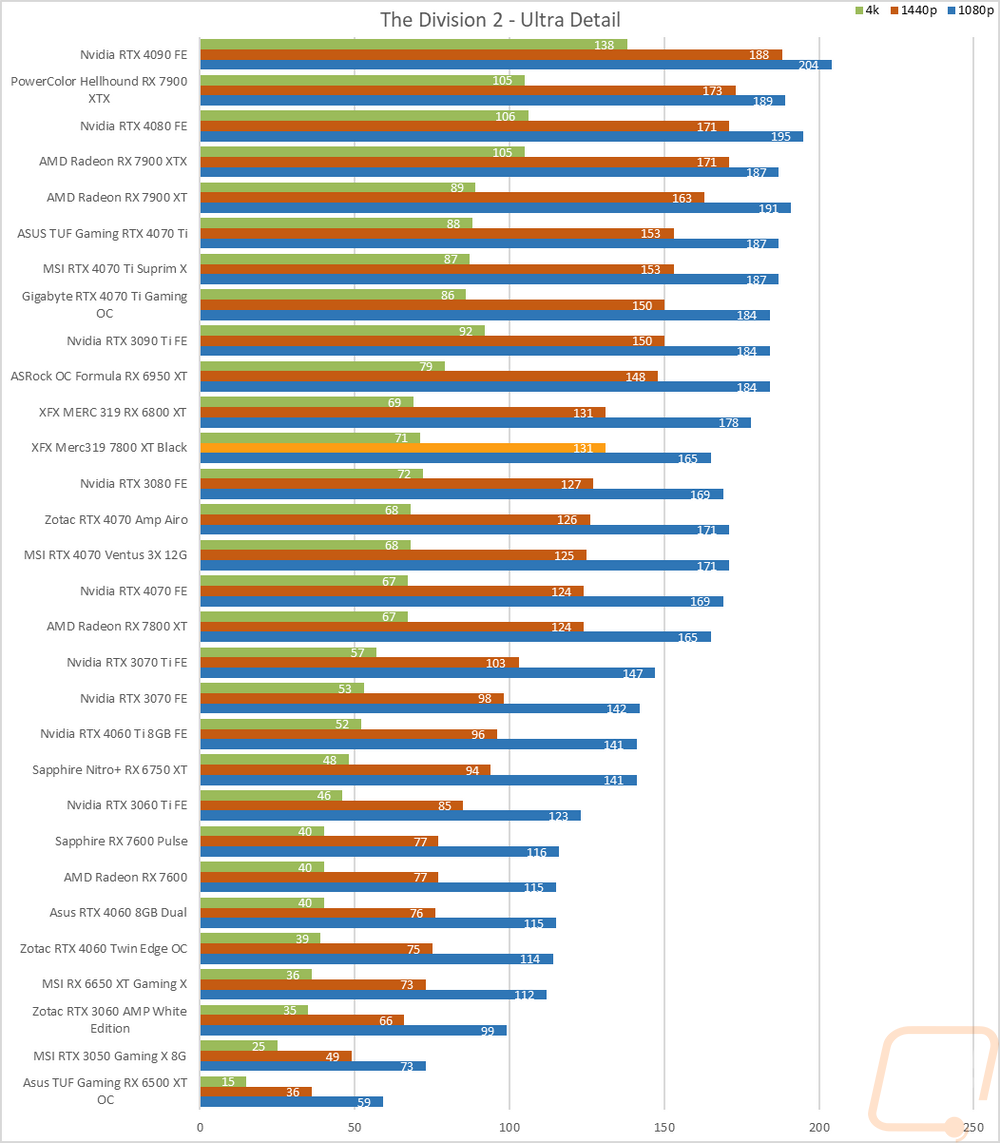
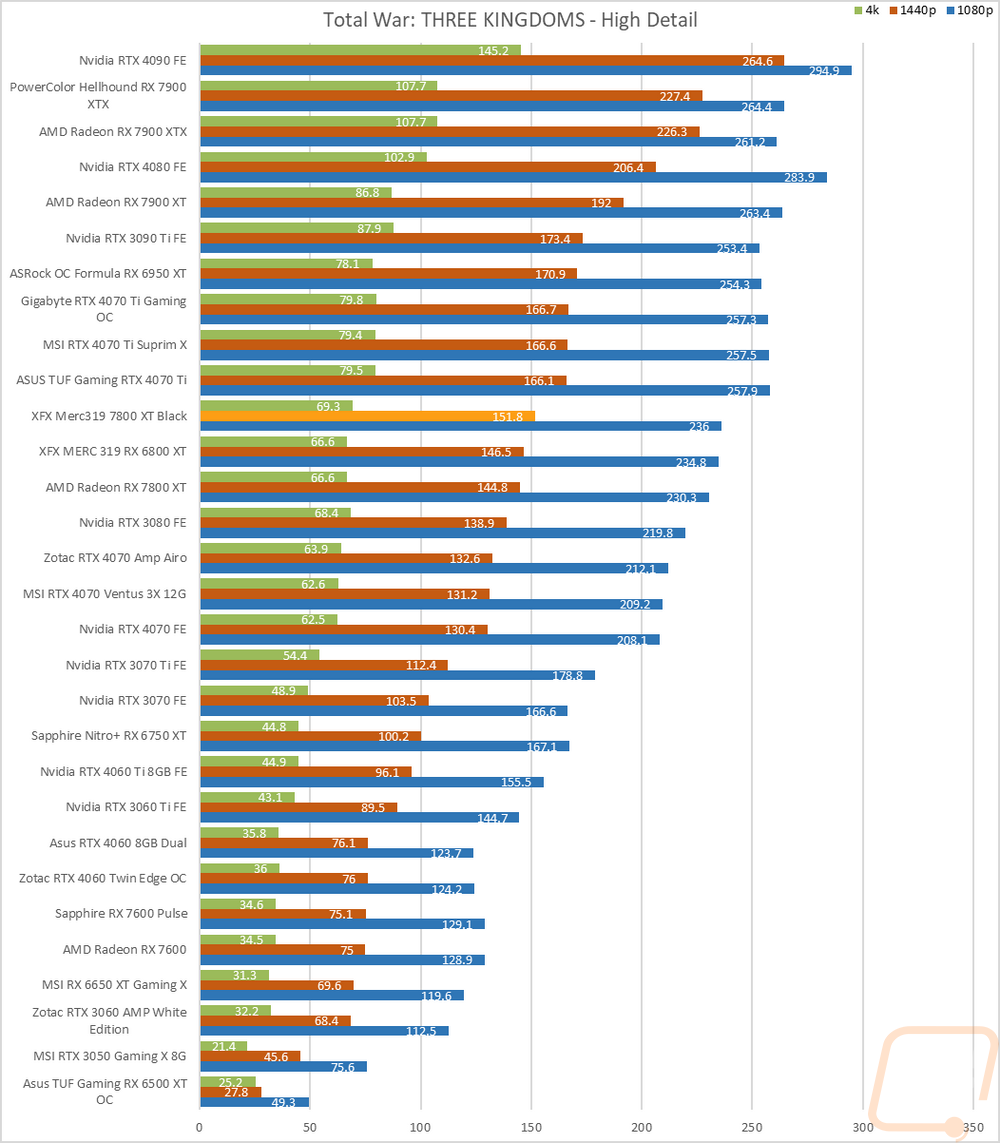
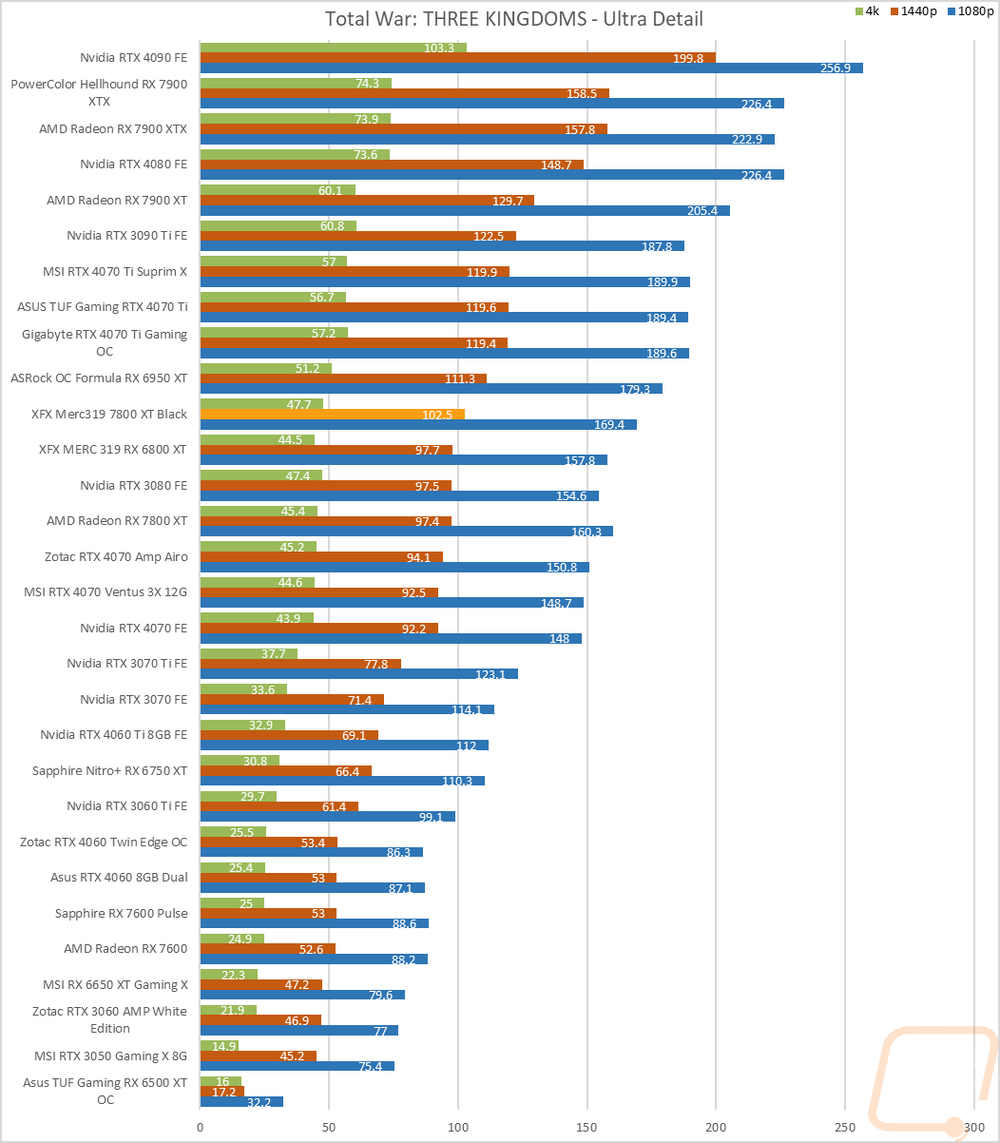
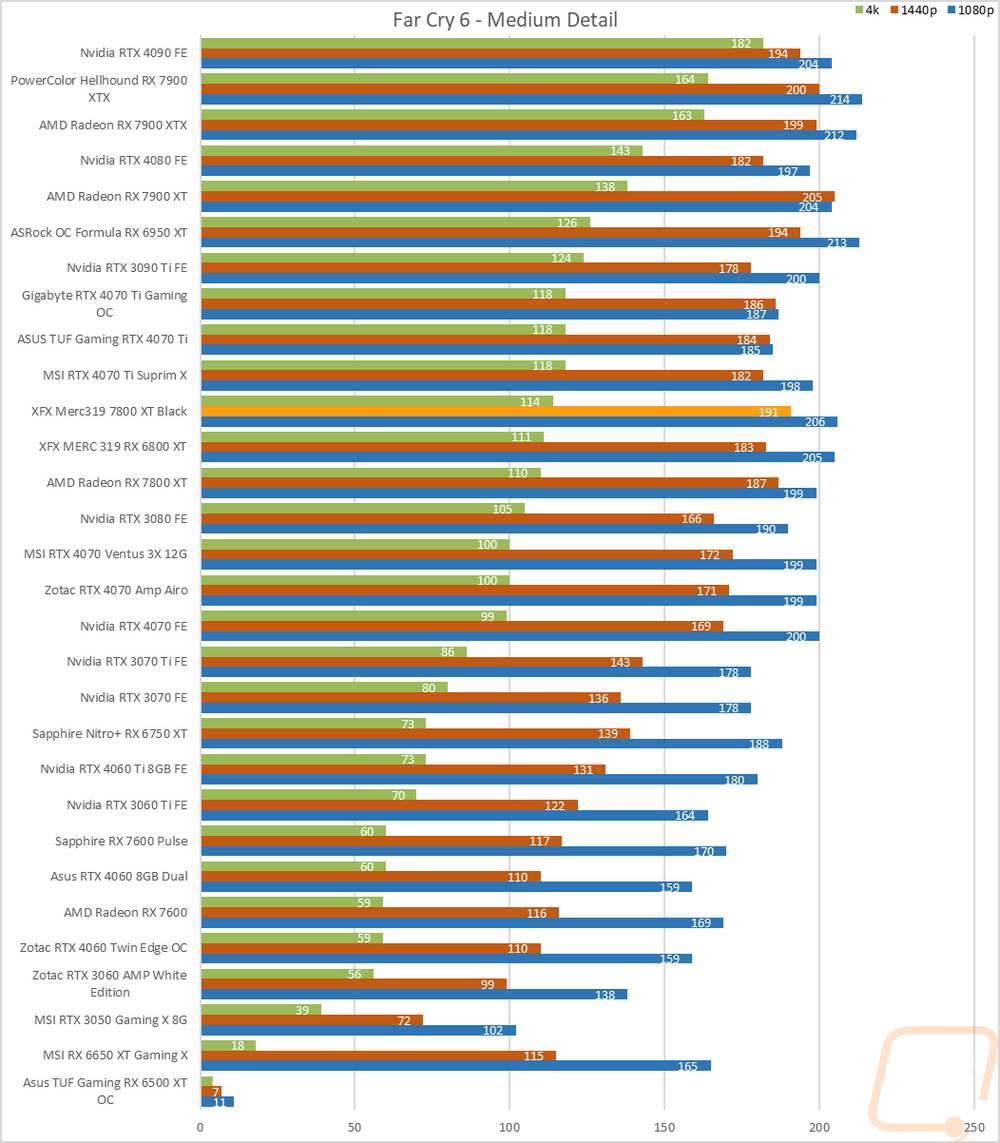
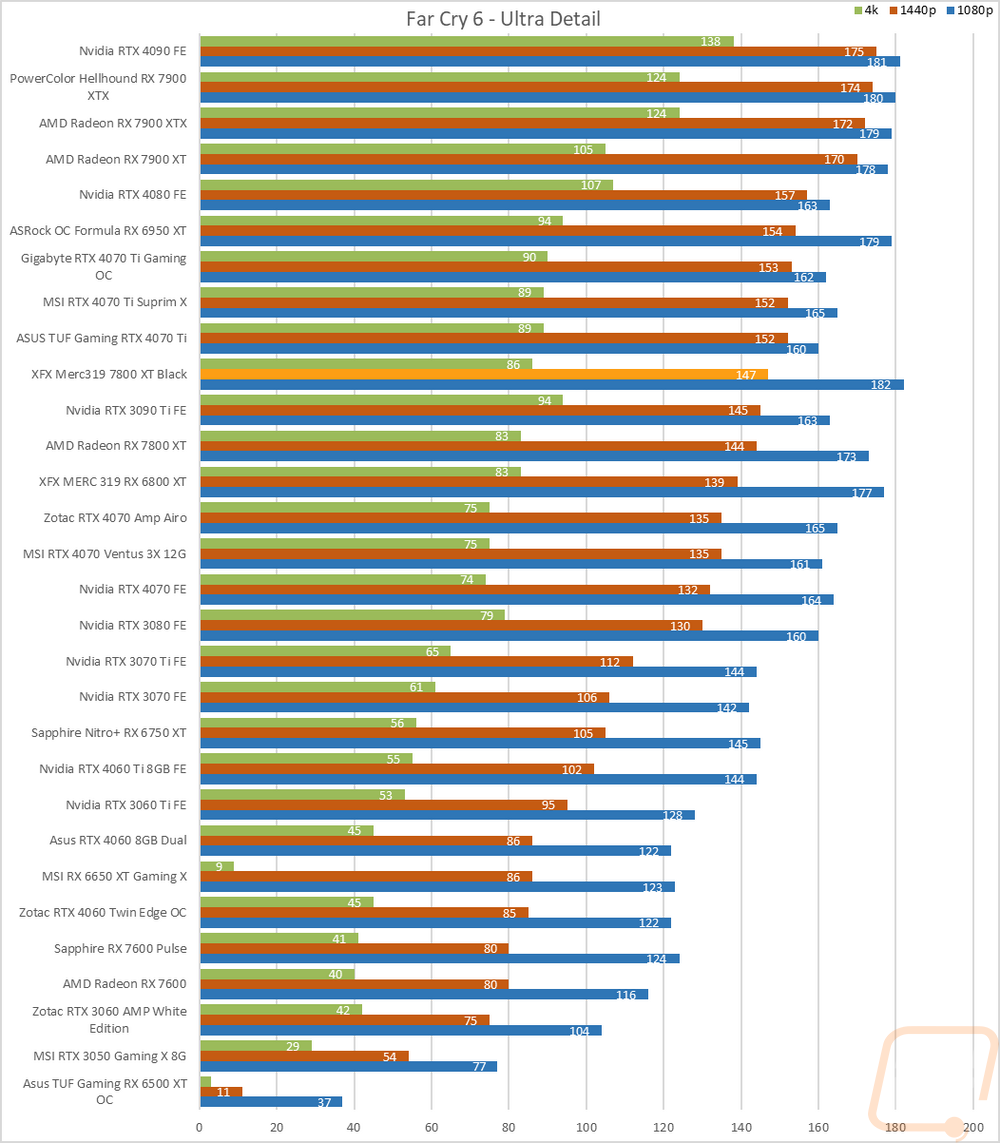
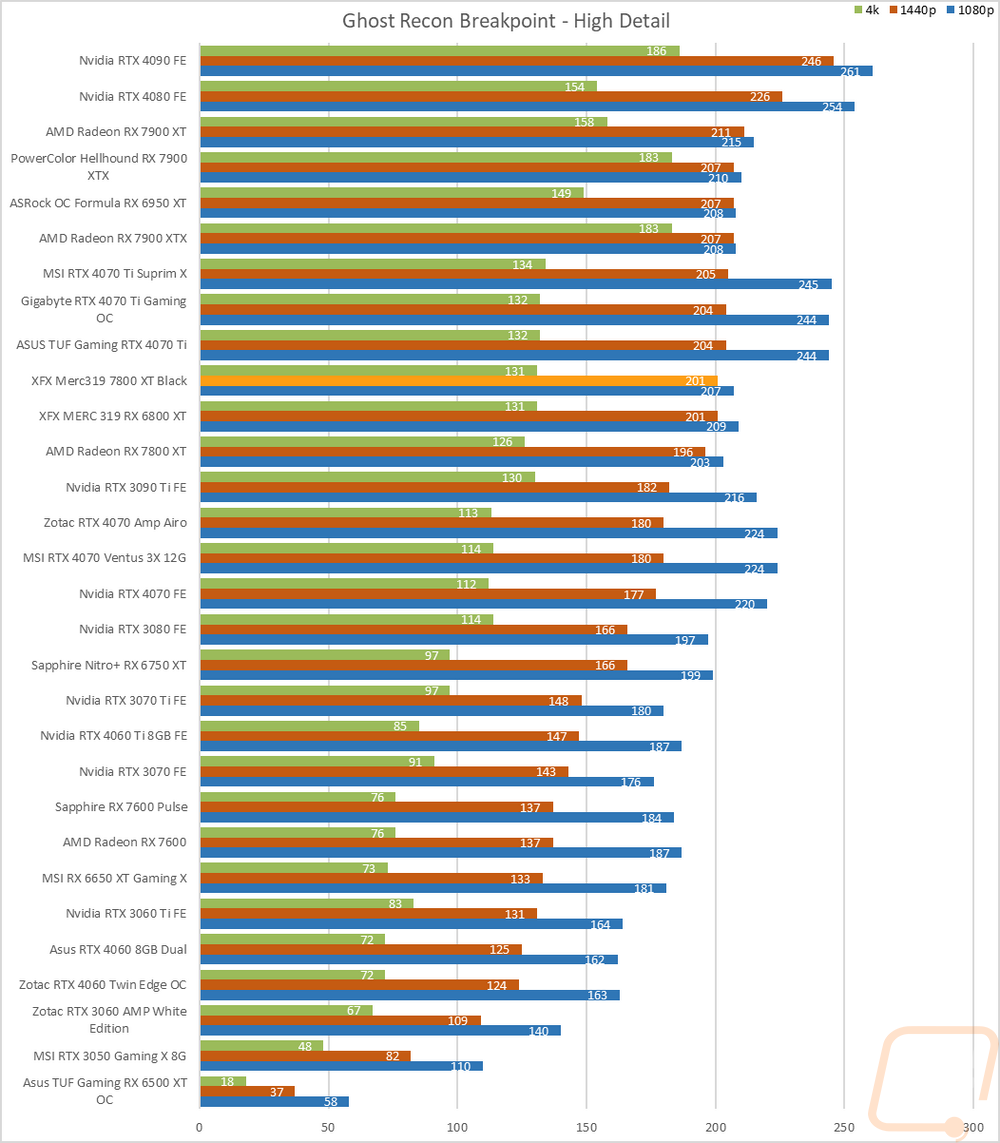
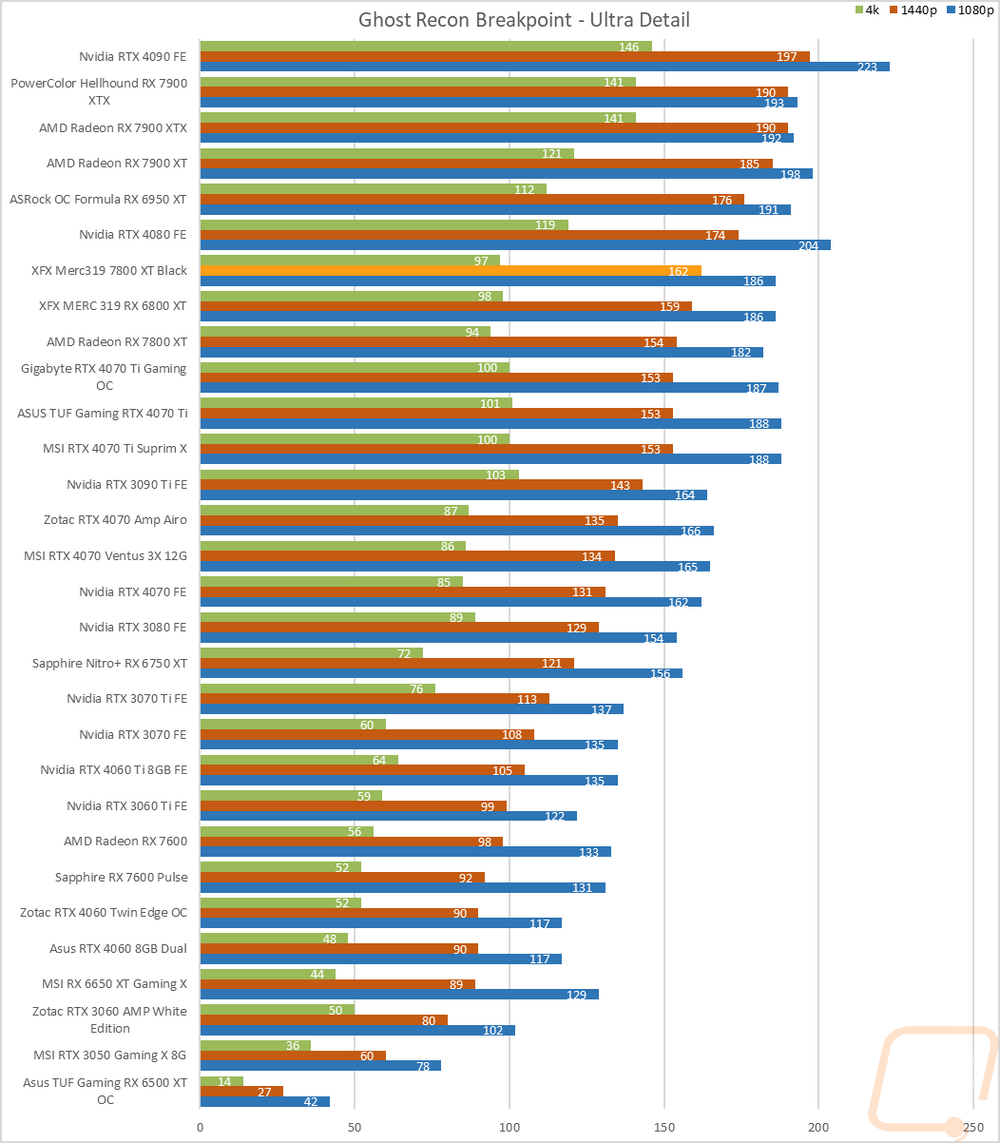
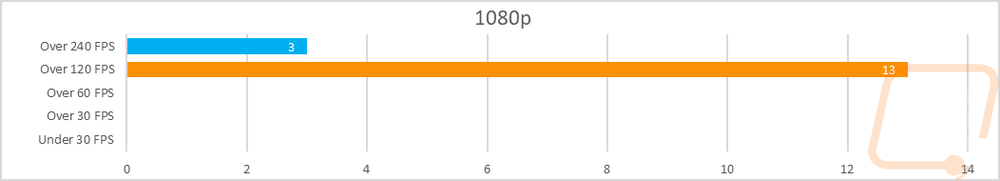
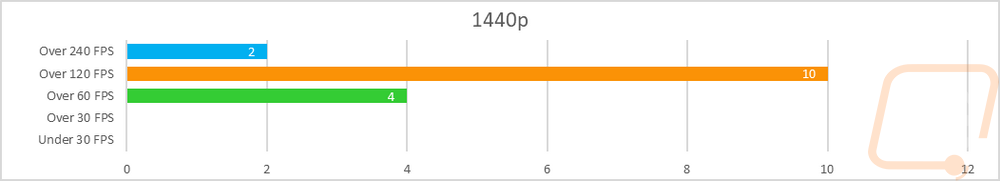
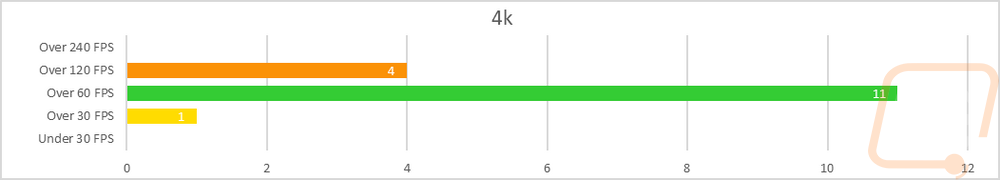
So how did the Merc 319 7800 XT Black do? Well AMD is pushing the 7800 XT as their flagship 1440p card, but even at 4K, it performed well handling all but one of the tests while staying over 60 FPS. There were even four results up over 120 FPS. Switching up to 1440p we see everything move up higher in the chart with every result coming in over 60 FPS. There were 12 over 120 FPS and two of those were over 240 FPS. Overall though a majority of the results were in the 120-239 FPS range which is great for 1440p high refresh gaming. Then of course at 1080p everything ran over 120 FPS with three of the results also going over 240 FPS and even then a majority of the results were CPU limited.
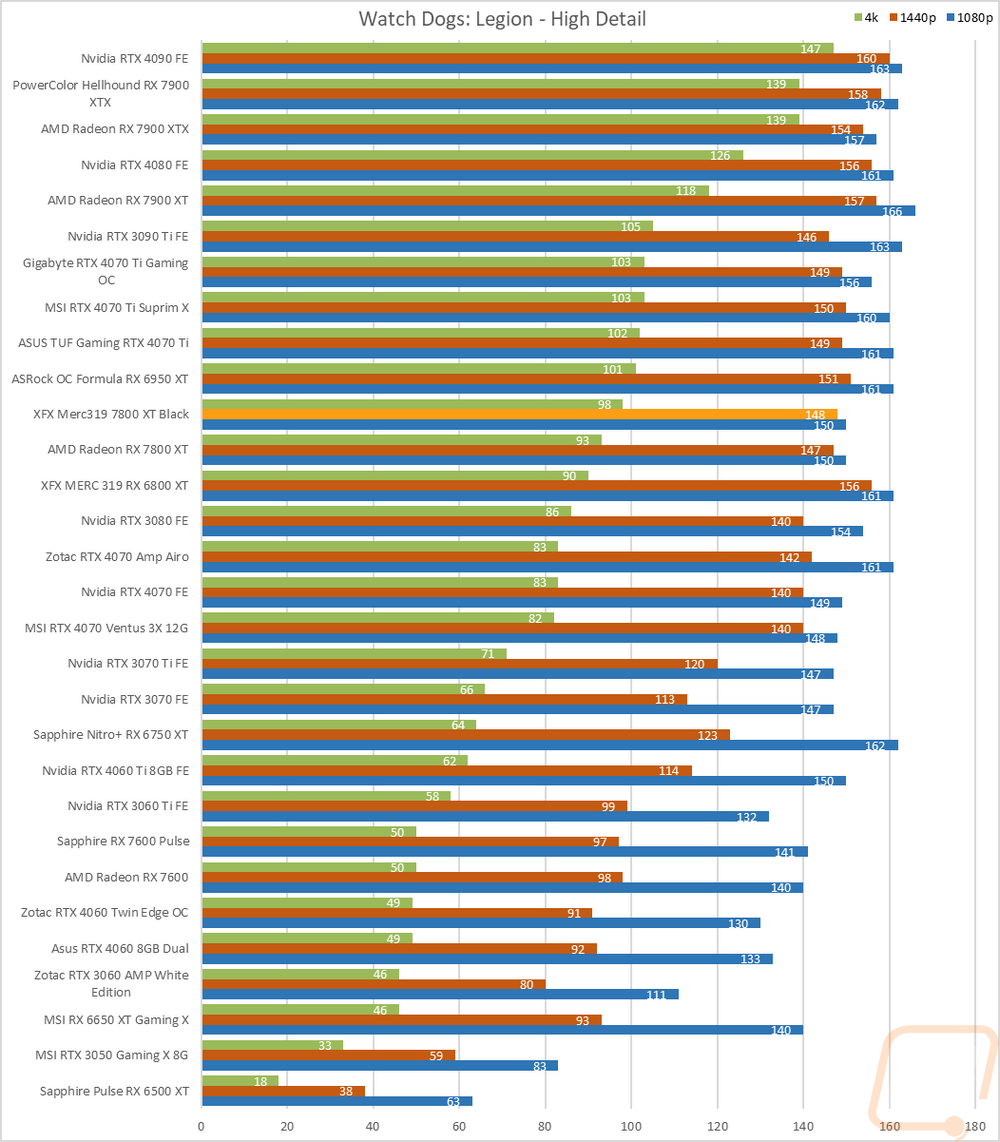
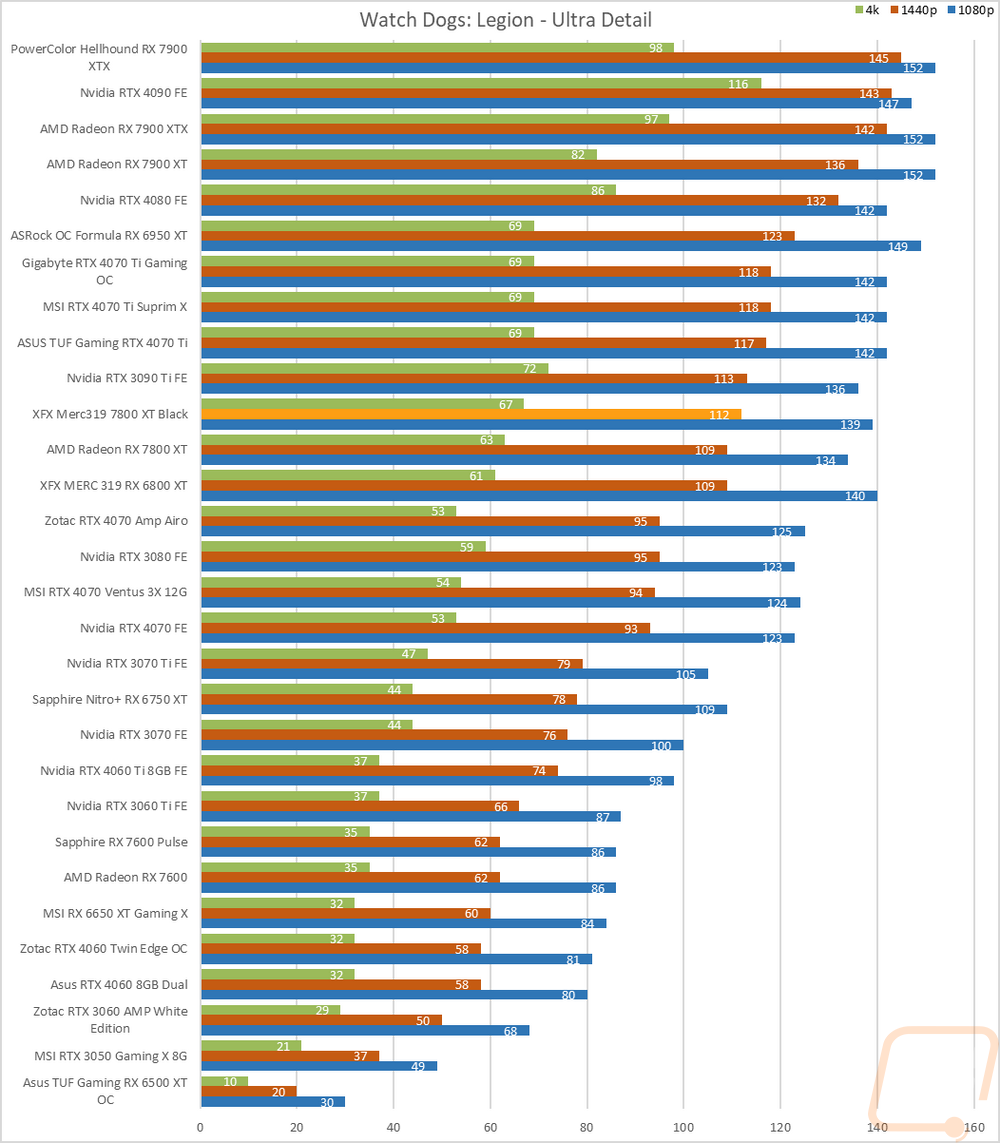
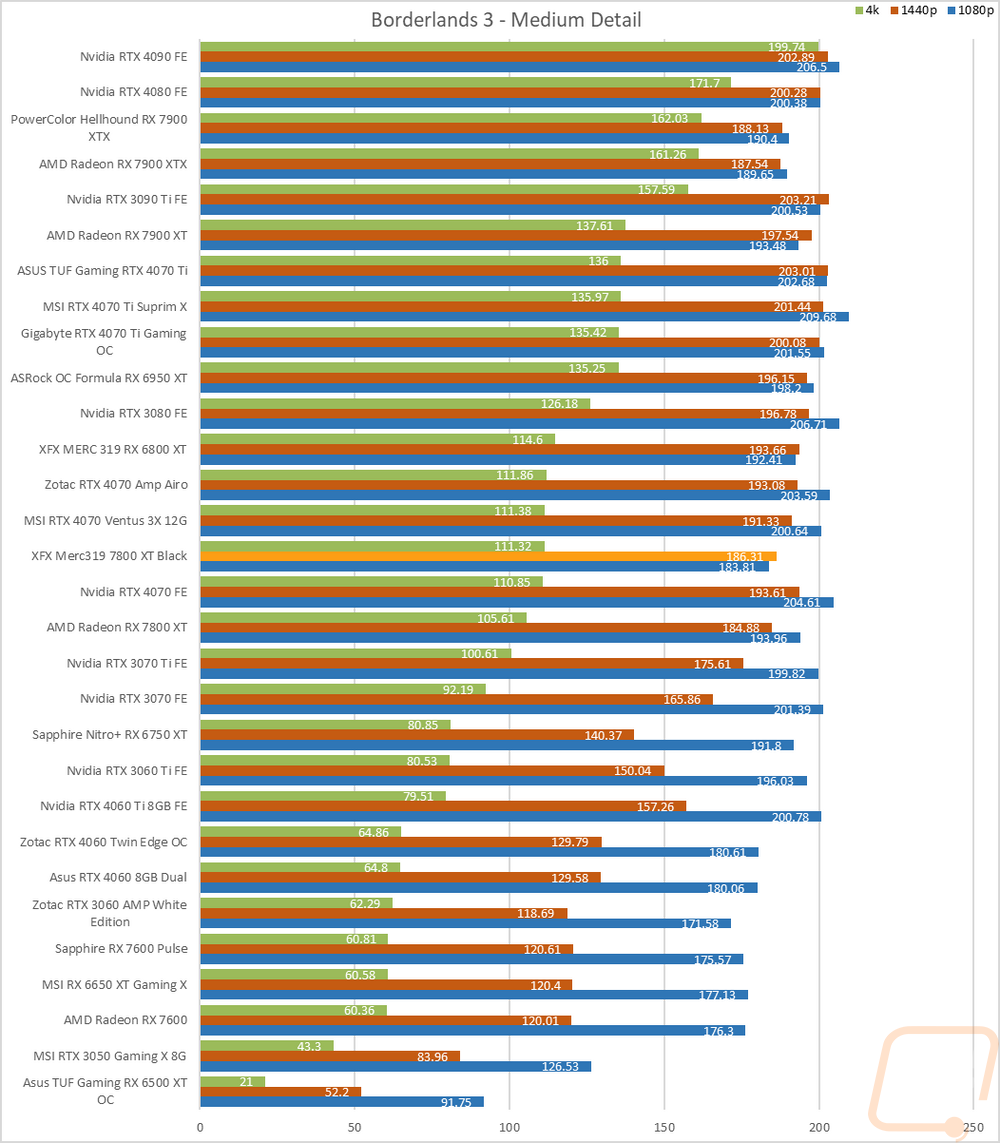
Of course, I have all of the actual in game results as well for anyone who wants to sort through the wall of graphs below. I also have put together averaged results for a range of cards around the Merc 319 7800 XT Black. I did remove CS:GO from the results to avoid skewing the results. The 1080p results are rattled with CPU-limited results so I’m not too concerned there, especially with the average FPS being up near 200. My focus was on 1440p which is what the 7800 XT is targeted at and the Merc 319 7800 XT Black improved on the 156.3 average from the reference 7800 XT up to 161 for a 3% improvement which was a little less than I saw in the synthetic tests. That was almost enough to catch up to the XFX 6800 XT which averaged 162.3 FPS, 1.3 FPS over the Merc 319 7800 XT Black. At 4k though the Merc 319 7800 XT Black jumps out in front by almost 1 FPS over the 6800 XT. This was 4 FPS over the reference 7800 XT and an improvement of 4.5%. The main graphs mostly just repeat what we see in the averaged numbers with the Merc 319 7800 XT Black ahead of the stock 7800 XT and way in front of the RTX 4070.
|
|
1080p |
1440p |
4K |
|
XFX MERC 319 RX 6800 XT |
197.1 |
162.3 |
92.4 |
|
XFX Merc 319 7800 XT Black |
194.0 |
161.0 |
93.3 |
|
Radeon RX 7800 XT |
190.7 |
156.3 |
89.3 |
|
Nvidia RTX 4070 FE |
190.6 |
147.6 |
83.5 |
|
Sapphire Nitro+ RX 6750 XT |
165.2 |
119.4 |
64.5 |
|
Nvidia RTX 4060 Ti 8GB FE |
160.1 |
115.3 |
62.0 |
|
Zotac RTX 4060 Twin Edge OC |
135.7 |
94.5 |
50.1 |