Cooling Noise and Power
For my last few tests, rather than focusing on in game performance, I like to check out other aspects of video card performance. These are also the most important ways to differentiate the performance between cards that have the same GPU. To start things off I took a look at power usage.
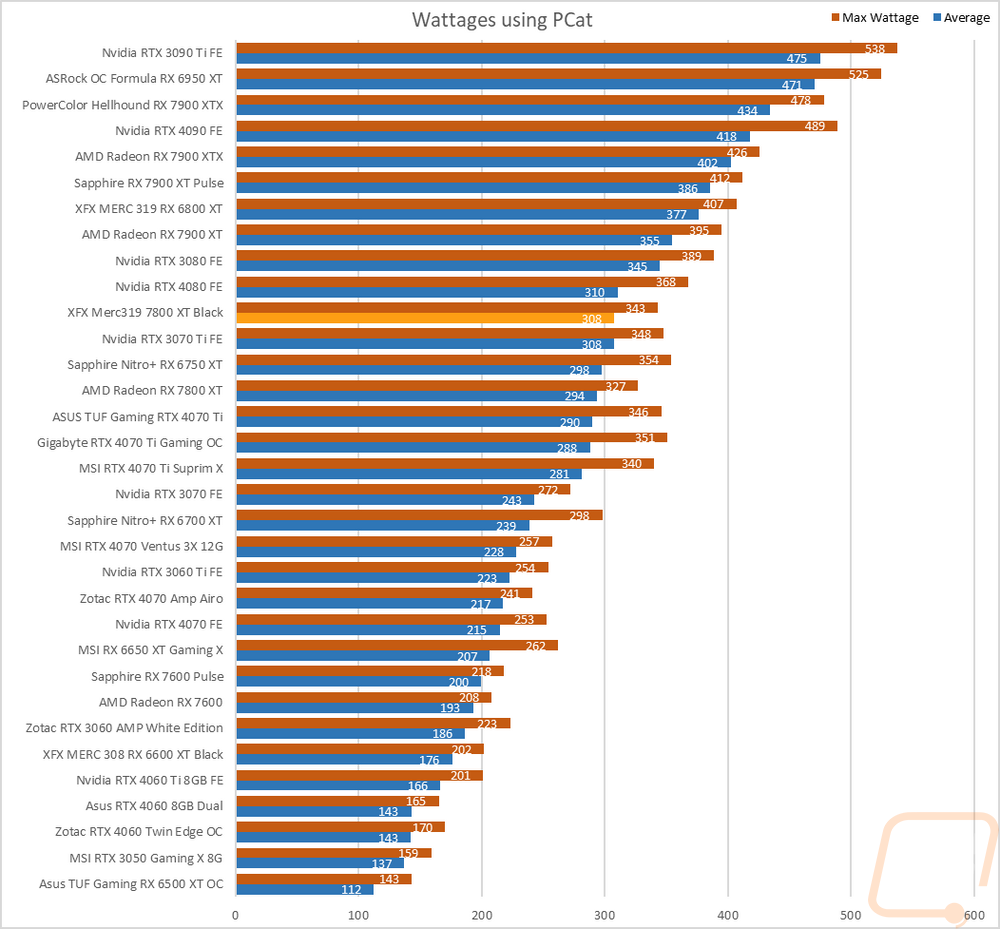
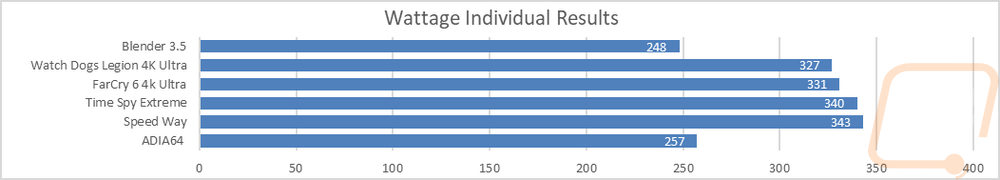
For this, our new test setup utilizes the Nvidia-designed PCat v2 along with cables to handle both traditional 6 or 8-pin connections as well as the new 12VHPWR. The PCat also utilizes a PCIe adapter to measure any power going to the card through the PCIe slot so we can measure the video card wattage exclusively, not the entire system as we have done in the past. I test with a mix of applications to get both in game, synthetic benchmarks, and other workloads like Blender and AIDA64. Then everything is averaged together for our result. I also have the individual results for this specific card and I document the peak wattage result as well which is almost always Time Spy Extreme. The Merc 319 7800 XT Black came in with an average of 308 watts across all of our tests and peaked at 343. This put it in between the RTX 3070 Ti and RTX 4080 Founders Edition cards on the charts and was 14 watts higher than the stock-clocked reference 7800 XT for the average and 16 watts higher at peak. Even with the higher power draw the Merc 319 7800 XT Black was still well below the XFX 6800 XT showing the efficiency improvement from generation to generation with similar performance.
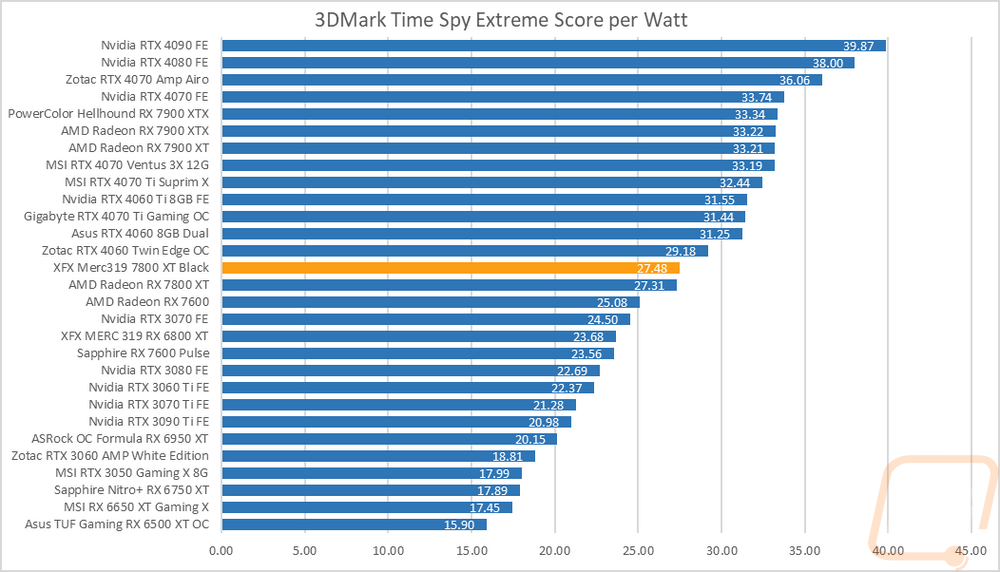
With having exact peak wattage numbers when running Time Spy Extreme I was also able to put together a graph showing the total score for each watt that a card draws which gives us an interesting look at overall power efficiency in the popular and demanding benchmark. The Merc 319 7800 XT Black came in with 27.48 points per watt which put it in the middle of the chart and surprisingly it is a hair higher than the reference card. Normally overclocked cards give a good performance jump but use a lot more power but XFX hit the mark in efficiency here.
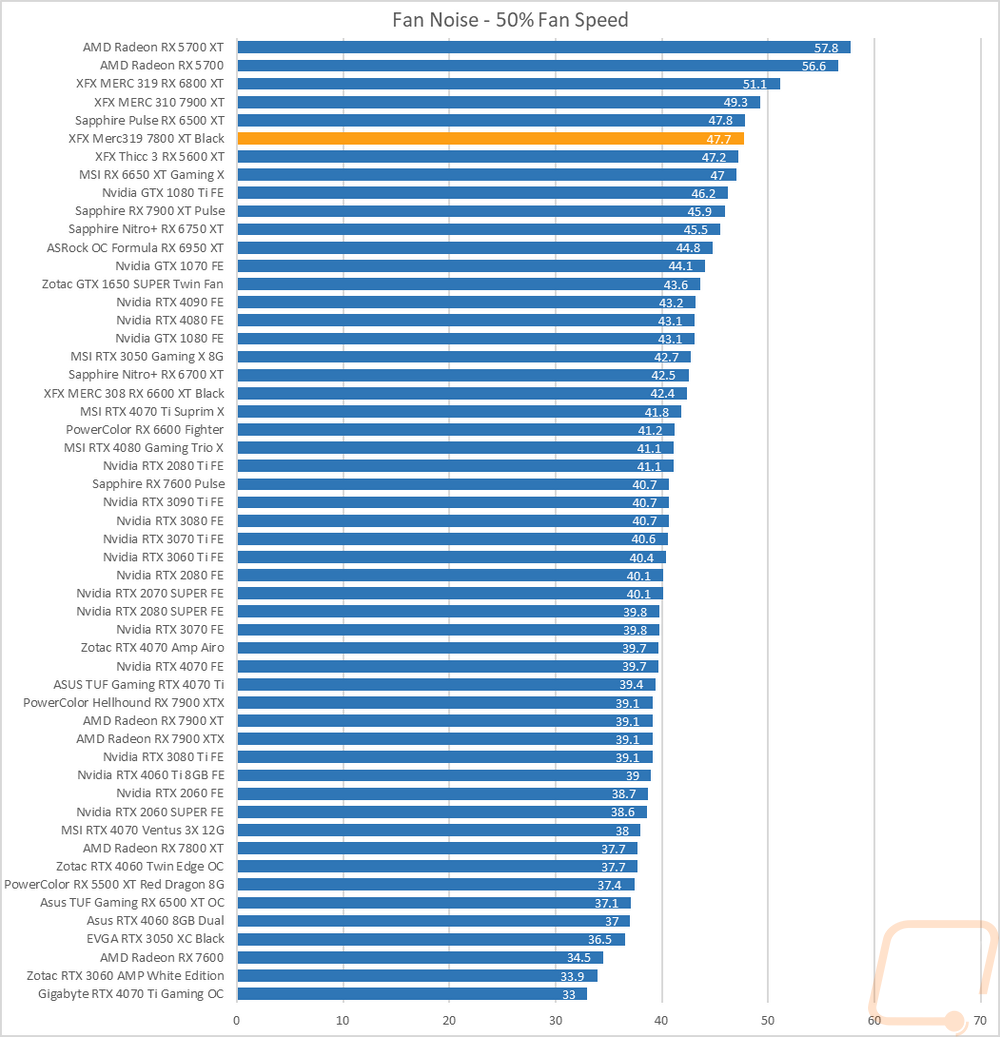
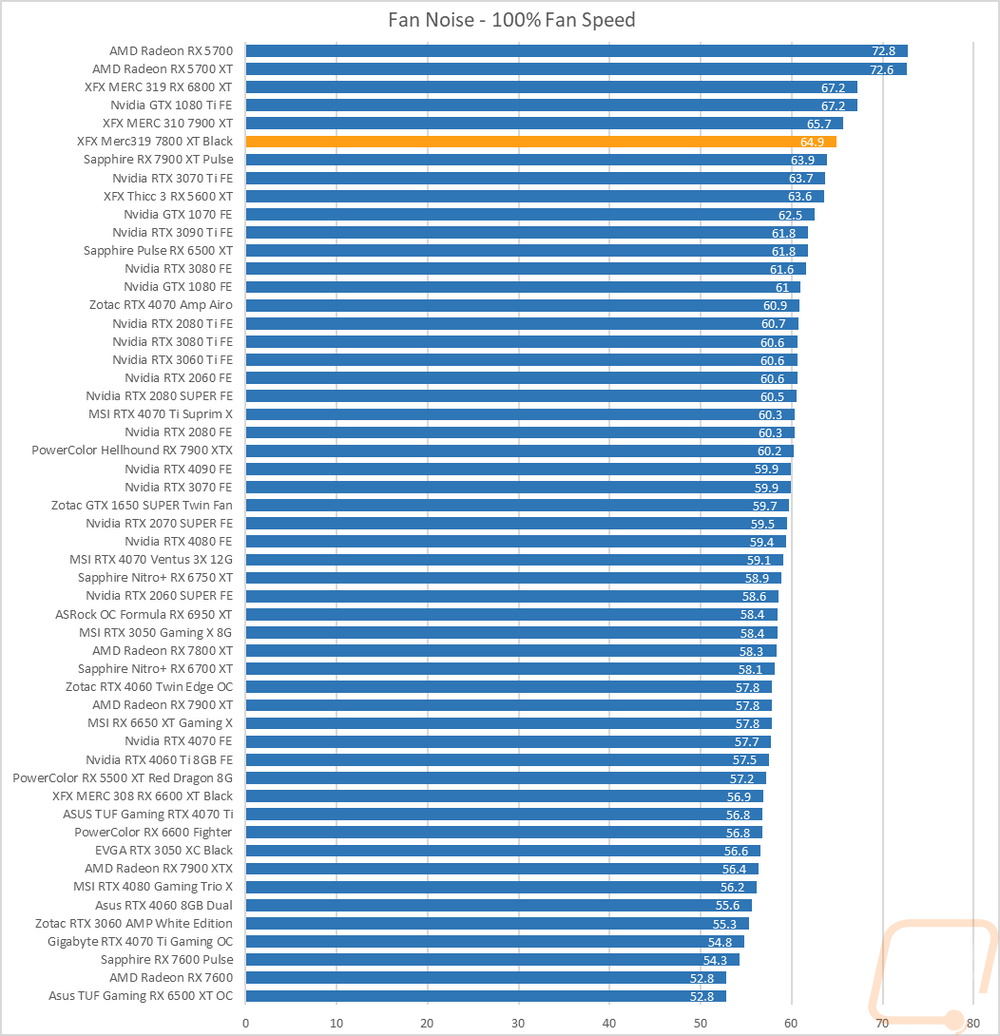
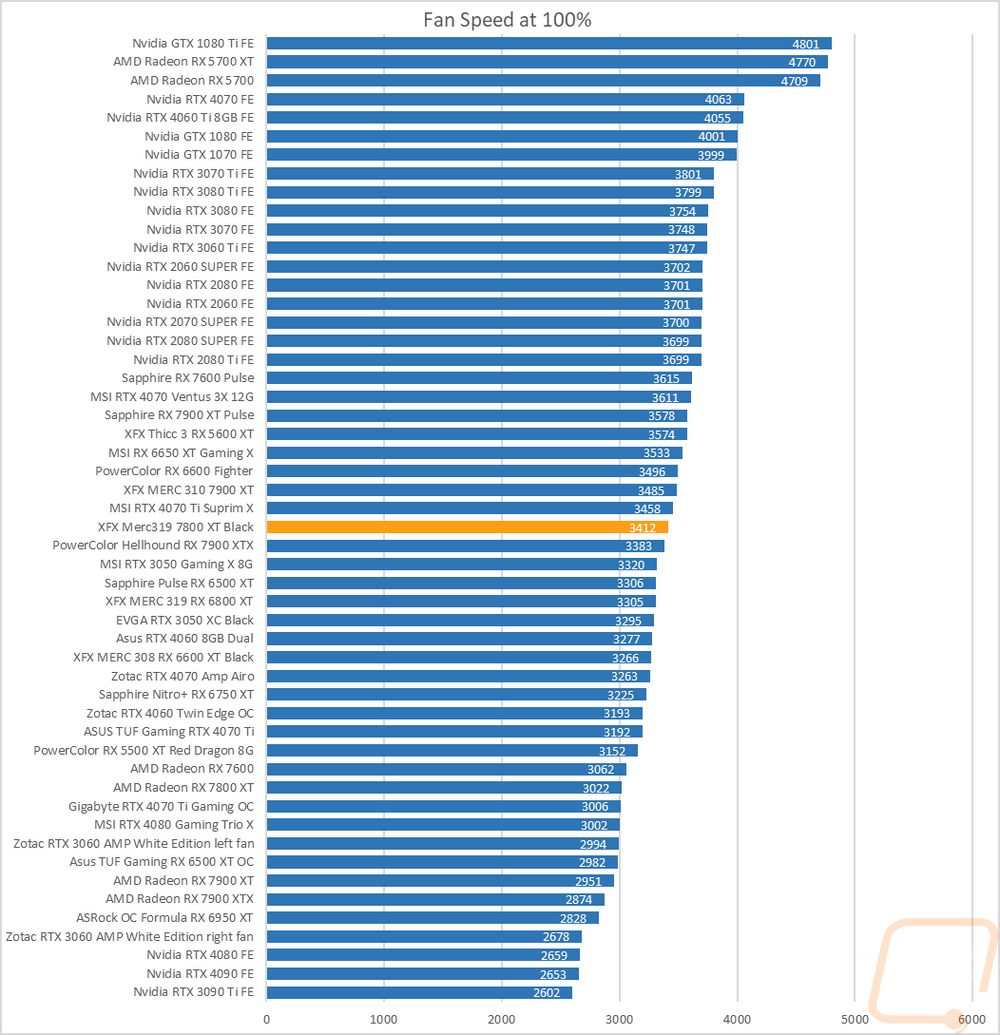
My next round of tests were looking at noise levels. These are especially important to me because I can’t stand to listen to my PC whirling. Especially when I’m not in game and other applications are using the GPU. For my testing, though I first tested with the fan cranked up to 100% to get an idea of how loud it can get, then again at 50% to get an idea of its range. The Merc 319 7800 XT Black is up in the top ¼ of the chart in both tests with its 47.7 dB 50% fan speed noise level and 64.9 dB 100% fan speed noise level. The fan RPM level on the other hand is down in the middle of the chart showing some noise inefficiency, normally these translate close to 1 to 1. They did improve things however, the XFX 6800 XT was even lower in the RPM chart and higher in the noise chart.
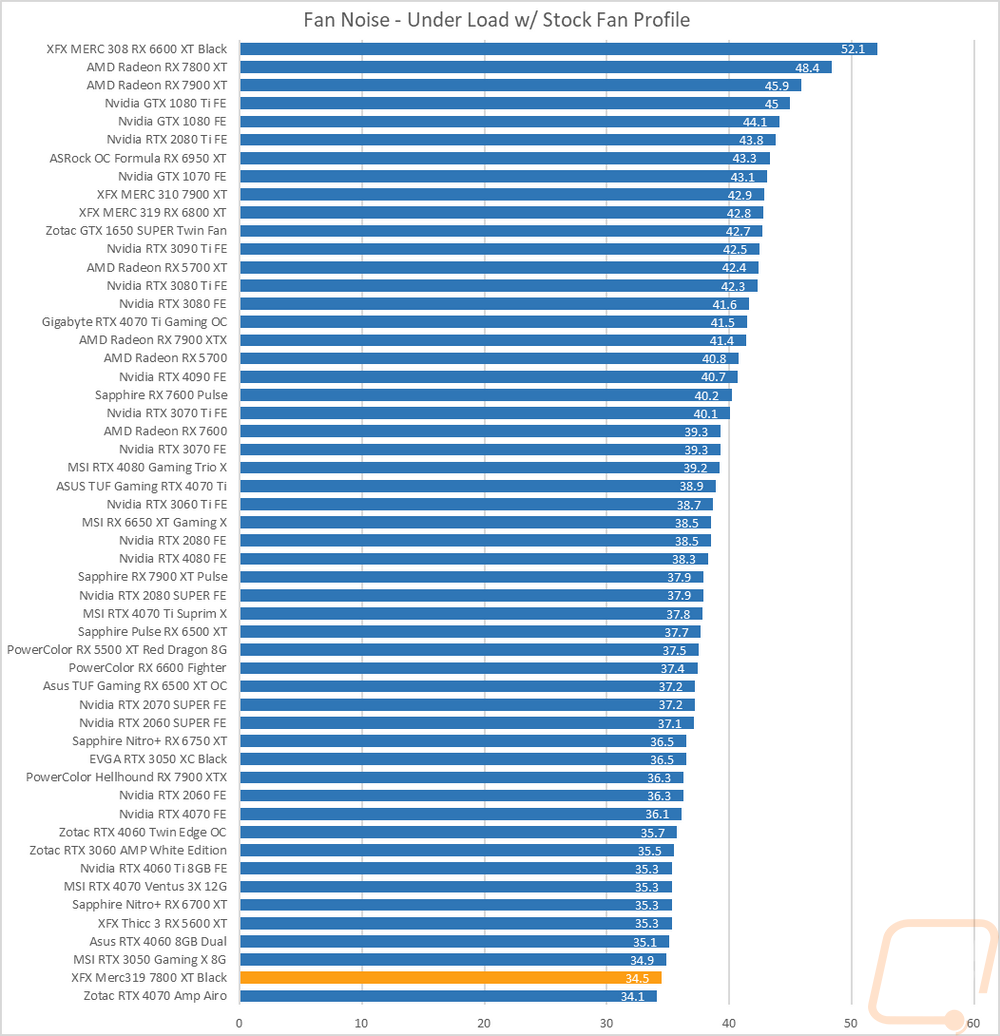
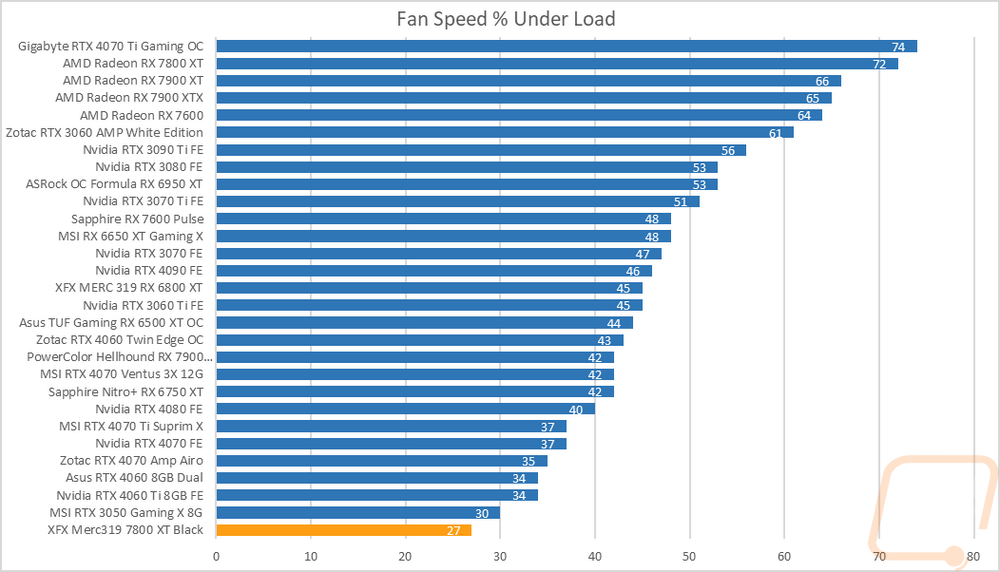
I also take a look at noise performance while under load. For that when running AIDA64’s stress test I wait until the temperature of the card has leveled off and then measure how loud things are when the card is at its worst-case scenario with the stock fan profile. Here the Merc 319 7800 XT Black is on the other end of the chart, sitting down nearly at the bottom of the chart at 34.5 db. So while the Merc 319 7800 XT Black is capable of being noisy, when it counts it is quiet. It managed that because the fans were only running at 27% of power when I did our load testing, impressive.
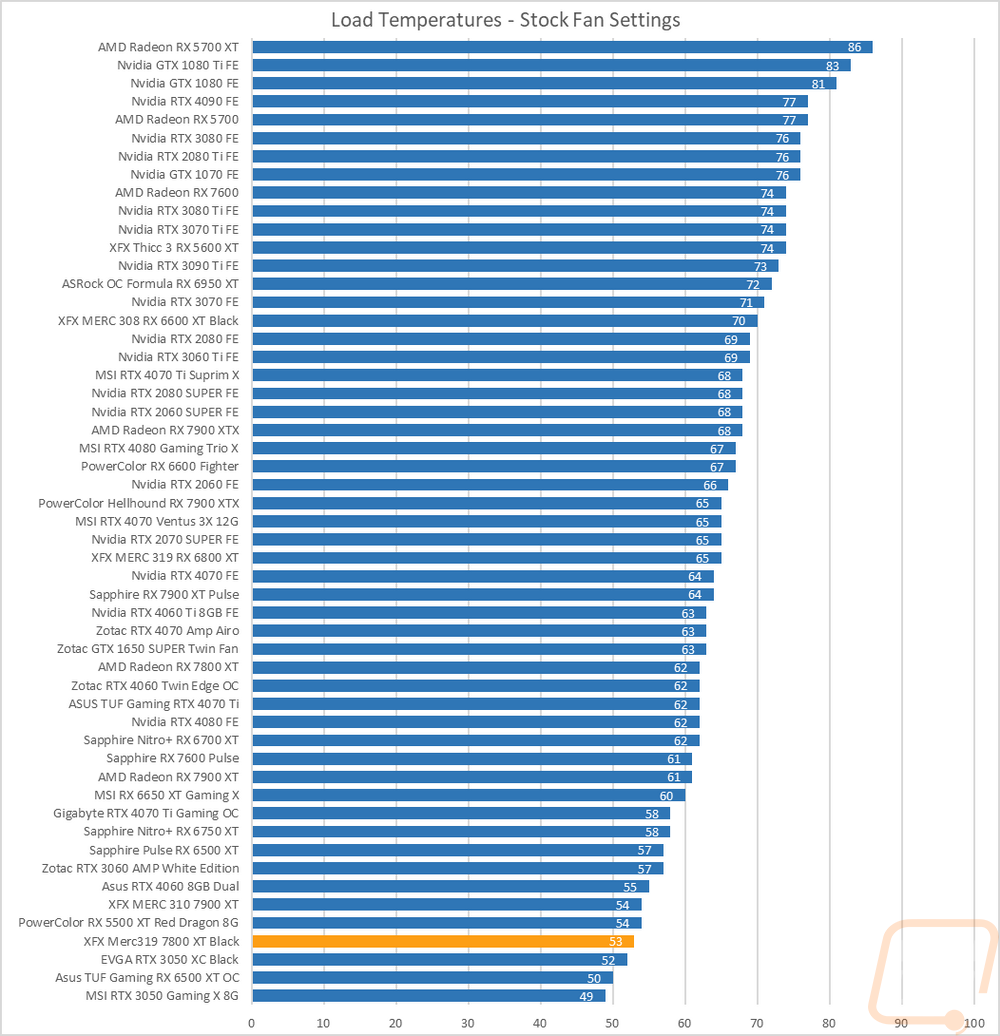
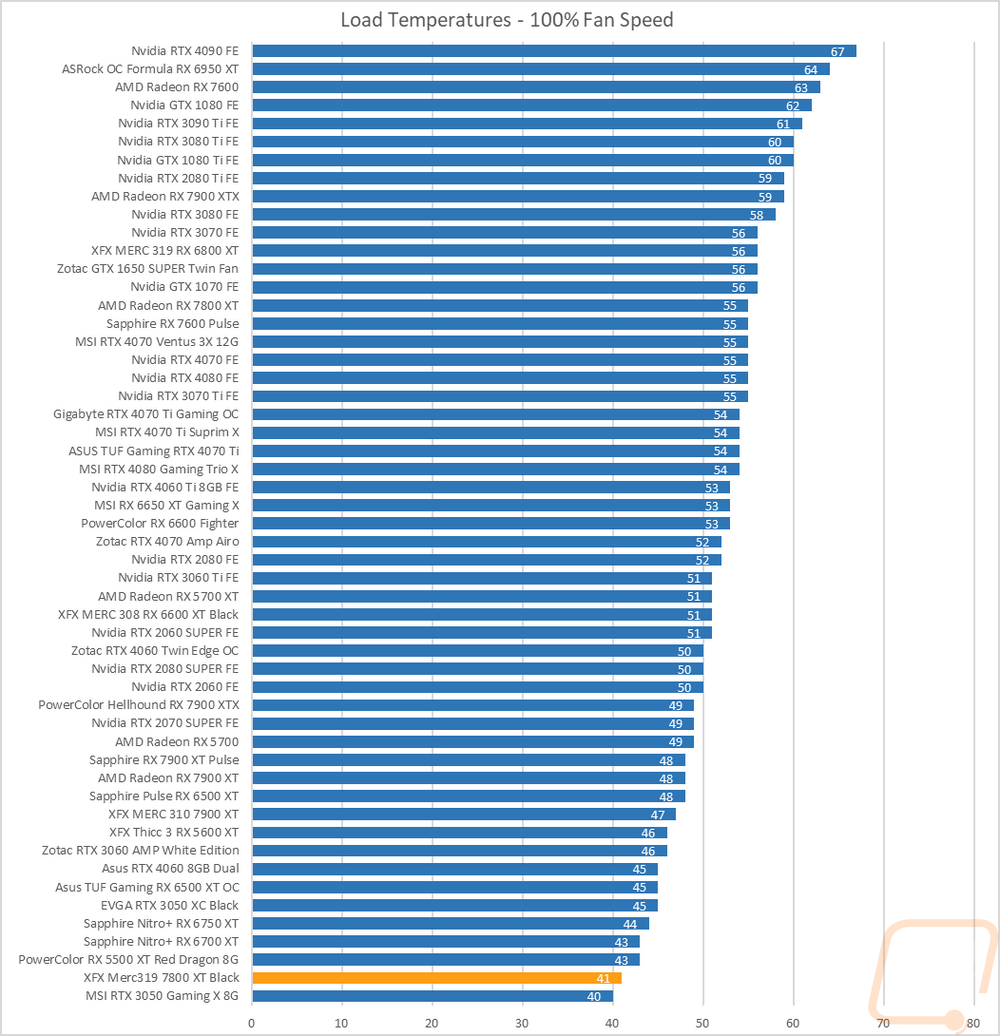
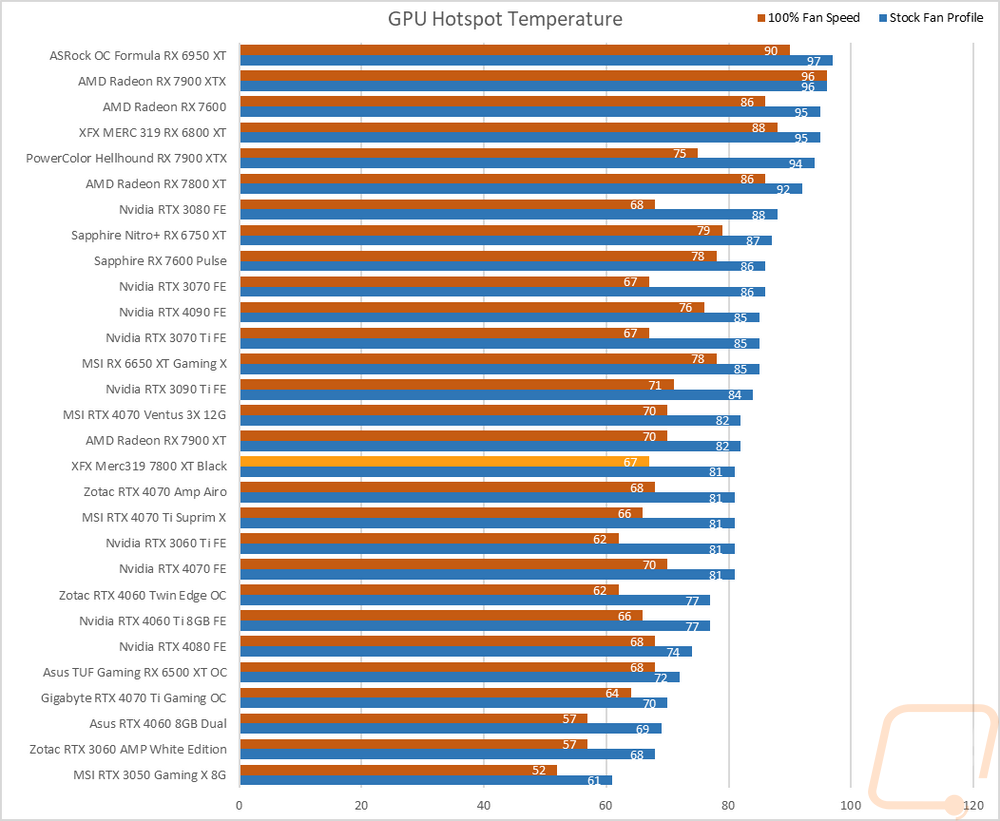
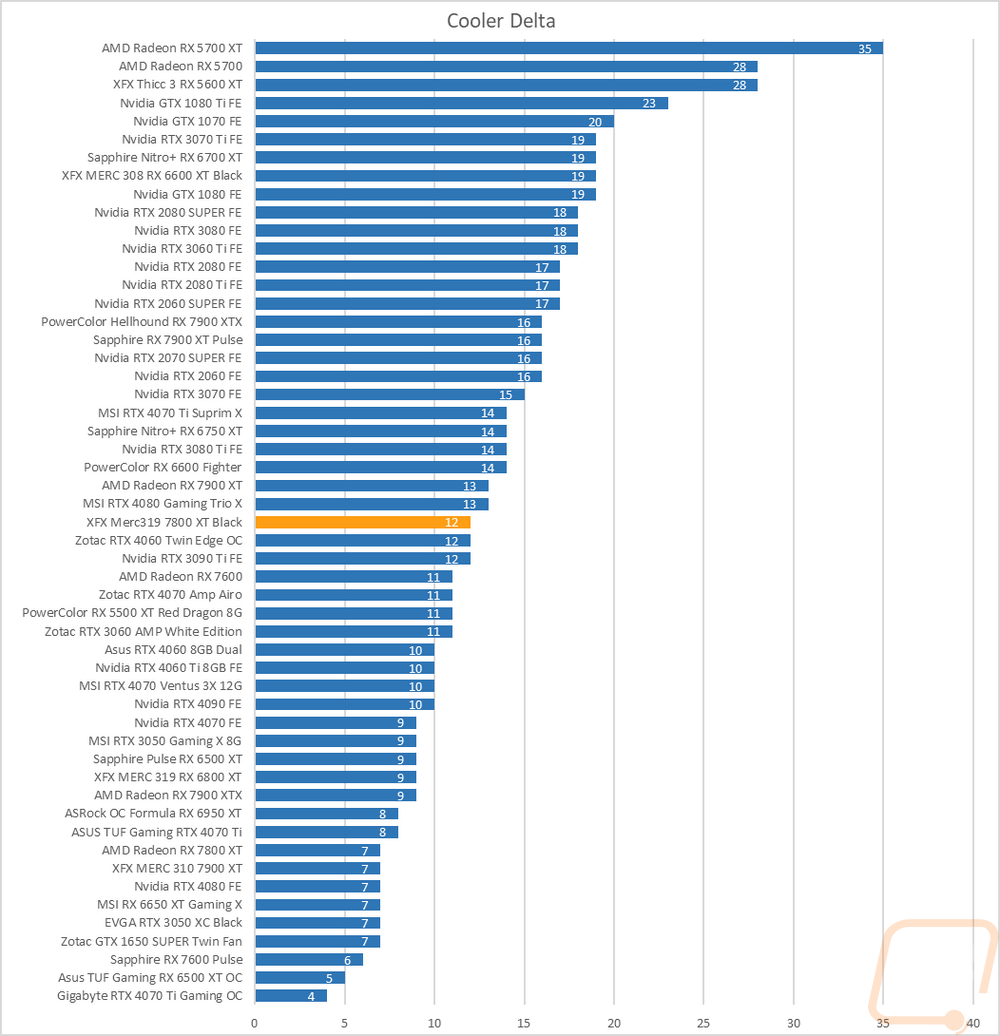
To finish up my testing I of course had to check out the cooling performance. To do this I ran two different tests. I used AIDA64’s Stress Test run for a half-hour each to warm things up. Then I documented what temperature the GPU leveled out at with the stock fan profile and then again with the fans cranked up to 100%. With the stock profile, the Merc 319 7800 XT Black came in at 53c putting it down in the bottom few cards on our charts. This was 9 degrees lower than the reference card while also being extremely quiet at the same time. Cranking up the fan speed to 100% dropped that number down to 41c and was even closer to the bottom of the chart. That was 14c lower than the reference 7800 XT. The Merc 319 7800 XT Black’s delta was 12c which is perfect and shows there is still plenty of room for cooling above the stock fan profile without leaving too much behind. As for GPU hotspot temps the Merc 319 7800 XT Black did a lot better than the reference card with 81c on the stock fan profile and 67c at 100% fan speed.
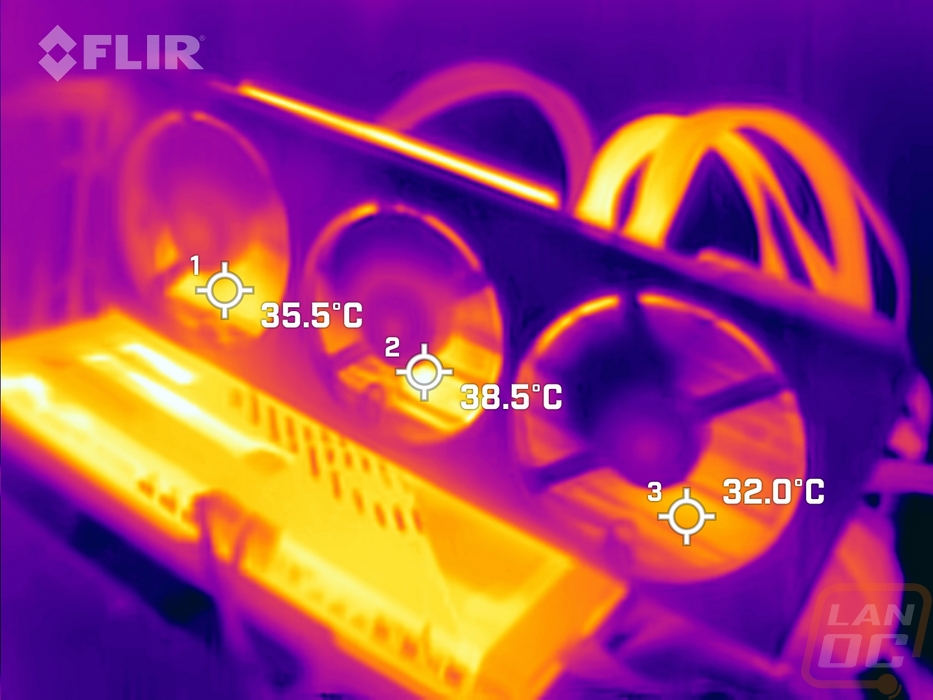
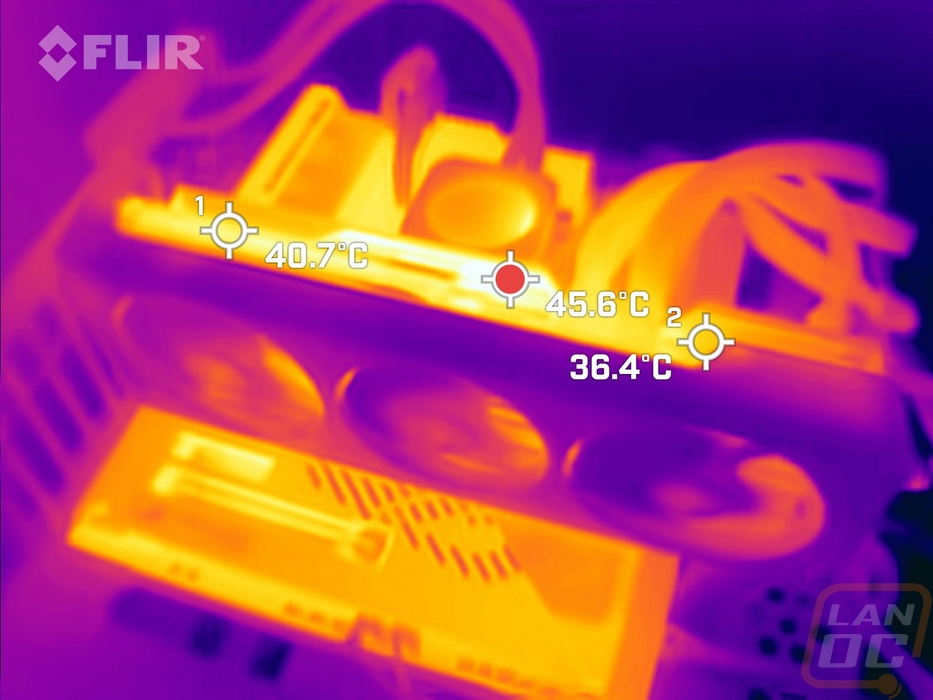
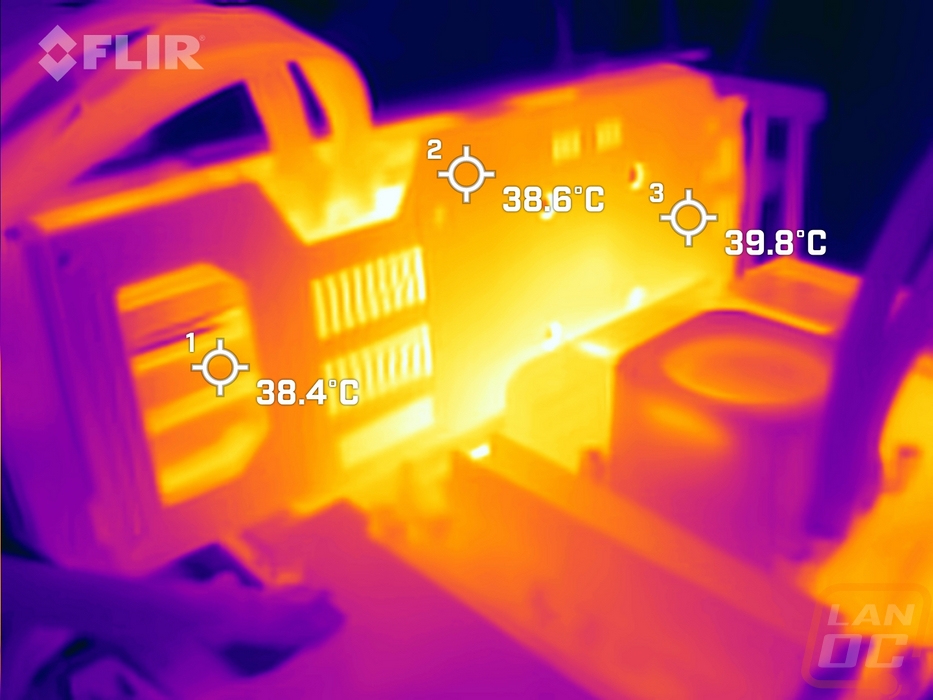
While running the stock fan profile testing I also took the time to get a few thermal images so we could see what is going on. The Merc 319 7800 XT Black was noticeably cooler than the reference card in its thermal images. The plastic fan shroud helps keep that from warming up as much but even through the fans we can see the heatsink is running cooler in its hottest spots. There is some heat being pushed out the bottom of the card, but the full coverage heatsink on the Asus Extreme board is tight up against the Merc 319 7800 XT Black so most of that heat is leaking out around the PCIe slots. The top edge of the Merc 319 7800 XT Black is its hottest area and that isn’t a surprise at all, this is where the card is designed to push its hot air out. Even then it is cooler than the reference card with the hotspot at 45.6c and it is cooler on the farther ends of the card. The backplate view shows the blow-through design and the warmest area here is in the slots or near the power cables where the PCB is visible. There is some heat transfer behind the GPU into the metal backplate but overall it isn’t too hot.