Performance
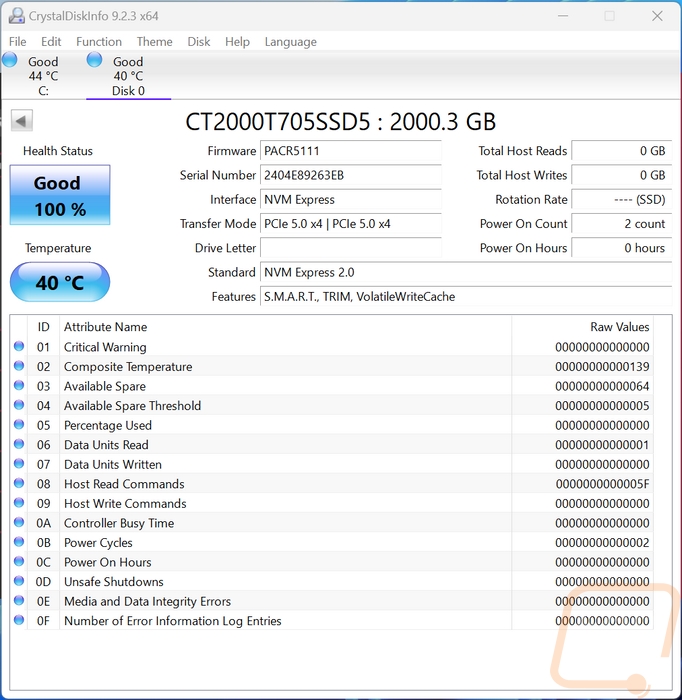
Before I jump into testing I did run CrystalDiscInfo on the Crucial T705. I just wanted to confirm that the drive was connected using the correct interface speed. This is especially important with a drive like this that is using a faster connection like PCIe 5.0 and the first time I ran it I wasn’t connected correctly. This also documents the firmware on the drive when I tested as well.
My first round of testing was to run the Crucial T705 through Crystal Disk Mark 8. Sequential testing is usually a best-case scenario and is what companies use for their specifications and on the front of the box to advertise drive speeds which in the case of the T705 Crucial is (for good reason) proud of the drives potential to reach 14500 MB/s for read speeds. The website specification for the write speeds are 12,600 MB/s. Did the T705 reach those speeds in Crystal Disk Mark 8? Well, it didn’t reach those numbers but was close with the read speed at 14121.78 MB/s. It’s crazy to think that being 378 MB/s off is close, that is faster than a hard drive but at these speeds, it is just 2.6% off from the peak. The write speed was similar with the T705 reaching 12274 MB/s, spot on for the same 2.6% below. The big news though is the gap between the T705 and the T700 with it jumping from 12399 MB/s read speed on the T700 up to 14121 MB/s on the T705 and for write speeds up from 11692 MB/s up to 12274 MB/s. A 13.8% improvement on the read speeds and 4.9% on the write speeds. This is also more than TWICE as fast as the fastest PCIe 4.0 drive tested and more than four times faster than the fastest PCIe 3.0 drive tested here.
|
PCIe 3.0 |
PCIe 4.0 |
PCIe 5.0 |
||
|
Crystal Disk Mark 8 - Read |
SEQ1M Q8T1 |
SEQ128K Q32T1 |
RND4K Q32T16 |
RND4K Q1T1 |
|
WD Blue SN550 1TB |
2444.53 |
2077.36 |
1075.88 |
57.88 |
|
Sabrent Rocket Q4 2TB |
4939.59 |
2871.47 |
1034.52 |
74.53 |
|
Corsair MP400 1TB |
3432.77 |
1889.56 |
713.28 |
61.42 |
|
Corsair Force MP600 2TB |
4828 |
1543.31 |
901.83 |
41.49 |
|
Sabrent Rocket 4.0 Plus 1TB |
6468.33 |
2712.53 |
455.24 |
54.68 |
|
Crucial P5 Plus 1TB |
6697.19 |
4358.63 |
1113.7 |
69.76 |
|
Kingston FURY Renegade 2TB |
6592.75 |
3093.11 |
1085.23 |
55.14 |
|
Patriot P400 1TB |
5036.9 |
3518.47 |
1059.71 |
88.06 |
|
WD Blue SN570 1TB |
3569.34 |
2681.32 |
1046.46 |
65.75 |
|
WD Black SN770 1TB |
5223.32 |
4958.17 |
1034.35 |
82.24 |
|
MSI Spatium M480 Play 2TB |
6979.03 |
4267.59 |
1315.25 |
81.22 |
|
Viper Gaming VPR400 |
5163.46 |
3880.75 |
1030.81 |
85.35 |
|
Crucial P3 Plus 2TB |
5041.44 |
2799.96 |
1107.97 |
56.56 |
|
Crucial P3 2TB |
3511.18 |
2379.76 |
957.63 |
45.42 |
|
Fantom Drives Venom8 2TB |
6989.96 |
4216.08 |
1086.16 |
79.59 |
|
Lexar Professional NM800 Pro 2TB |
7155.05 |
3479.95 |
781.64 |
84.56 |
|
Crucial T700 2TB |
12399.57 |
9265.64 |
826.54 |
98.49 |
|
Lexar NM710 1TB |
5101.53 |
4683.79 |
839.35 |
72.24 |
|
Crucial P5 Plus 1TB W/Heatsink |
6699.11 |
4267.73 |
826.71 |
68.33 |
|
Lexar NM790 2TB |
7188.21 |
5214.37 |
820.62 |
81.36 |
|
Crucial T705 2TB |
14121.78 |
9033.81 |
806.06 |
99.54 |
|
PCIe 3.0 |
PCIe 4.0 |
PCIe 5.0 |
||
|
Crystal Disk Mark 8 - Write |
SEQ1M Q8T1 |
SEQ128K Q32T1 |
RND4K Q32T16 |
RND4K Q1T1 |
|
WD Blue SN550 1TB |
2007.63 |
2006.4 |
776.4 |
290.25 |
|
Sabrent Rocket Q4 2TB |
3633.71 |
2568.7 |
920.84 |
385.73 |
|
Corsair MP400 1TB |
2021.09 |
2017.63 |
1196.42 |
262.36 |
|
Corsair Force MP600 2TB |
992.38 |
982.78 |
996.22 |
276.26 |
|
Sabrent Rocket 4.0 Plus 1TB |
5241.89 |
5225.25 |
921.51 |
402.26 |
|
Crucial P5 Plus 1TB |
5025.83 |
4880.38 |
884.12 |
240.78 |
|
Kingston FURY Renegade 2TB |
6899.76 |
5831.06 |
1083.12 |
367.6 |
|
Patriot P400 1TB |
4830.94 |
4813.27 |
846.34 |
307.12 |
|
WD Blue SN570 1TB |
3147.13 |
2893.72 |
909.47 |
234.17 |
|
WD Black SN770 1TB |
4983.07 |
4980.59 |
1149.36 |
295.13 |
|
MSI Spatium M480 Play 2TB |
6870.73 |
5863.14 |
1062.32 |
357.02 |
|
Viper Gaming VPR400 |
4780.82 |
4775.74 |
838 |
285.02 |
|
Crucial P3 Plus 2TB |
4388.26 |
4387.54 |
989.42 |
2967.35 |
|
Crucial P3 2TB |
3244.52 |
2712.72 |
630.77 |
261.09 |
|
Fantom Drives Venom8 2TB |
4132.6 |
5850.19 |
844.52 |
315.7 |
|
Lexar Professional NM800 Pro 2TB |
6629.2 |
5645.52 |
589.6 |
274.14 |
|
Crucial T700 2TB |
11692.96 |
9500.07 |
710.93 |
363.19 |
|
Lexar NM710 1TB |
4447.81 |
2640.5 |
686.8 |
283.91 |
|
Crucial P5 Plus 1TB W/Heatsink |
5041.15 |
4906.1 |
747.39 |
204.11 |
|
Lexar NM790 2TB |
6636.51 |
5415.95 |
685.5 |
291.28 |
|
Crucial T705 2TB |
12274.42 |
9815.68 |
590.09 |
348.95 |
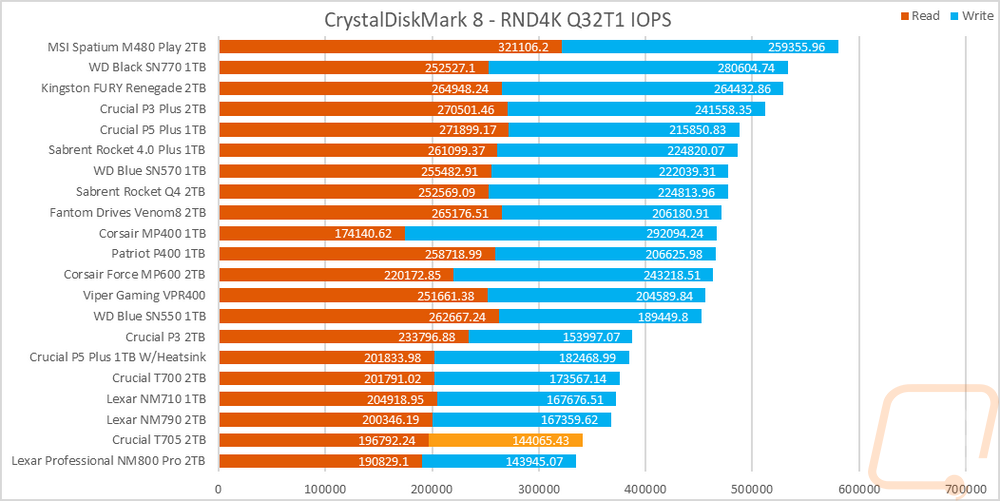
While testing in CrystalDiskMark 8 I did also check out the drive’s IOPS performance with the random 4k queue depth of 32 and 1 thread results. I stacked the read and write performance together here because I do believe that the overall drive performance is important, not just one result or the other. The Crucial T705, like with the T700, struggled in the IOPS results sitting down almost at the bottom of the chart in the combined results.
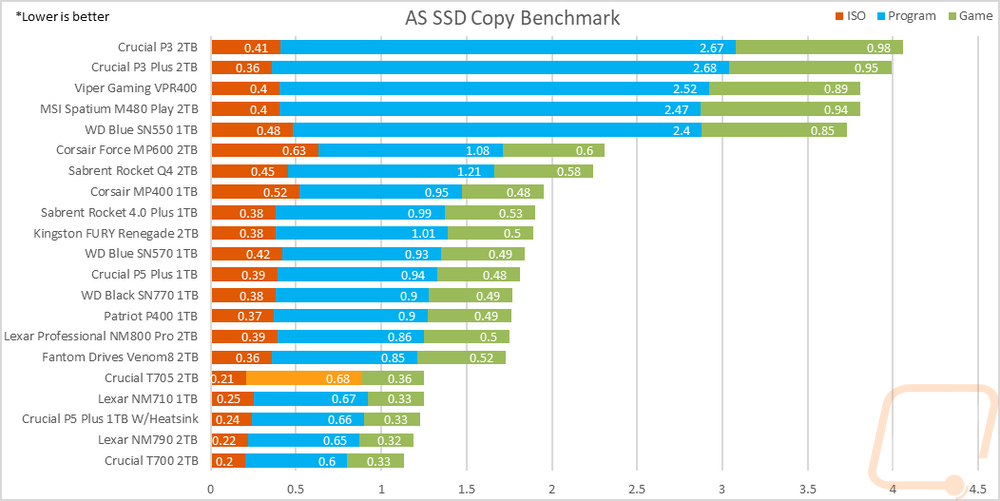
In AS SSD, I skipped over the standard test because it is very similar to the CrystalDiskMark tests I prefer to check out one of its sub-tests, the copy benchmark. This moves three files, one that is an ISO, one that is a program, and then a game, and times how long each takes. With these being timed, lower is better here. I have all three results stacked to see which drives are best overall. The Crucial T705 put down the fastest time with its ISO results, beating the 0.2 time from the T705 but its program and Game results were a little slower than the original T705 which pushed it up a few spots.
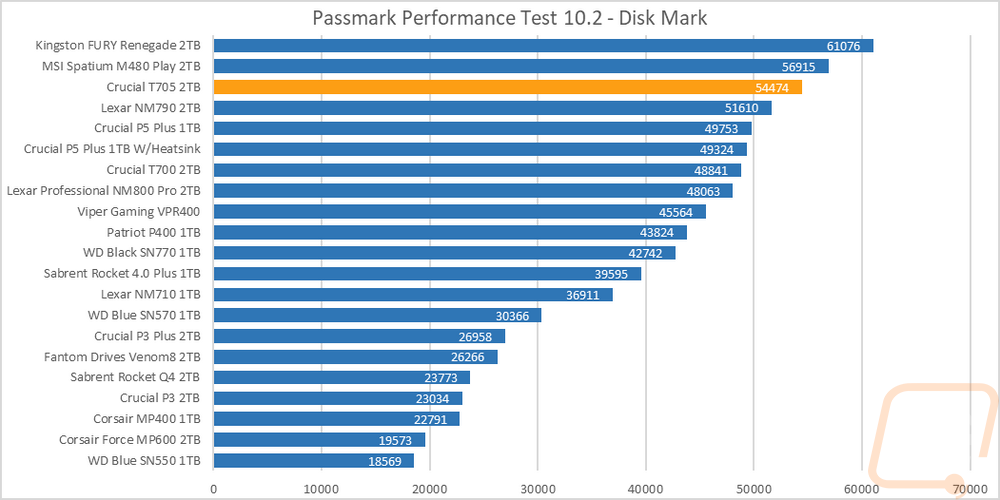
Next up with PassMark Performance Test 10, I ran their combined synthetic benchmark to get a look at their DiskMark rating. The Crucial T705 did well with its 54474 score but that wasn’t enough to top the charts here with a few older drives. With IOPS playing a big role in this score, even with the crazy sequential numbers of the T705 it wasn’t enough. The big takeaway here though is that Crucial did improve here compared to the T700 from 48841 up to 54474 which is huge.
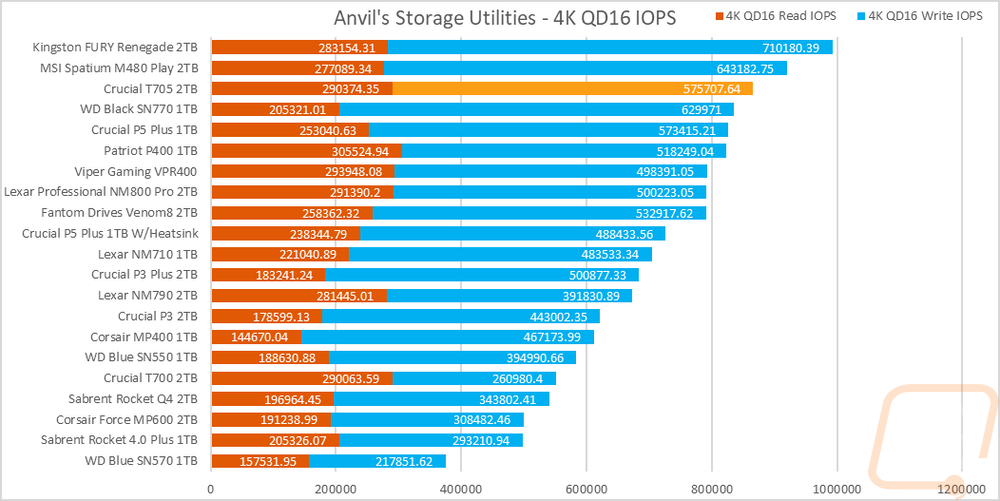
I then changed my focus back over to IOPS performance and ran the T705 in Anvil’s Storage Benchmark focusing on the 4k queue depth of 16 results from the main test. The Crucial T705 did better in this IOPS benchmark with its combined result up in the top few drives but the Renegade and the M480 Play were still out ahead because of their crazy write IOPS performance. This is another one where the T705 showed a HUGE jump from the T700 though which was down near the bottom of the chart, so while you might expect the T705 to be the fastest because of its sequential performance it is making big improvements in the other tests compared to the T700.
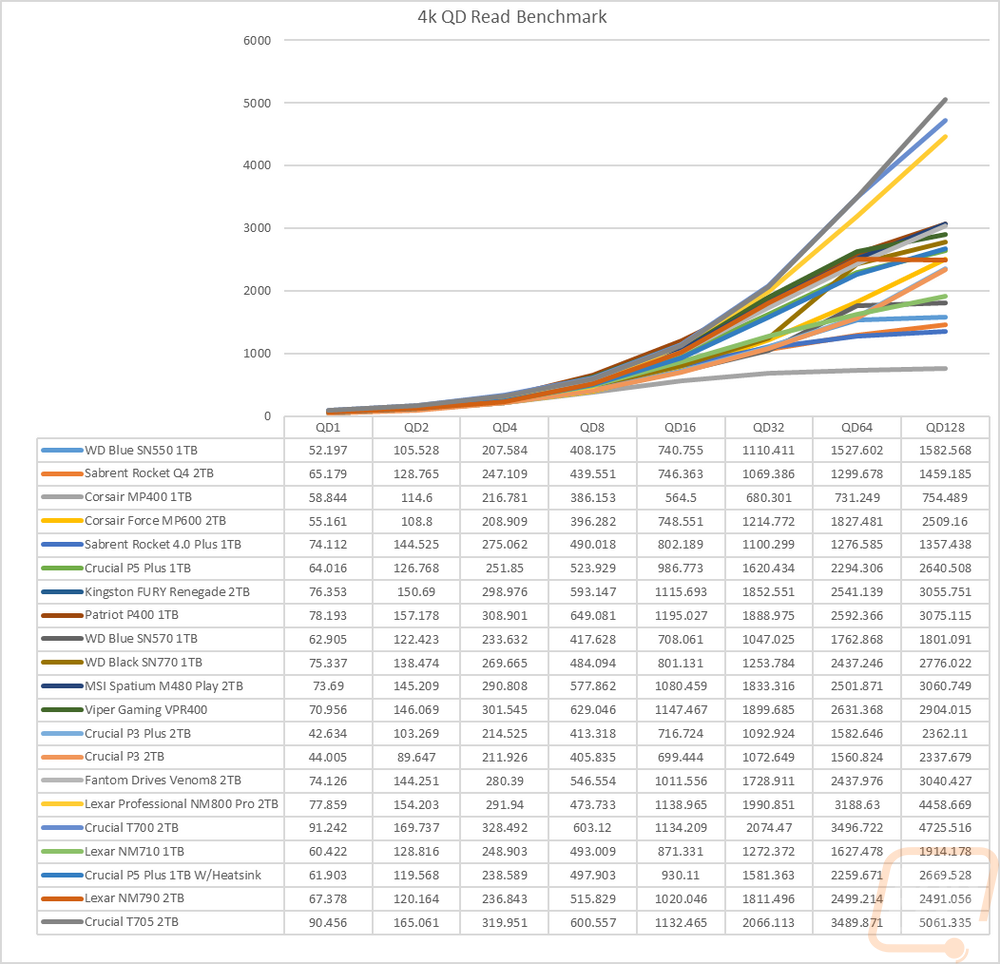
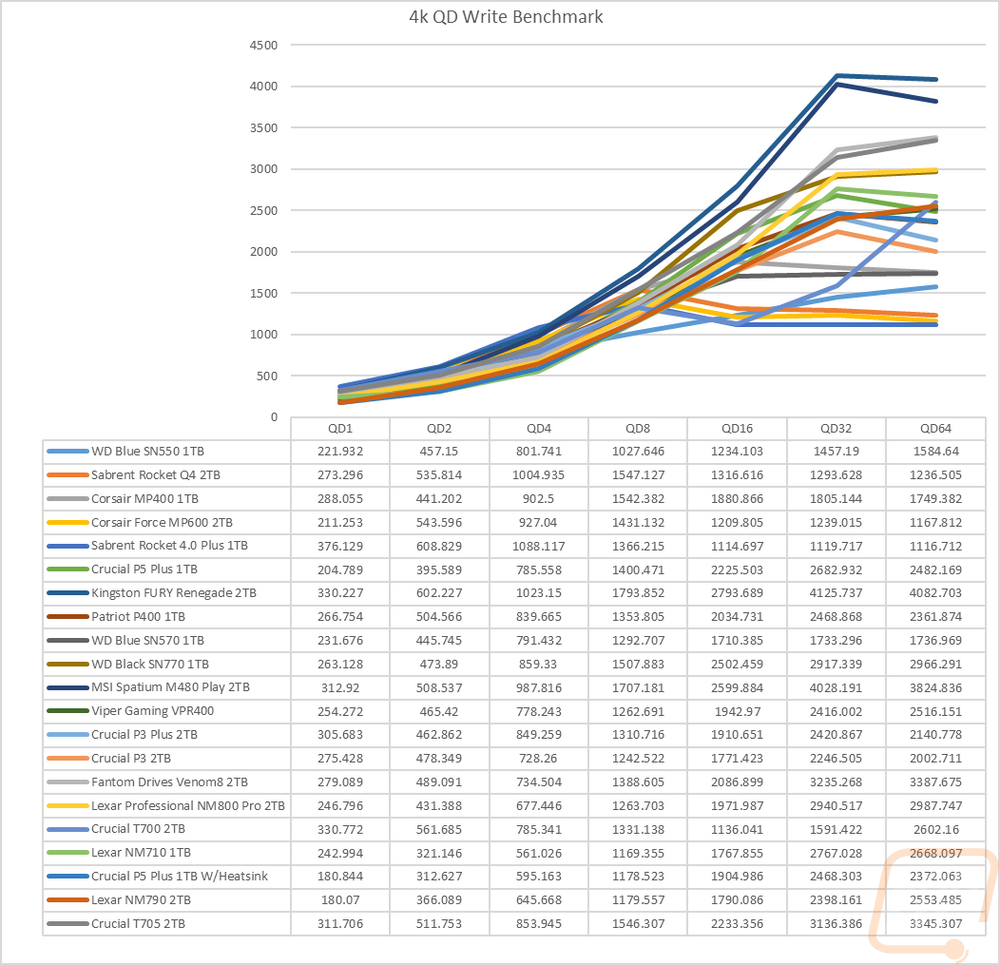
Sticking with Anvil’s Storage Utilities I did a few more tests. Here I wanted to check out how the drive would react to different queue depths so with the file size set to 4K I ran tests ramping up double each time starting at 1 and up to 128 for reads and 64 for writes. This lets us see if the controller gets overloaded. For the read, queue depth tests the Crucial T705 starts off as the second fastest drive at a queue depth of 1 with the original T700 being just a hair faster. The T705 ramps up quickly but doesn’t pass the T700 until the last result topping the chart. For the write test, it started behind the T700 again and stayed behind it until a queue depth of 4 but took off compared to the T700 at a queue depth of 8 and above but the T705 was still behind the M480 Play and Renegade again here.
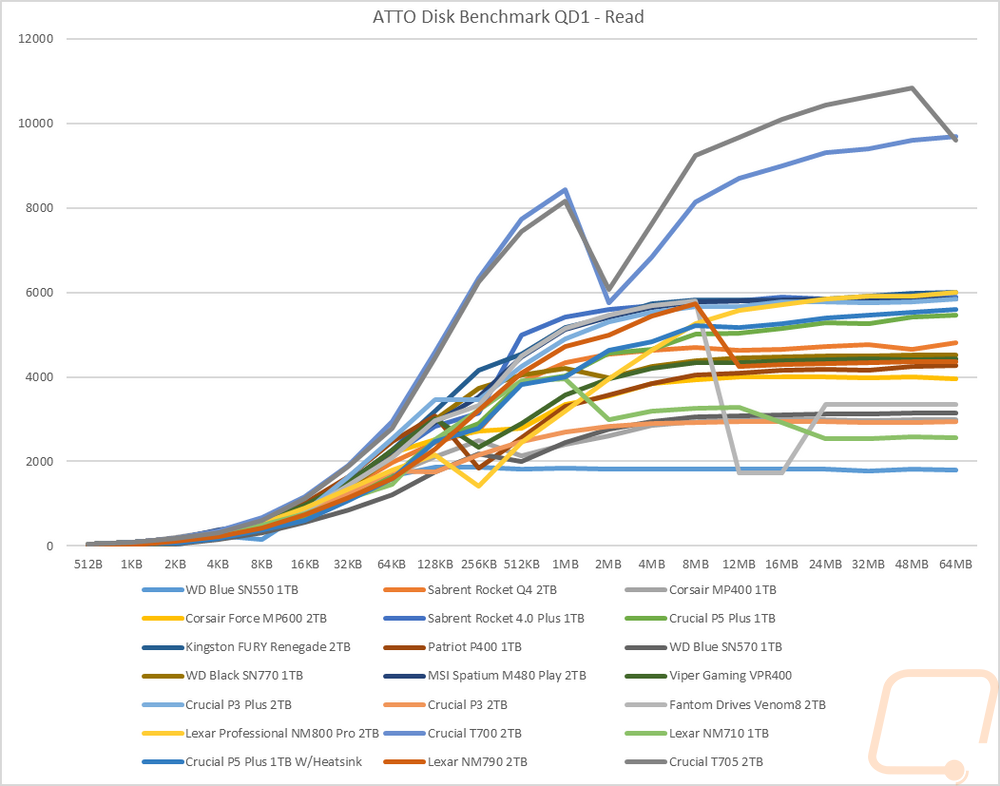
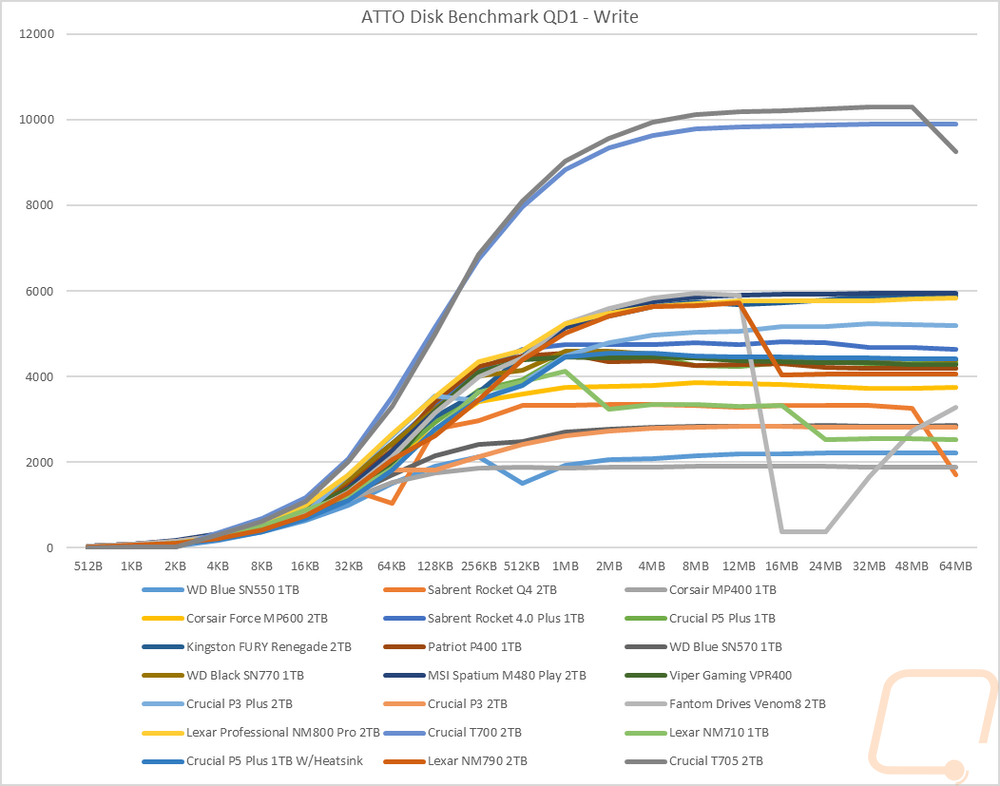
For ATTO Benchmark I set it to a queue depth of just 1 but ramped up the file size slowly to see how it would affect performance. For the read test in ATTO, the Crucial T705 and the T700 can be clearly seen with both drives taking off up ahead of anything else tested. The T705 does still drop in performance at the 1MB mark just like the T700 and the T705 was slightly behind the T700 for the two results before that. But the T705 has improved on the response after that with it rebounding quicker and being significantly faster than the T700 up until the 64 MB result where the T705 dropped back down with the T700. The write results were similar with the two Crucial T series drives in a completely different class than the rest of the drives tested. The T705 does gain a little on the T700 starting at 512 KB and above except for the last result where the T705 drops down below the T700.
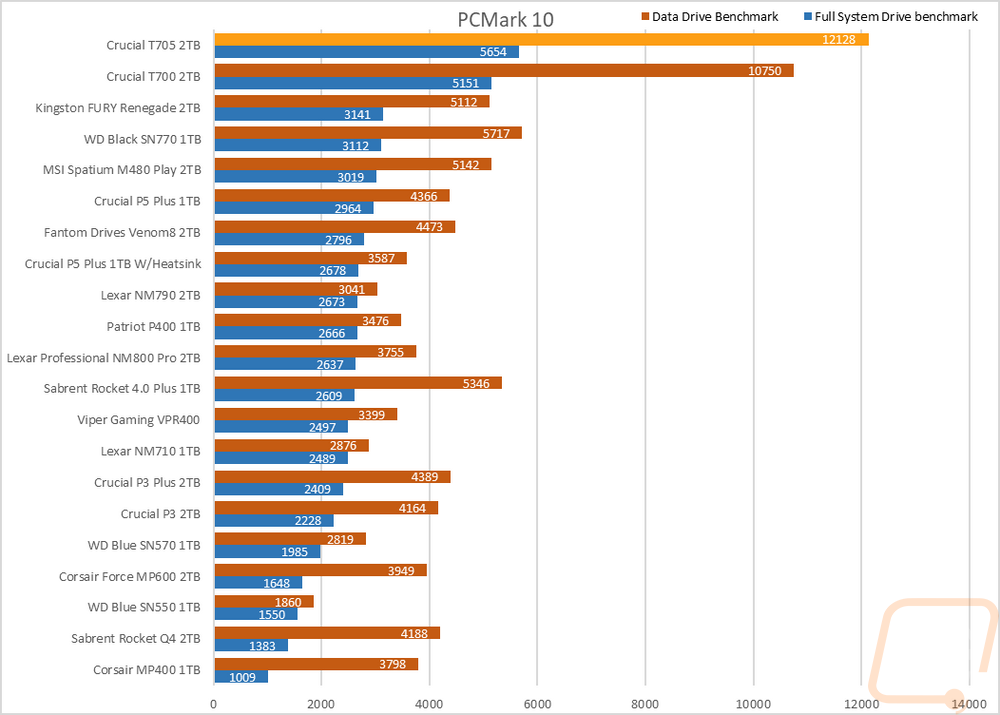
Next up I wanted to look at more real-world performance and for this, I started with PCMark 10 which has an overall full system benchmark for storage, and then one focused on data storage drives. In the full system drive benchmark, the Crucial T705 scored a 5654 which was an improvement over the T700’s 5151 score by 9.7%. Then for the data drive benchmark test, it is an even bigger margin with the T705 scoring 12128 to the 10750 of the T700 for an improvement of 12.8%. This test shows just how far ahead of the PCIe 4.0 and 3.0 drives both drives are though with them doubling the score on both tests compared to most of the drives.
For more real-world resting, I did our file transfer tests. You don’t get any more real-world than this. For each drive, I copied the folder filled with files to the drive tested documenting what its transfer rate is near the end of the transfer. I used three file types, movies which are large single files, a folder filled with RAW and JPG photos, and then a folder filled with Word documents. Starting with the movie files the Crucial T705 transferred the folder at 3920 MB/s. This is far from the crazy sequential numbers of course but is way out in front of any of the other drives including the T700. The photos were similar and weren’t too far off from the movie results at 3460 MB/s. Then for the documents which because of their small size slam any drive, the T705 still did well at 45.7 MB/s.
|
Windows 11 File Transfers |
Movies |
Pictures |
Documents |
|
WD Blue SN550 1TB |
852 |
937 |
2.42 |
|
Sabrent Rocket Q4 2TB |
2720 |
1140 |
5.75 |
|
Corsair MP400 1TB |
2140 |
996 |
2.57 |
|
Corsair Force MP600 2TB |
1250 |
816 |
2.83 |
|
Sabrent Rocket 4.0 Plus 1TB |
2120 |
254 |
1.63 |
|
Crucial P5 Plus 1TB |
2060 |
1030 |
5.2 |
|
Kingston FURY Renegade 2TB |
2330 |
857 |
2.58 |
|
Patriot P400 1TB |
2070 |
981 |
2.86 |
|
WD Blue SN570 1TB |
602 |
992 |
5.14 |
|
WD Black SN770 1TB |
2260 |
605 |
2.52 |
|
MSI Spatium M480 Play 2TB |
1930 |
905 |
5.62 |
|
Viper Gaming VPR400 |
2360 |
1300 |
2.61 |
|
Crucial P3 Plus 2TB |
2240 |
1080 |
6.92 |
|
Crucial P3 2TB |
1990 |
1100 |
6.46 |
|
Fantom Drives Venom8 2TB |
1750 |
1190 |
4.45 |
|
Lexar Professional NM800 Pro 2TB |
2230 |
879 |
4.39 |
|
Crucial T700 2TB |
2540 |
1520 |
4.57 |
|
Lexar NM710 1TB |
2610 |
1630 |
18.4 |
|
Crucial P5 Plus 1TB W/Heatsink |
2580 |
1570 |
17.4 |
|
Lexar NM790 2TB |
2560 |
1570 |
17.5 |
|
Crucial T705 2TB |
3920 |
3460 |
45.7 |
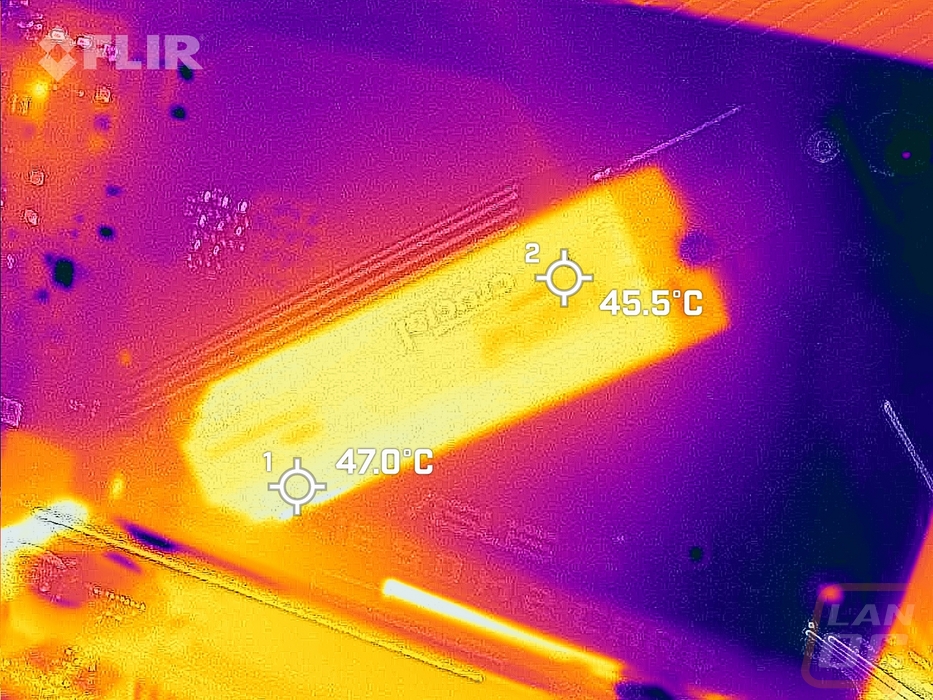
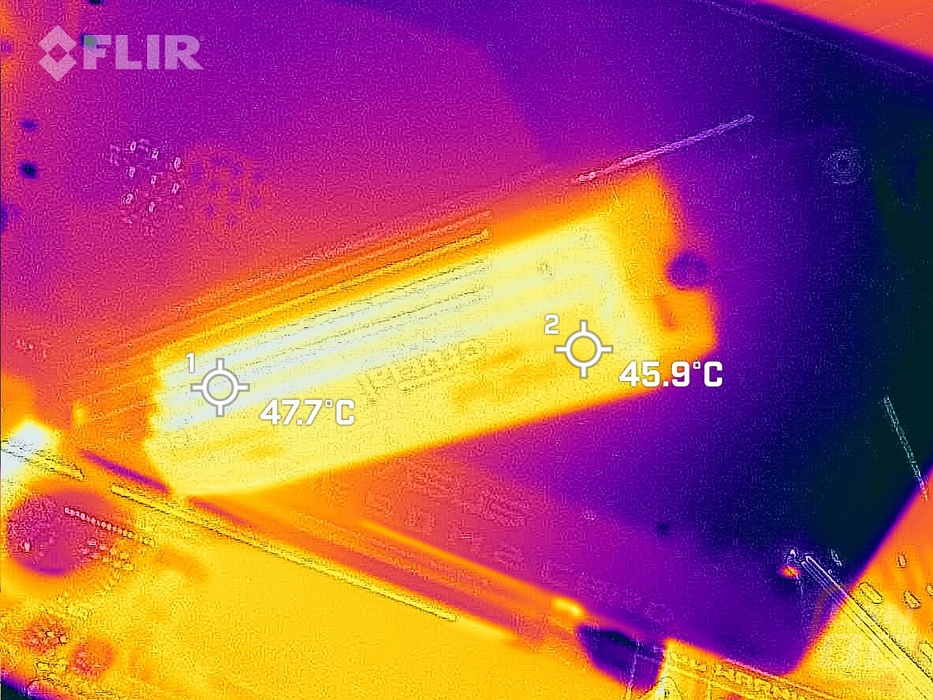
Before finishing up my testing I did run AIDA64’s drive benchmark with the linear read test for a half hour to heat things up and got a look at the Crucial T705 through the thermal camera. This is the heatsinked model, so it does a good job of spreading the heat out across the drive. So we don’t see the normal hotspot for the controller here. That said there was a little more heat on the M.2 c to the on the far end of the drive. connection end which is where the controller is with it at 4