In-Game Benchmarks
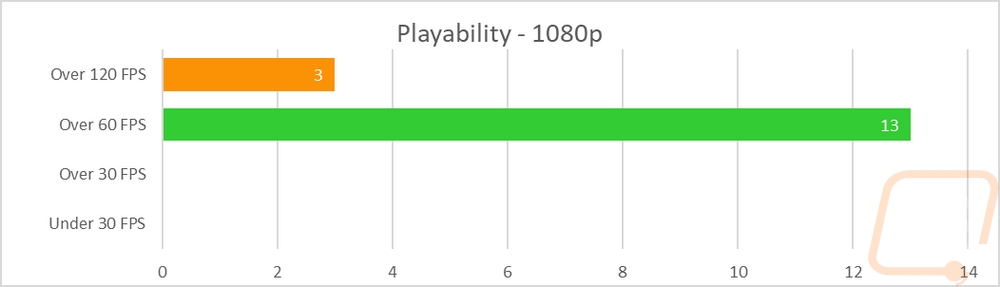
Now we finally get into the in game performance and that is the main reason people pick up a new video card. To test things out I ran through our new benchmark suite that tests 11 games at three different resolutions (1080p, 1440p, and 4k). I also slipped in a few variations on the same games for comparisons like DX11 to DX12, OpenGL to Vulkan, and a couple of games are just tested at their highest setting and lower but still high detail options to show the performance difference when things are turned down slightly. In total, each video card is tested 51 times and that makes for a huge mess of graphs when you put them all together. To help with that I like to start off with these overall playability graphs that take all of the results and give an easier to read the result. I have one for each of the three resolutions and each is broken up into four FPS ranges. Under 30 FPS is considered unplayable, over 30 is playable but not ideal, over 60 is the sweet spot, and then over 120 FPS is for high refresh rate monitors. This covers all of the games tested except Final Fantasy XV that we have a score rather than an FPS because they like to be different.
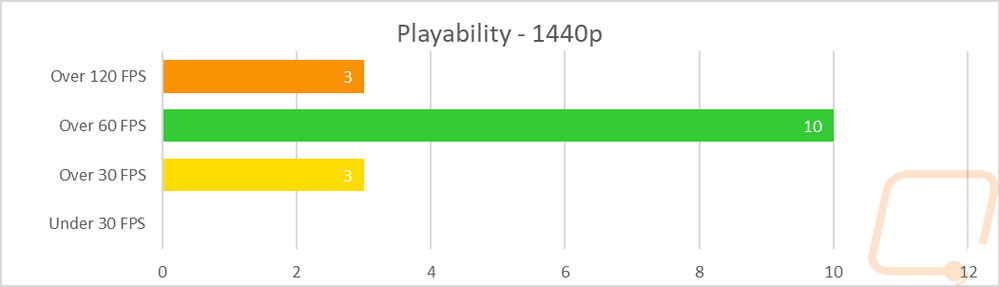
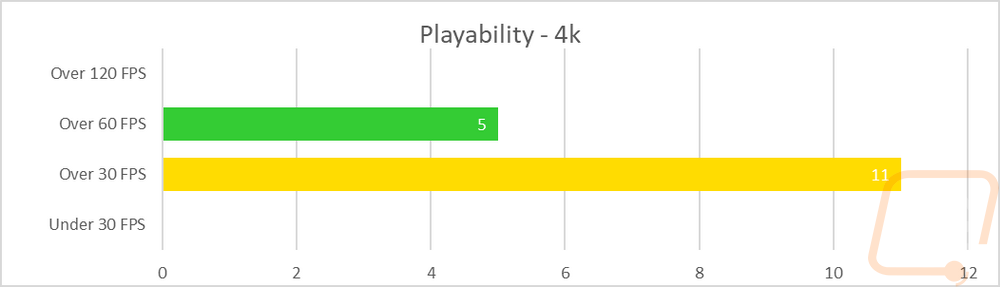
So how did the new RTX 2070 Founders Edition perform? Well at 1080p the RTX 2070 Founders Edition had everything above 60. Three games came in up above 120 FPS and while the graph doesn’t show it a lot of the results were closer to the 100 FPS. 1440p had the same three in the 120+ range, 10 above 60 FPS and 3 below 60 FPS but above 30. Then at 4k, a majority were in the 30-60 range with 5 above 60 FPS. Overall this means that the RTX 2070’s sweet spot seems to be at 1440p with 4k being playable but not always idea at highest settings and at 1080p it seems to be overkill but yet still not powerful enough to push the newest games with their settings turned up at high refresh rates.
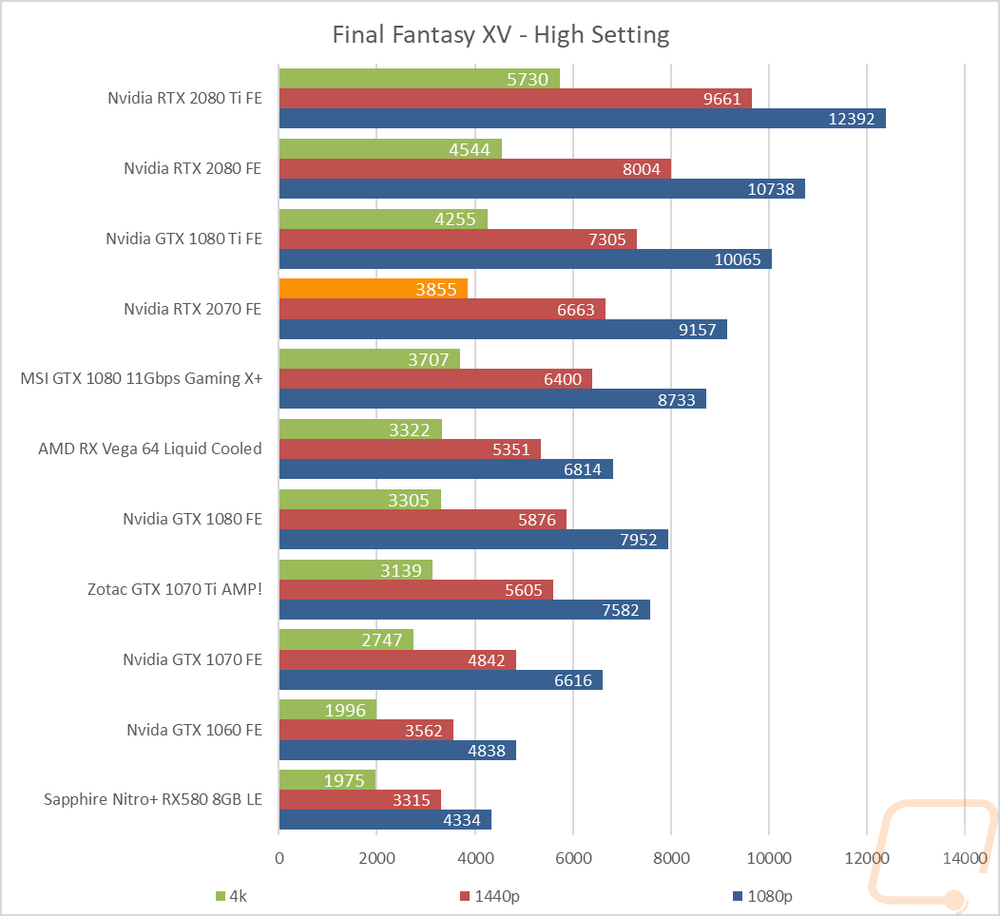
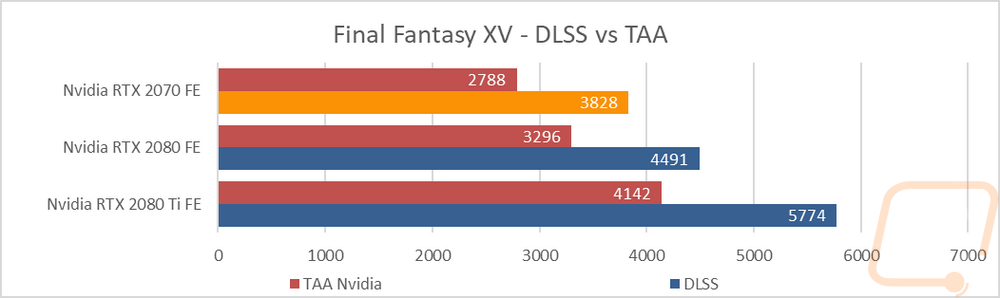
For Final Fantasy XV I tested with our normal benchmark that tests using FFXV benchmark at high setting at 1080p, 1440p, and 4k. Then I tested again using the Nvidia provided test. The normal testing shows the RTX 2070 above the GTX 1080 overclocked card in all three resolutions but still a little behind the 1080 Ti. Now the Nvidia provided test is completely different. It is also run at 4k but what this test shows is the potential performance of DLSS vs TAA. DLSS is Nvidia’s way of taking advantage of the new Tensor Cores. I’m told the test is set up to compare the same detail levels, but being completely setup by Nvidia I have no way of confirming that other than saying visually they did look the same. You can see how the RTX 2070 running DLSS gets a significantly higher score. That said I am curious how their custom settings compare to the default high setting that all three RTX cards DLSS results were similar to the high at 4k results.
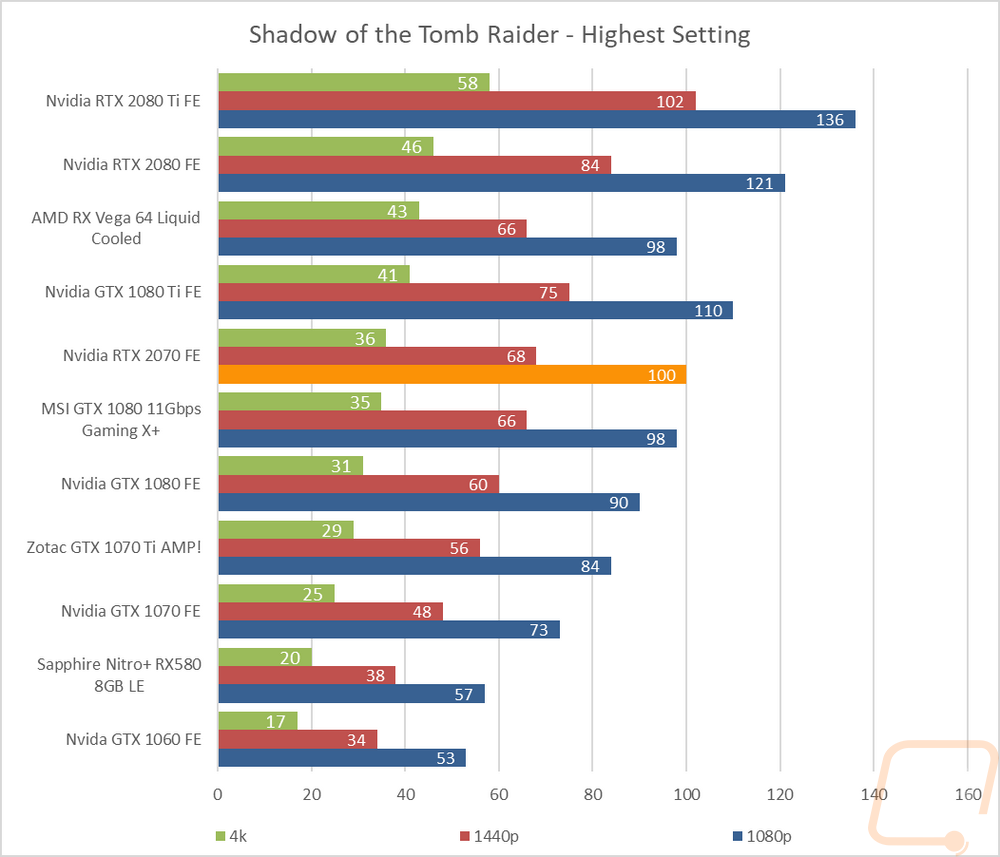
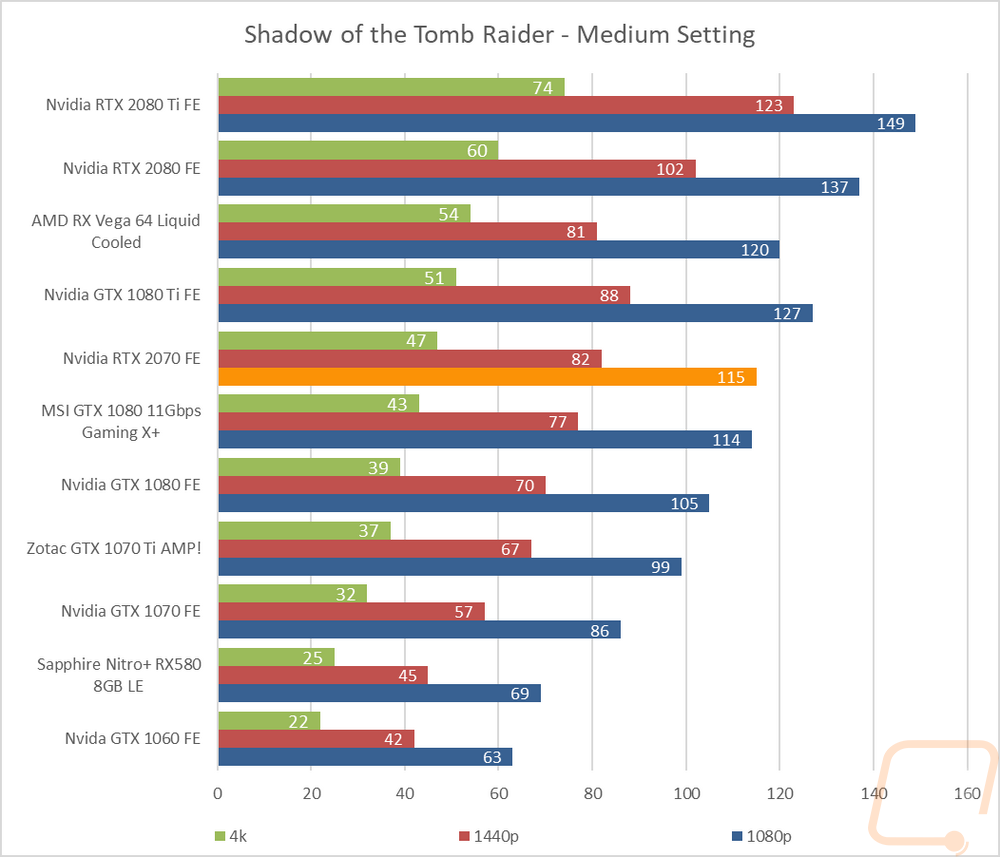
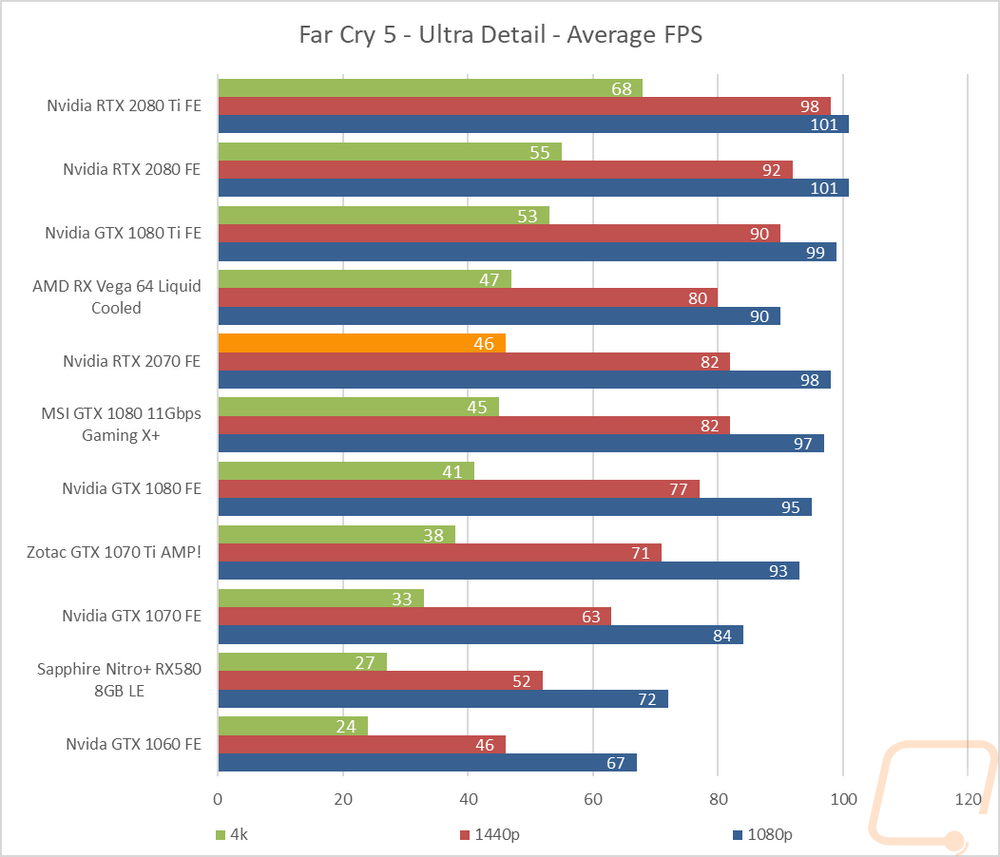
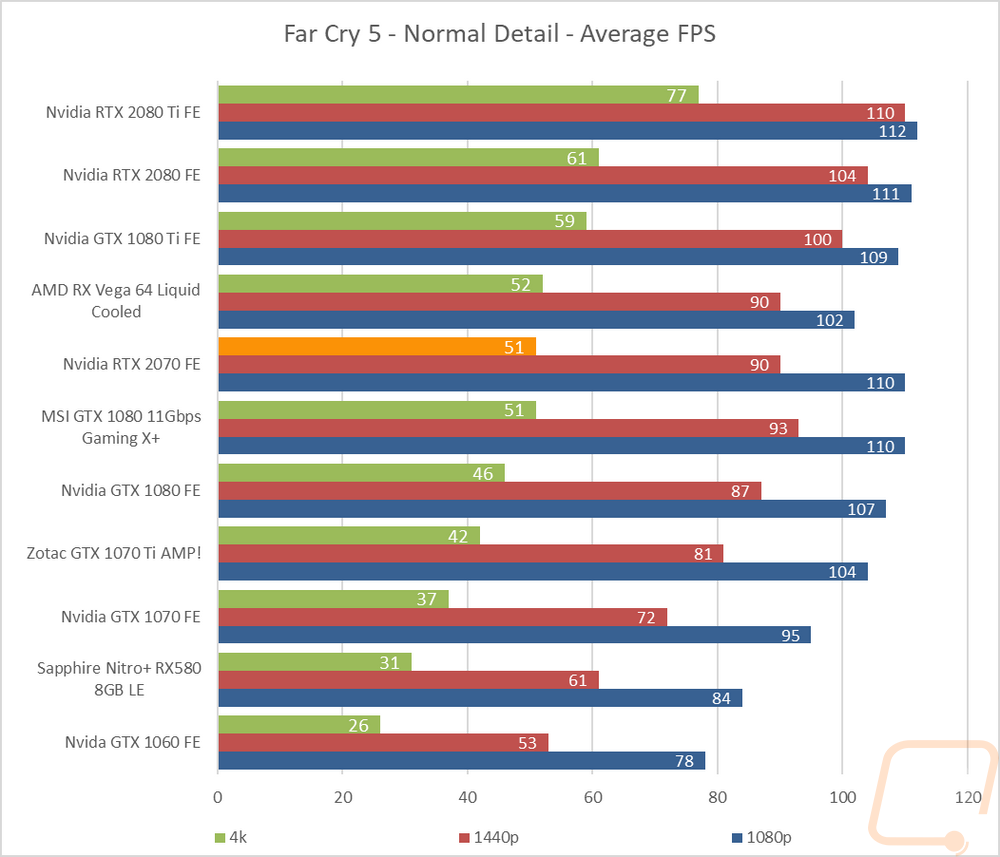
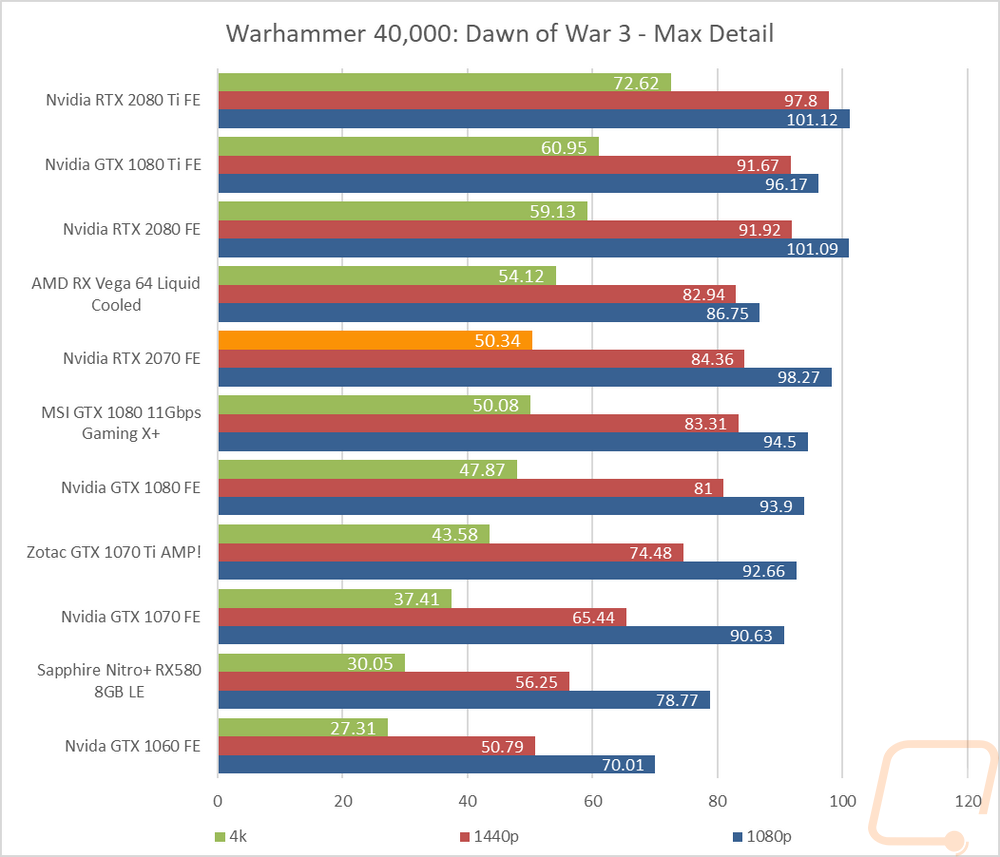
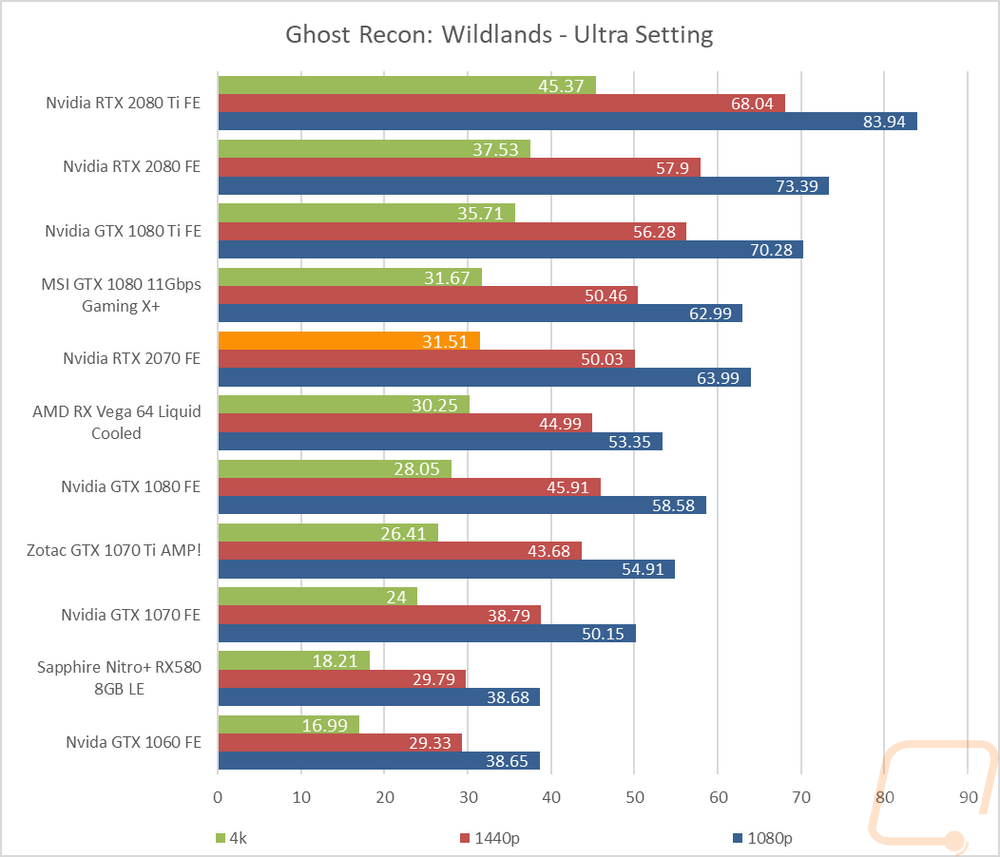
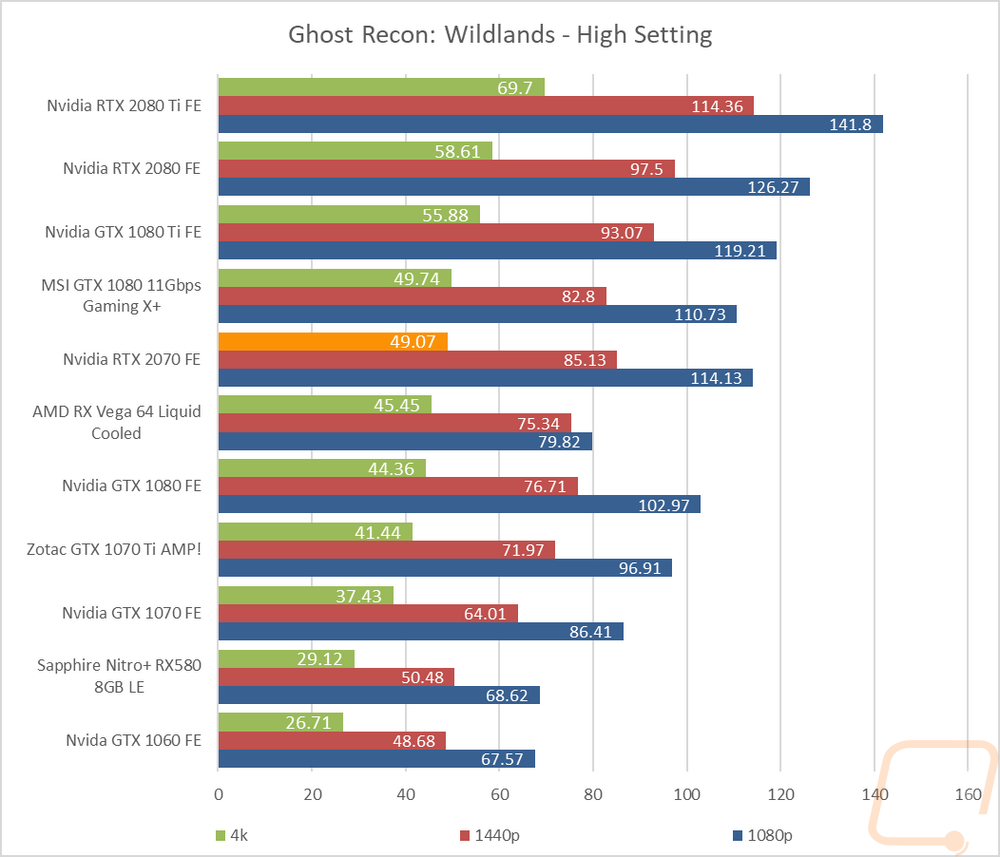
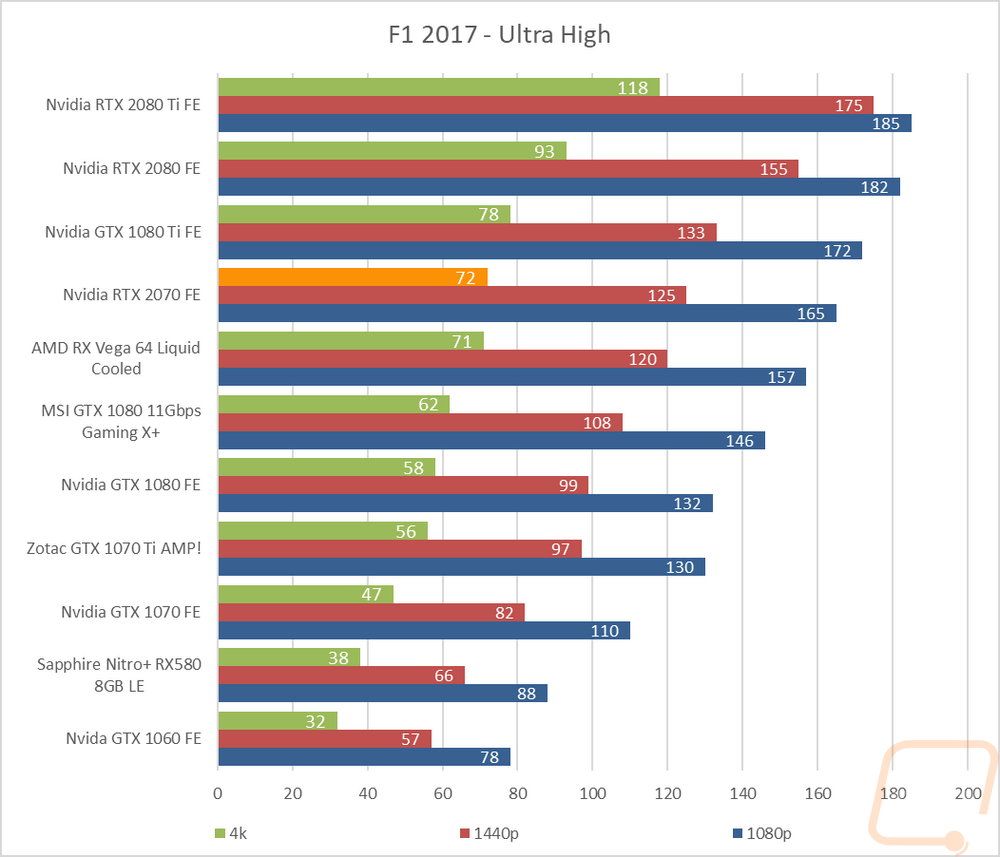
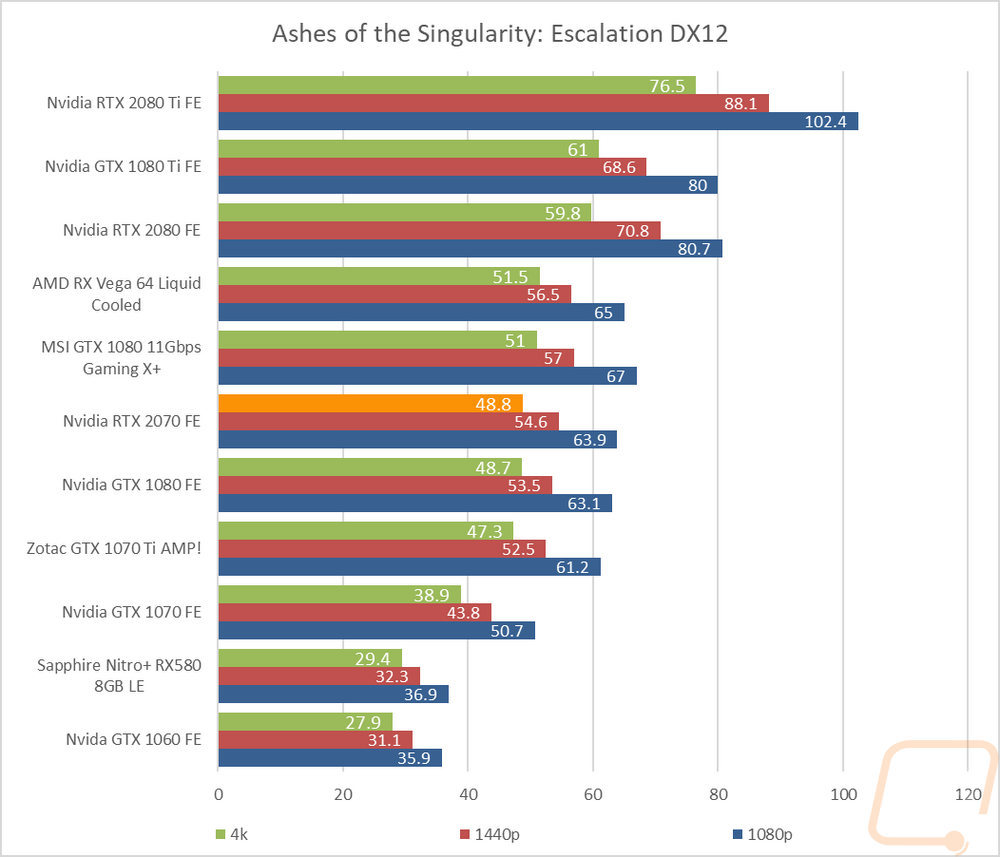
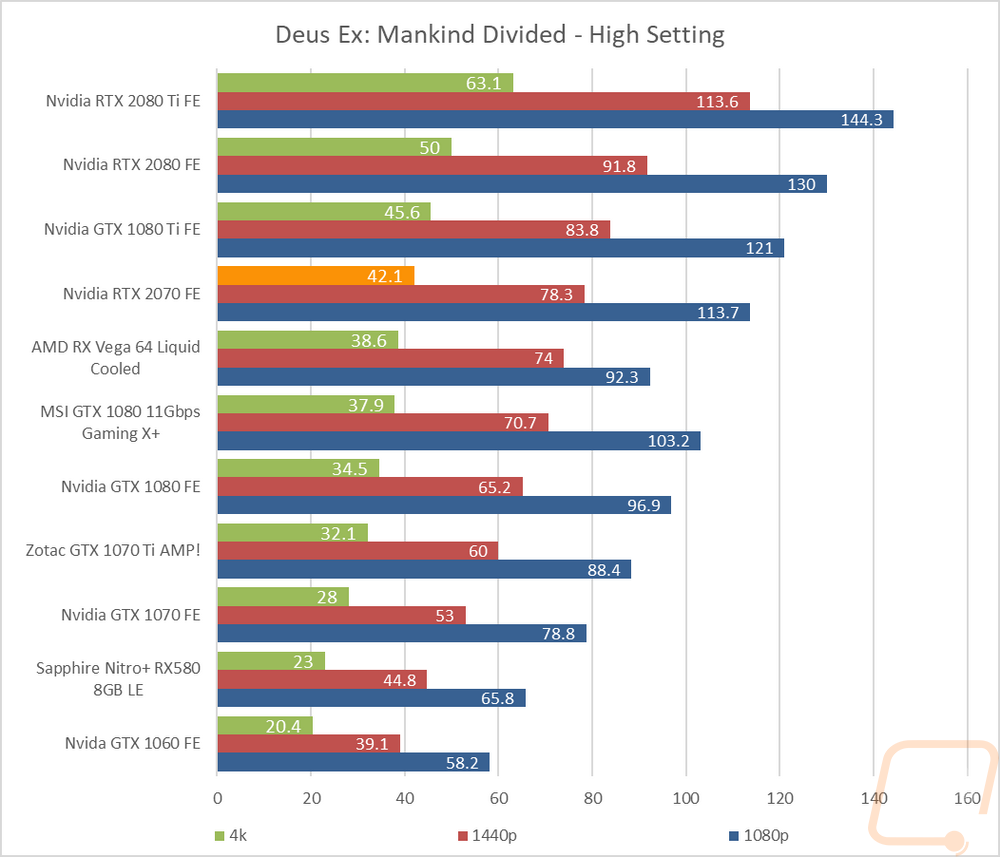
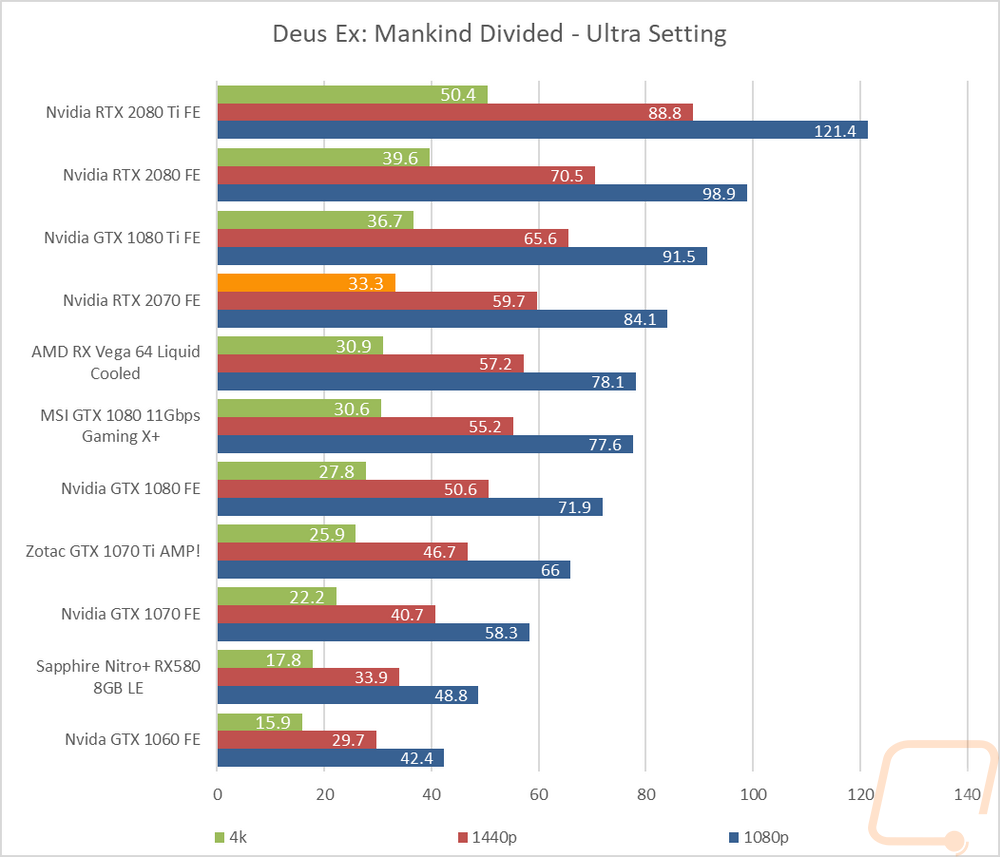
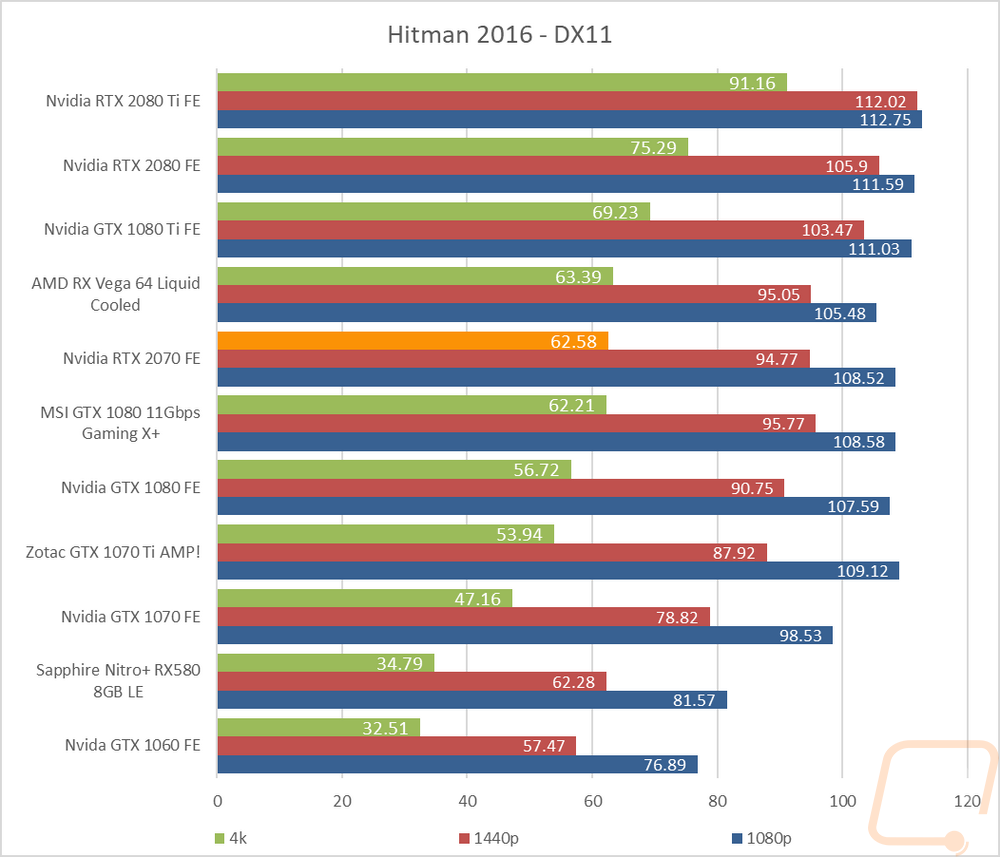
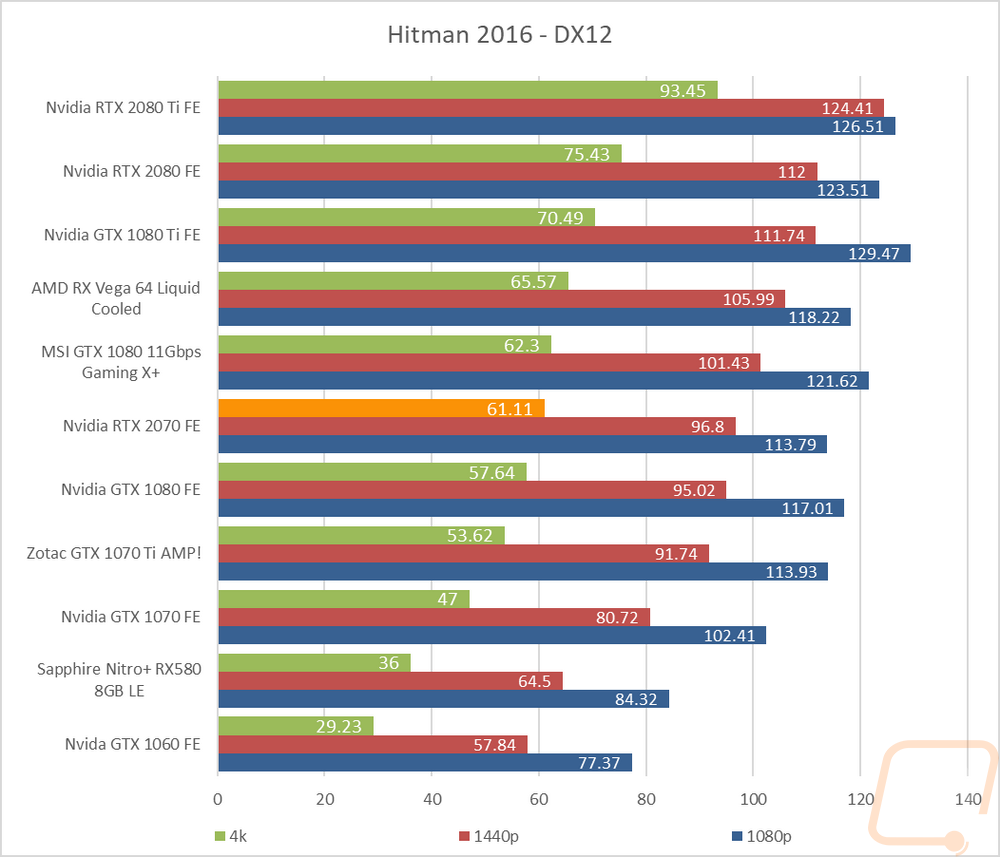
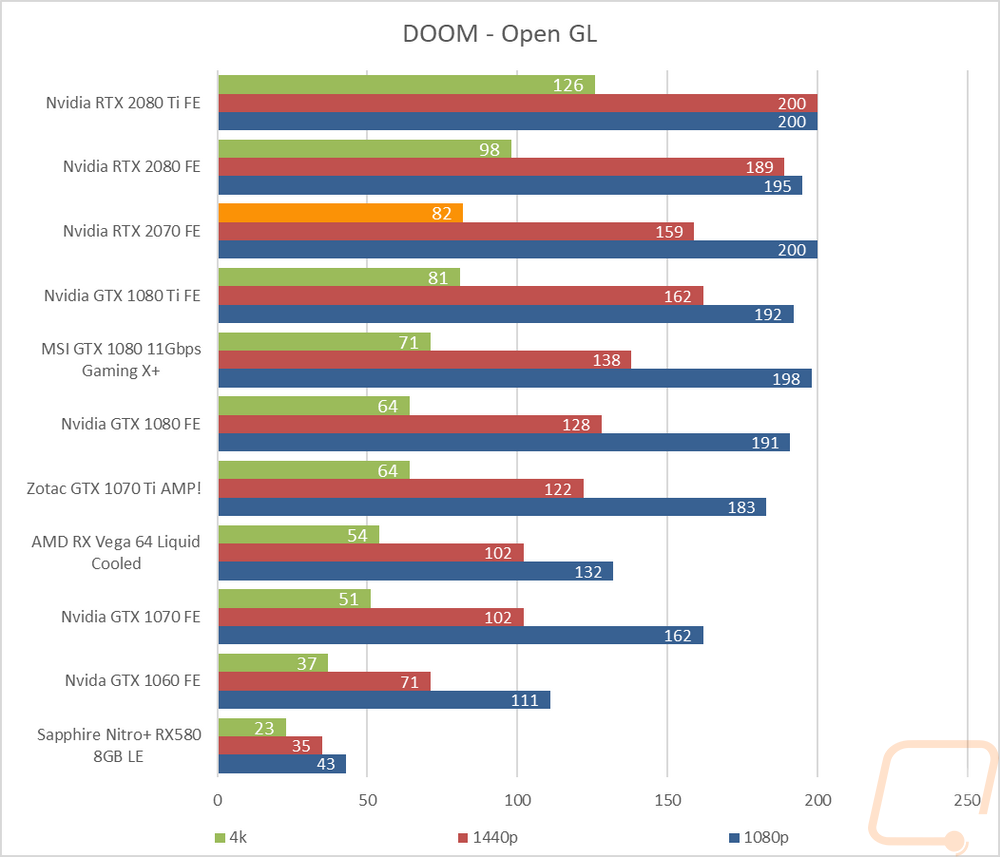
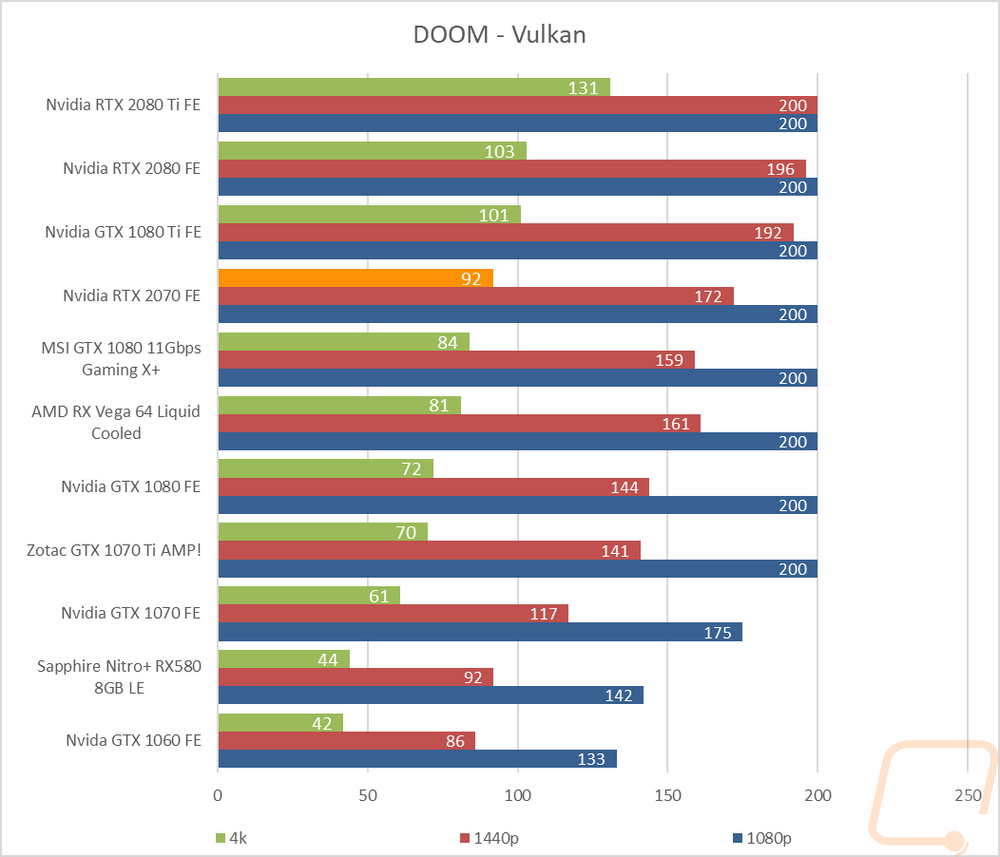
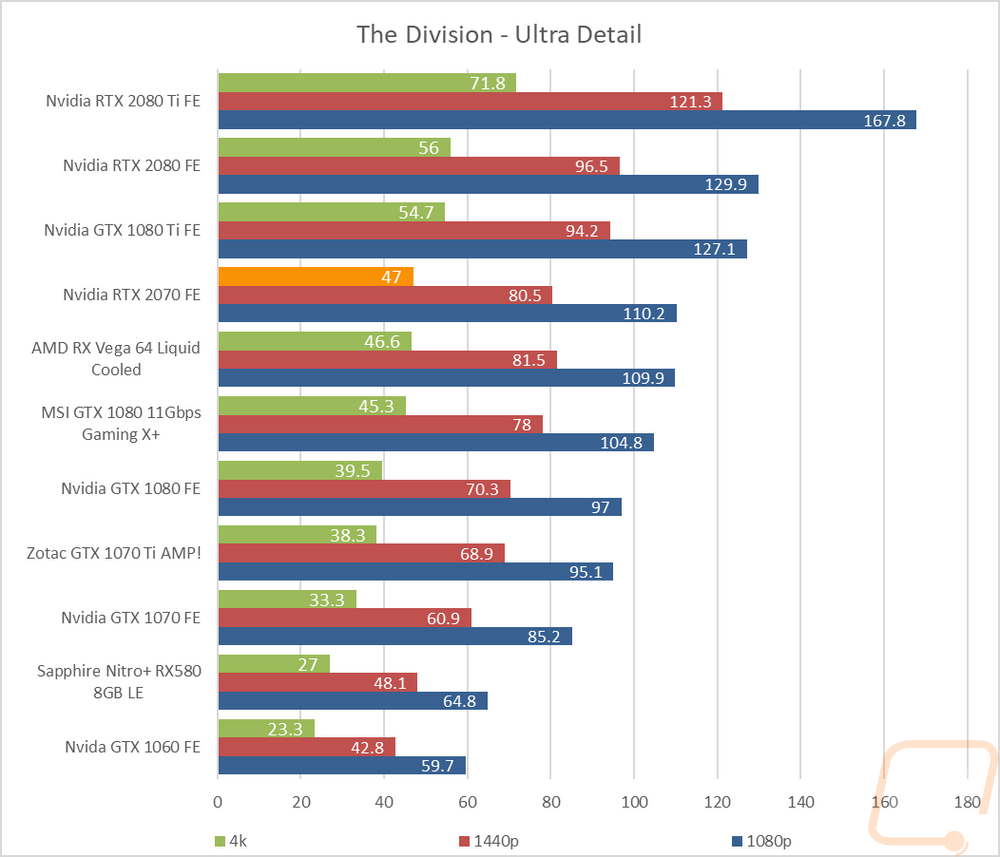
Now, of course, I have all of our actual results as well. The roundup graphs up at the top of the page just help sum up some of the performance to show how each resolution performed. The 16 graphs below show each test run with each run at all three standard resolutions. The RTX 2070 FE was actually fairly consistent in all of the tests. In nearly every test it came out ahead of the MSI GTX 1080 11GBps with its overclocked memory and GPU and well ahead of the GTX 1080 Founders Edition. The GTX 1070 and RX 580 were WELL below that. The Vega 64 was the main variable with it sometimes outperforming the RTX 2070 and other times coming in behind it. The GTX 1080 Ti was consistently faster and the two RTX2080’s were just about always up at the top.
") NICE....
NICE.... 
