Cooling, Noise, and Power
Once you decide which GPU you want to go with, you have to decide between all of the different models available. Clock speeds play a part as do pricing and aesthetics. But there are a couple of other areas that you should consider that are card specific. Power is one but it is in some ways tied with the overclock or at least how the overclock is done. There is also cooling performance and noise performance which both have to do with the cooler design.
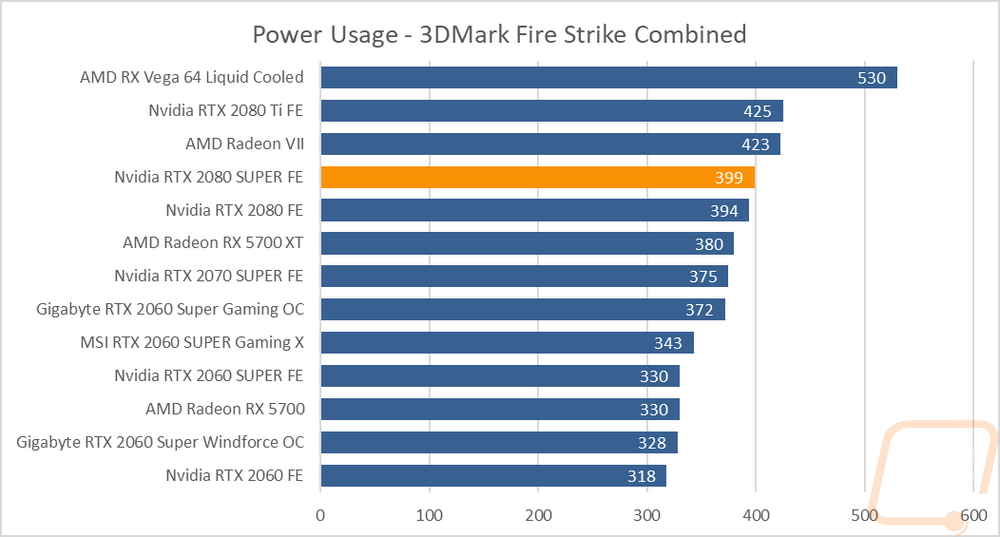
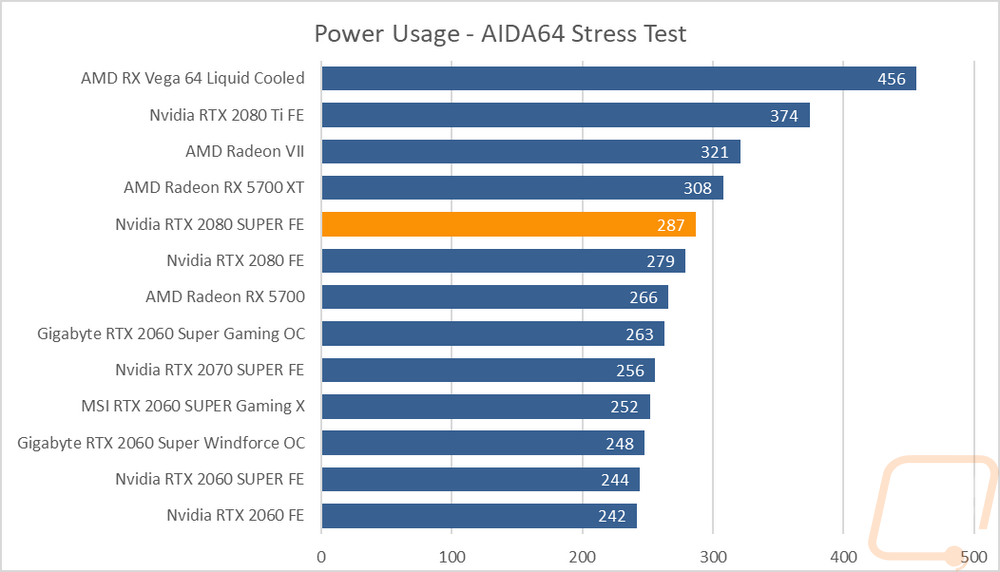
My first test was to take a look at power usage and for that, I hooked the test bench up to our Kill-A-Watt and recorded total power draw at the plug. I then put the system under load using 3DMark Fire Strike, specifically the combined test which tests the GPU and physics at once which gets a similar load to in game. The RTX 2080 SUPER Founders Edition along with the 3900X pulled 399 watts which for comparison the RTX 2080 did 394. This was more than the RX 5700 XT but below the crazy numbers that Vega 64 did. Radeon VI and the RTX 2080 Ti were right together as well and above the 2080 SUPER. The second test I wanted to focus on the GPU so I used AIDA64’s stress test to put the GPU under load but didn’t load any other part of the system. There is still some idle power draw but this number is obviously lower with the RTX 2080 SUPER Founders Edition pulling 287 watts here vs 279 for the RTX 2080 FE. I’m surprised that the 2080 SUPER still stayed as close as it did with the RTX 2080 given the increase in TGP from 215 watts to 250 watts. This put the 2080 SUPER FE up under the RX 5700 XT by a big margin as well.
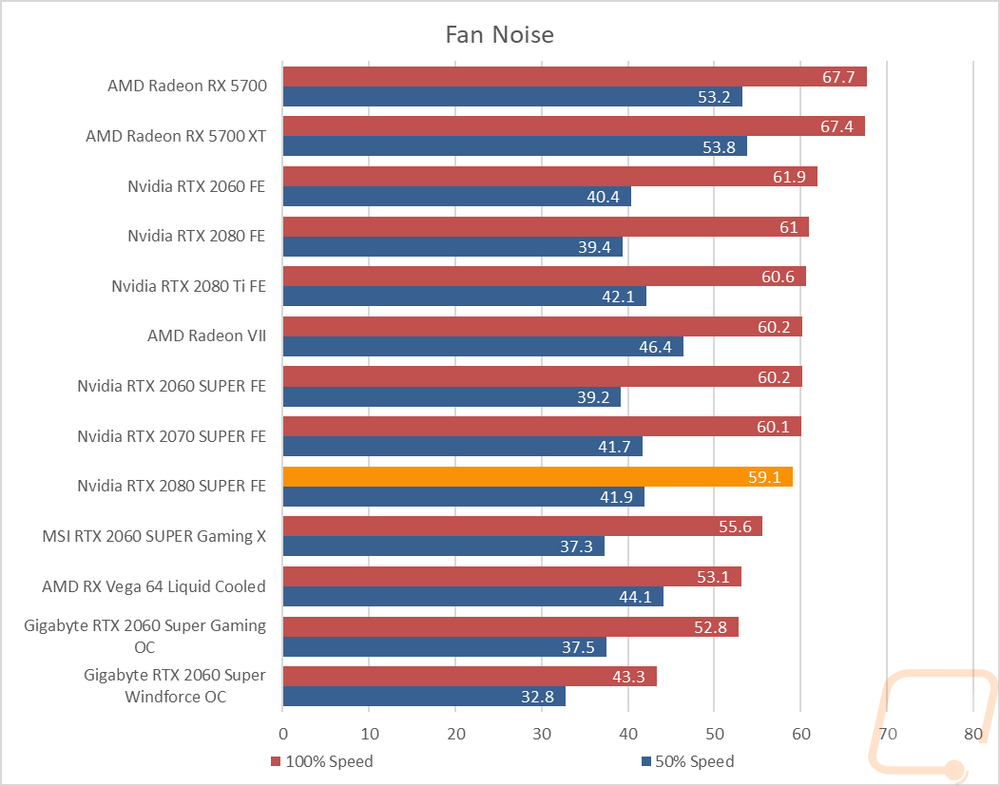
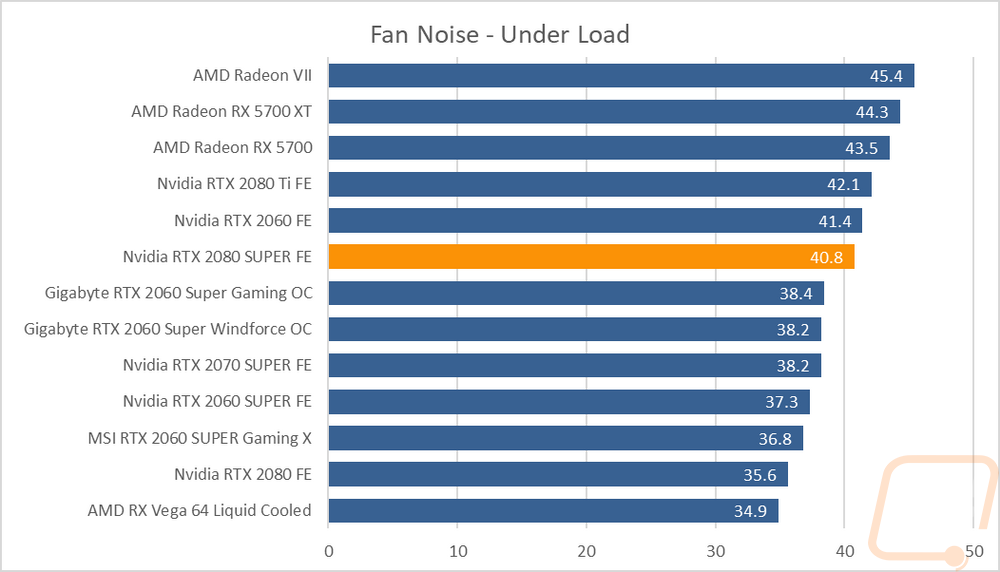
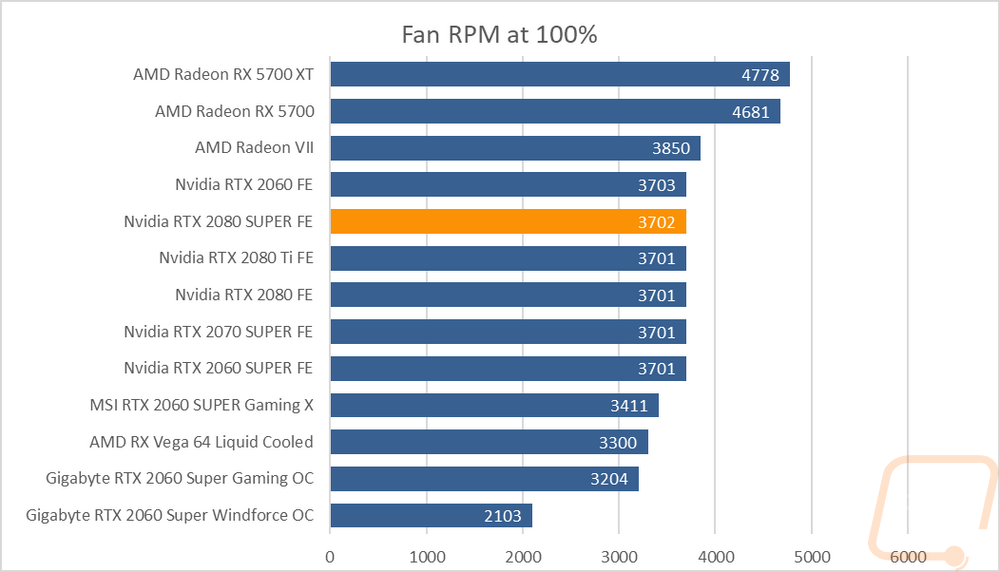
Next, I wanted to check out the noise performance of the Founders Edition cooler. For this, I ran three tests using the decibel meter setup 18 inches away from the test system. I tested at 50% and 100% fan speeds to get a look at the overall potential for noise. Then I tested with the card under load for 30+ minutes, then measuring the sound level of wherever the fans landed to keep it at that temperature using the stock fan profile out of the box. I also documented the 100% fan speed RPMs because that sometimes will give a good look as to why a card is quieter or louder, or if it is noisy but doesn’t have a very high RPM it tells us that the design is noisier. So at 100% fan speed, the Founders Edition cooler falls right in the middle of the chart with the water cooled and aftermarket designs being quieter and the blower cards being louder. With no cooler change, the 2080 SUPER and regular 2080 were relatively close in noise as well as all of the other Nvidia dual-fan cards. 50% fan speeds weren’t too bad as well. It was the under load noise level that I was most curious about though and the 2080 SUPER was a lot higher than the original 2080 in that test. It would fall in the middle of the pack overall, but I was surprised to see such a big change from card to card, you have to wonder if the fan profile has been changed between the two or if it is just more heat from the slightly more cores and higher memory and core clocks.
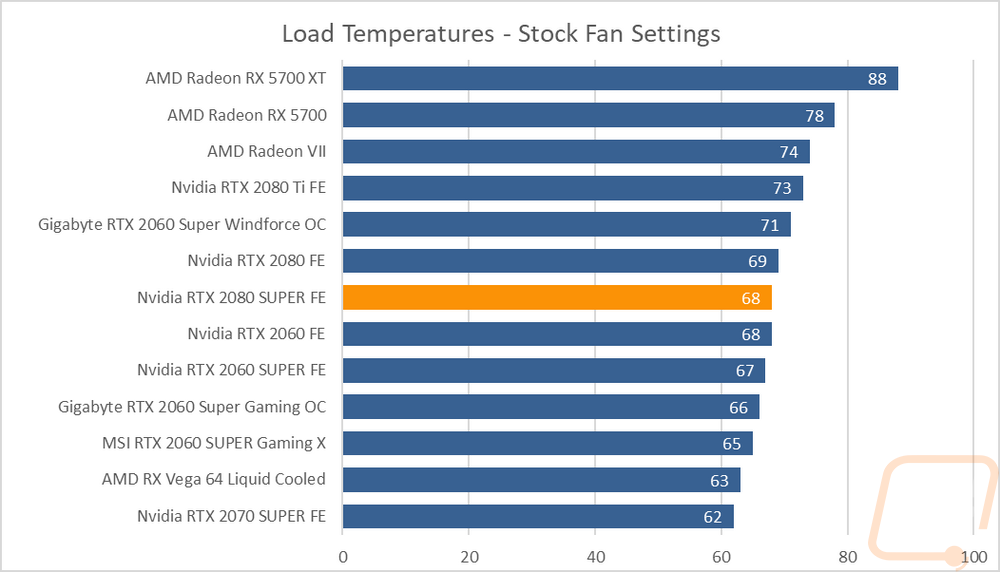
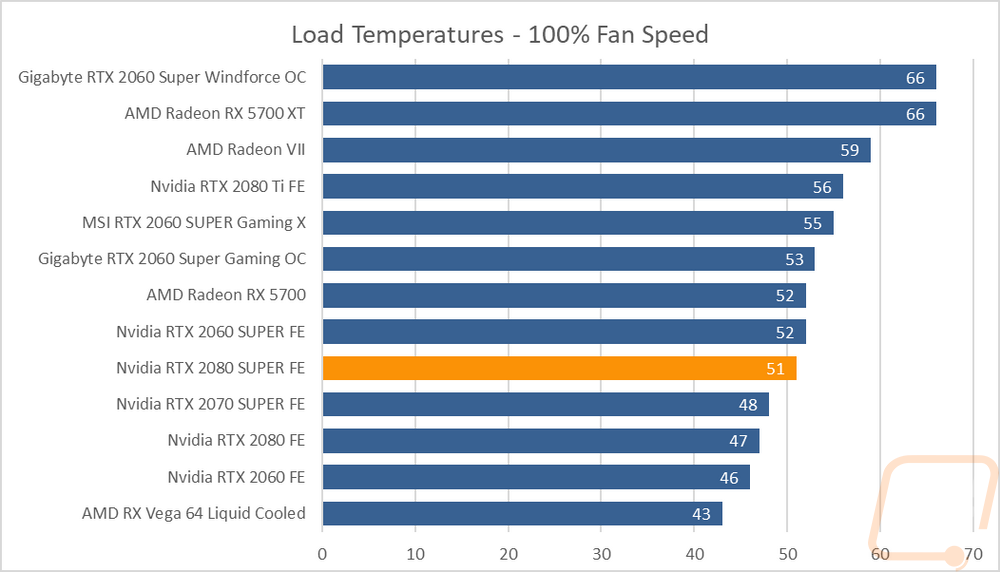
The last test was to take a look at the cooling performance of the Founders Edition card. To do this I used AIDA64’s stress test to load the GPU and to document temperature tests. I tested by running that load for a half hour or longer if needed, waiting for the temperature to level off and no change. I tested twice, once with the stock fan profile and again with the fans turned up to 100%. The idea is to see out of box cooler performance and then see how much headroom is left. The delta between the two will show that. So the RTX 2080 SUPER Founders Edition reached 68 degrees with the stock fan profile were the original RTX 2080 reached 69. Given the higher clock speeds, I think that shows my theory from before that the fan profile is slightly changed. At 100% fan speed the 2080 SUPER dropped down to 51 degrees where the original 2080 dropped down to 47 degrees confirming that the 2080 SUPER does run warmer with the fan speed being the same with the same cooler design. The 17-degree delta between the stock and 100% results on the RTX 2080 SUPER Founders Edition also shows that this cooler still has more room in it for an overclock as well.
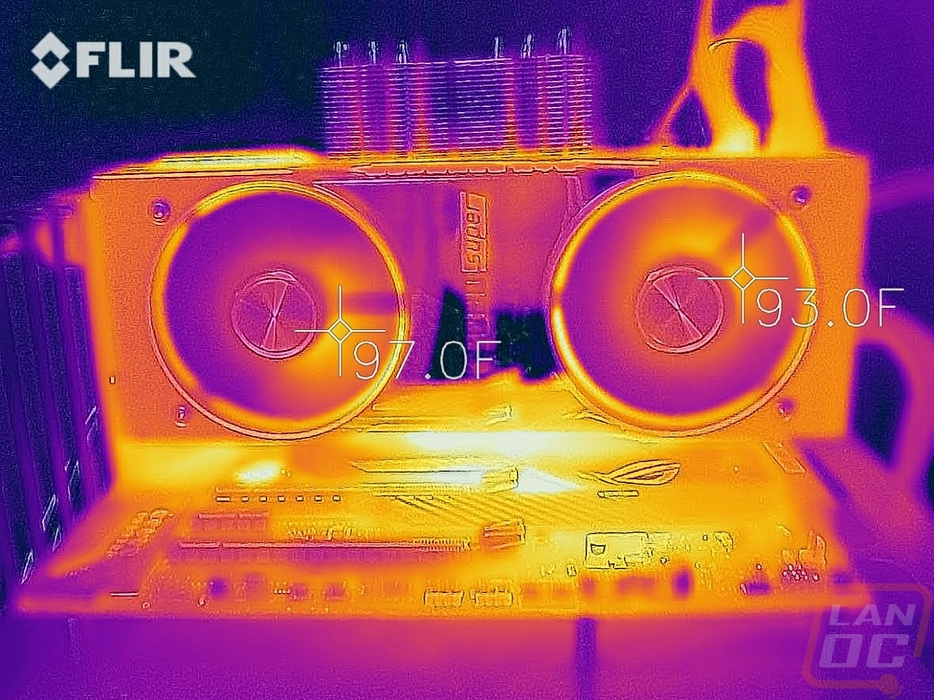
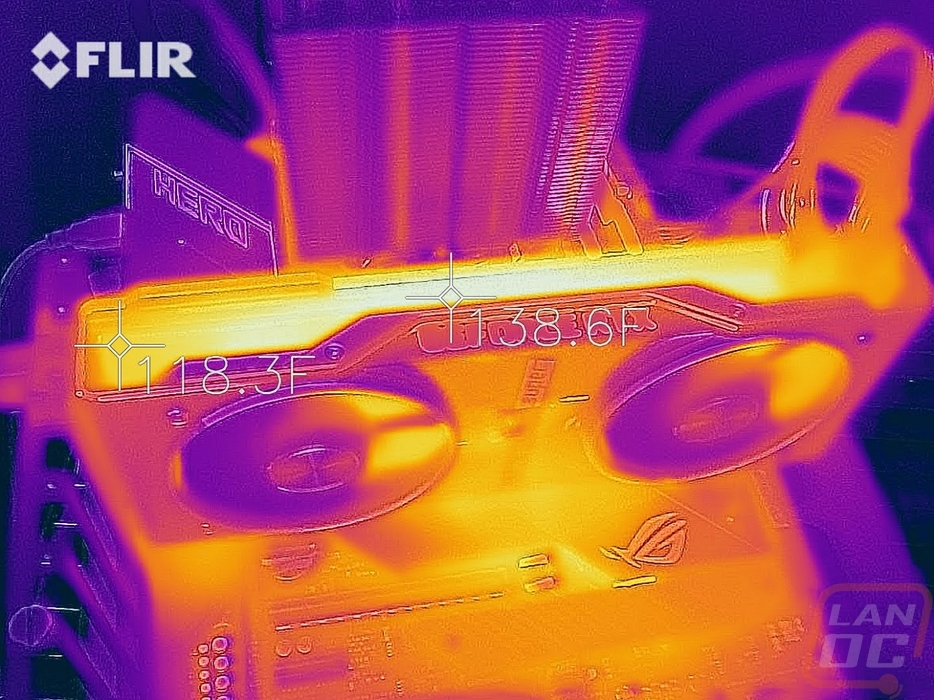
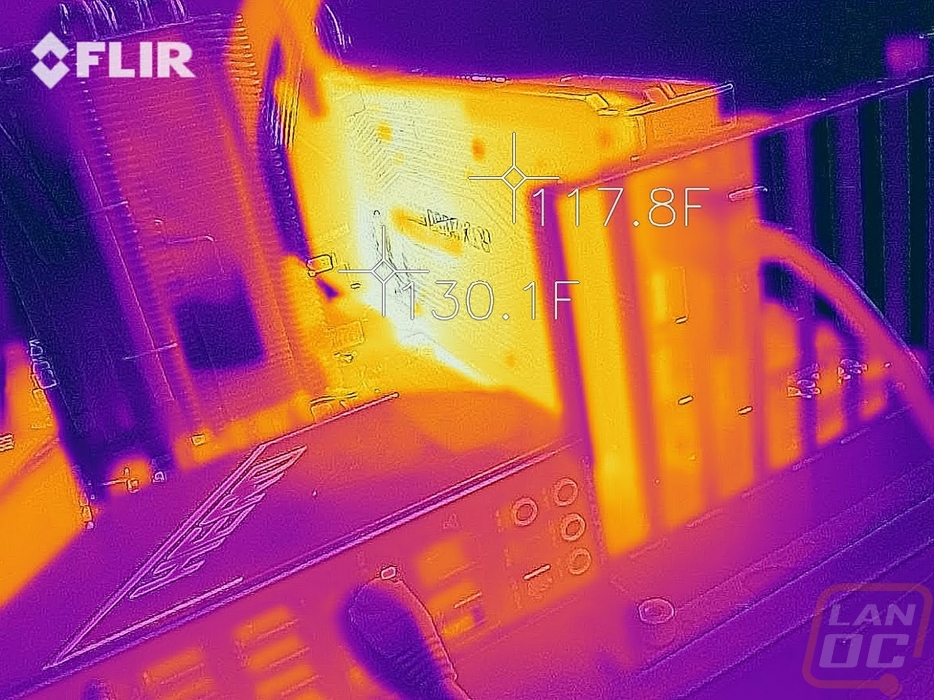
While doing thermal testing with the stock fan profile I also pulled out our thermal camera to take a look at the RTX 2080 SUPER Founders Edition to see how it was handling the additional heat of the 2080 SUPER. I was impressed to see that the areas behind the fans were running cool, in fact, the hot spots would be closer to the cool spots on a few of the cards I’ve tested recently. The thick metal shroud hadn’t soaked up too much heat as well on the fan side. The top down view showed that the heatsink area at the top where a majority of the heated air is coming out is doing its job. The entire middle of the card is warmer with ti much cooler down at the end. Then around on the backplate, there was a noticeable hot area down where the VRMs are. The backplate was also running a lot warmer than the front of the card but still not bad other than that one VRM area.