In-Game Benchmarks
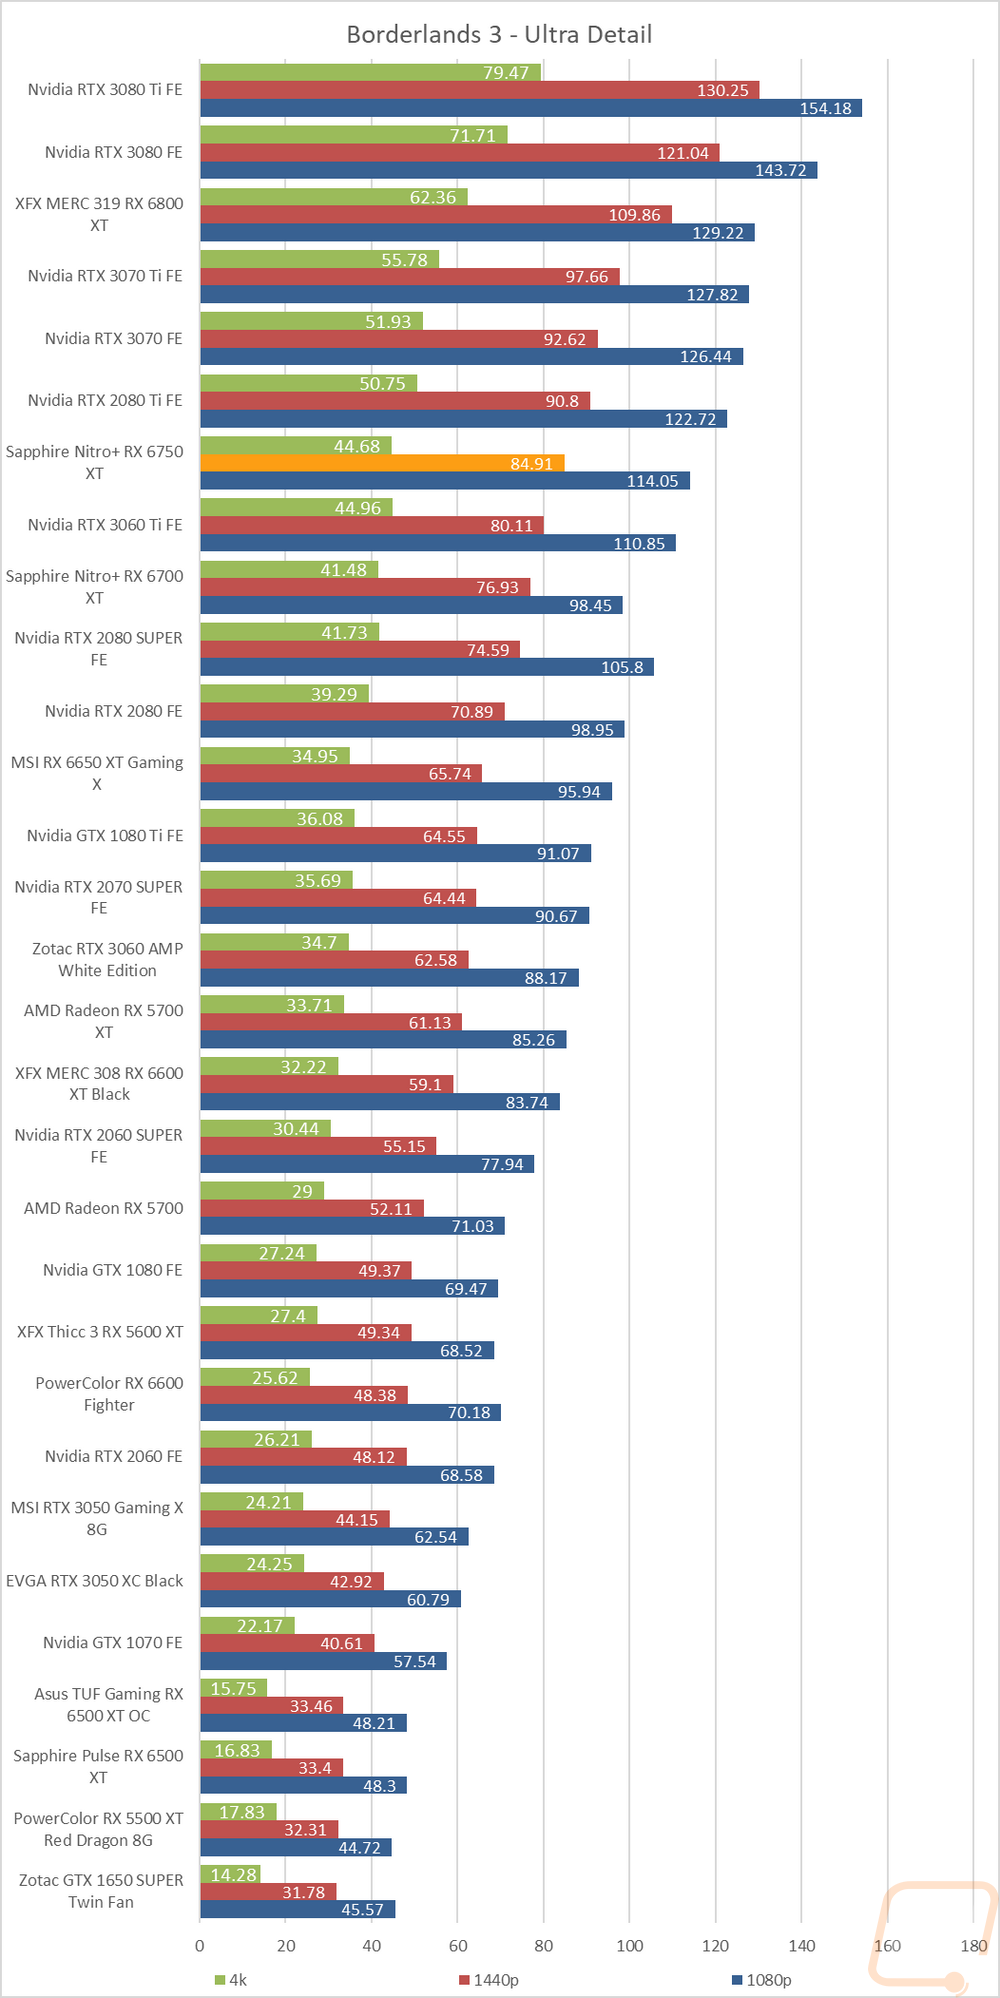
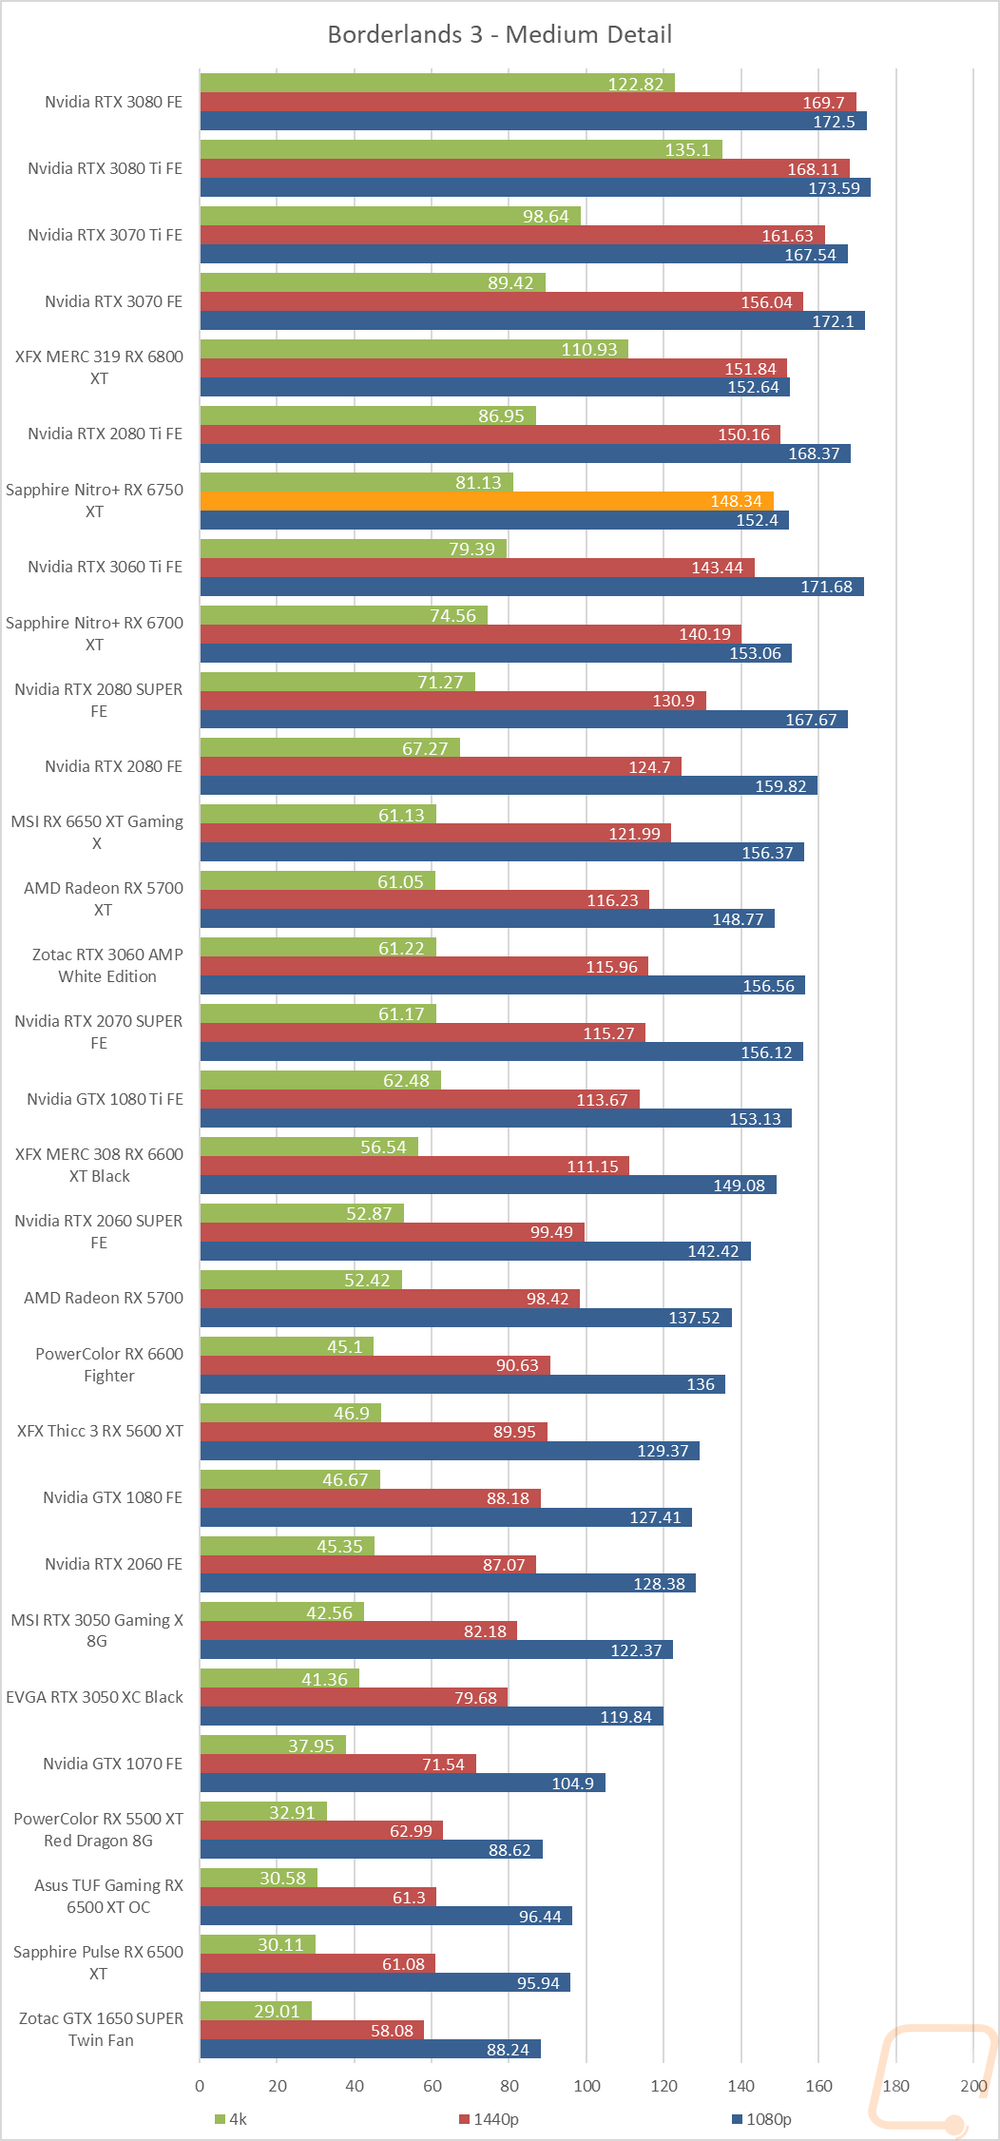
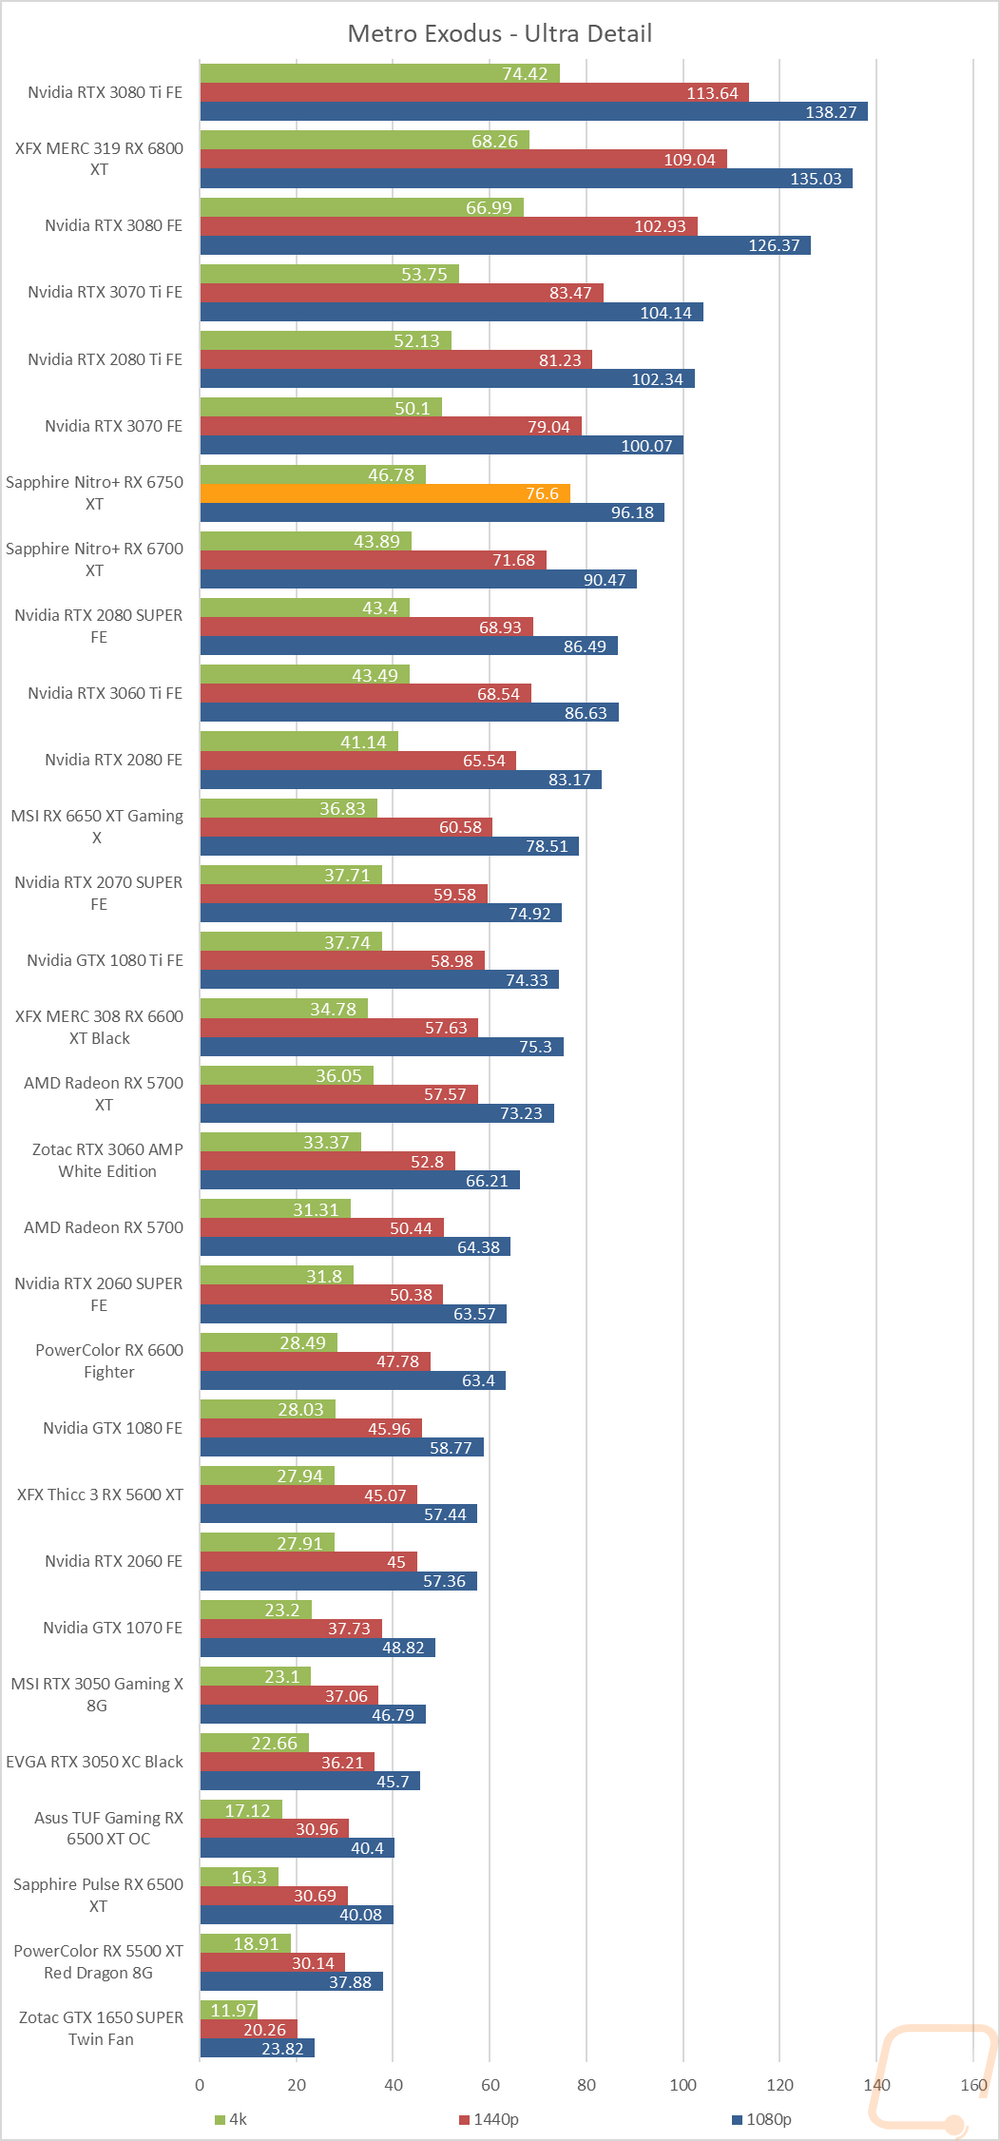
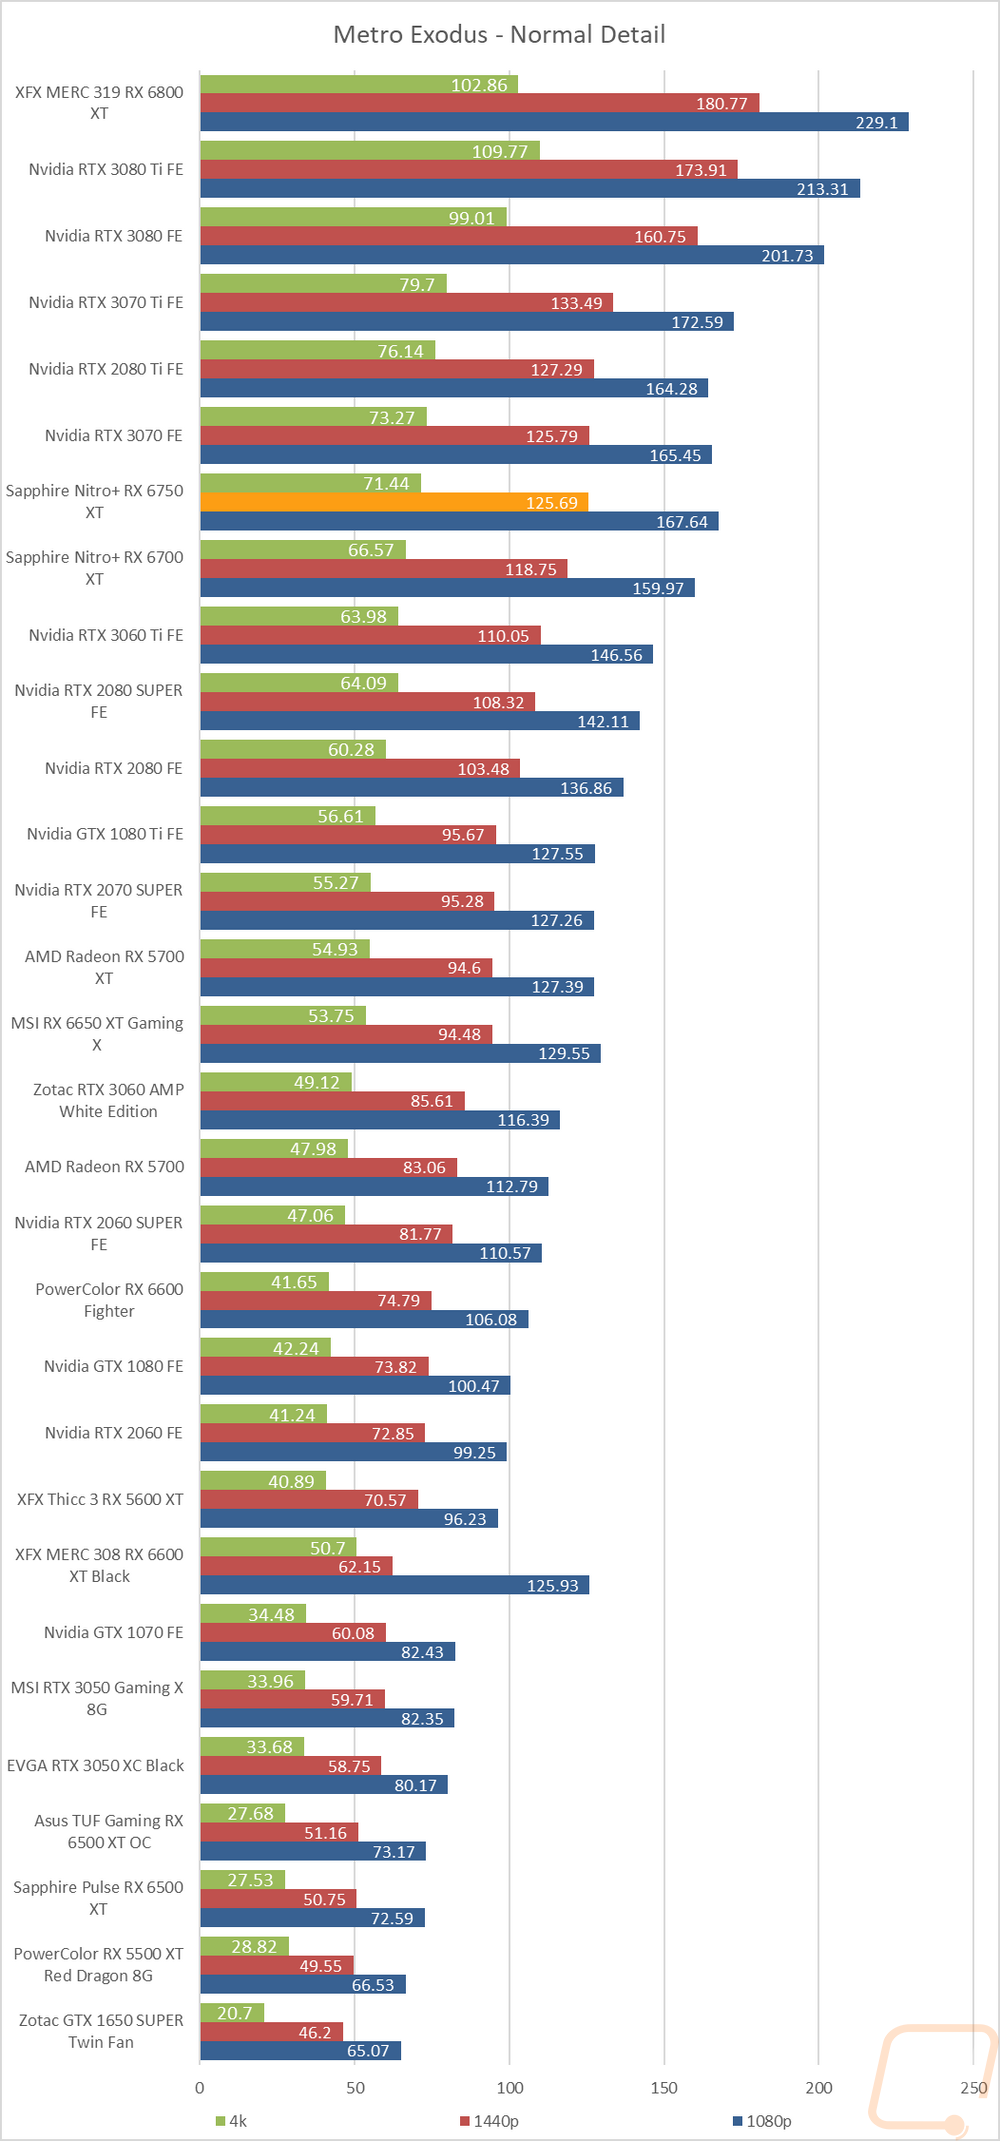
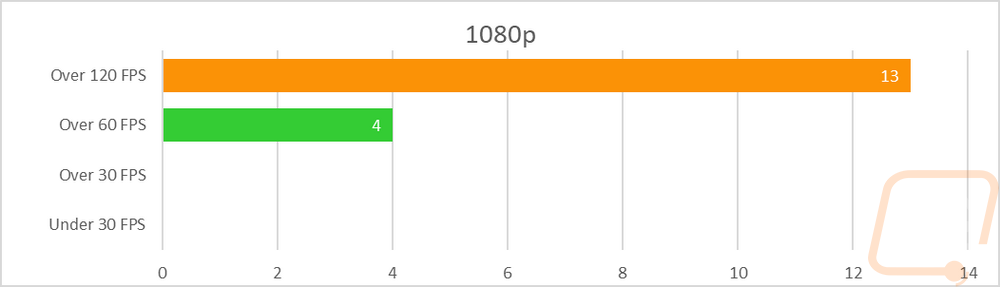
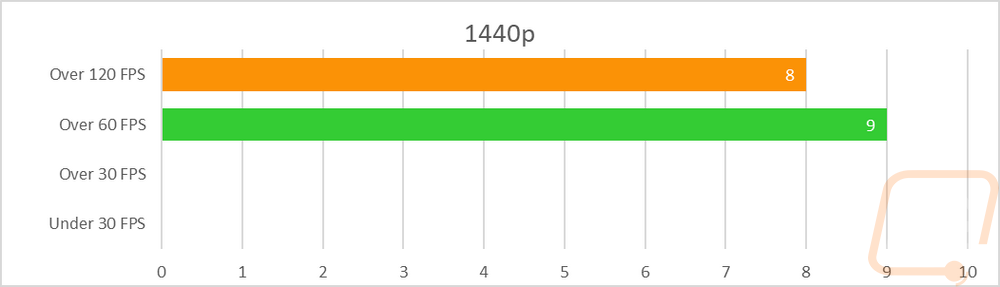
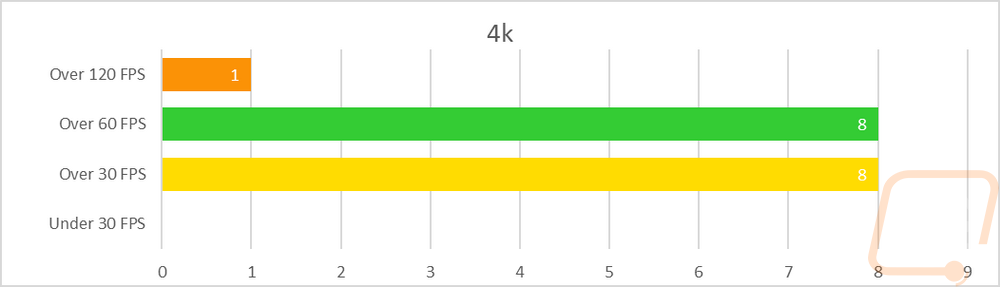
Now we finally get into the in game performance and that is the main reason people pick up a new video card. To test things out I ran through our new benchmark suite that tests 10 games at three different resolutions (1080p, 1440p, and 4k). Most of the games tested have been run at the highest detail setting and a mid-range detail setting to get a look at how turning things up hurts performance and to give an idea of if turning detail down from max will be beneficial for frame rates. In total, each video card is tested 54 times and that makes for a huge mess of results when you put them all together. To help with that I like to start with these overall playability graphs that take all of the results and give an easier-to-read result. I have one for each of the three resolutions and each is broken up into four FPS ranges. Under 30 FPS is considered unplayable, over 30 is playable but not ideal, over 60 is the sweet spot, and then over 120 FPS is for high refresh rate monitors.
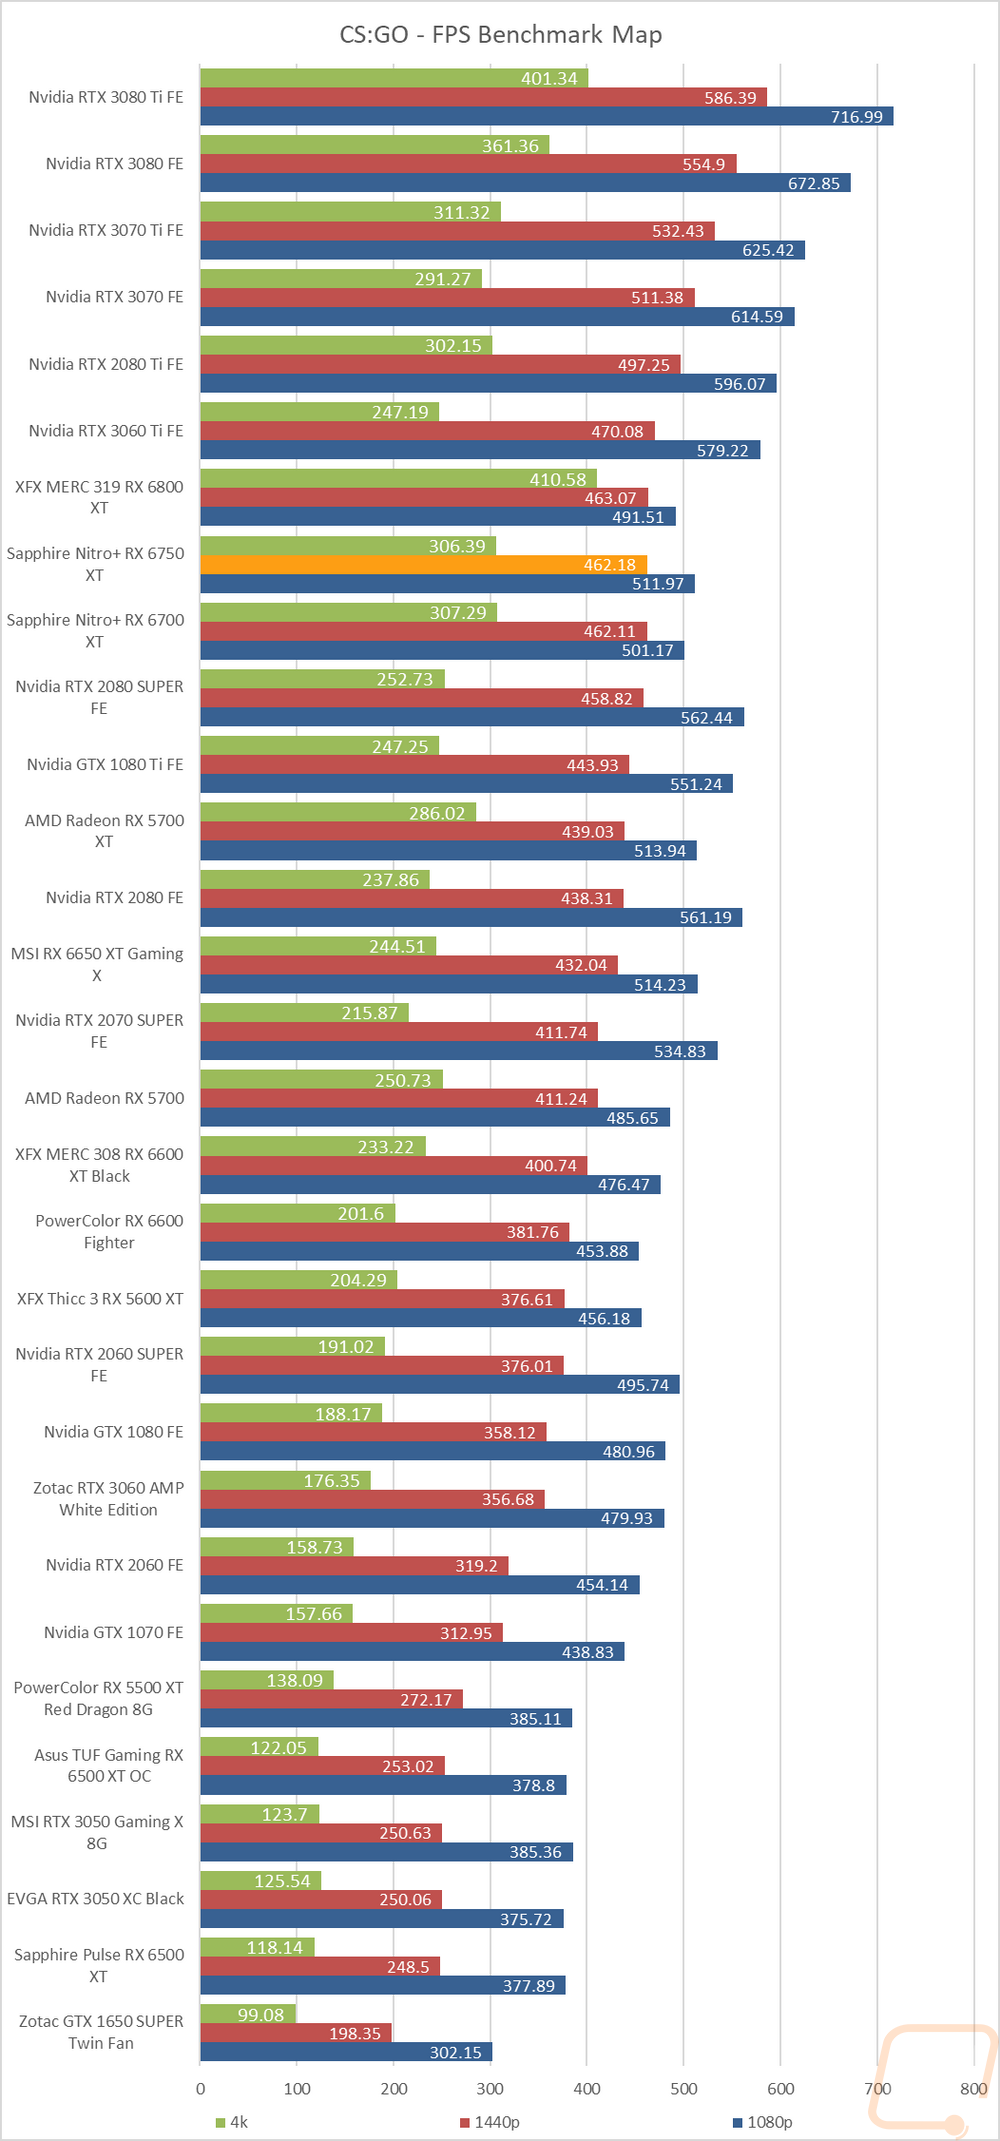
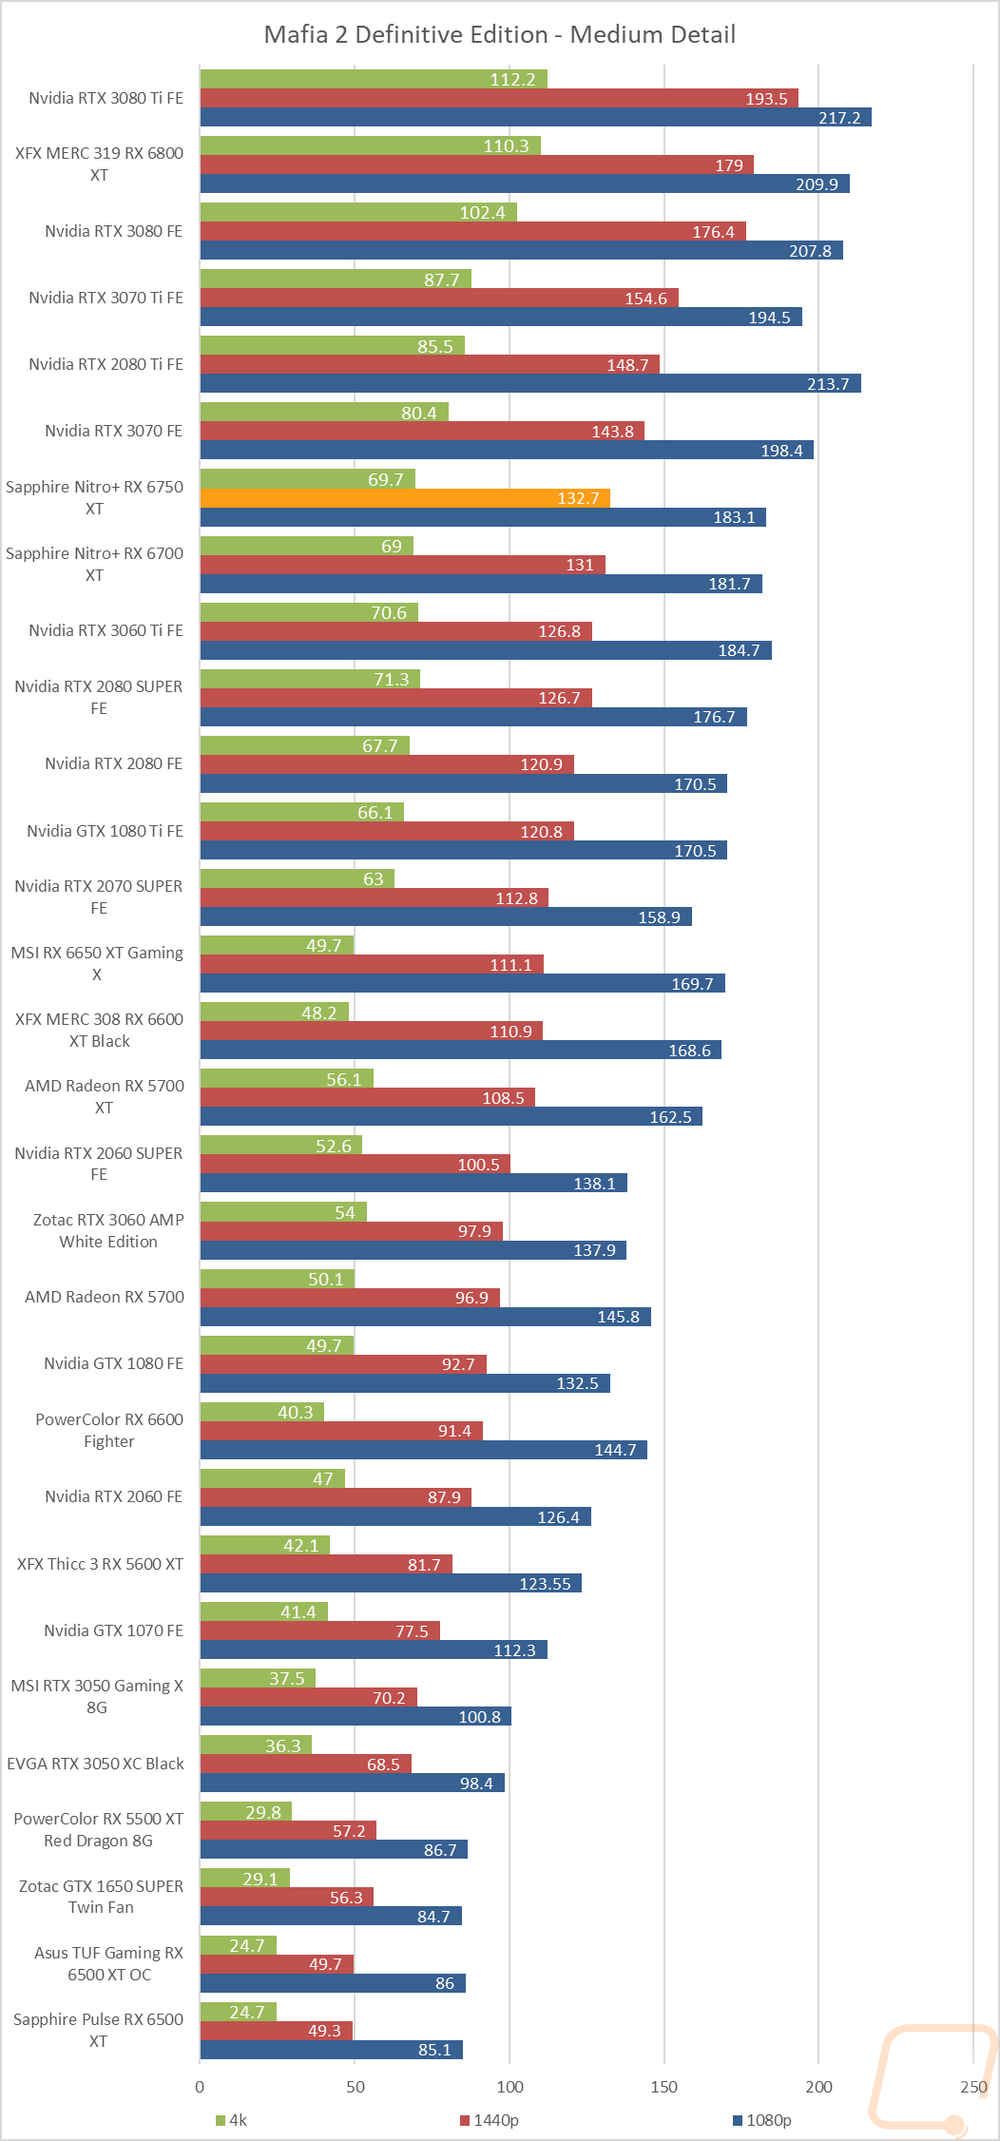
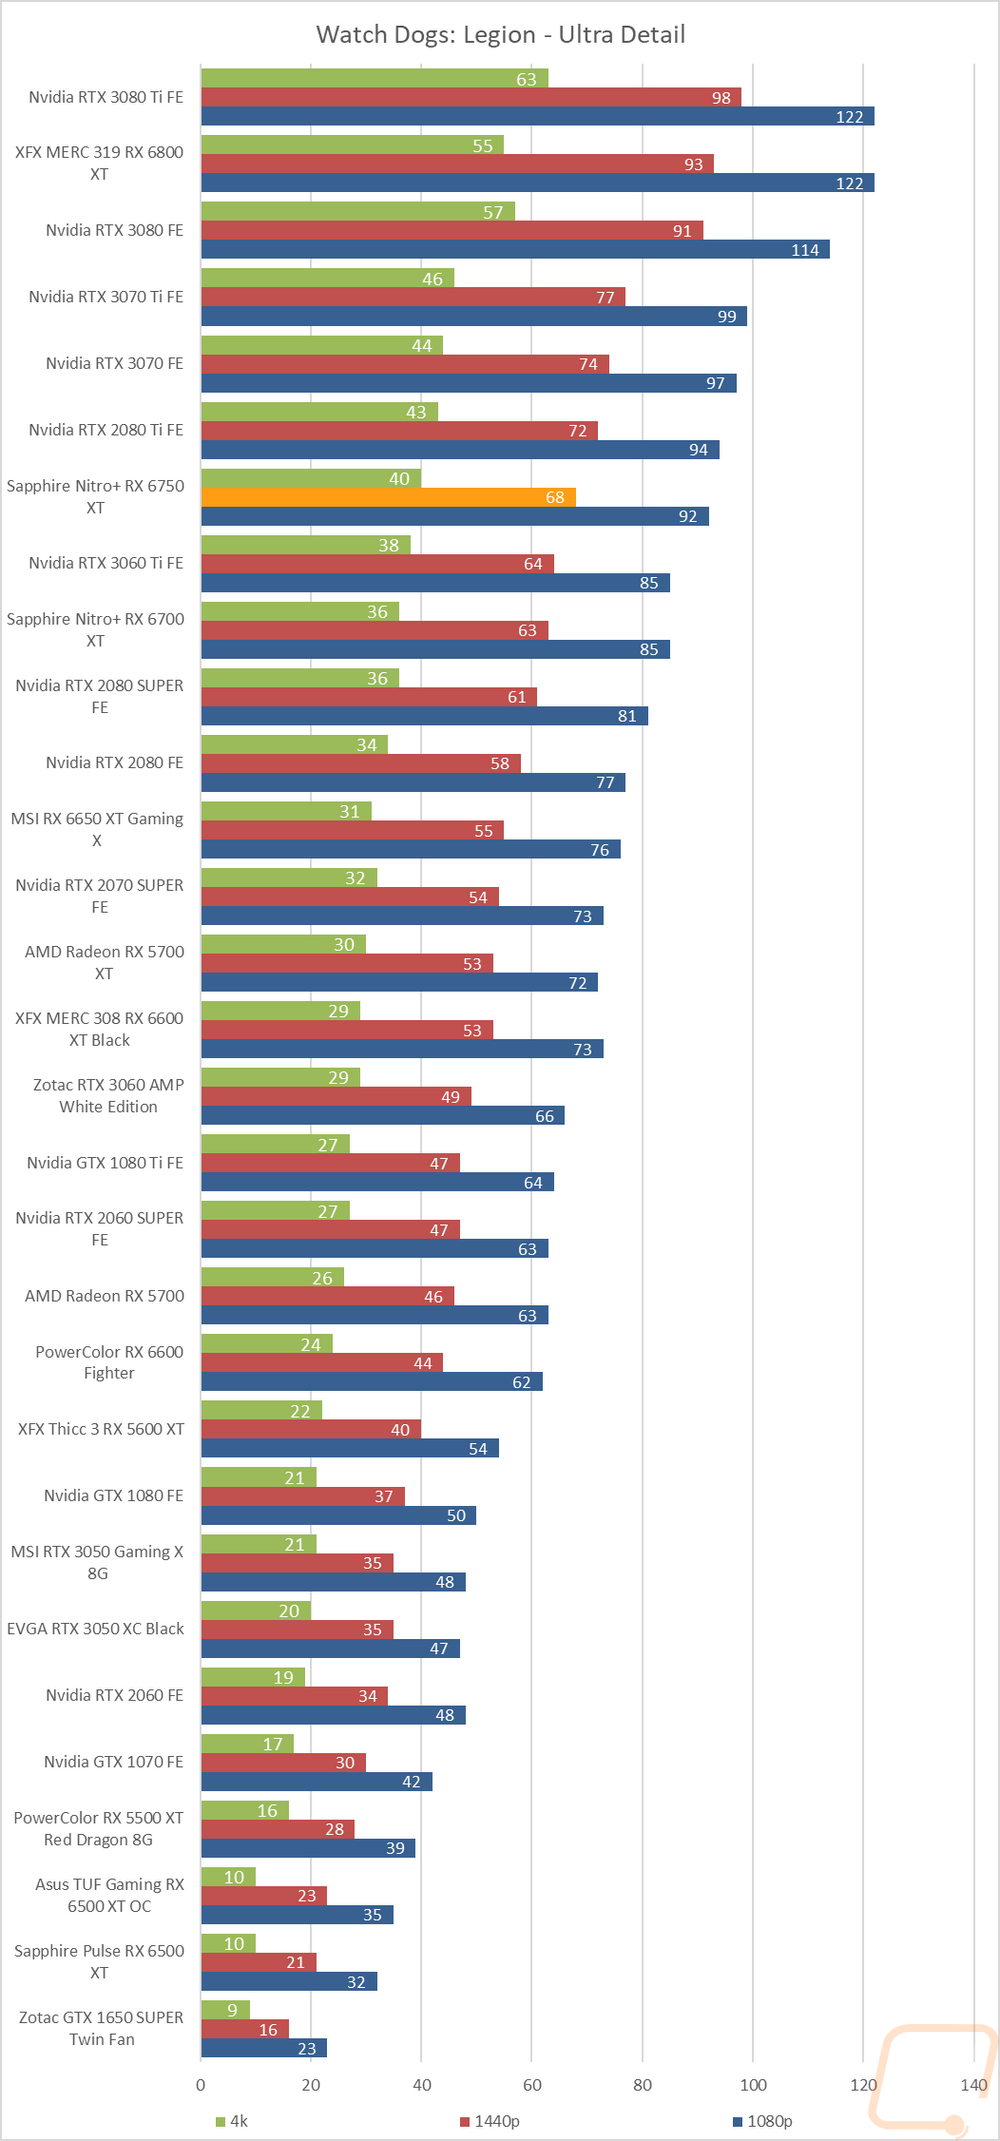
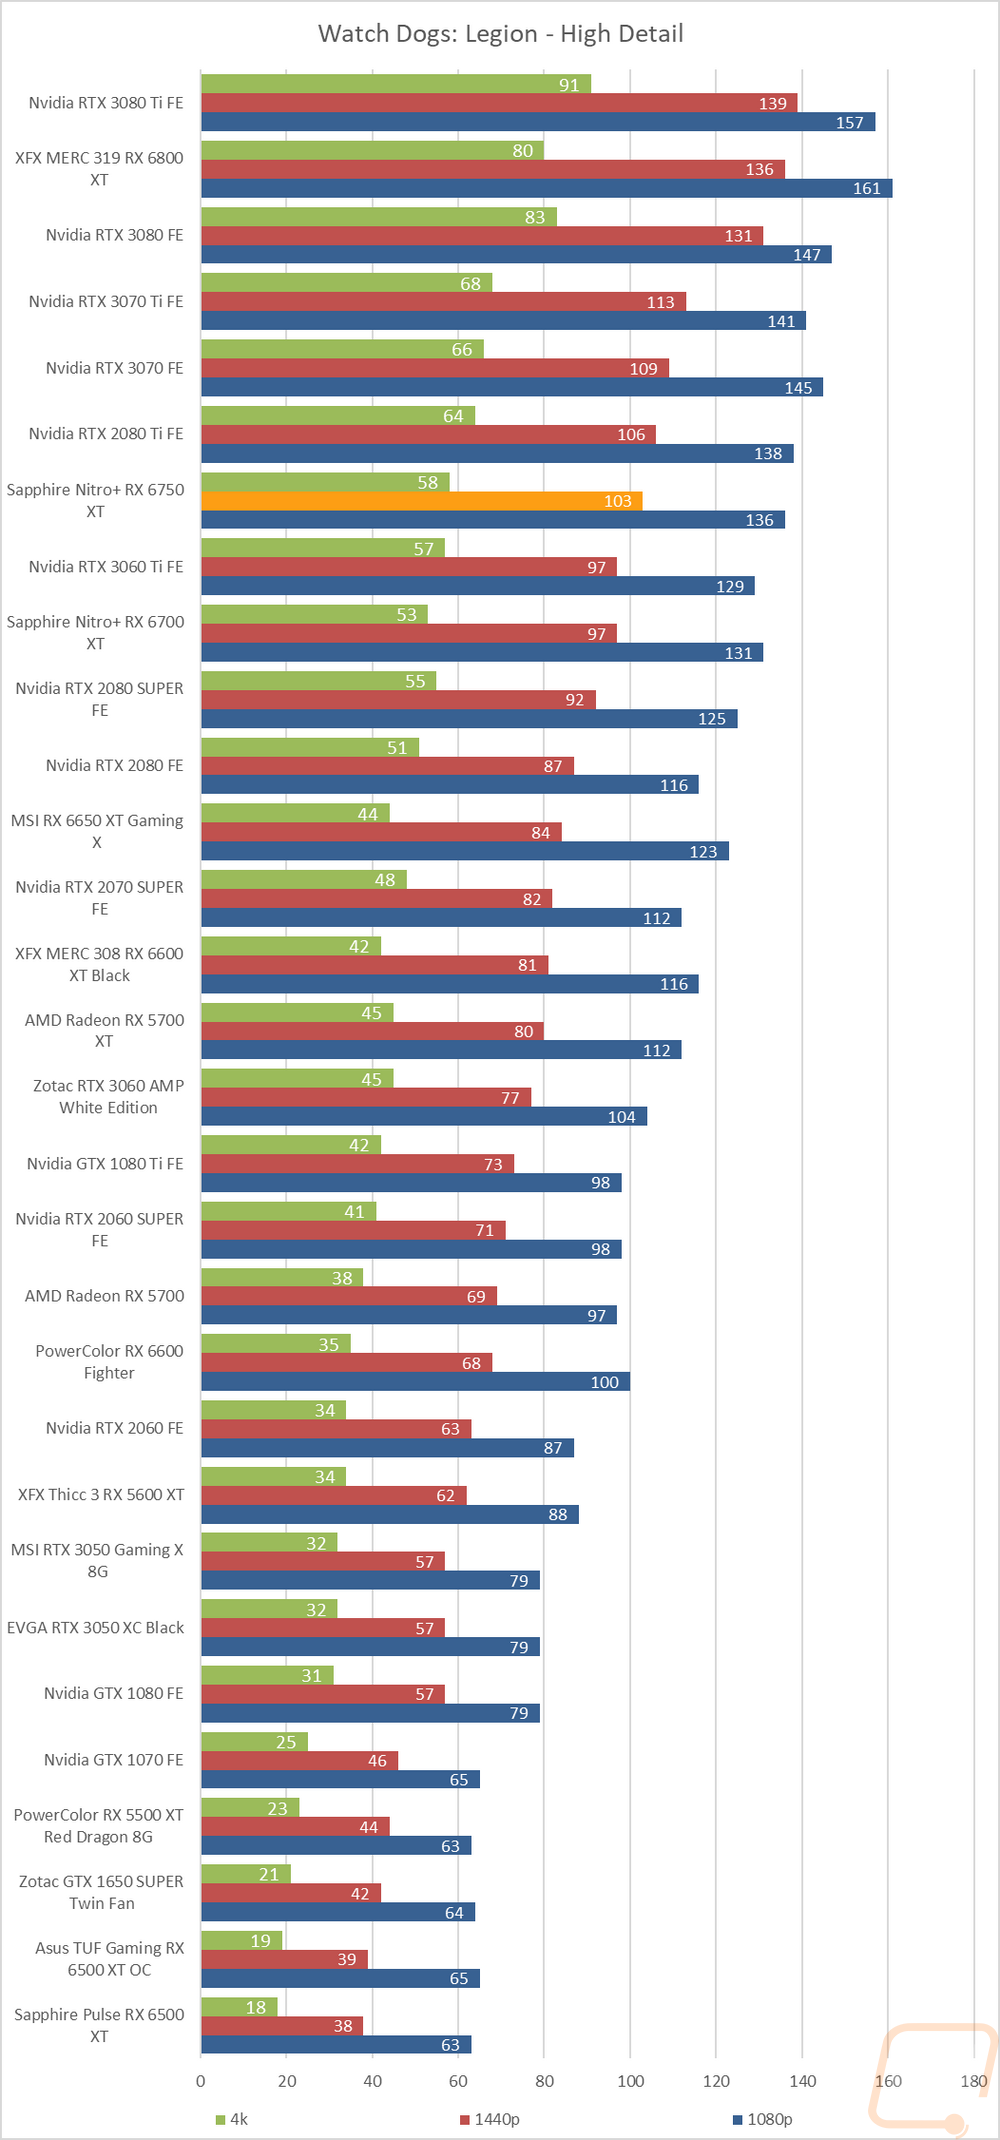
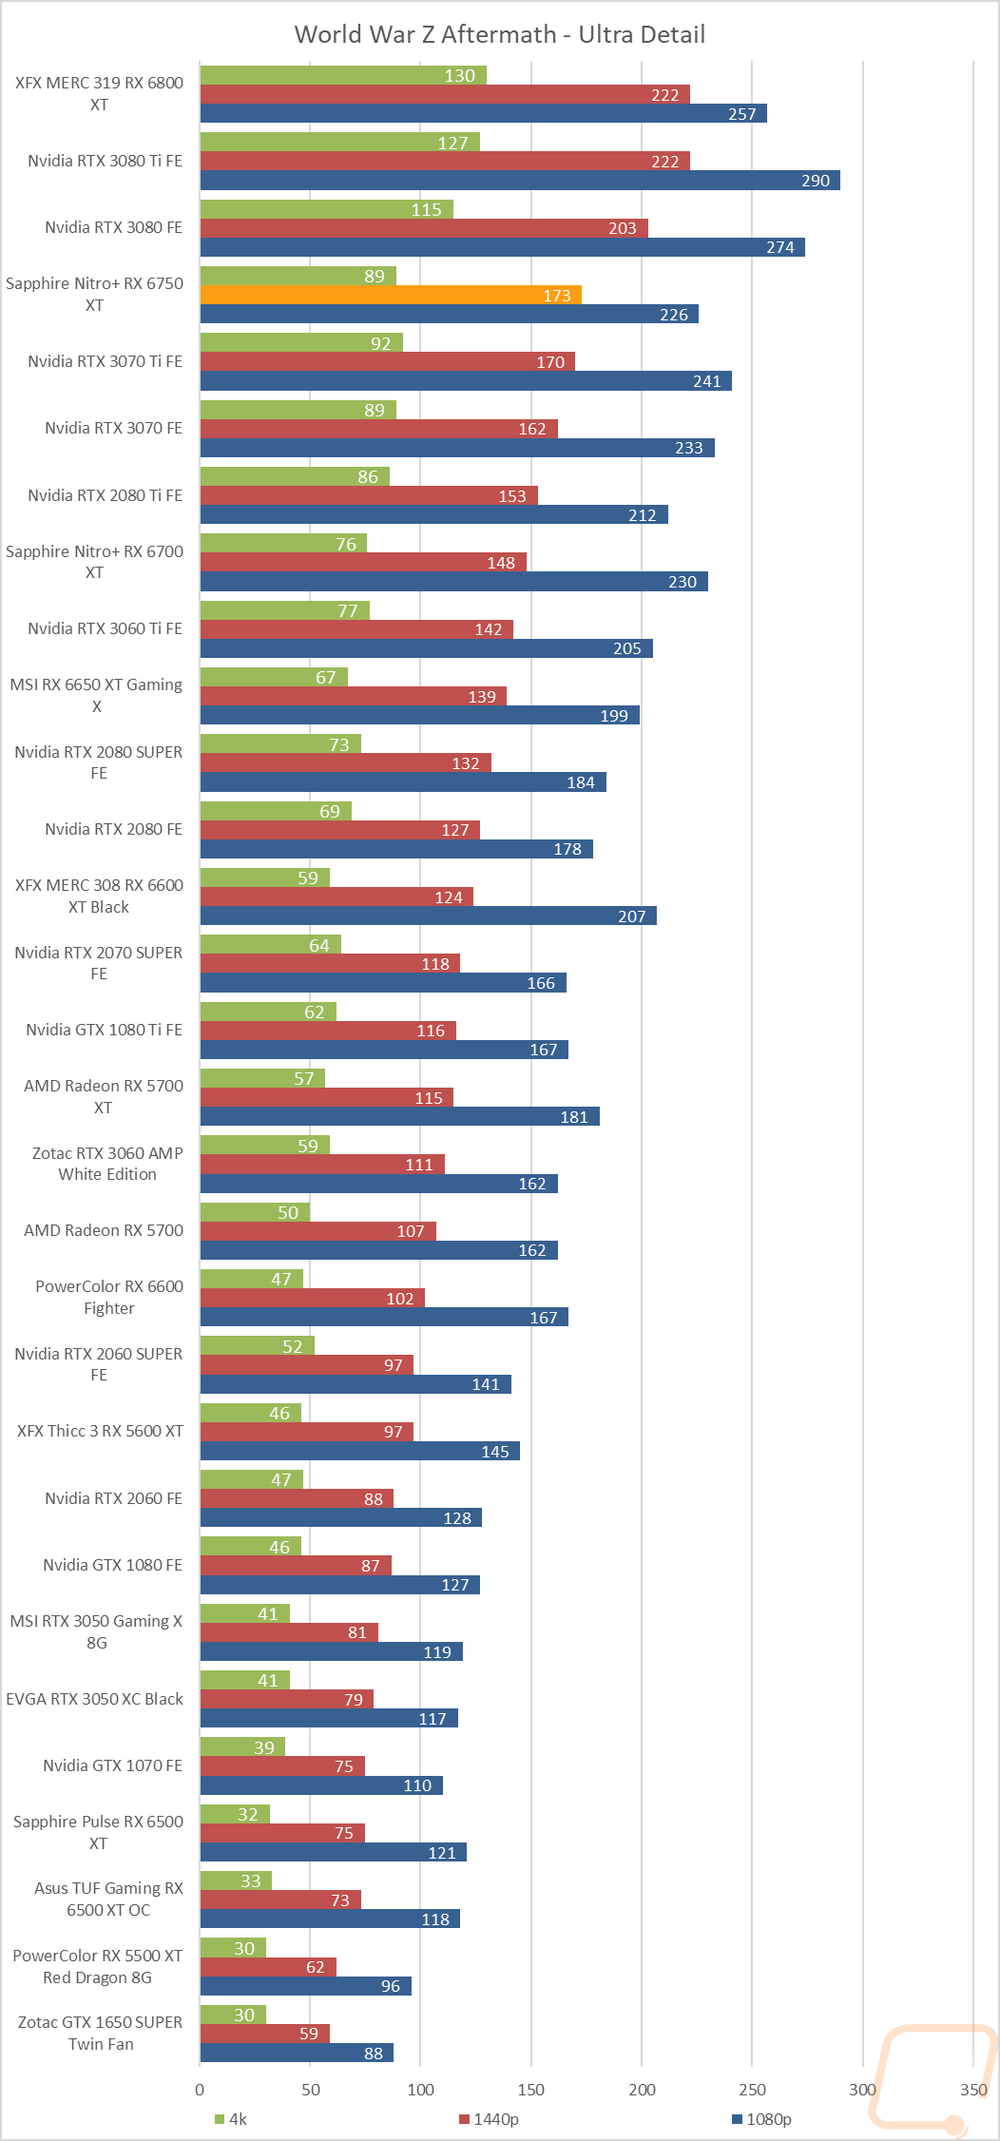
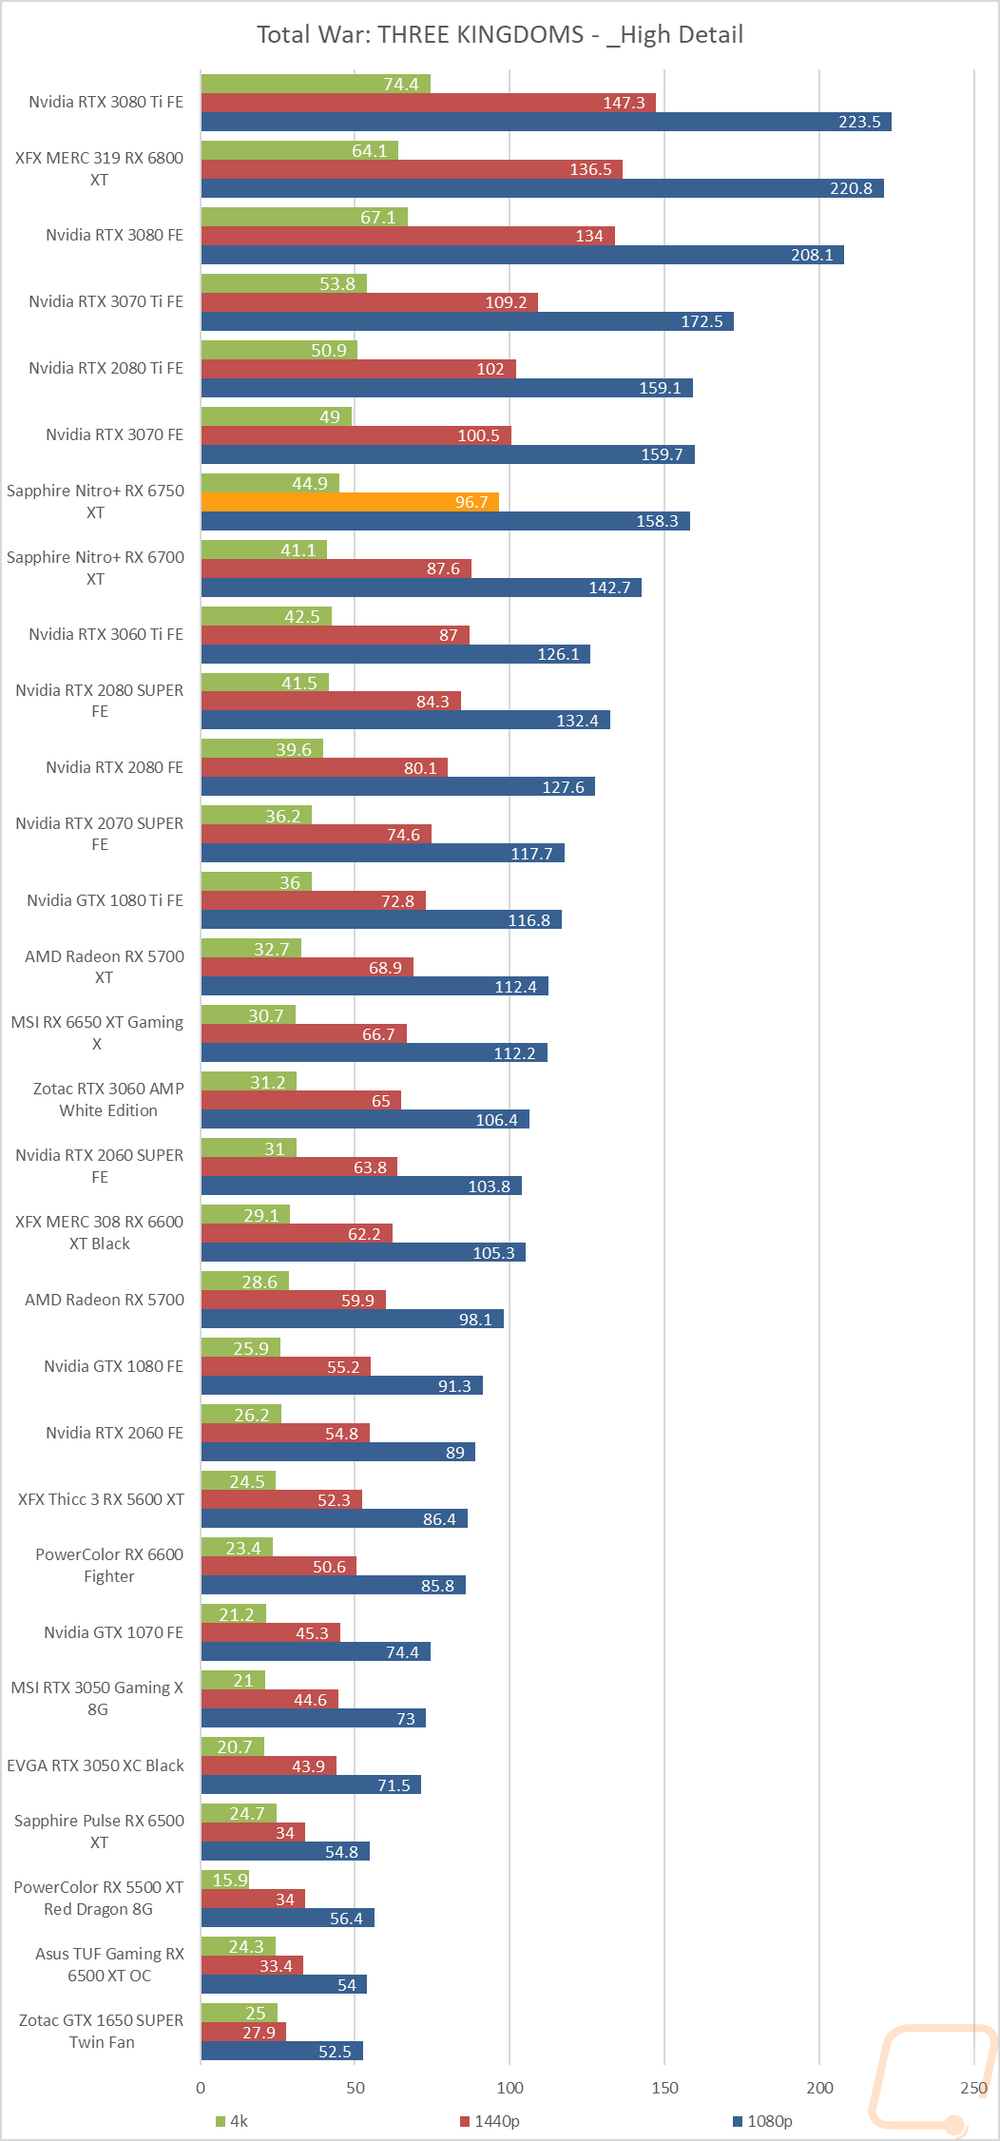
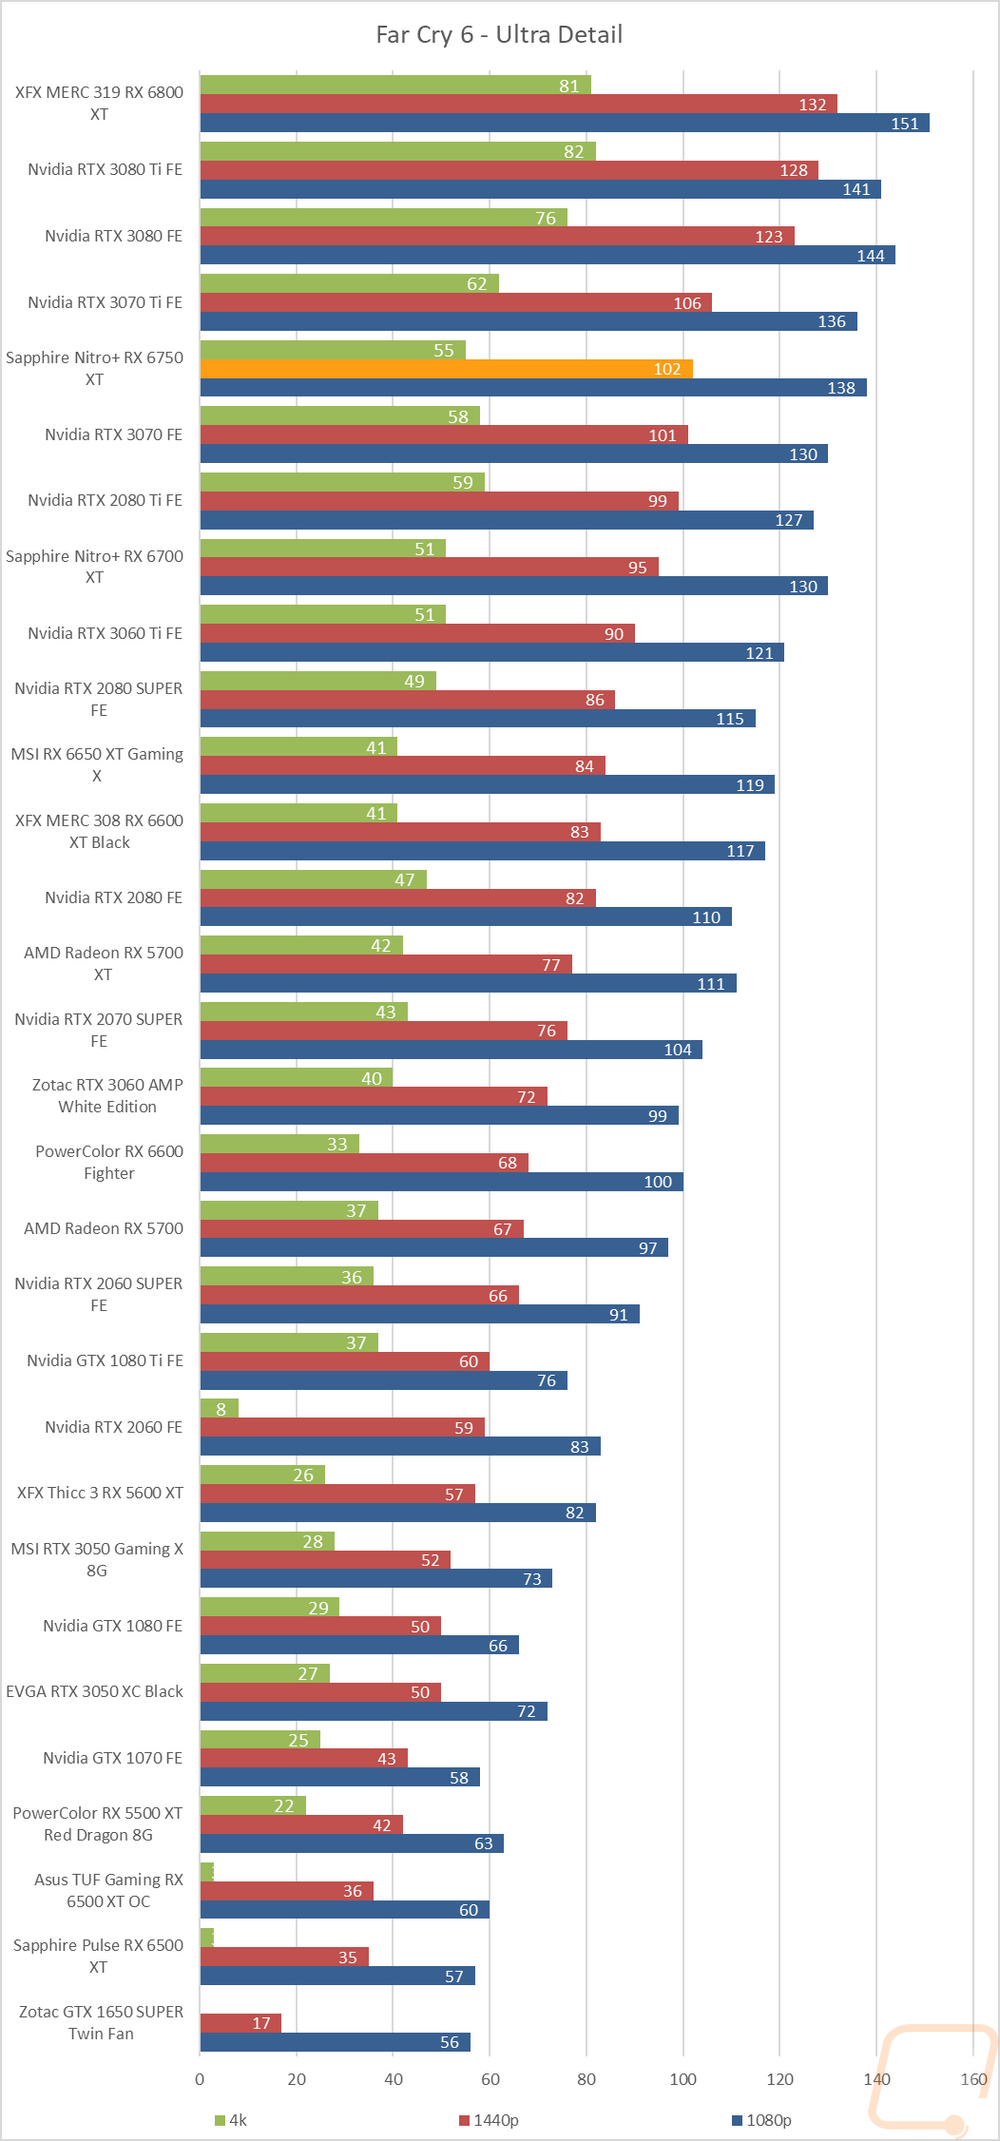
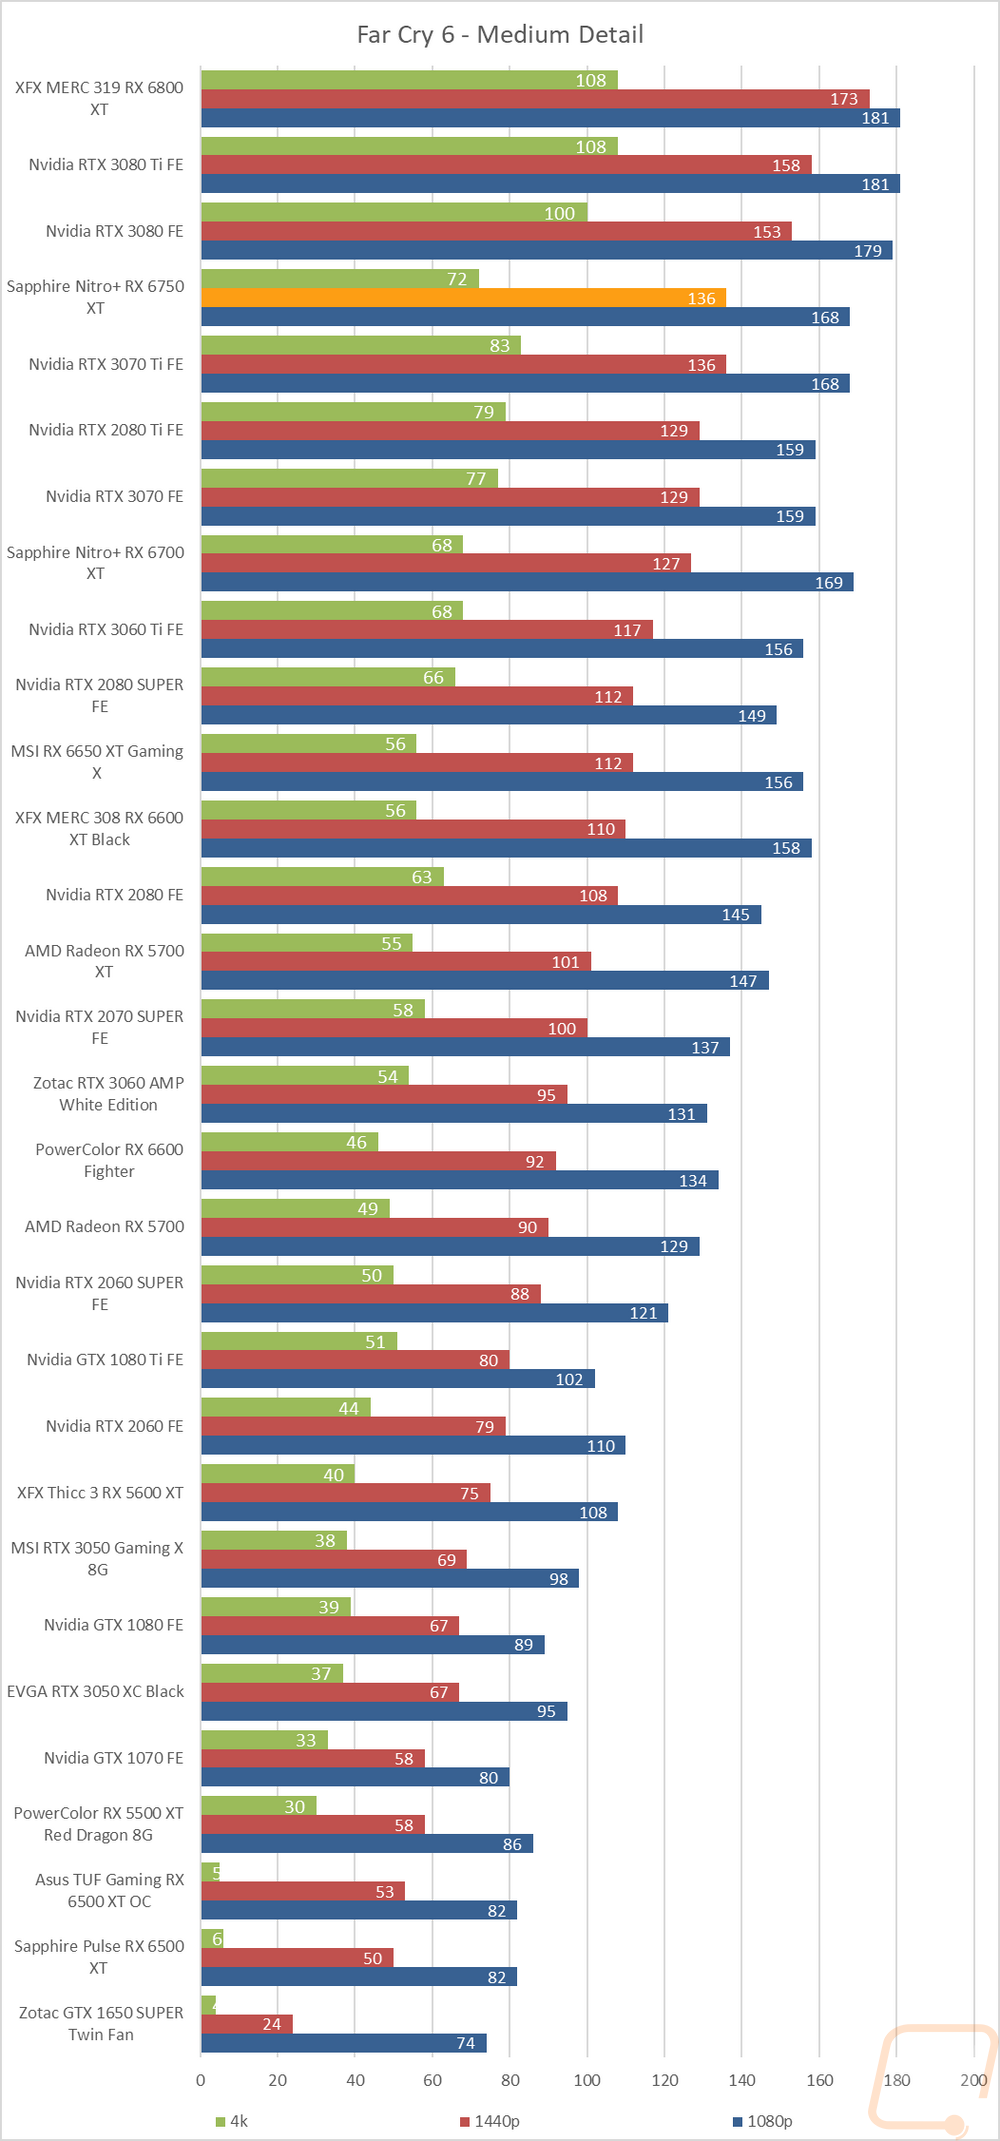
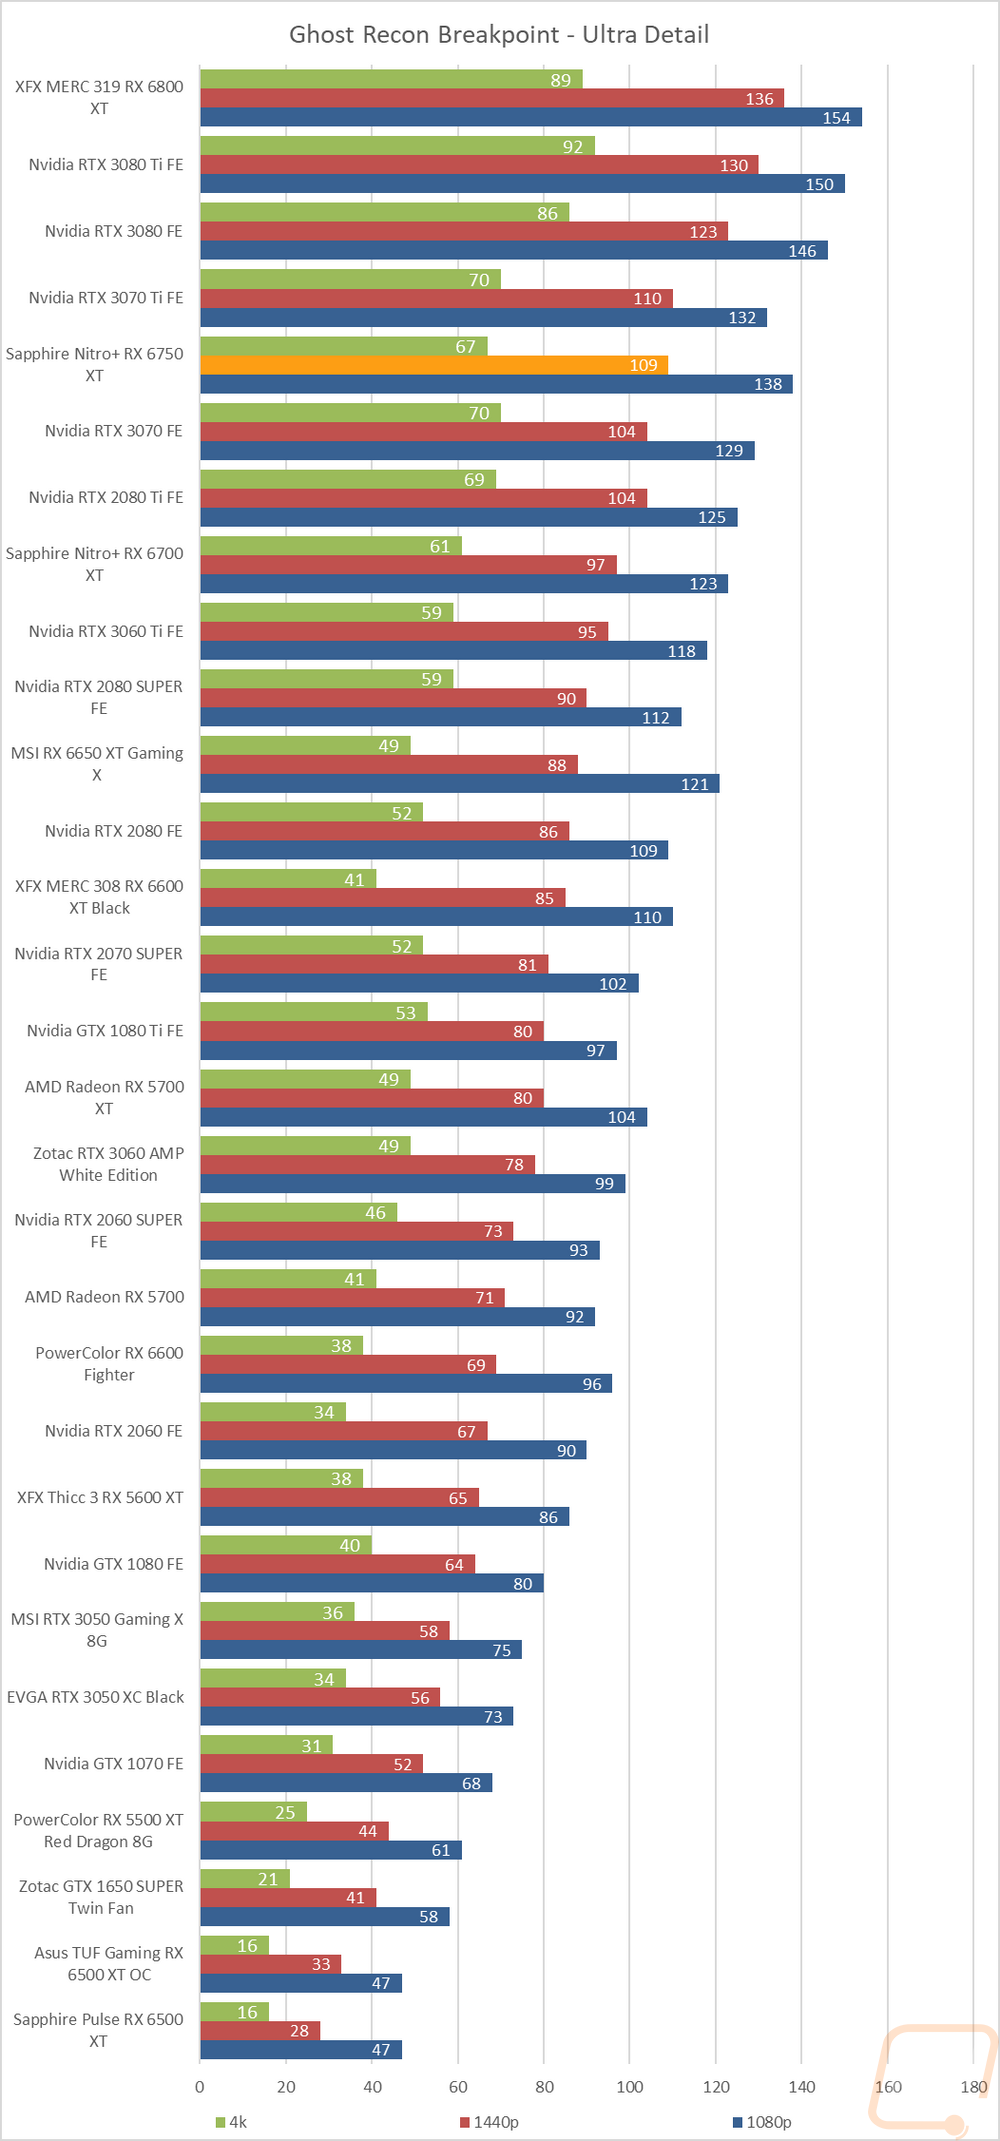
So how did the Nitro+ RX 6750 XT do? AMD has this marketed as one of their 1440p focused cards and given the 8 results at over 120 FPS at 1440p and the other 9 are over 60 FPS I would agree. At 1080p it does even better of course with 13 over 120 FPS and 4 in the 60-119 range. As for 4K, the Nitro+ RX 6750 XT can handle it but does struggle. CS:GO as always is above 120 but beyond that half of the other results are over 60 FPS and the other half are playable but less smooth in that 30-59 FPS range.
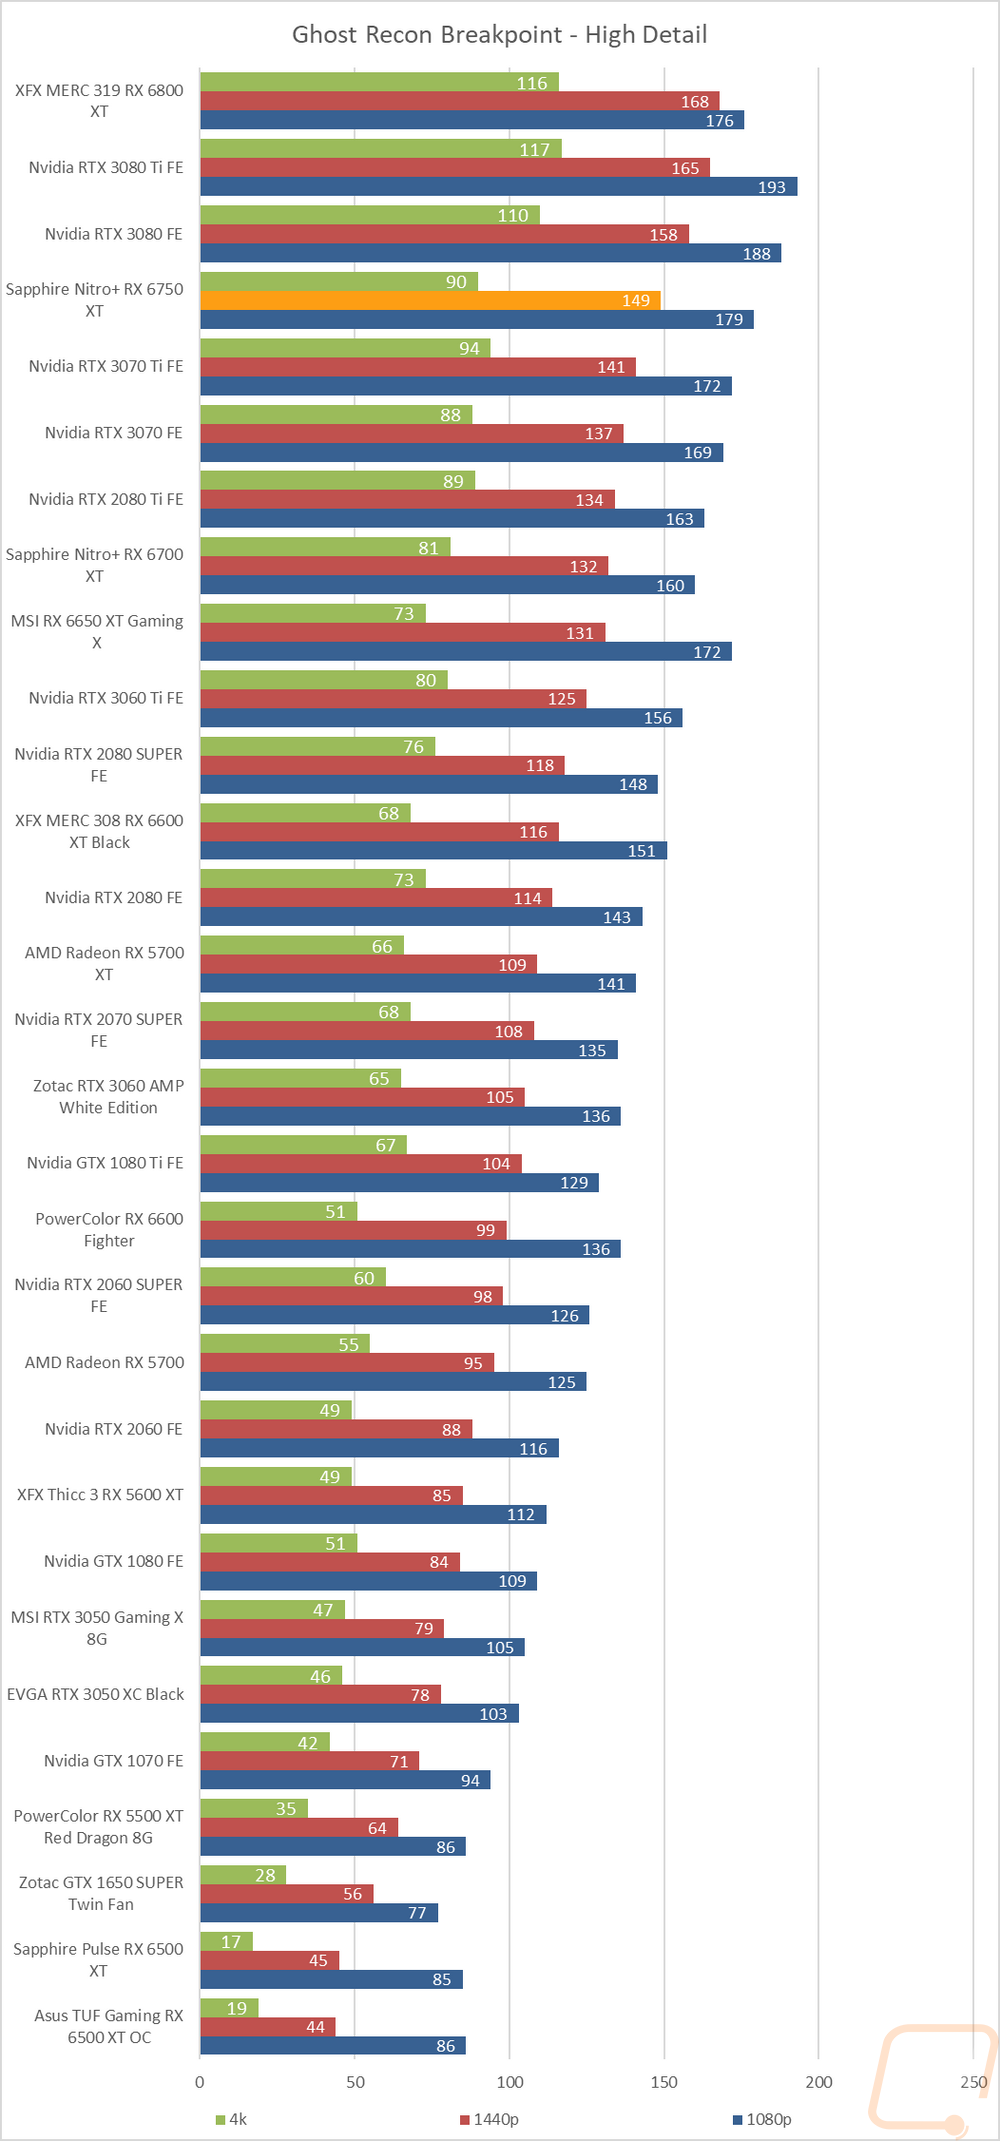
Of course, I have all of the actual in game results as well for anyone who wants to sort through the wall of graphs below. I also have averaged out all of the results from the 6700 XT, 6750 XT, 3060 Ti, and the 3070. Keep in mind that the Nitro+ RX 6750 XT and Nitro+ RX 6700 XT are both aftermarket cards whereas the other two are Founders Edition cards. But it does put the overall results into perspective. The increase in clock speed for the Nitro+ RX 6750 XT was enough to push up past the 3060 Ti on all of the results but does still come in behind the RTX 3070, especially at 4K resolutions.
|
|
1080p |
1440p |
4K |
|
Nitro+ RX 6700 XT |
164.59 |
127.17 |
72.93 |
|
RTX 3060 Ti FE |
166.19 |
125.22 |
69.99 |
|
Nitro+ RX 6750 XT |
172.24 |
135.76 |
77.44 |
|
RTX 3070 FE |
182.96 |
140.14 |
90.53 |