In-Game Benchmarks
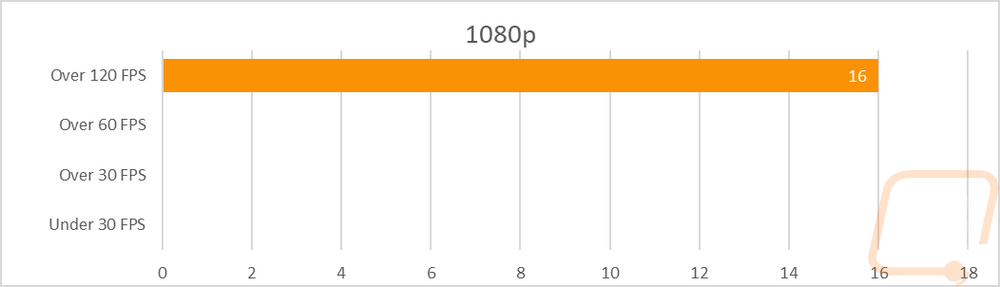
Now we finally get into the in game performance and that is the main reason people pick up a new video card. To test things out I ran through our new benchmark suite that tests 10 games at three different resolutions (1080p, 1440p, and 4k). Most of the games tested have been run at the highest detail setting and a mid-range detail setting to get a look at how turning things up hurts performance and to give an idea of if turning detail down from max will be beneficial for frame rates. In total, each video card is tested 54 times and that makes for a huge mess of results when you put them all together. To help with that I like to start with these overall playability graphs that take all of the results and give an easier-to-read result. I have one for each of the three resolutions and each is broken up into four FPS ranges. Under 30 FPS is considered unplayable, over 30 is playable but not ideal, over 60 is the sweet spot, and then over 120 FPS is for high refresh rate monitors.
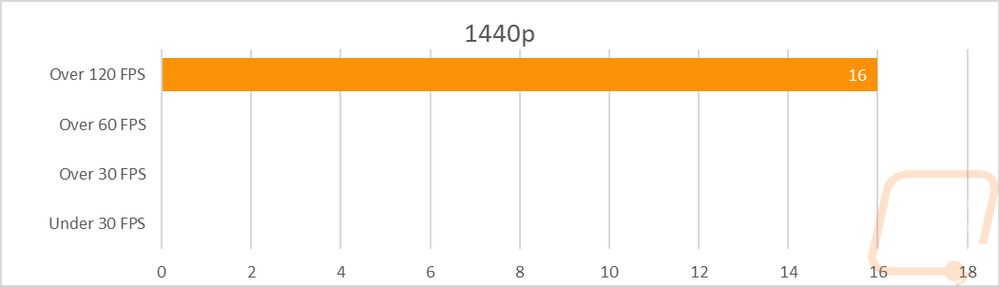
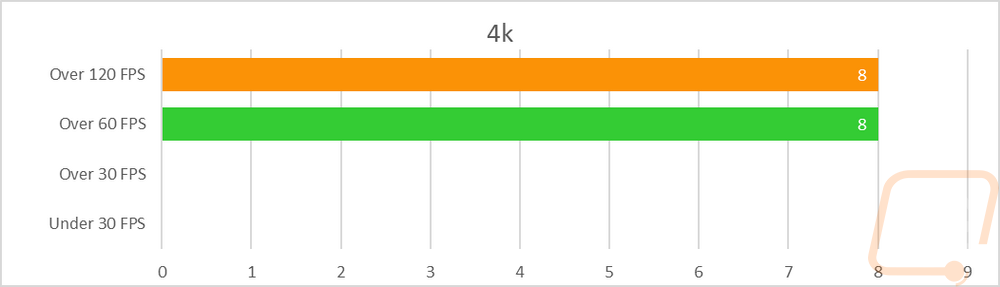
So how did the RTX 4080 Founders Edition do? Well when looking at the playability graphs, much like its bigger brother the RTX 4090, the RTX 4080 Founders Edition dominated all of our tests at 1080p and 1440p with every single result coming in over 120 FPS. It is only at 4K can we get an idea of performance at all with these charts and even there the RTX 4080 Founders Edition didn’t have any trouble with any of our tests. Exactly half of them came in at 60 FPS or higher and half were up over 120 FPS as well. For comparison, the 4090 had just two results up under 120 FPS at 4K but the RTX 4080 Founders Edition is still a monster as well and that is before figuring DLSS 3 into the mix.
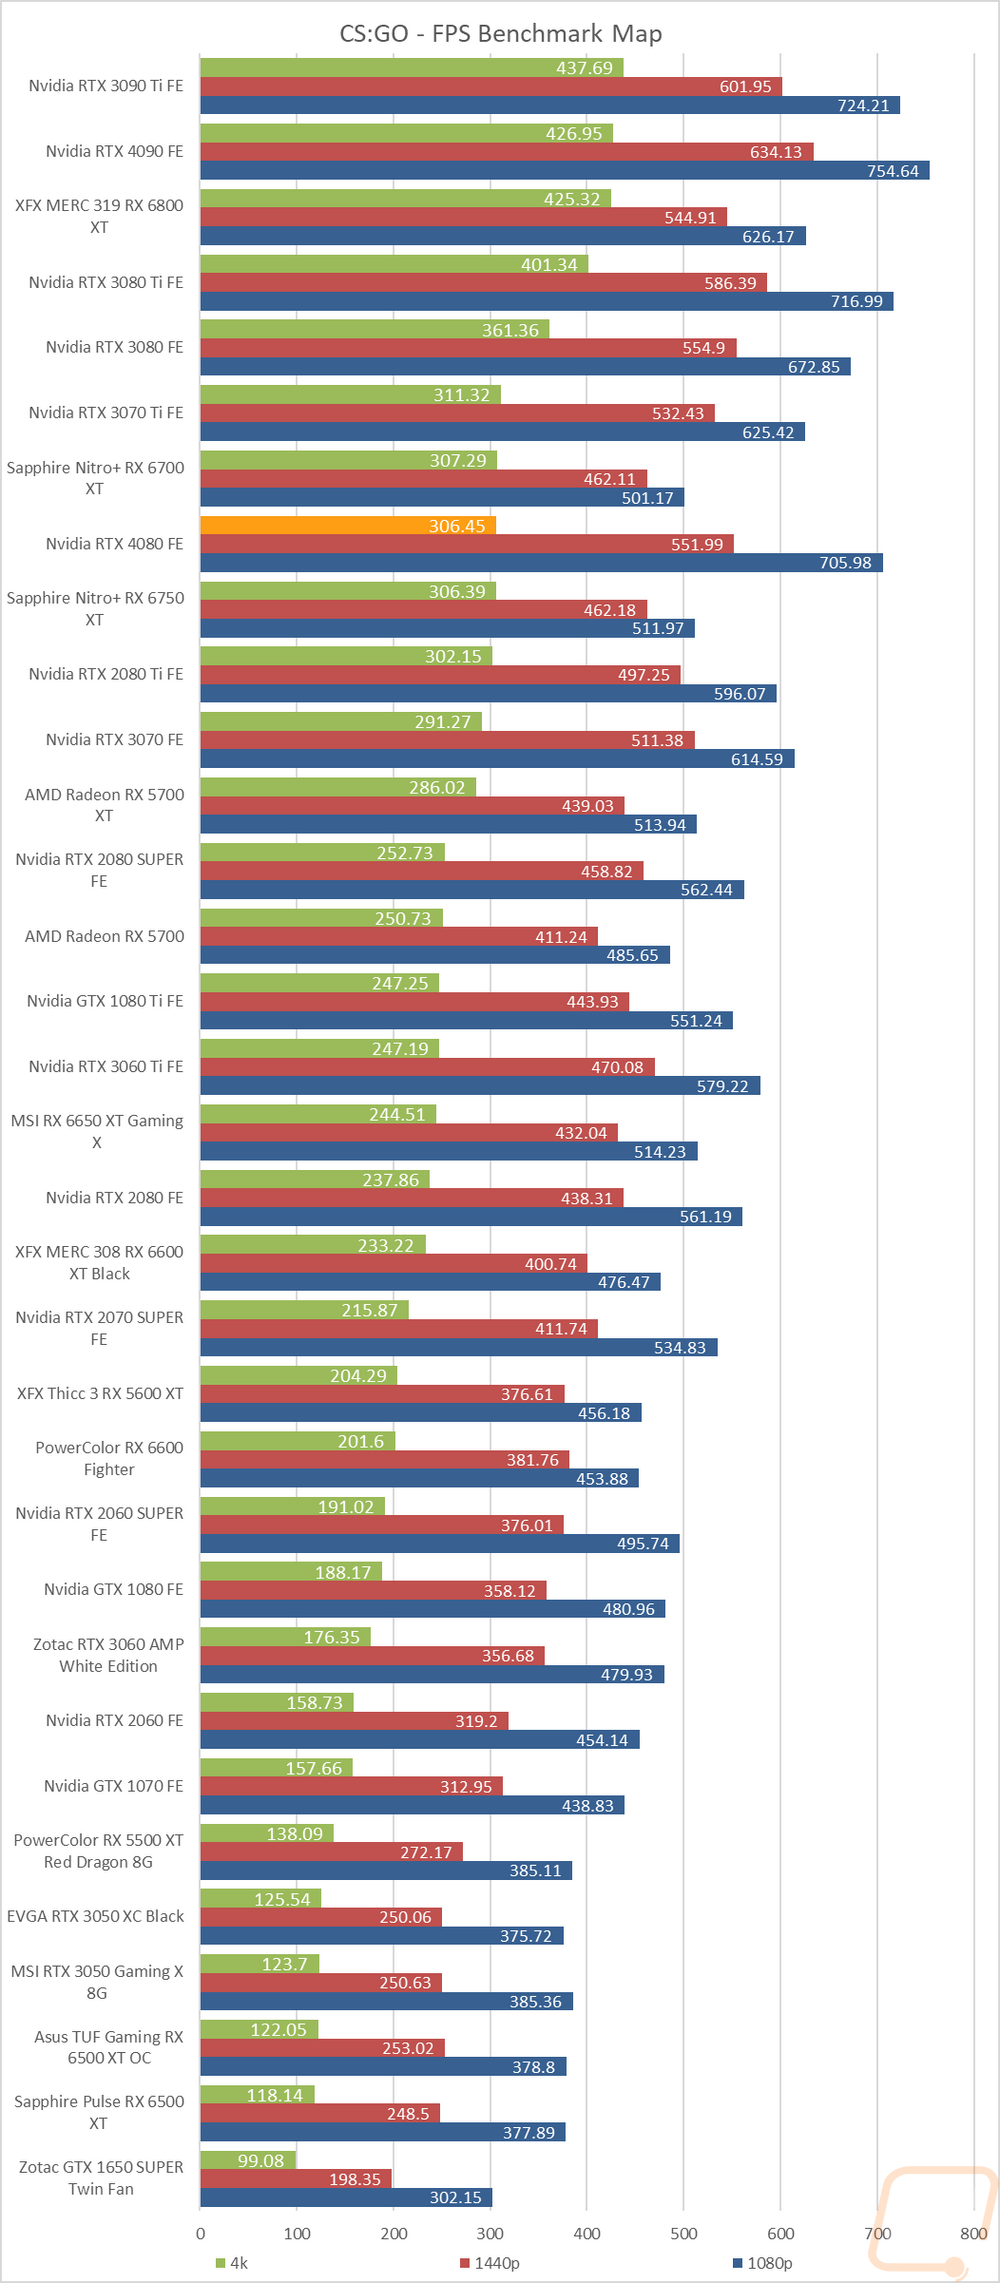
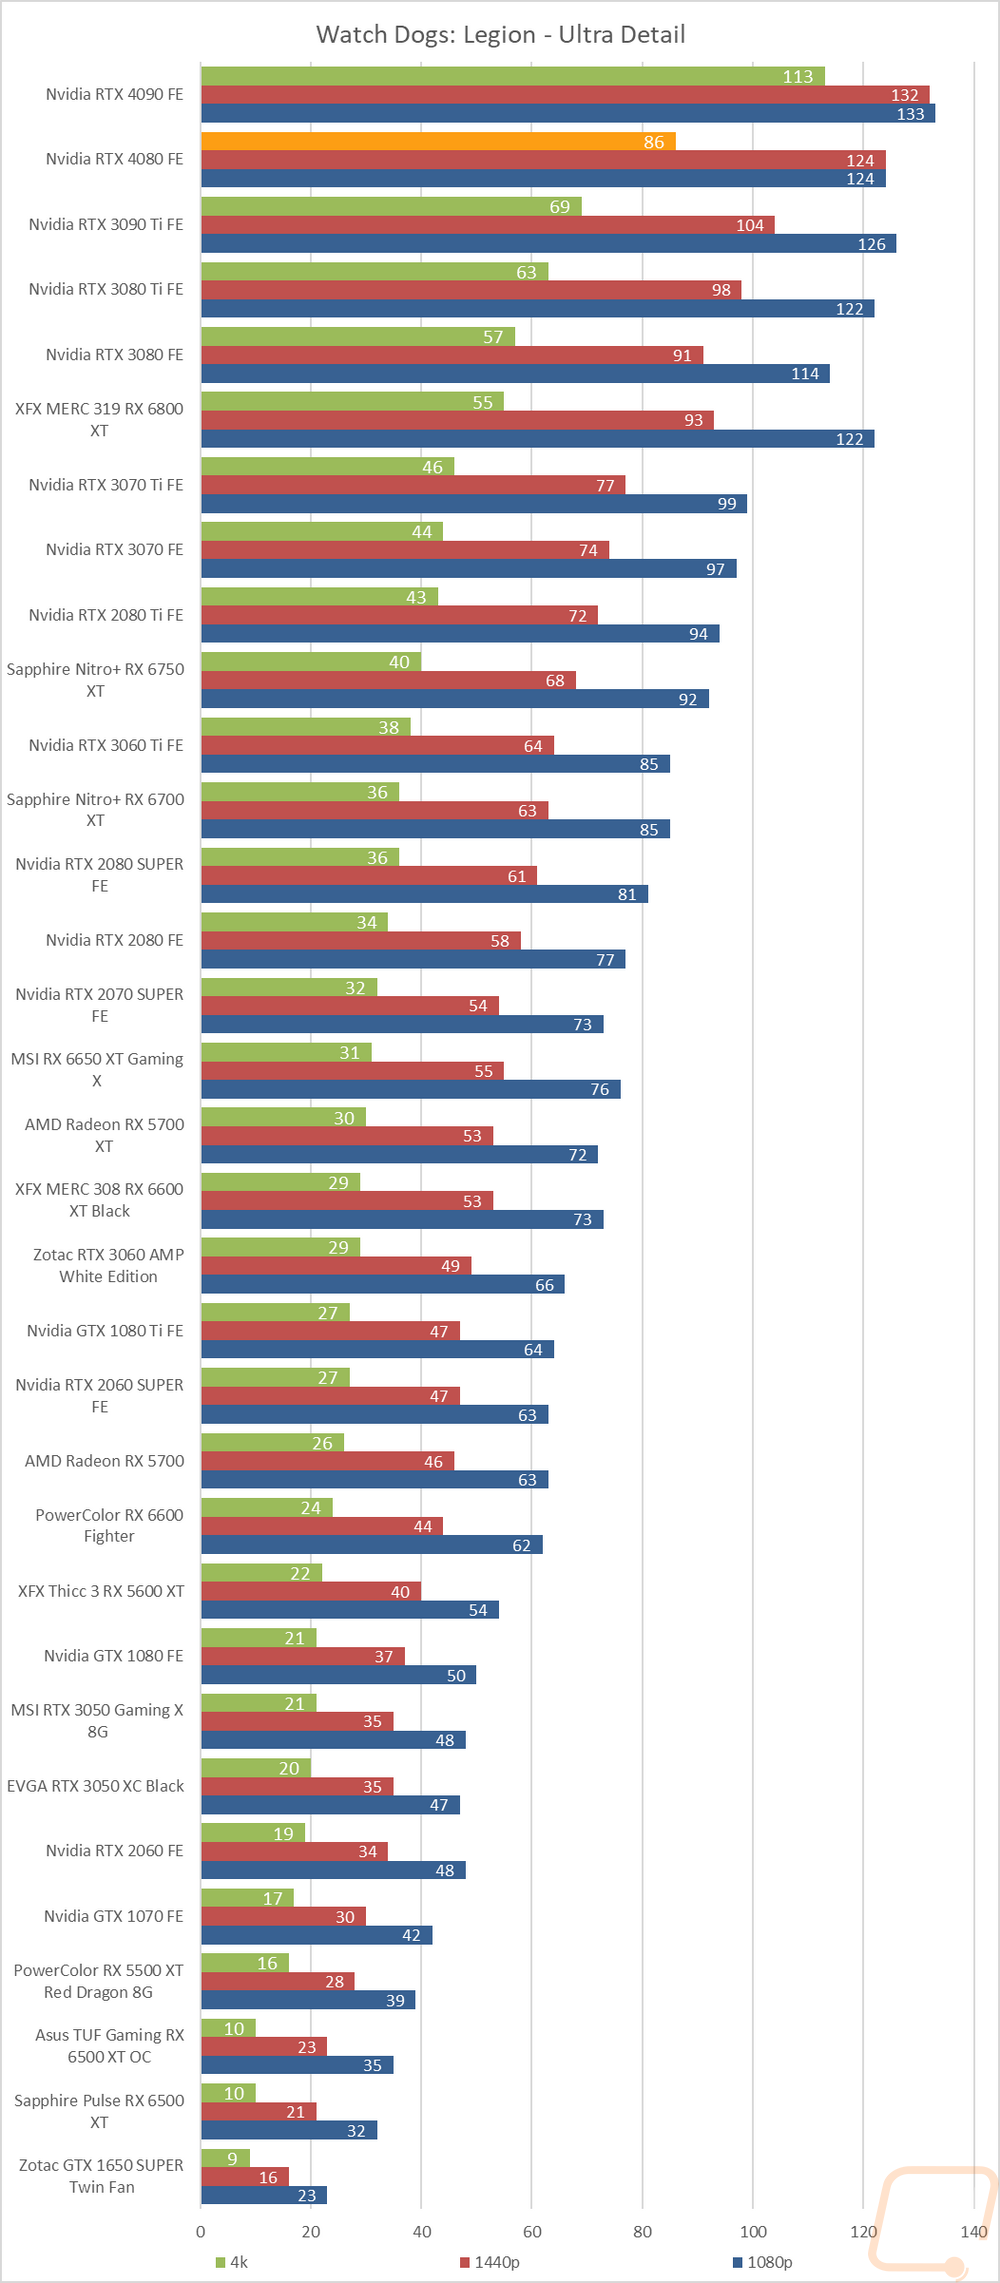
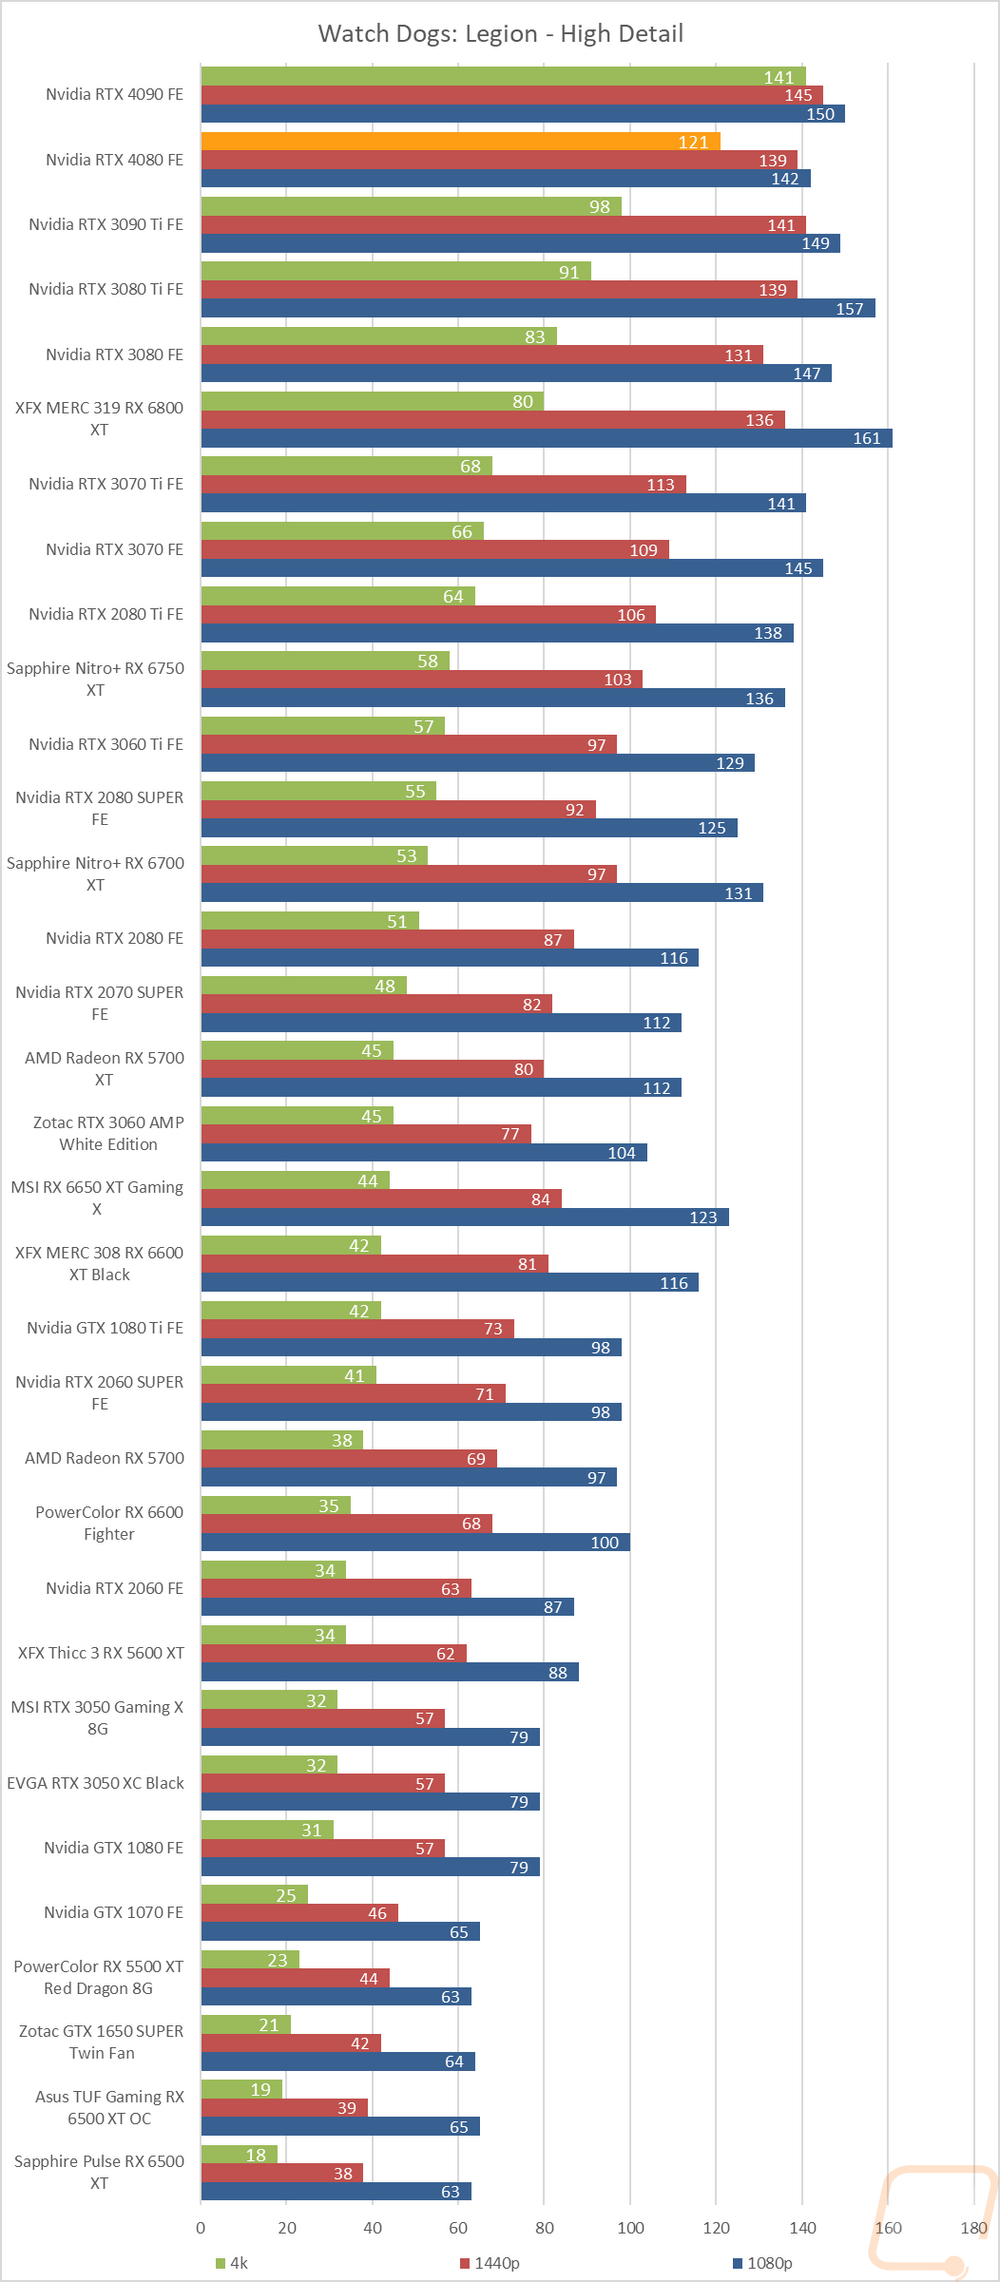
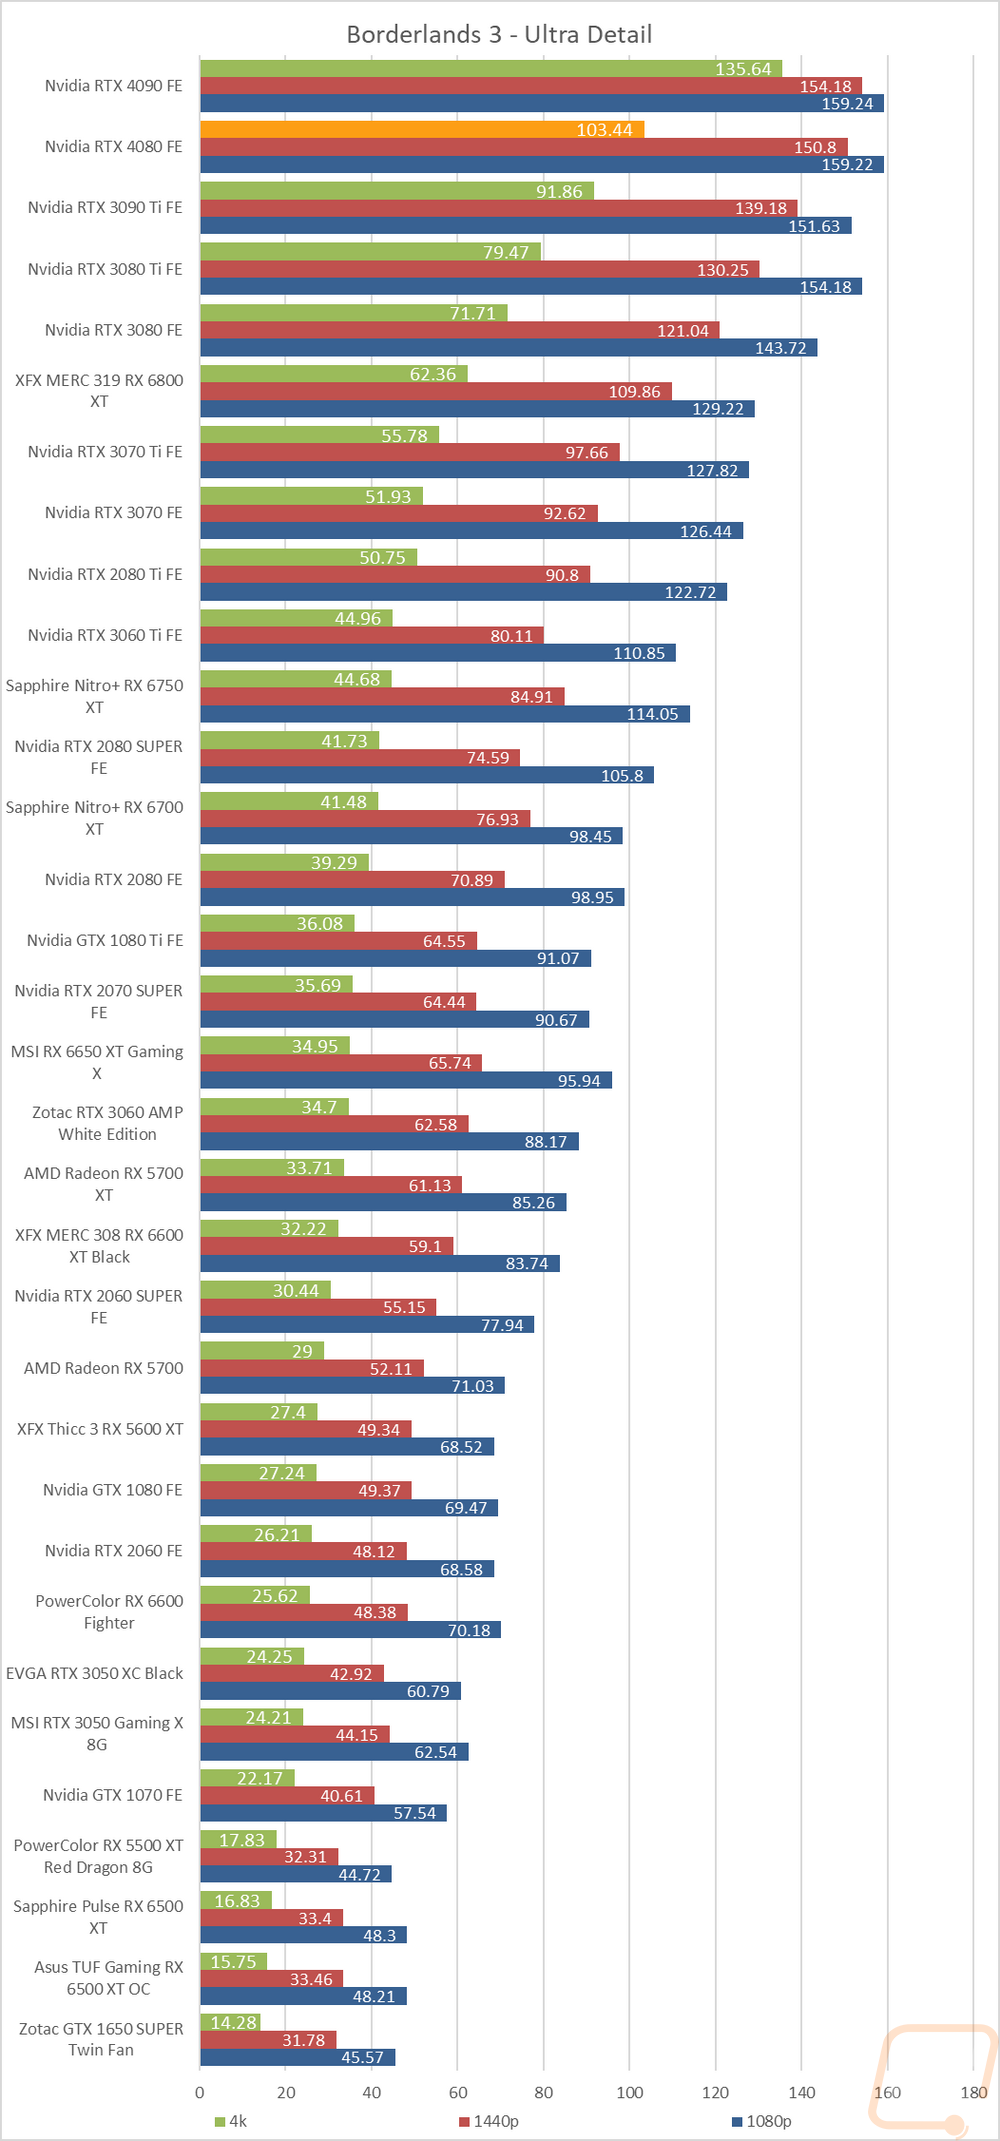
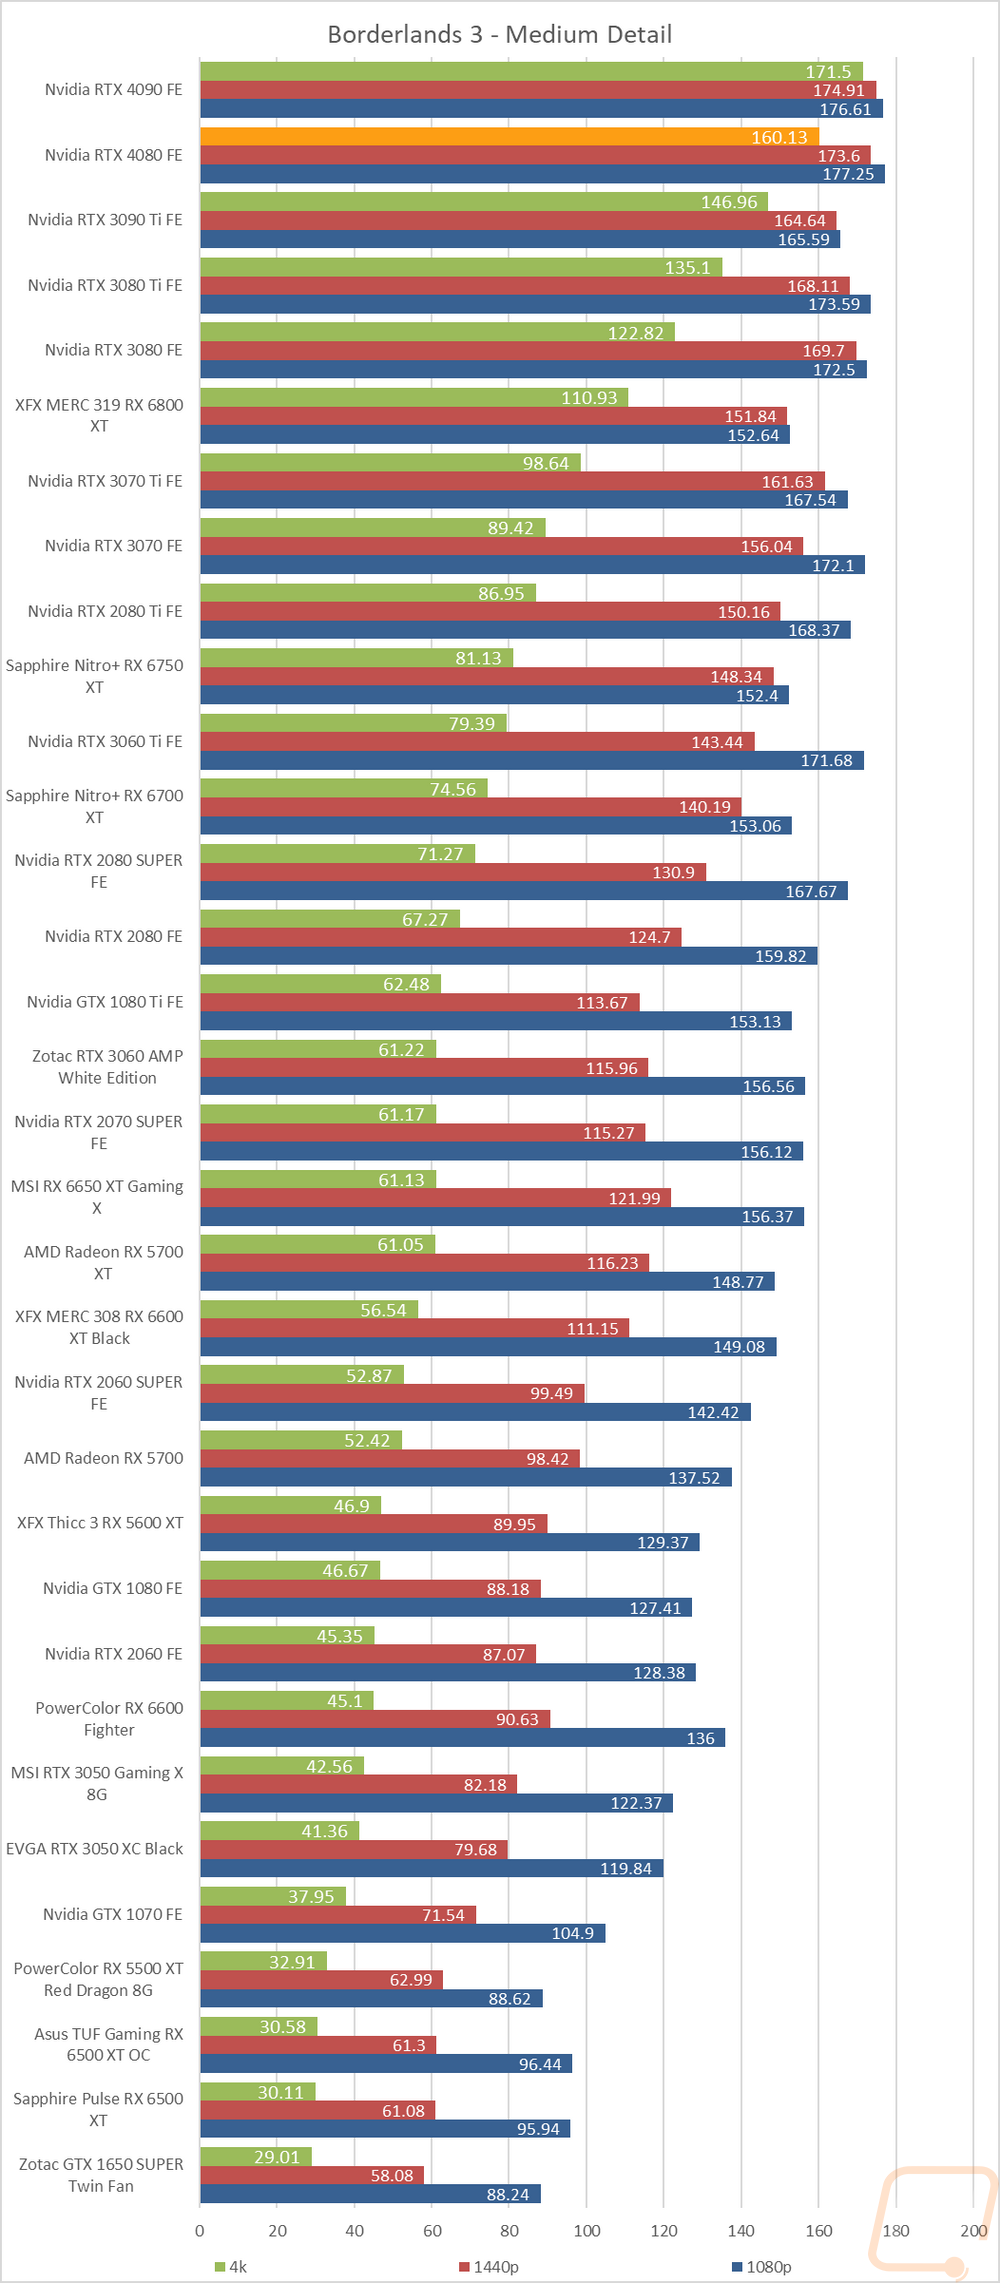
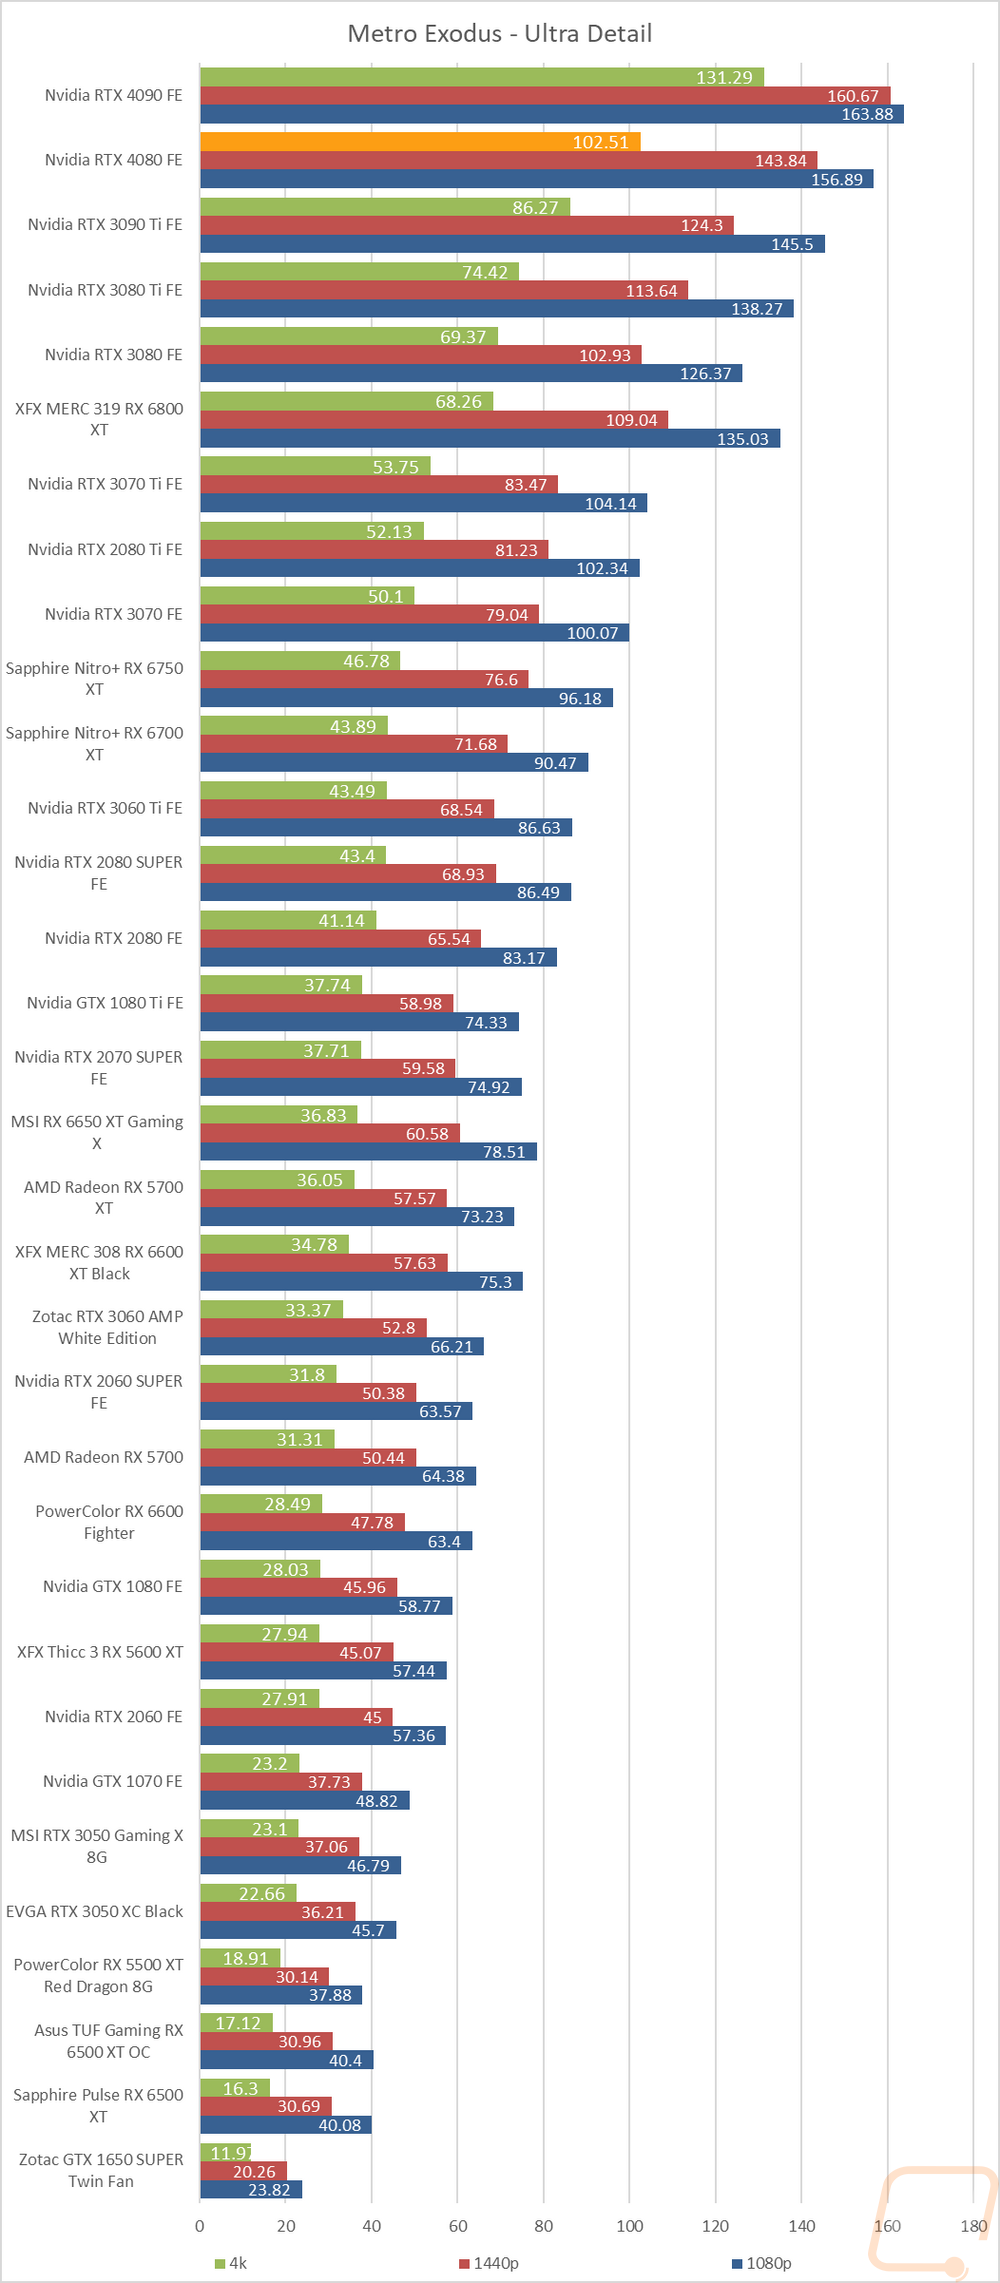
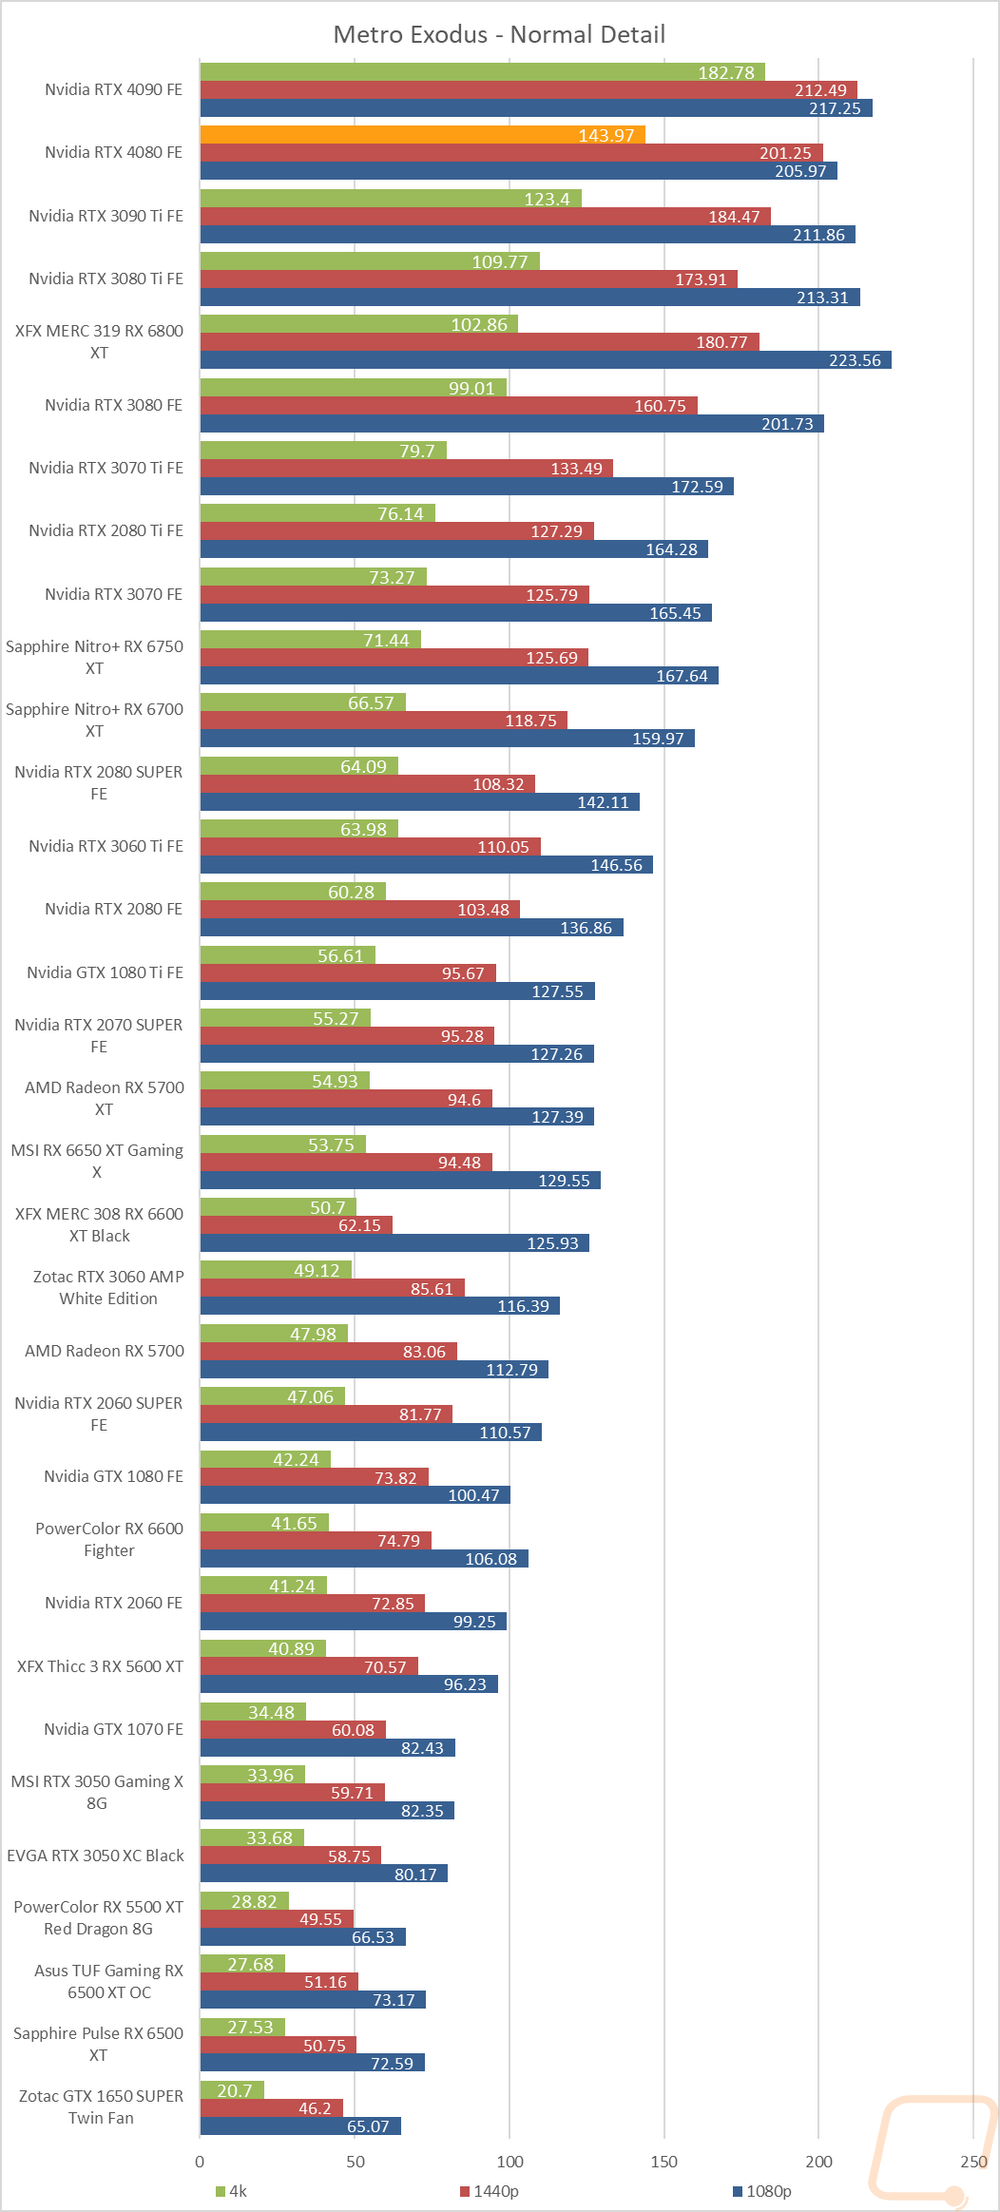
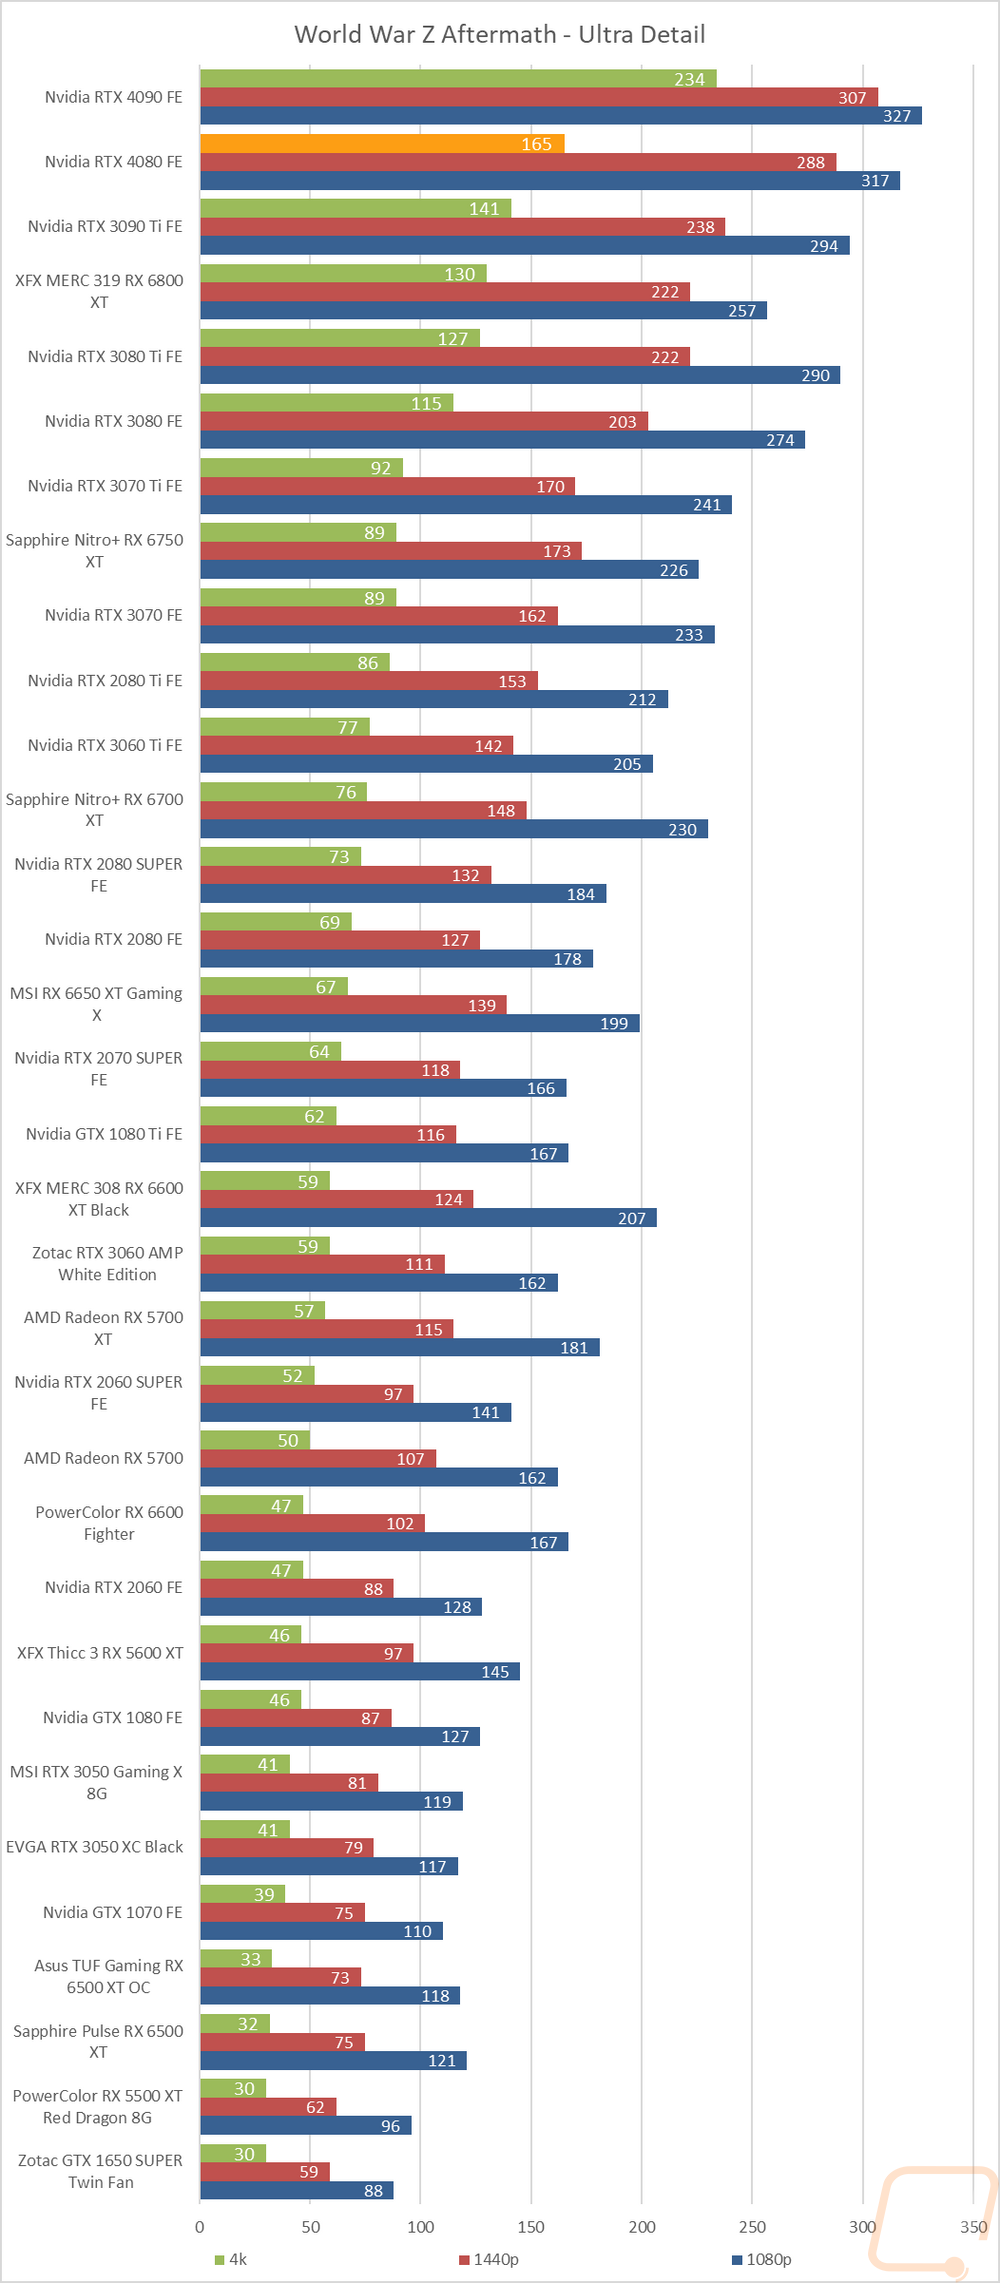
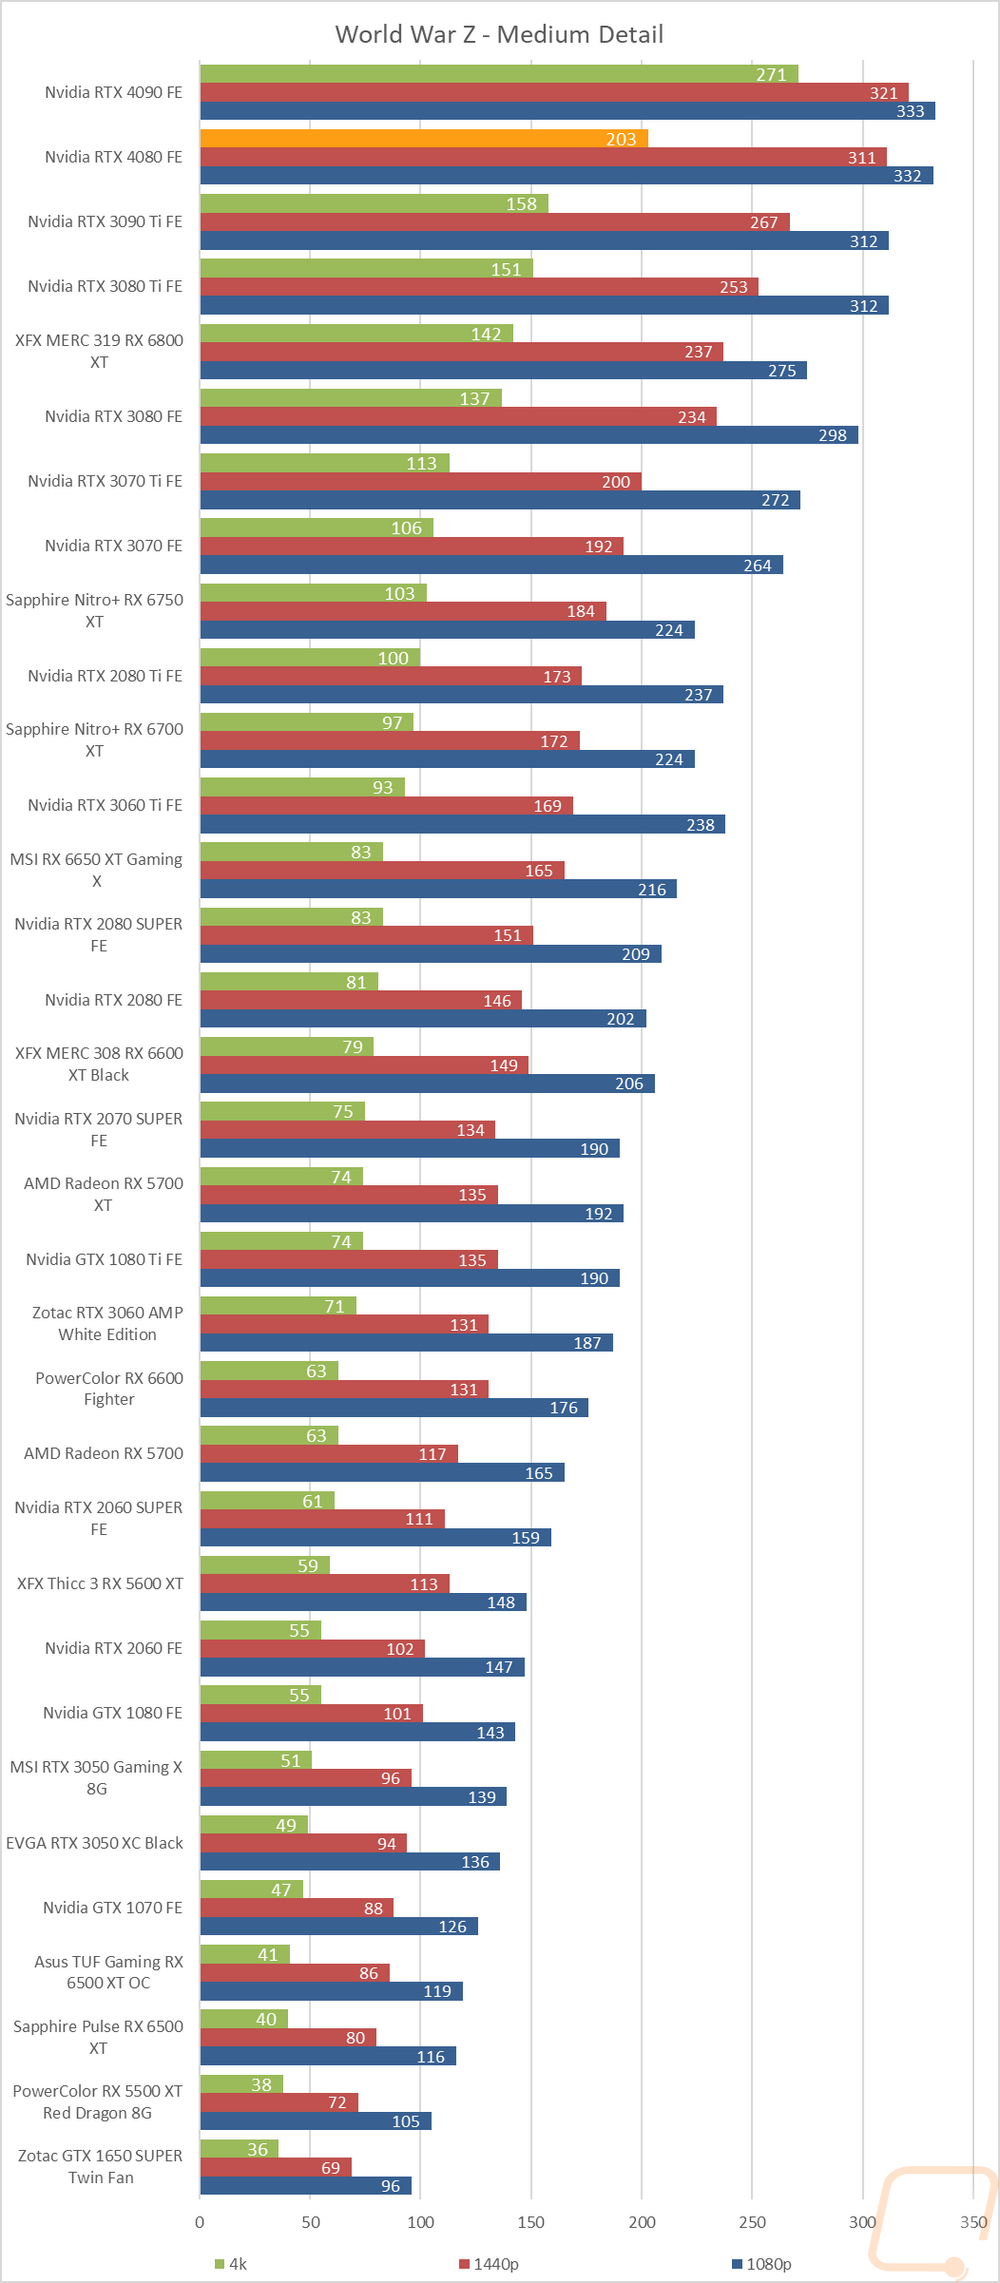
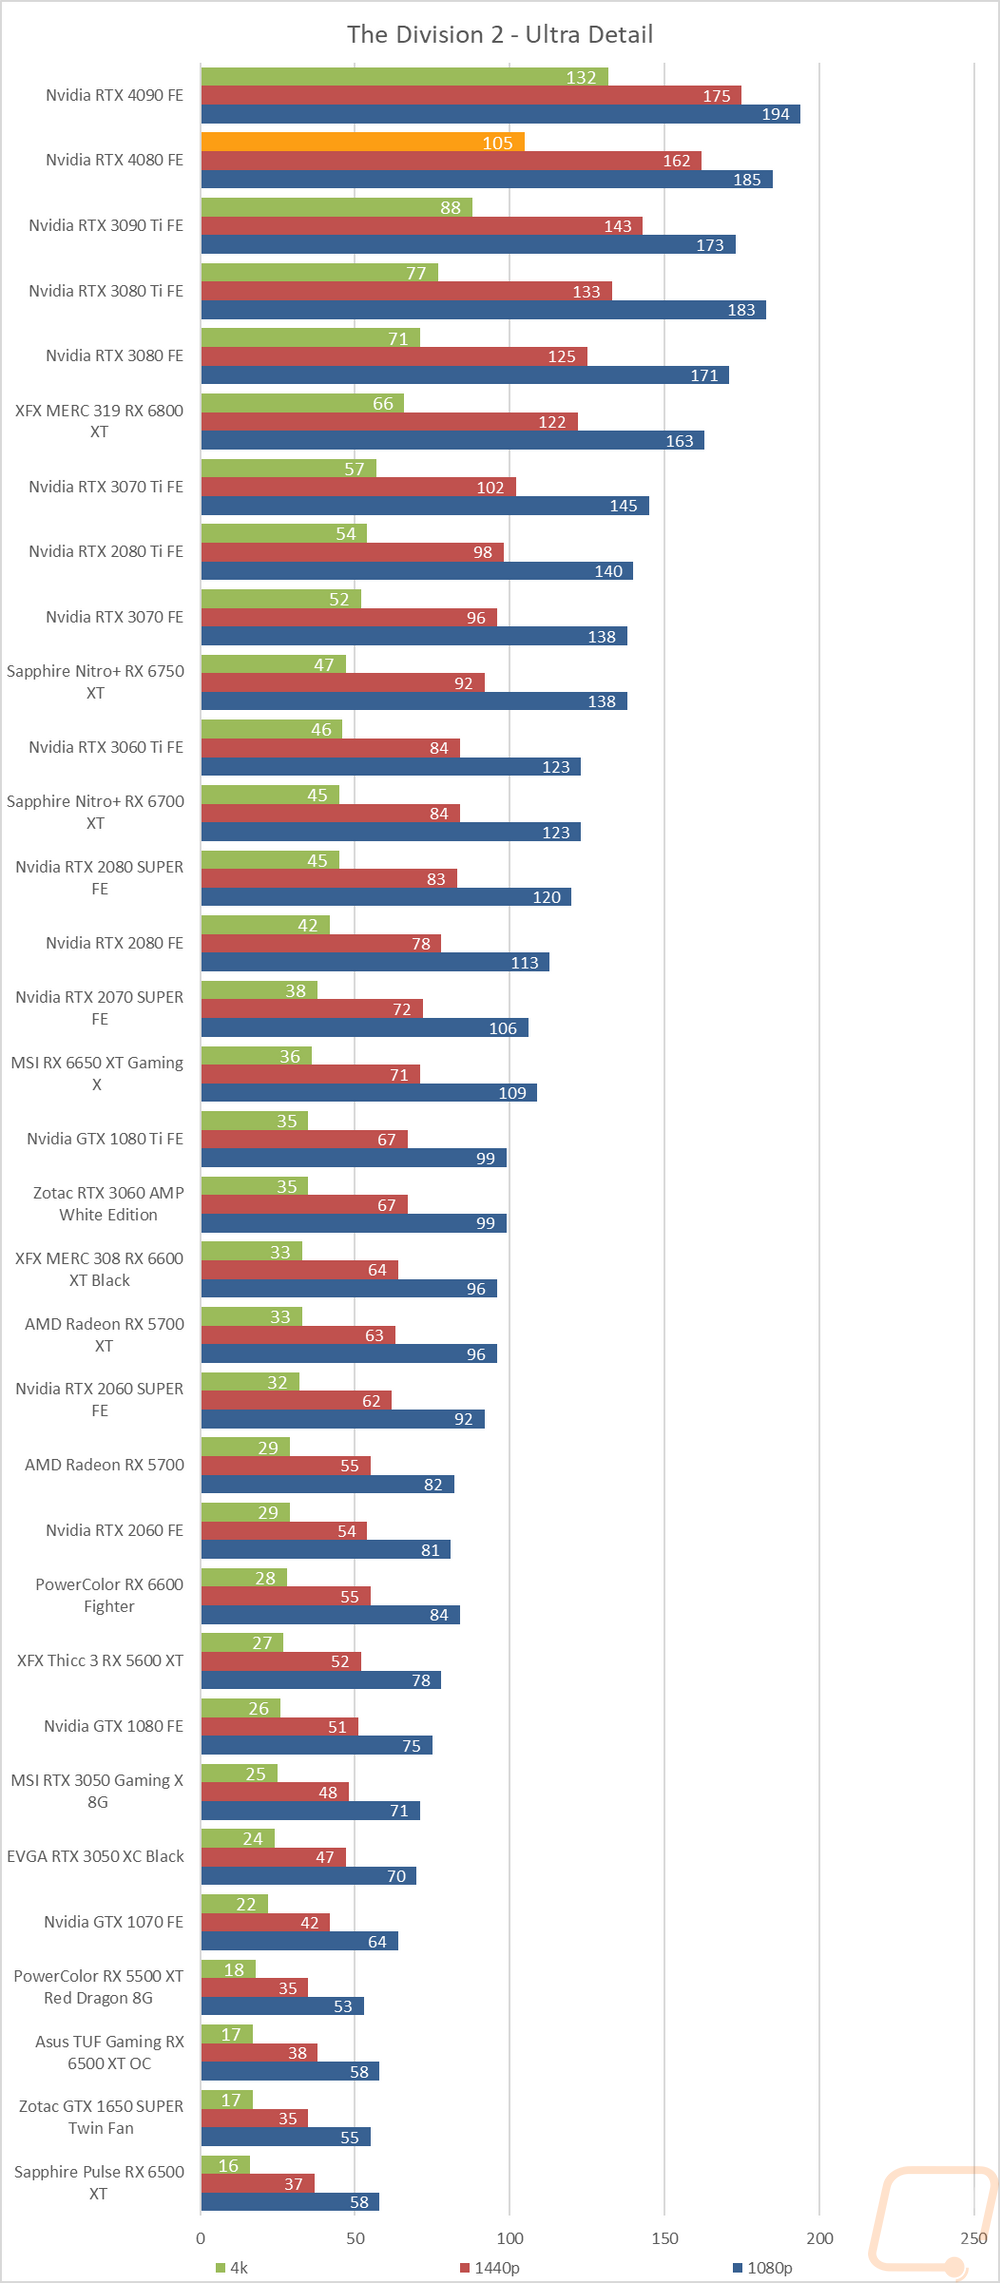
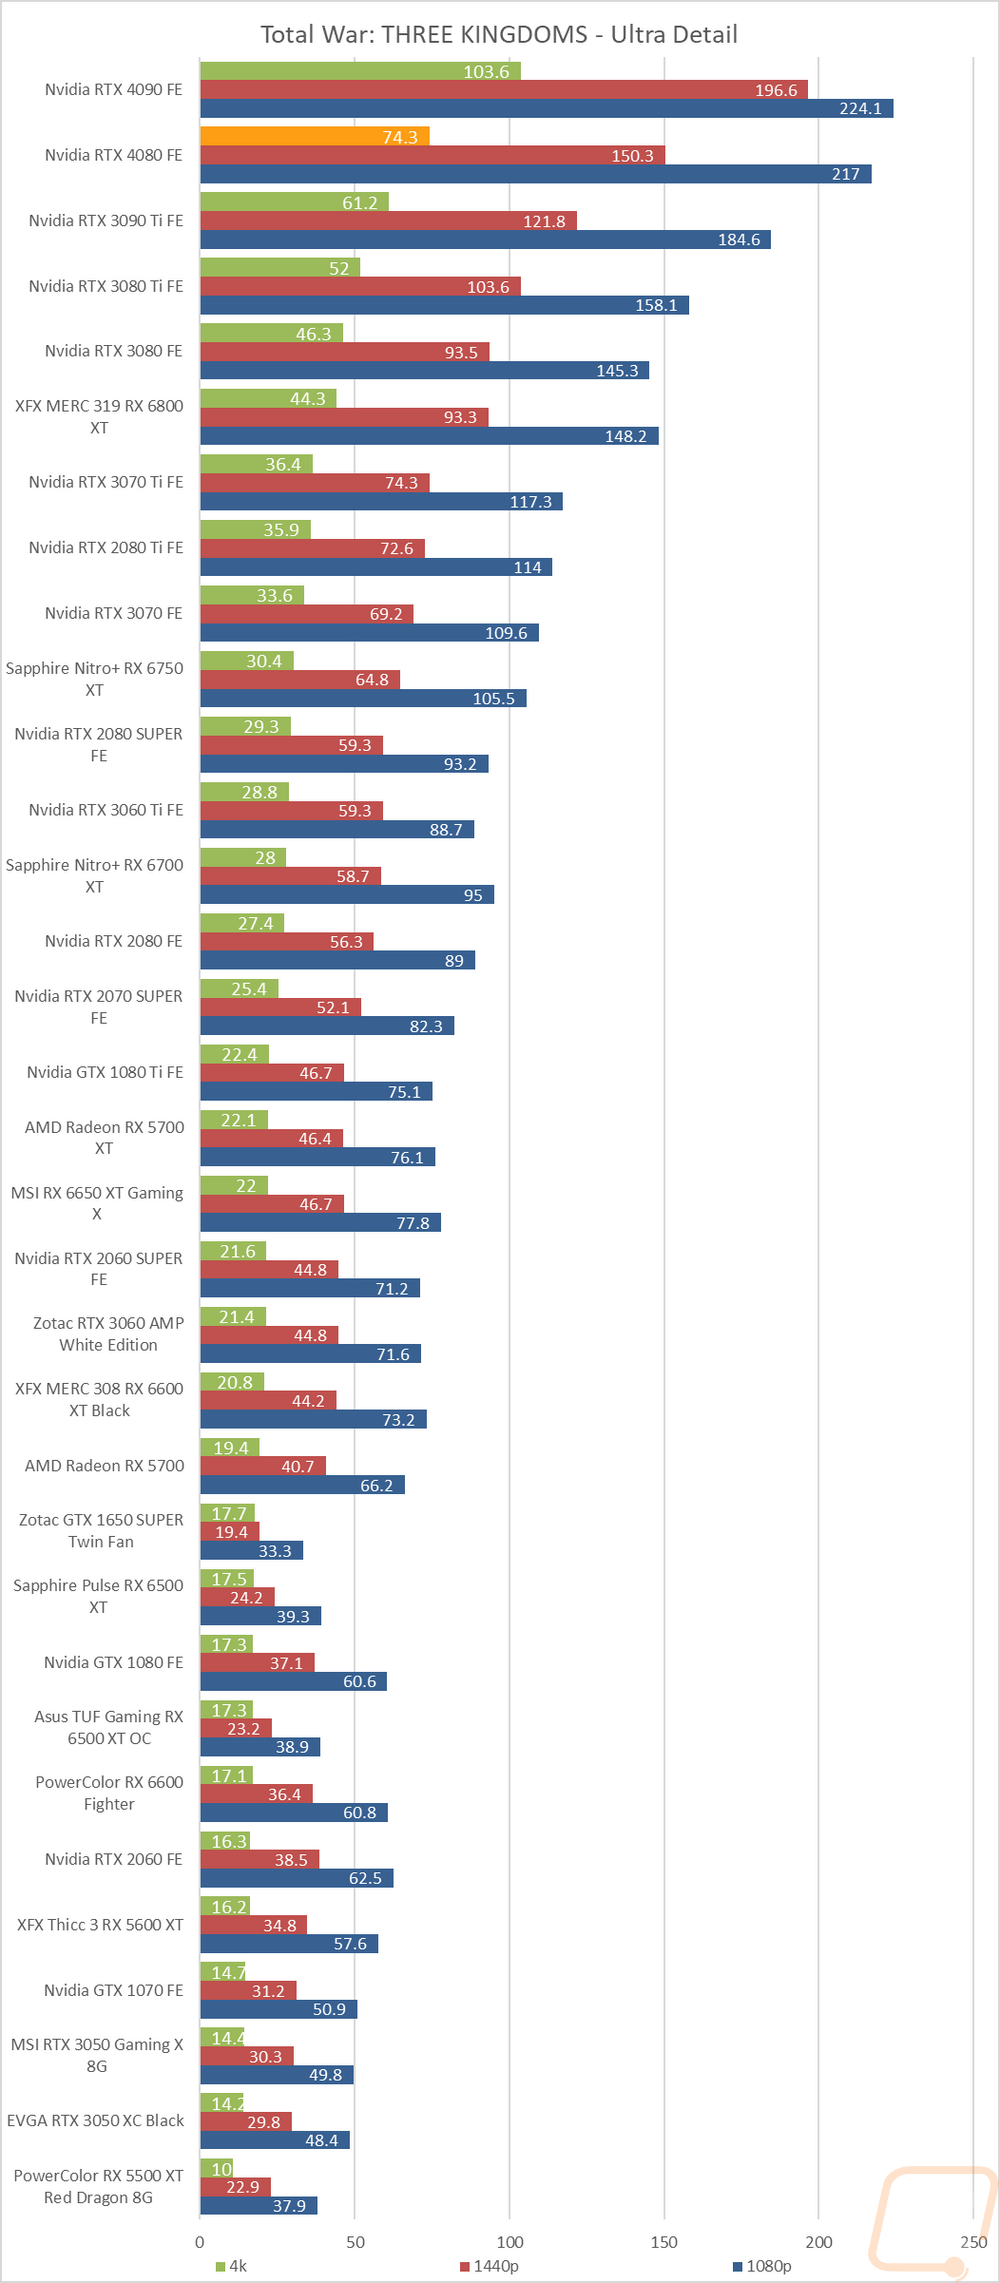
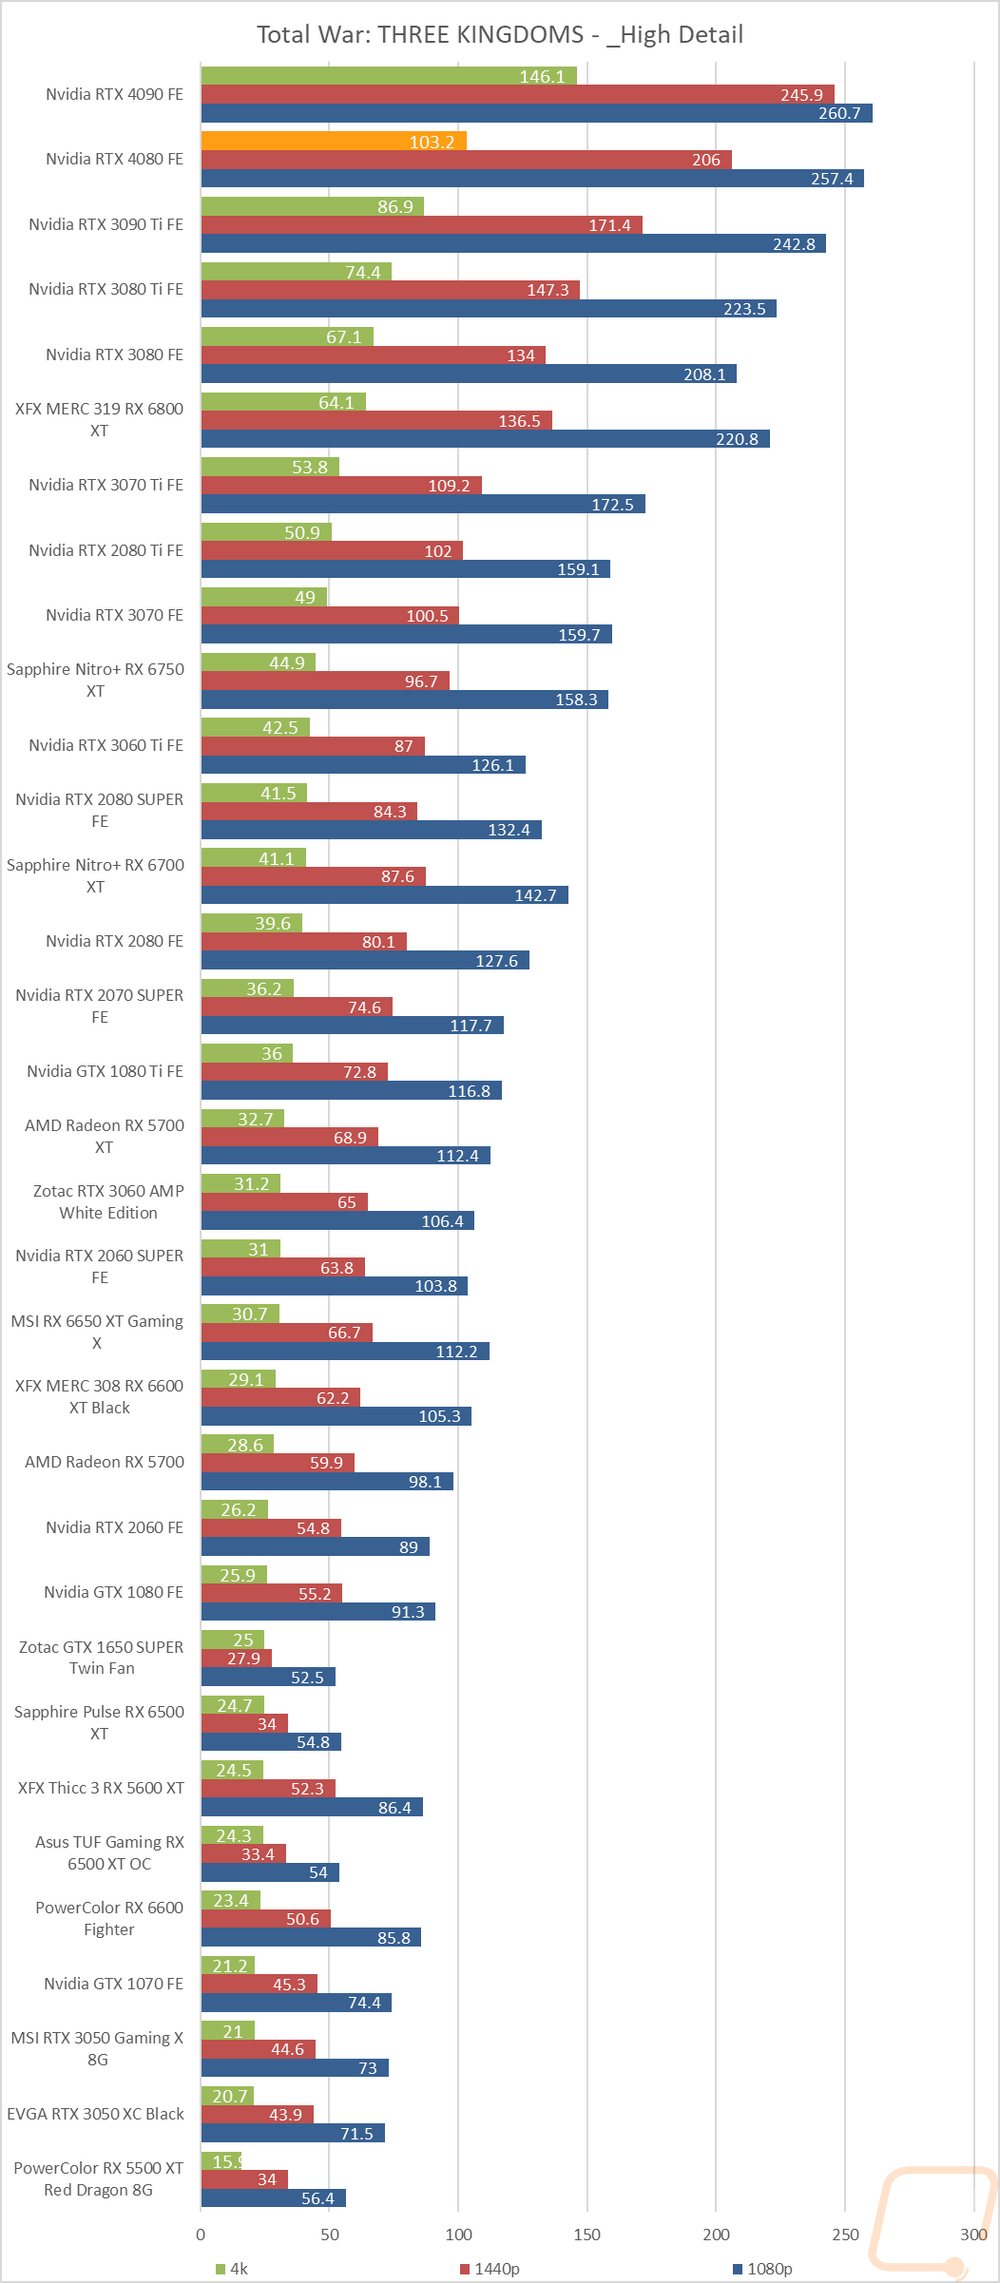
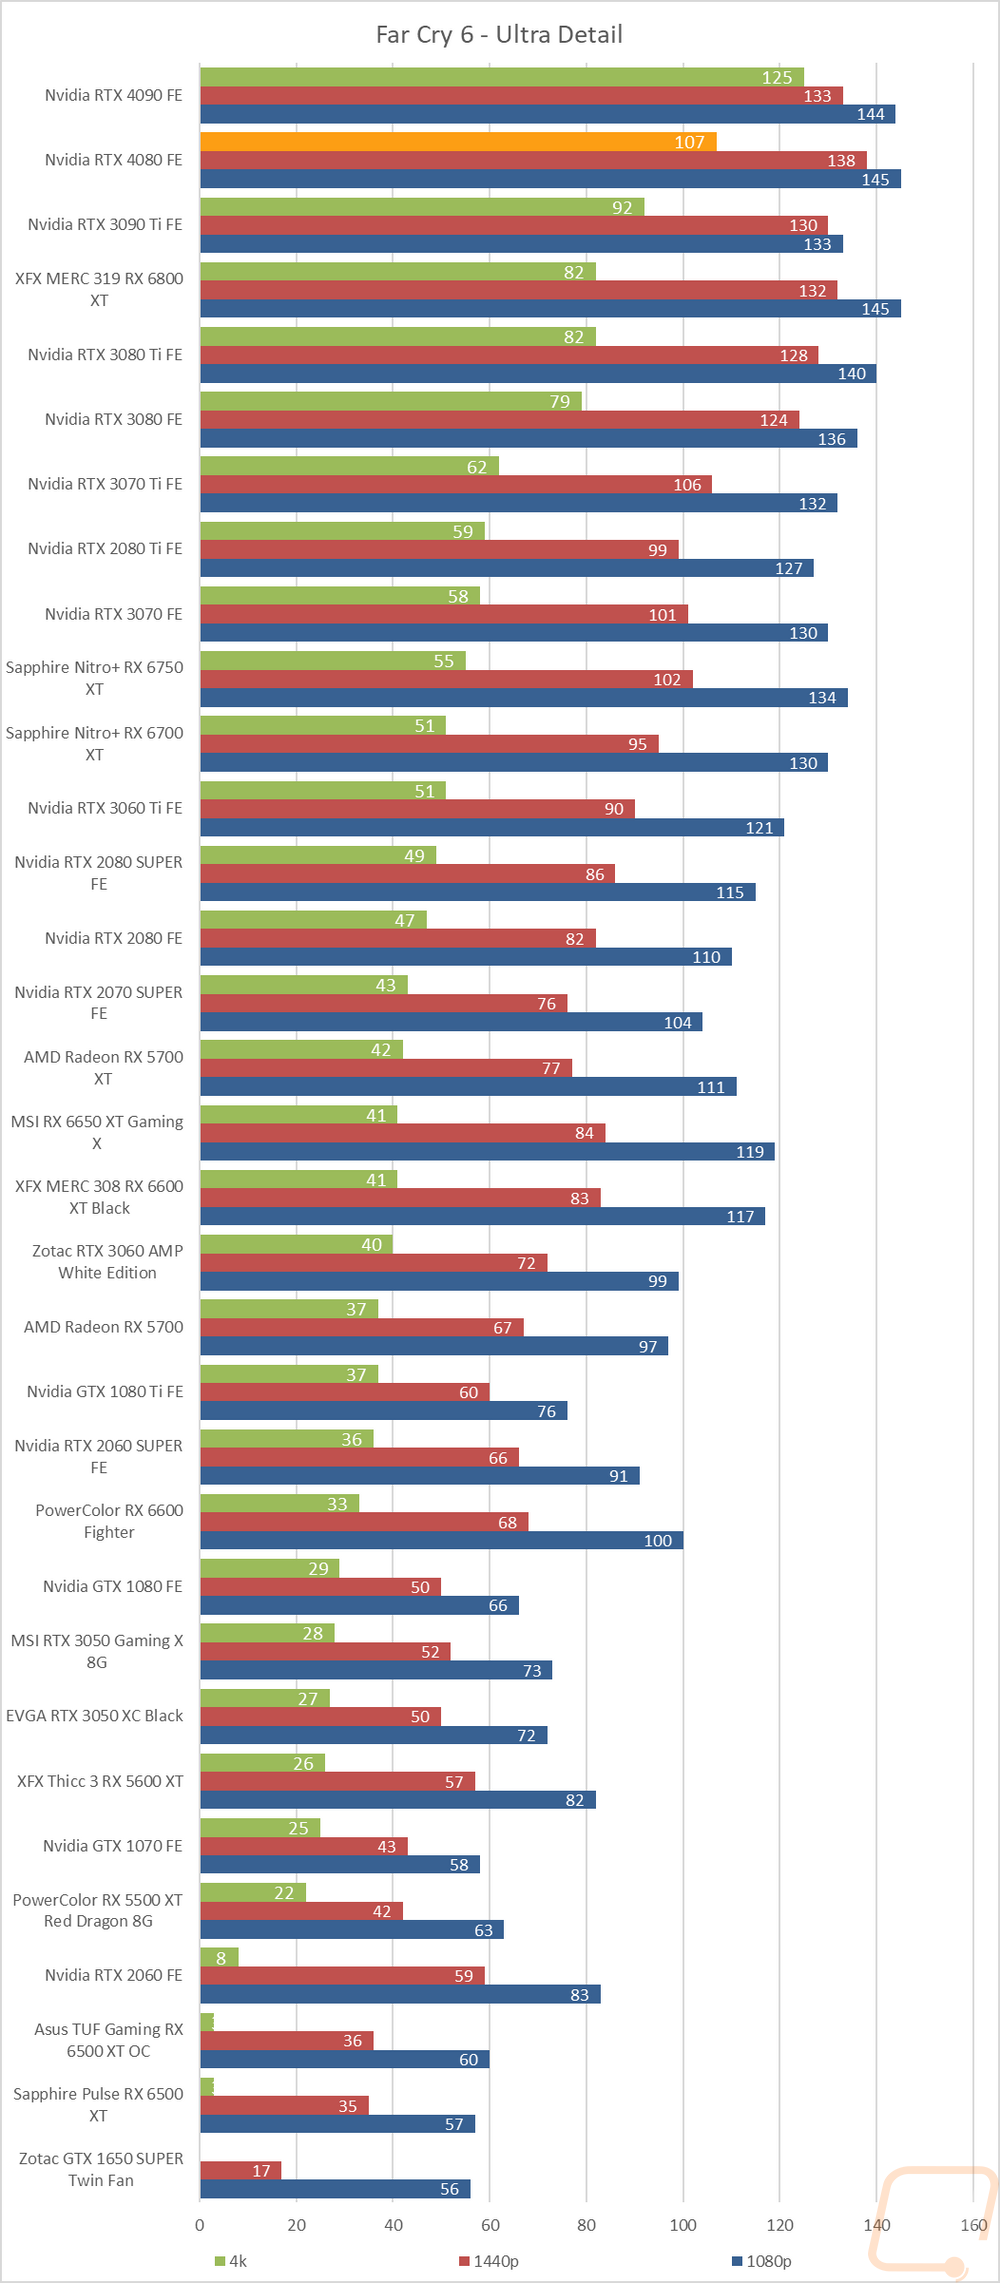
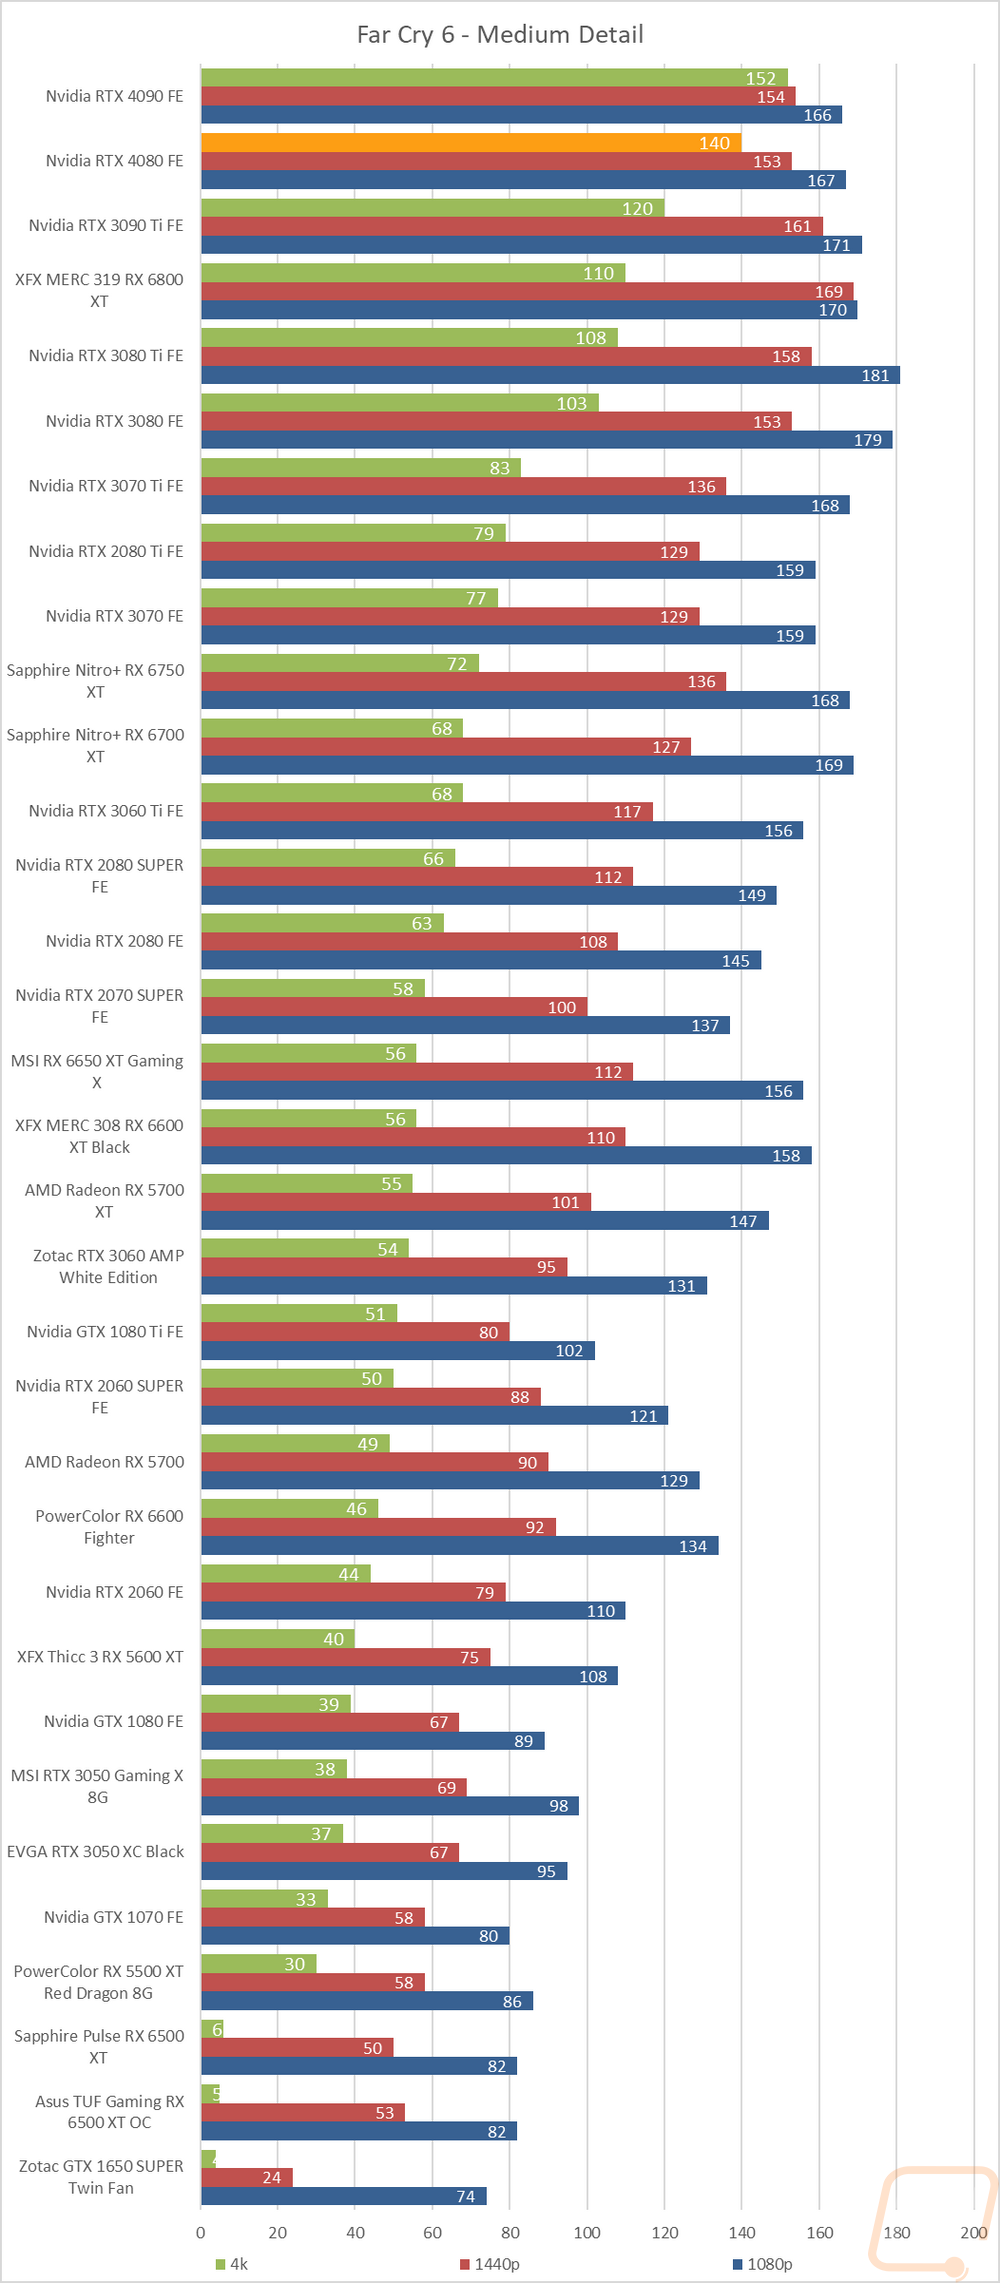
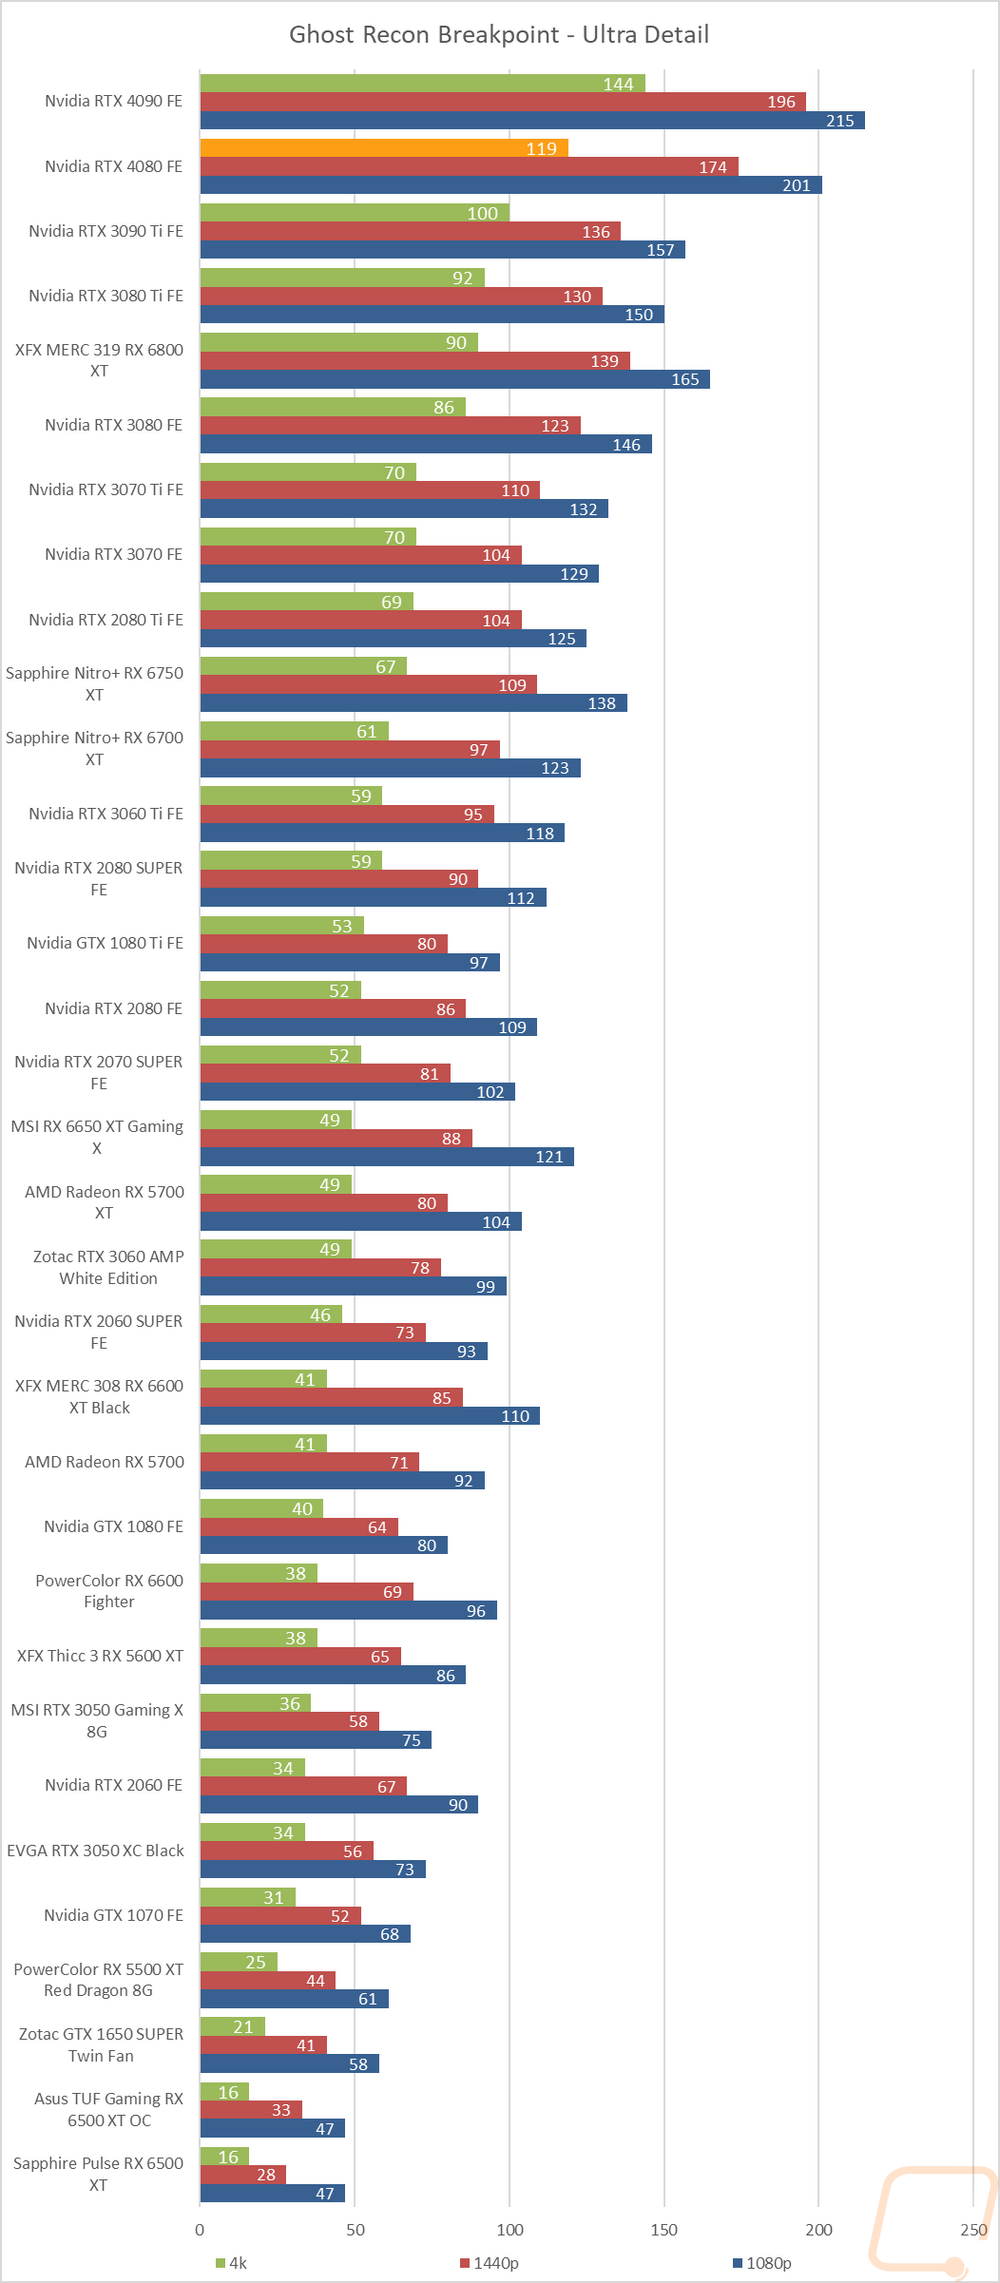
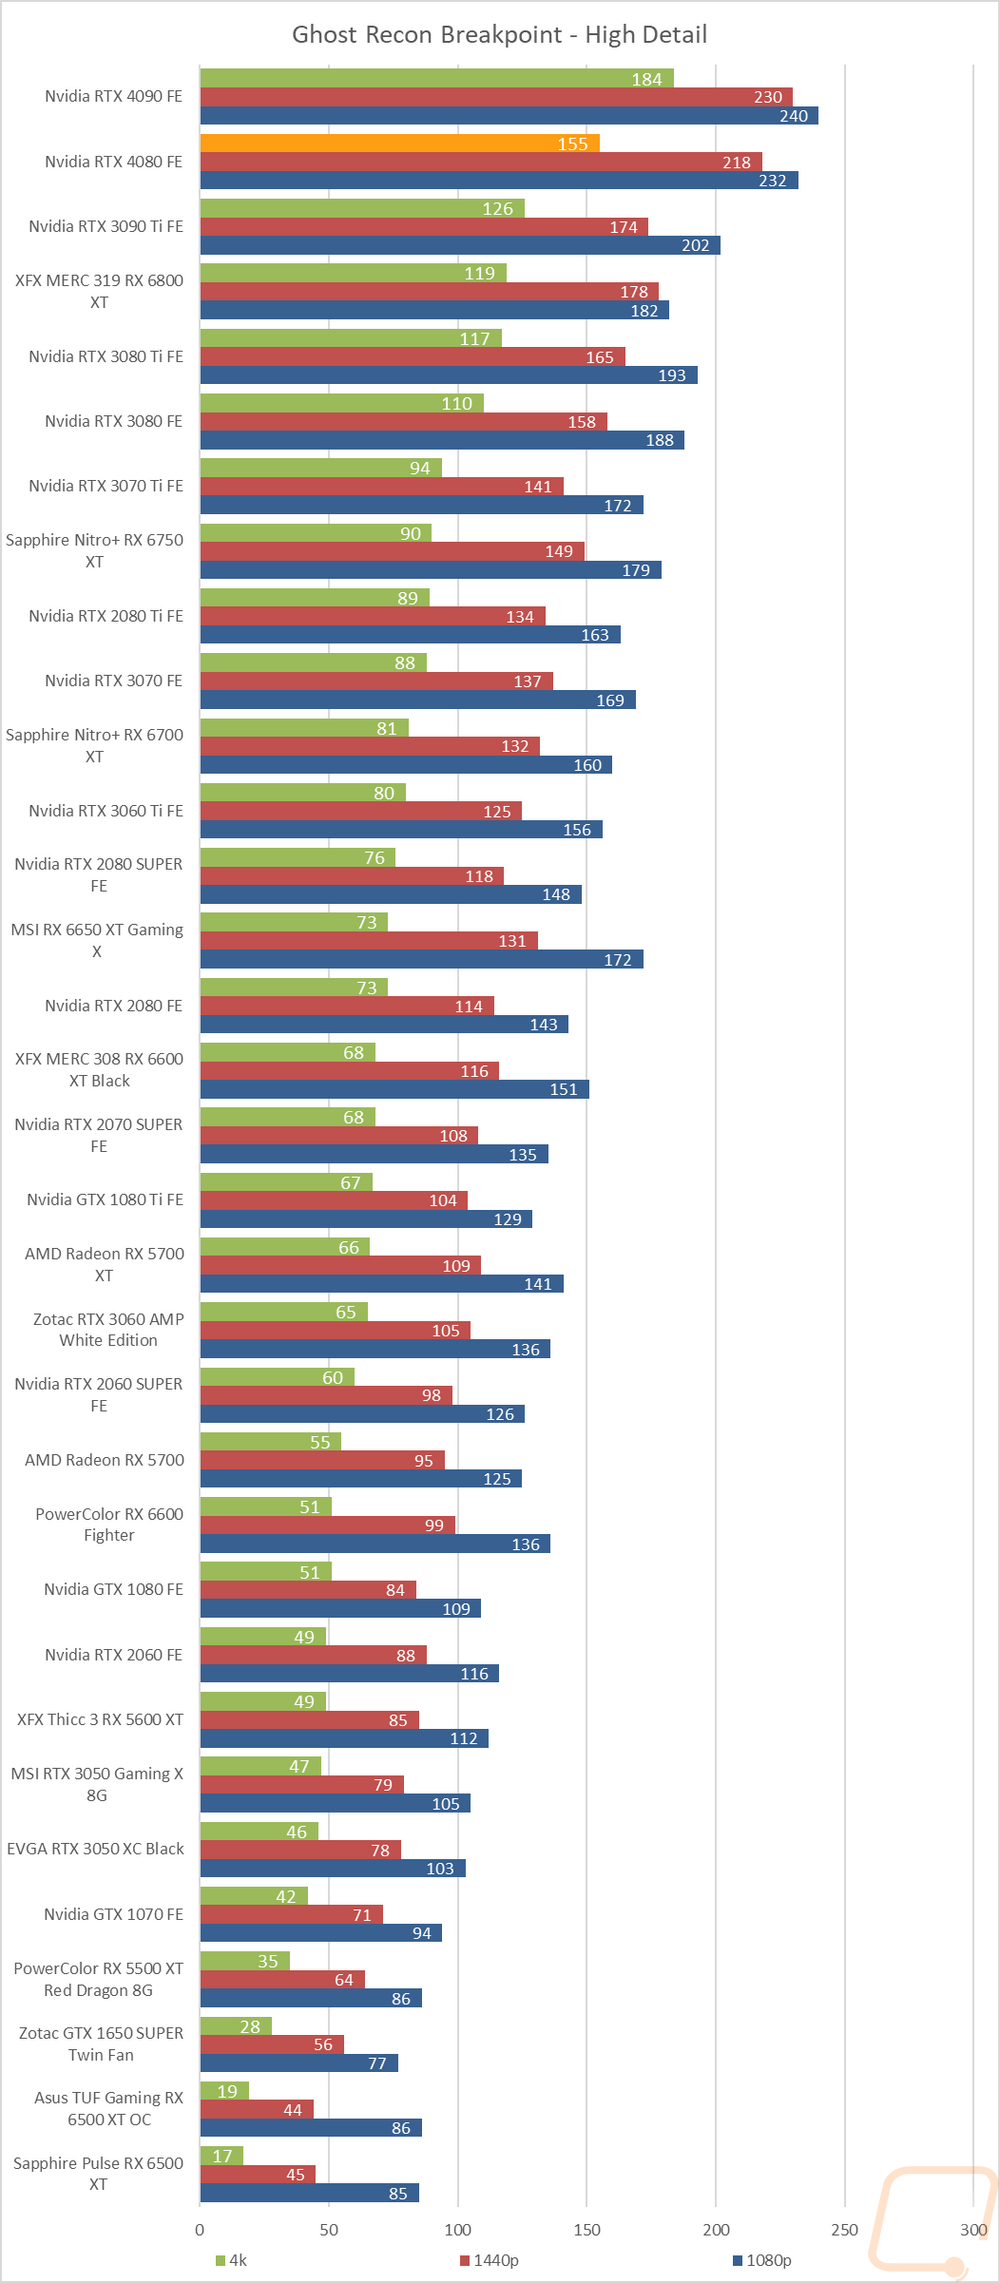
Of course, I have all of the actual in game results as well for anyone who wants to sort through the wall of graphs below. Except for our first result in CS:GO the RTX 4080 Founders Edition sits in second behind the RTX 4090 in all of the test results when sorting them by 4K. 1080P results are out the window because in almost every test those are CPU limited and we see the same in a lot of the 1440p results as well. When I average the numbers out but take out CS:GO because it is so high it breaks the average the RTX 4080 stays close to the 4090 at 1440p at 182 and it averages at 126 FPS at 4k, a big improvement over the 3080 Ti which averaged 96 FPS and comes in 23% less than the 4080s performance. As far as individual results, really only the CS:GO result is the only thing that stands out and even that is mostly just the performance at 4K. The 4080 Founders Edition came in below the RTX 3080 which makes me wonder if the 4K performance is limited by the smaller 256-bit memory interface combined with the extremely high frame rates that CS:GO sees. I’ve spoken with Nvidia about this one and am waiting to hear back from them on it. That said complaining about 300+ FPS is about as first-world problem as you can get. Even with that slowdown, you are well above the highest refresh rate available on a 4K monitor and also above the max 4K refresh rate of DisplayPort 1.4 which this card has so it isn’t a big deal.
|
|
1440p Average FPS |
% -/+ to the 4080 perf |
4k Average FPS |
% -/+ to the 4080 perf |
|
RTX 4090 |
195 |
+7% |
158 |
+25% |
|
RTX 4080 |
182 |
0% |
126 |
0% |
|
RTX 3090 Ti |
153 |
-16% |
106 |
-16% |
|
RTX 3080 Ti |
151 |
-17% |
96 |
-23% |