In-Game Benchmarks
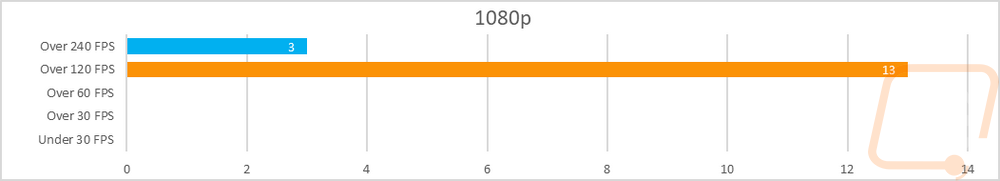
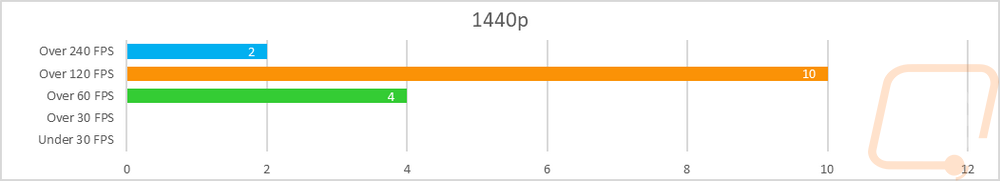
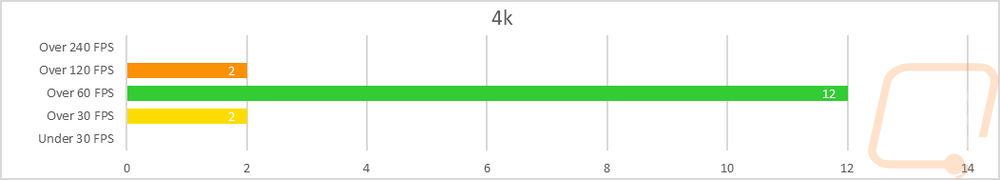
Now we finally get into the in game performance and that is the main reason people pick up a new video card. To test things out I ran through our new benchmark suite that tests 10 games at three different resolutions (1080p, 1440p, and 4k). Most of the games tested have been run at the highest detail setting and a mid-range detail setting to get a look at how turning things up hurts performance and to give an idea of if turning detail down from max will be beneficial for frame rates. In total, each video card is tested 54 times and that makes for a huge mess of results when you put them all together. To help with that I like to start with these overall playability graphs that take all of the results and give an easier-to-read result. I have one for each of the three resolutions and each is broken up into four FPS ranges. Under 30 FPS is considered unplayable, over 30 is playable but not ideal, over 60 is the sweet spot, and then over 120 FPS is for high refresh rate monitors.
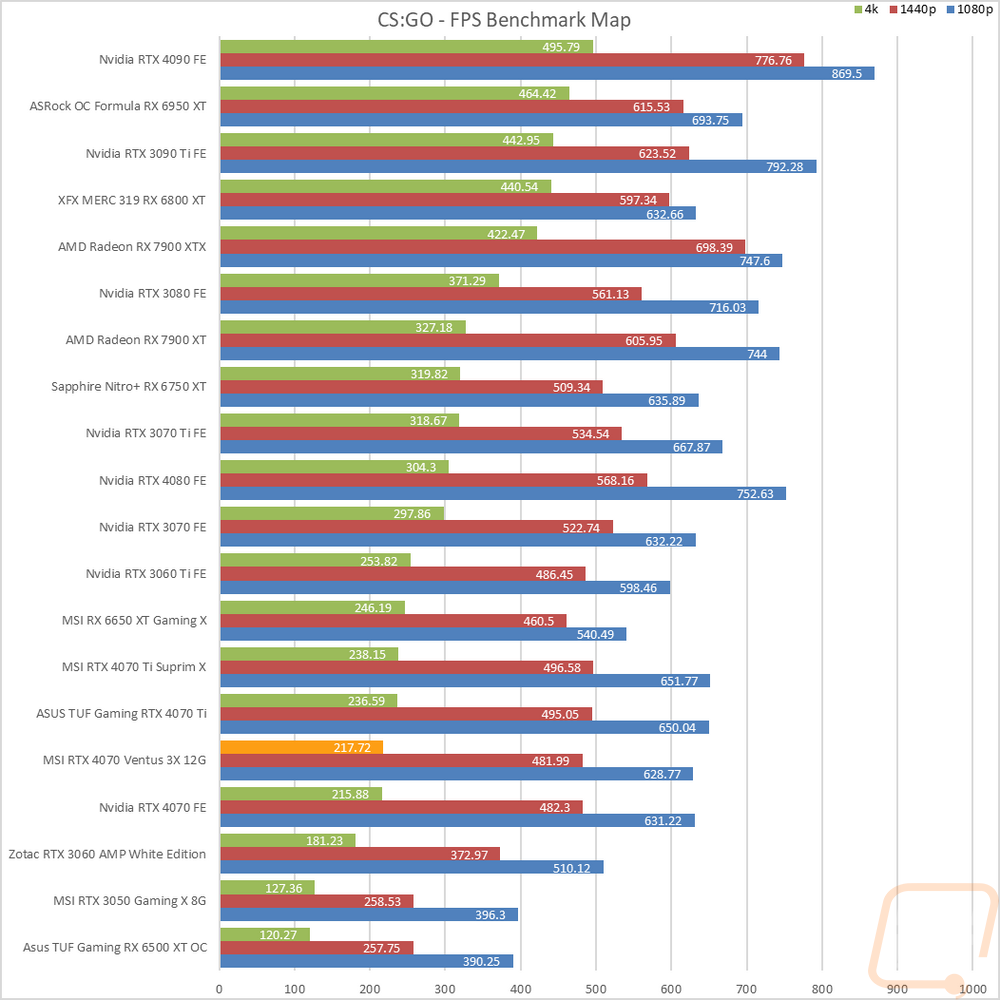
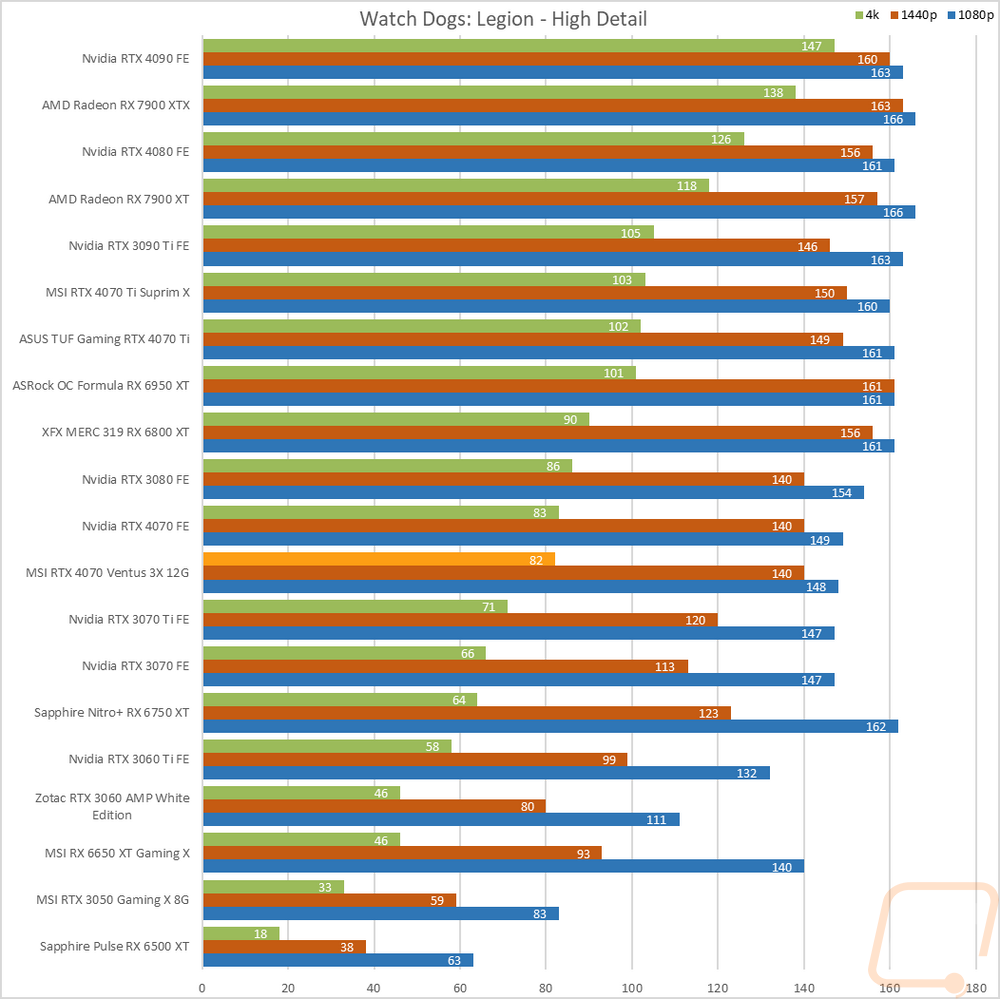
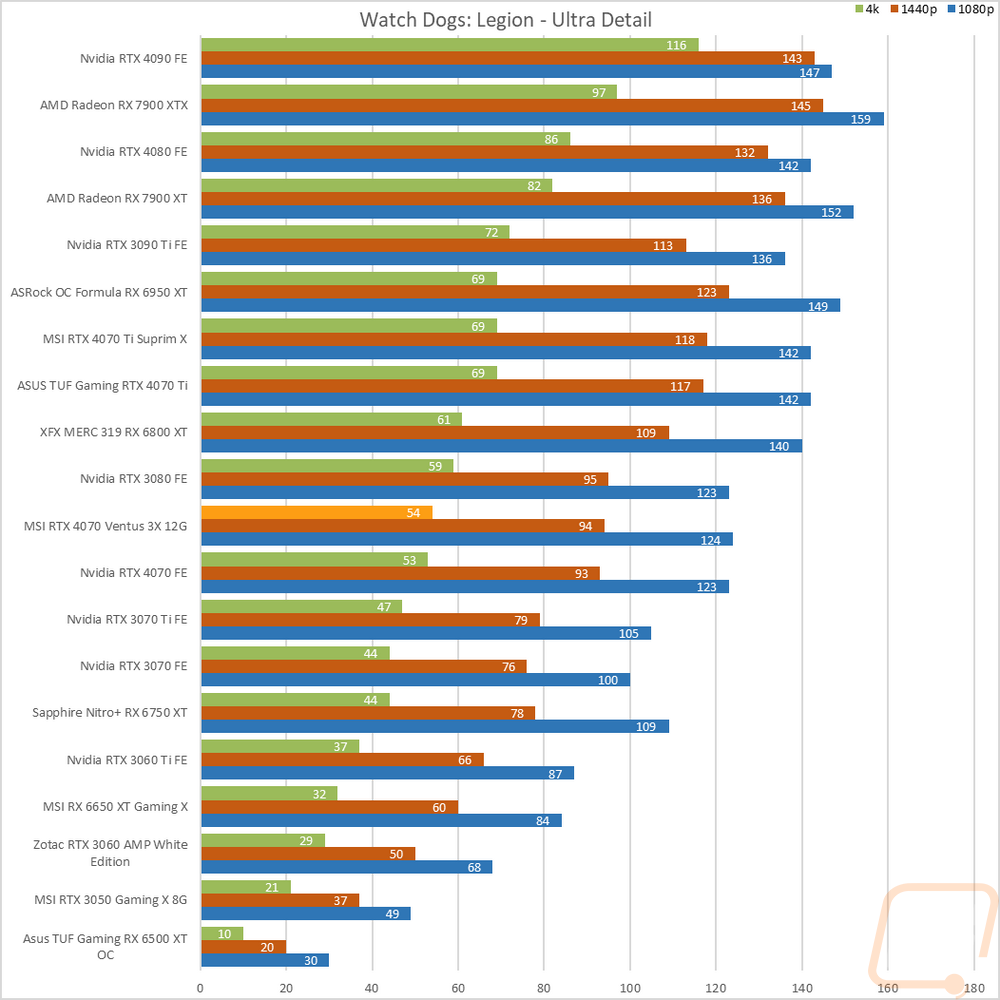
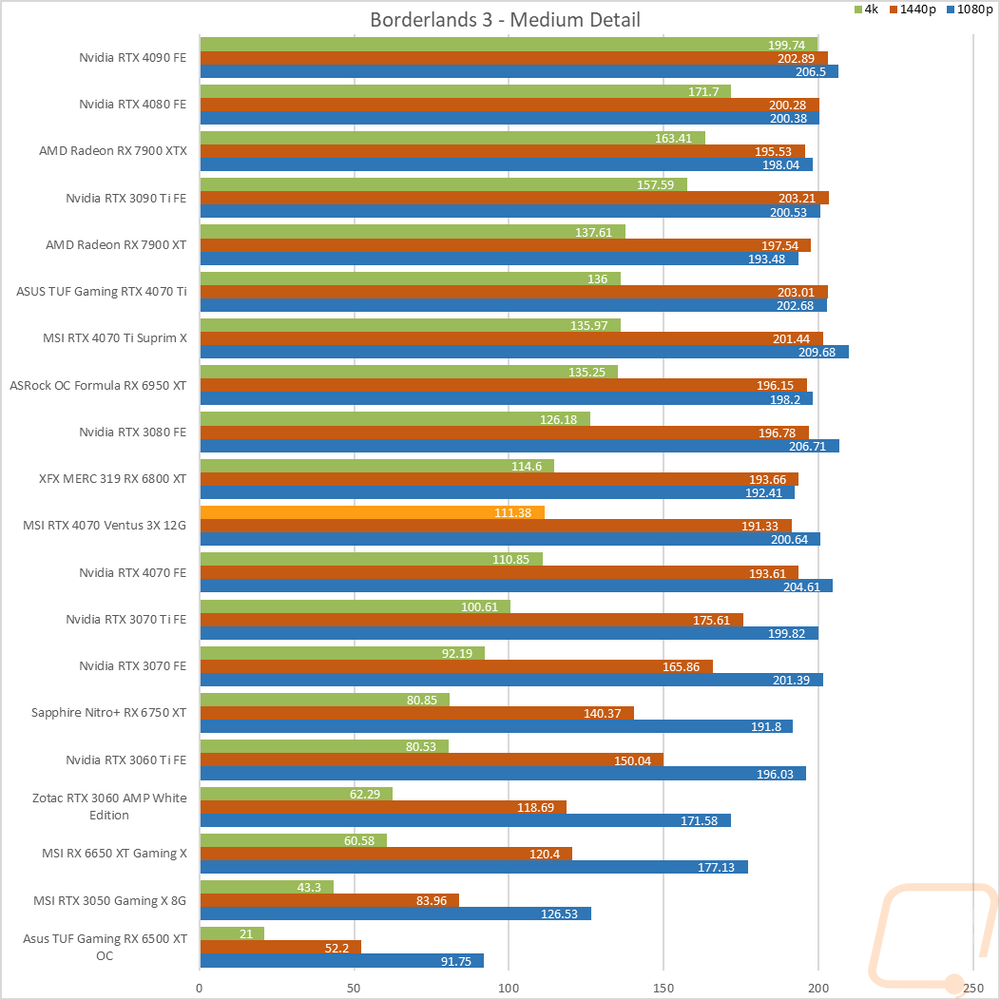
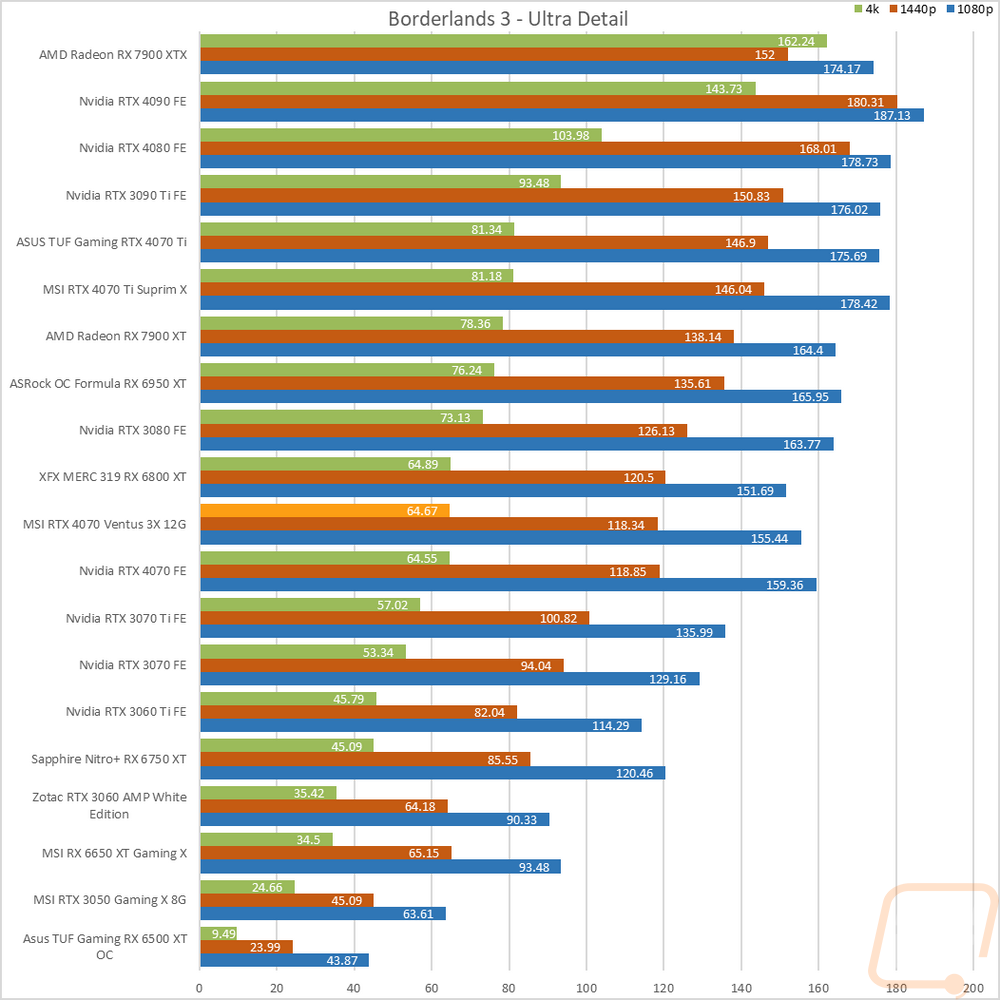
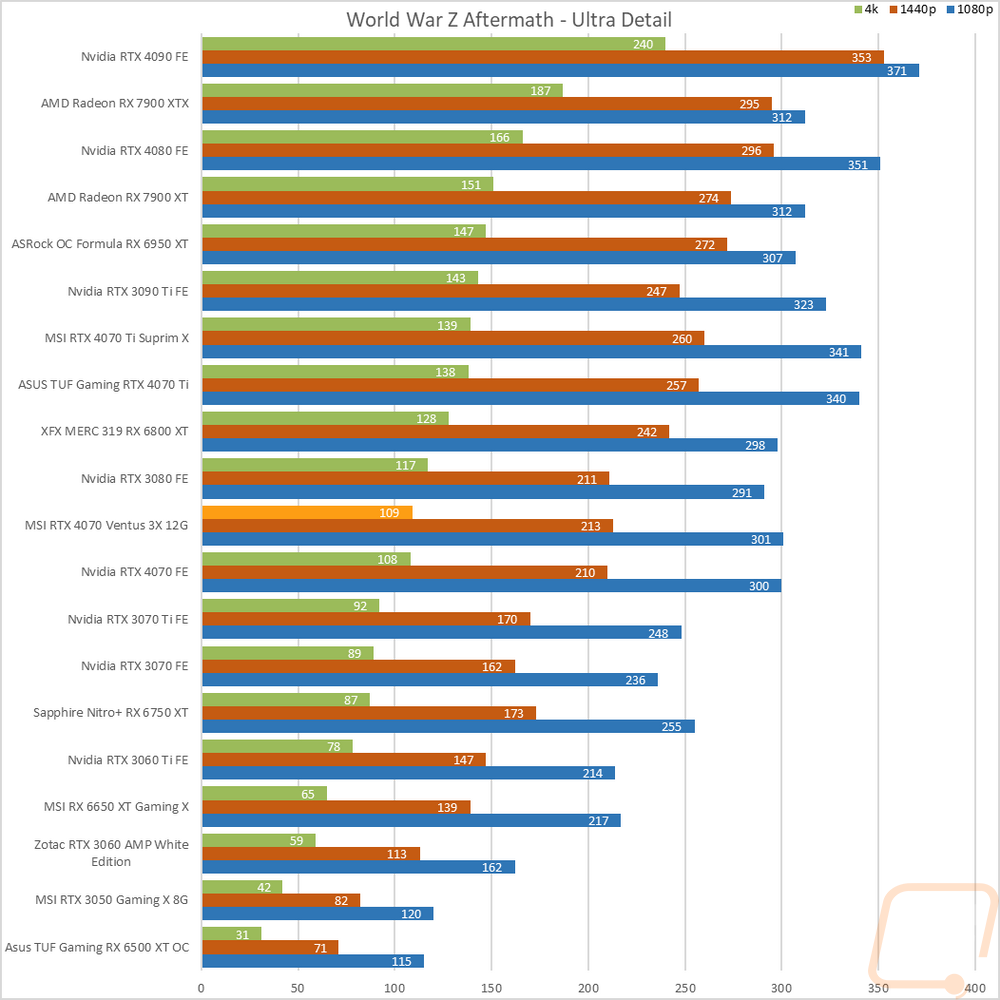
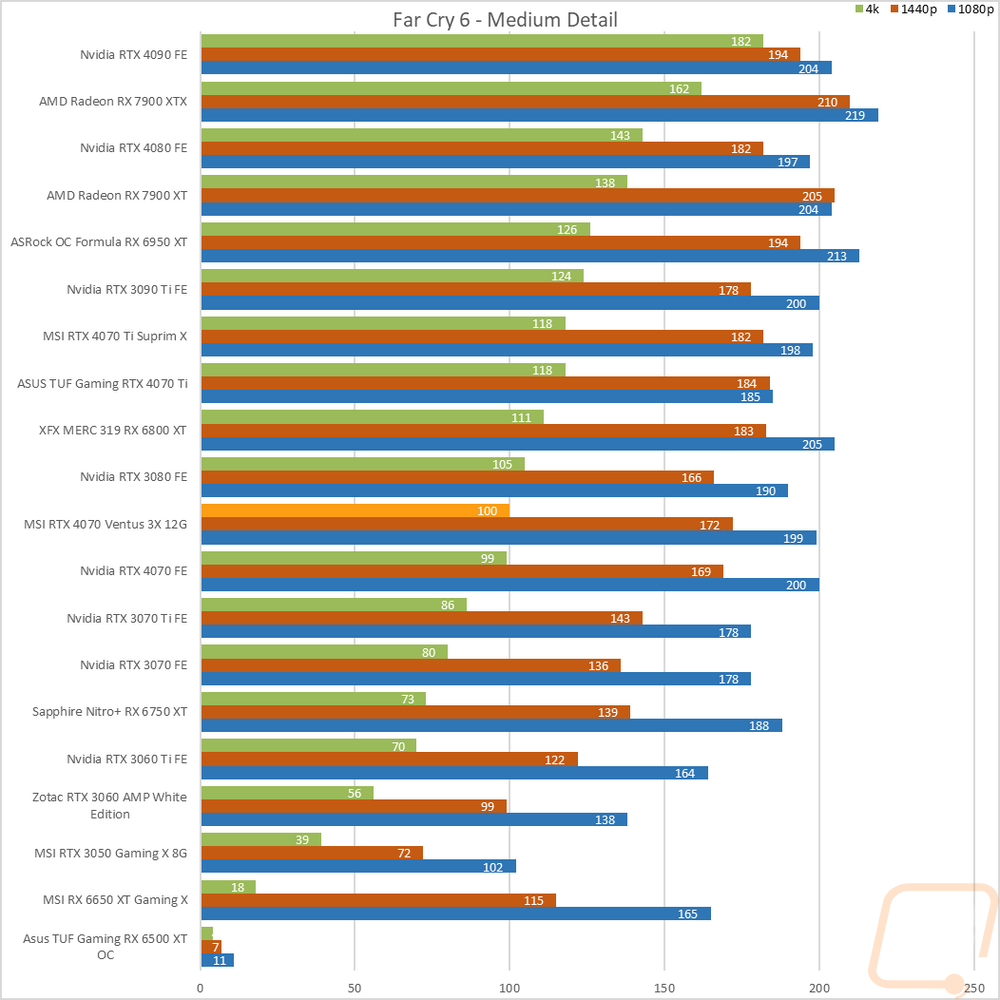
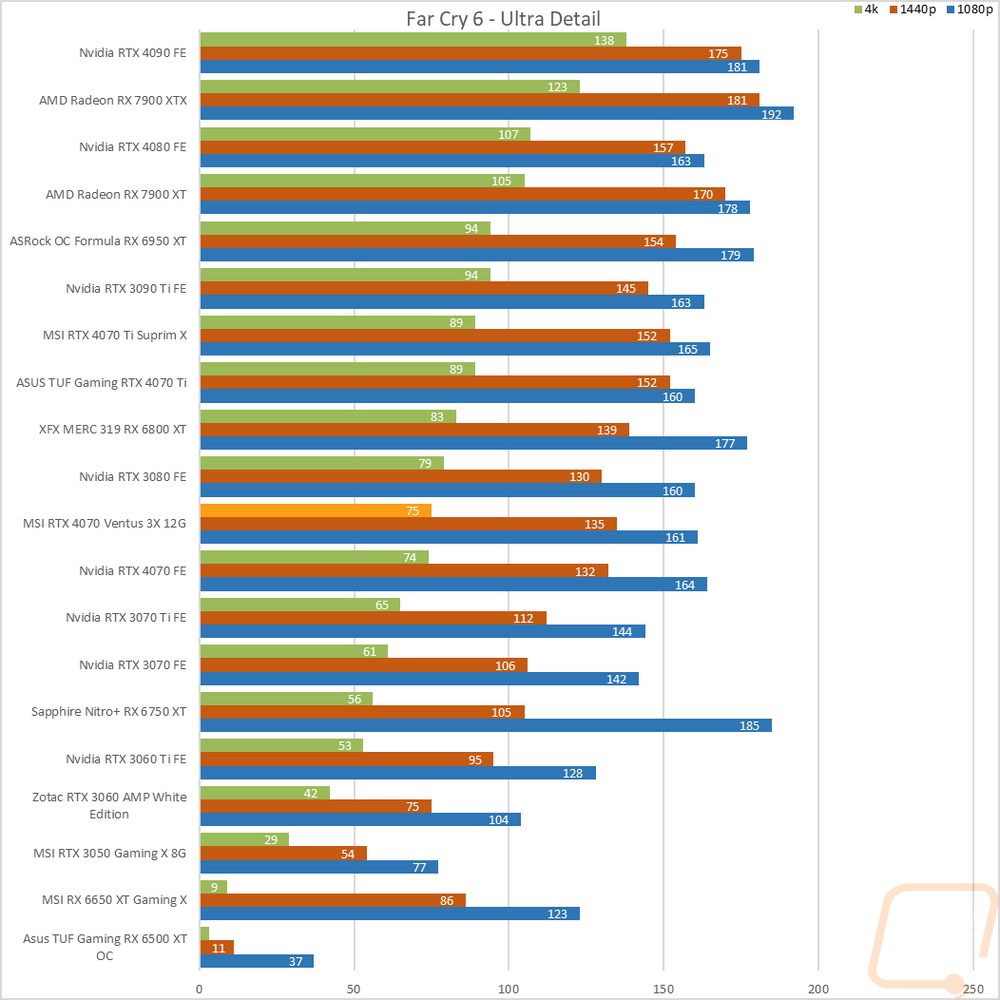
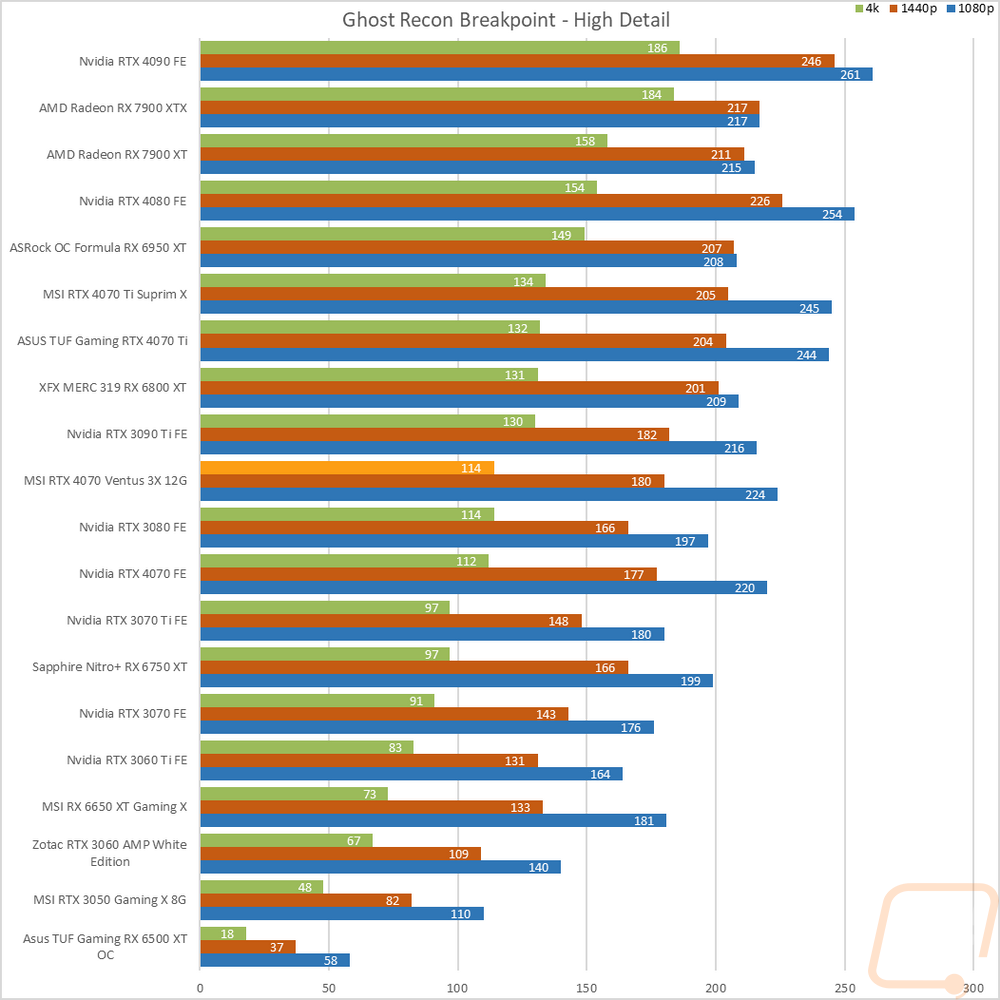
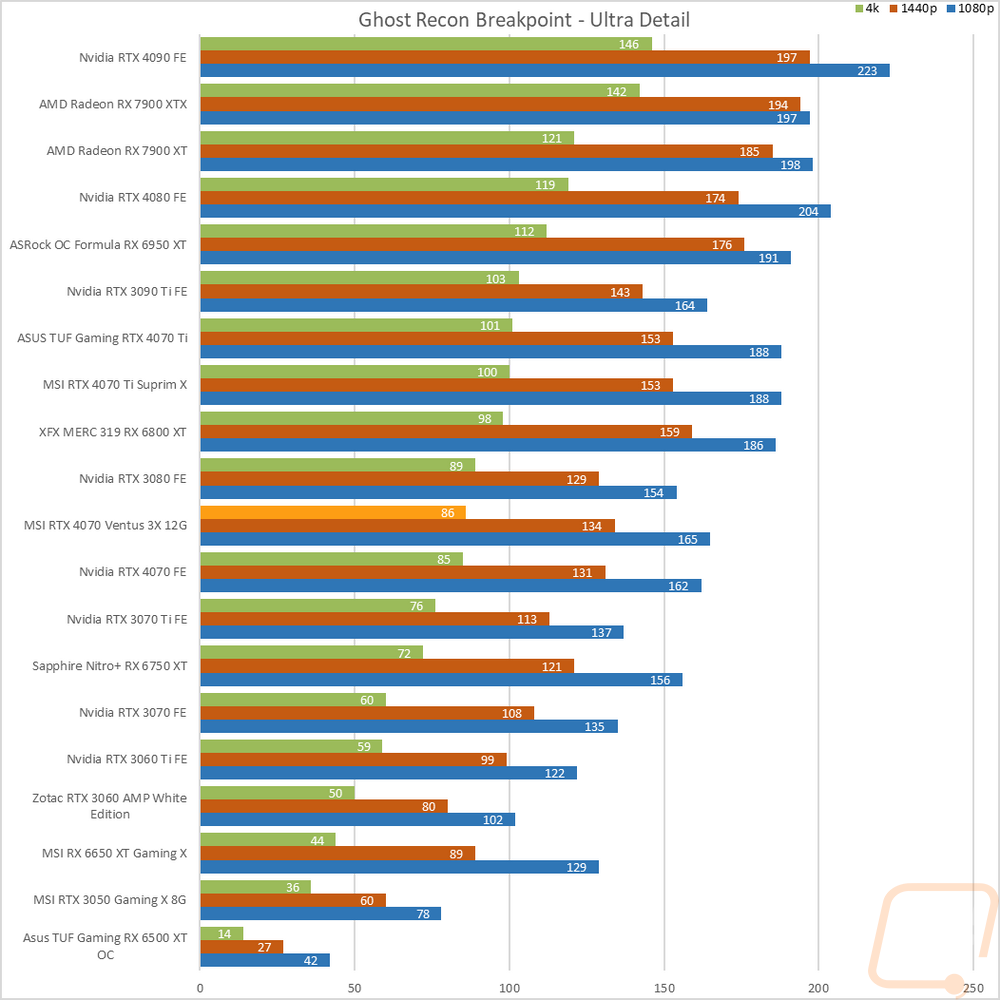
So how did the MSI RTX 4070 Ventus 3X do when we check out the performance by resolution? Well at 1080p there wasn’t a result that came in below 120 FPS and three were even up over 240 FPS. Then at 1440p, the resolution that Nvidia is targeting with the RTX 4070 it had 4 out of the 16 results sitting over 60 FPS but under 120 FPS. 10 results were in the 120-239 FPS range and then two were still up over 240 FPS. In other words, everything was playable and most are well beyond that with high refresh rates possible. Then last up at 4K only two results were over 120 FPS and there were two results under 60 FPS, but even though the card isn’t designed for 4K use most of the results still fell in the 60-119 range. As for the RTX 4070 Ventus specifically, none of these results were different from the RTX 4070 Founders Edition.
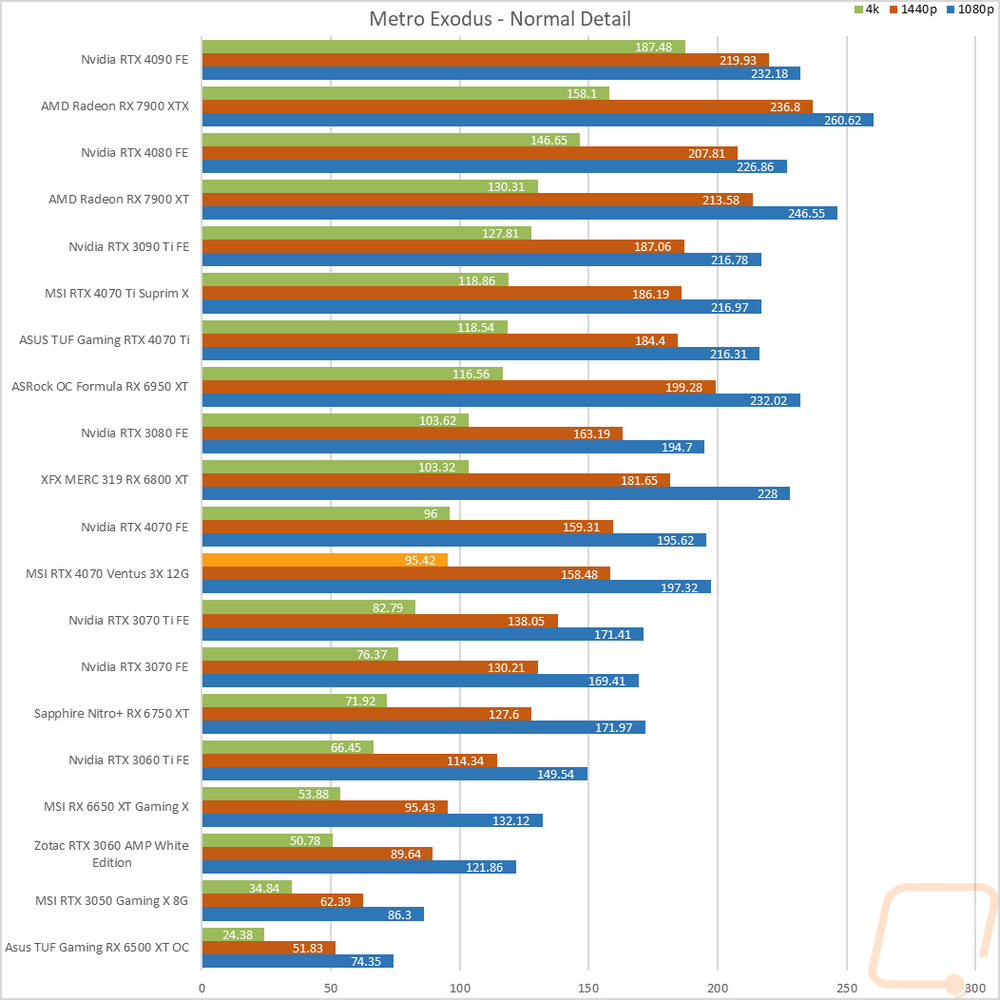
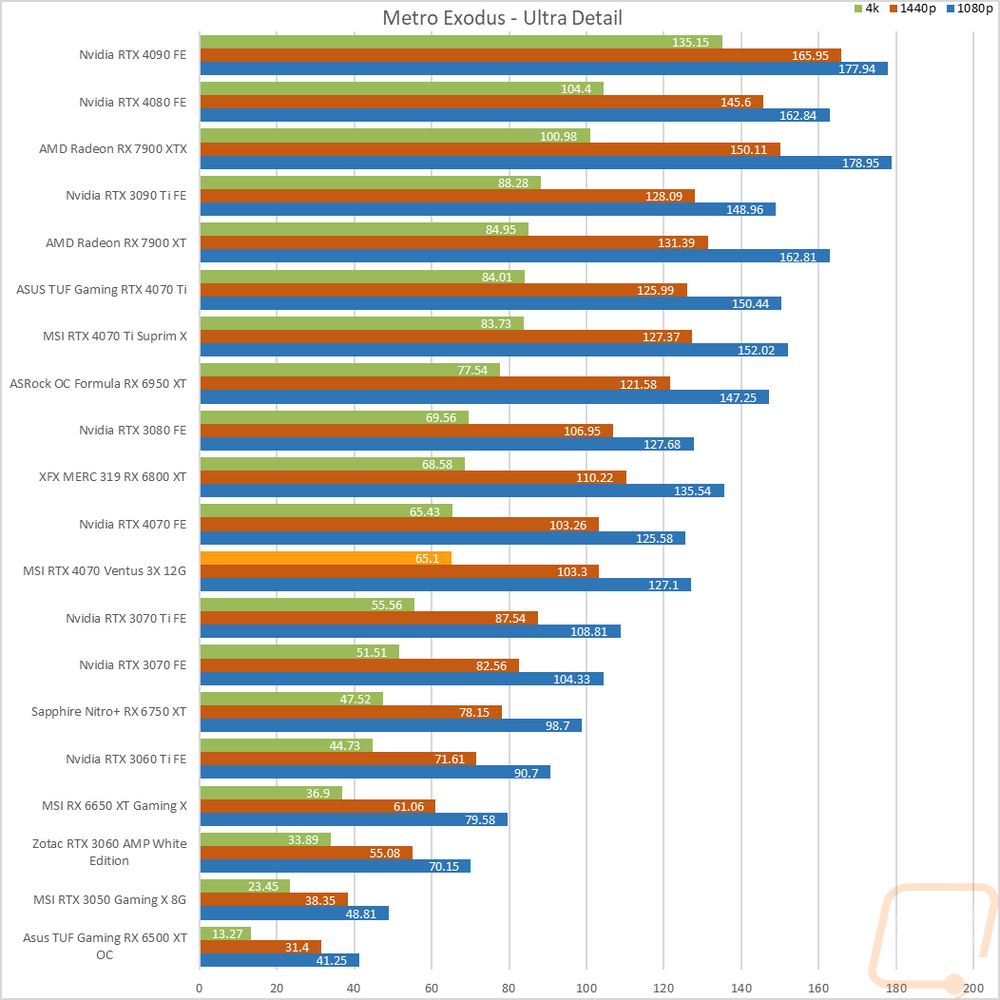
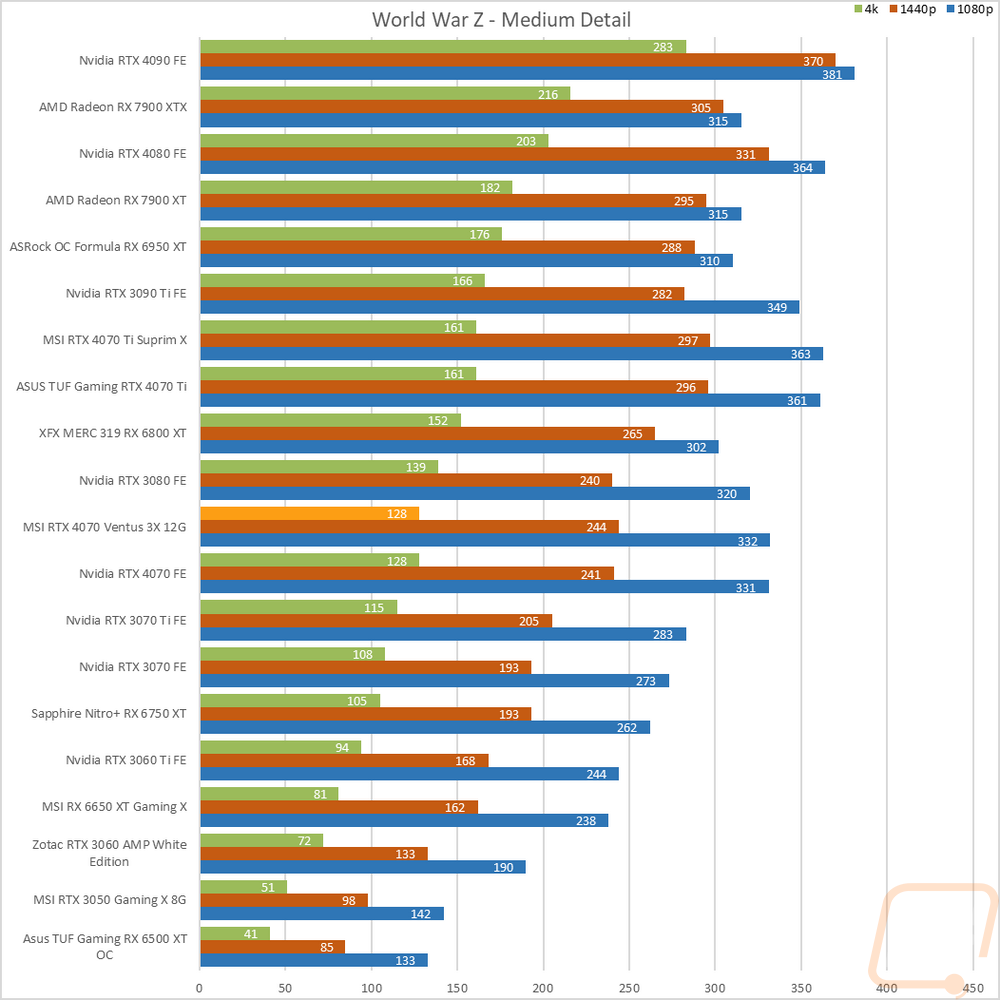
I did also average out all of the results with the exception of CS:GO which I didn’t include because its crazy high numbers mess up the overall average and wouldn’t give the best idea of performance. I have also included the Nvidia and AMD cards in the same price range and around the 4070 in performance as well as the RTX 4070 Founders Edition so we can see how the MSI RTX 4070 Ventus 3X compares. For the two 4070s which have the same clock speeds both cards are right with each other at all three resolutions no surprises there with the Ventus just slightly ahead in all three results. Both 4070s are ahead of the RTX 3080 at 1080p and the Ventus is also ahead at 1440p with the RTX 3080 gaining on them in the 4K results. As for the AMD cards, at 1080p both aren’t that far ahead but the gap widens at 1440p and 4K. As for the individual results, we can see that even with the 4070 being lower performance than the rest of the 4000 Series cards it is still seeing CPU-limited results across all of the 1080p results and some of the 1440p results as well especially Borderlands 3 on the medium detail setting. Beyond that, none of the results stand out really and line up with what we are seeing in the averages.
|
Average FPS (w/o CS:GO) |
1080p |
1440p |
4K |
|
RTX 3070 TI |
165.78 |
126.73 |
74.2 |
|
RTX 3080 |
188.35 |
148.9 |
89.9 |
|
RTX 4070 |
190.62 |
148.64 |
83.48 |
|
MSI RTX 4070 Ventus 3X |
190.89 |
148.96 |
83.98 |
|
6800 XT |
197.08 |
162.35 |
92.37 |
|
6950 XT |
205.27 |
177.19 |
105.8 |
|
4070 Ti |
212.87 |
174.42 |
103.72 |