Cooling Noise and Power
For my last few tests, rather than focusing on in game performance, I like to check out other aspects of video card performance. These are also the most important ways to differentiate the performance between cards that have the same GPU. To start things off I took a look at power usage.
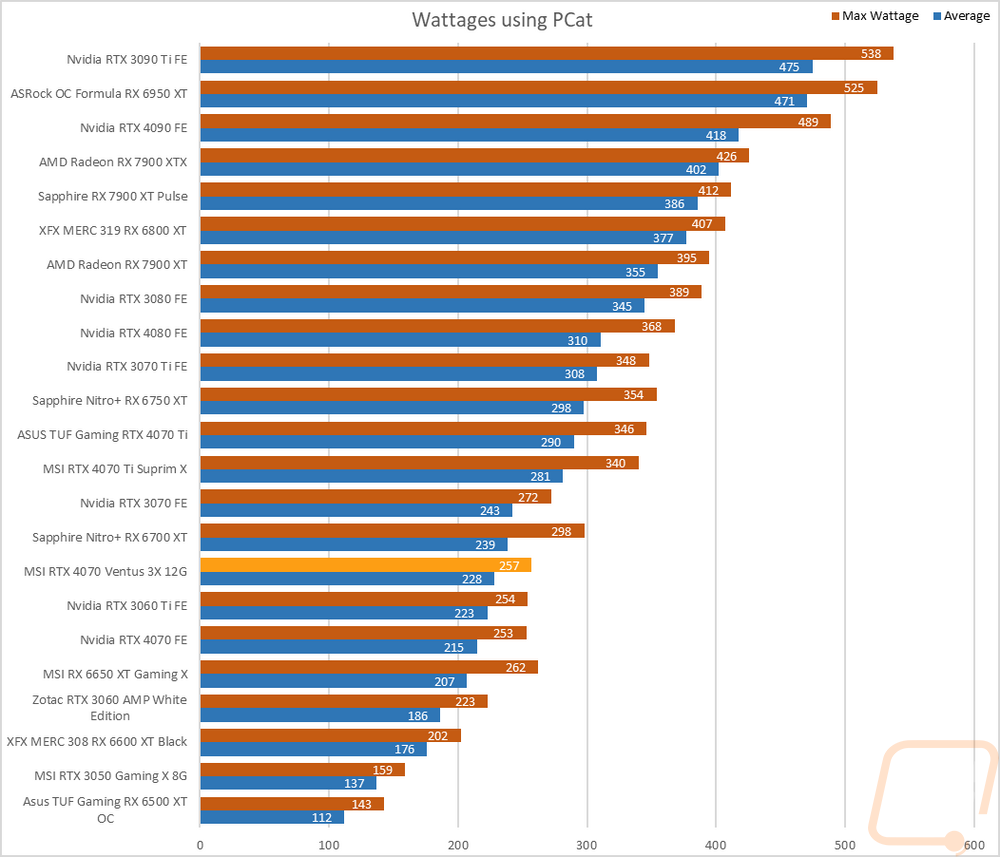
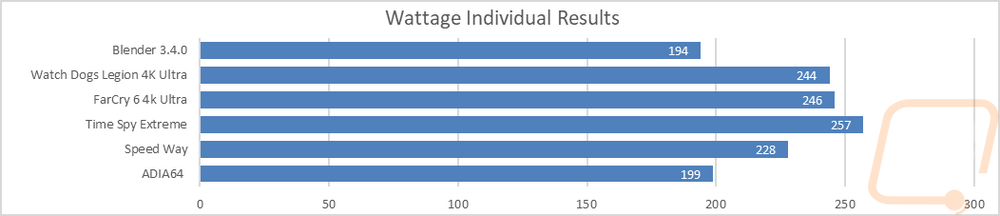
For this, our new test setup utilizes the Nvidia-designed PCat v2 along with cables to handle both traditional 6 or 8-pin connections as well as the new 12VHPWR. The PCat also utilizes a PCIe adapter to measure any power going to the card through the PCIe slot so we can measure the video card wattage exclusively, not the entire system as we have done in the past. I test with a mix of applications to get both in game, synthetic benchmarks, and other workloads like Blender and AIDA64. Then everything is averaged together for our result. I also have the individual results for this specific card and I document the peak wattage result as well which is almost always Time Spy Extreme. The MSI RTX 4070 Ventus 3X averaged 228 watts across all of the tests and peaked at 257. The peak wattage was just 4 watts higher than the Founders Edition 4070 but the average was higher at 13 watts more than the Founders Edition even with them both having the same clock speed. It looks like MSI adjusted the power profile slightly.
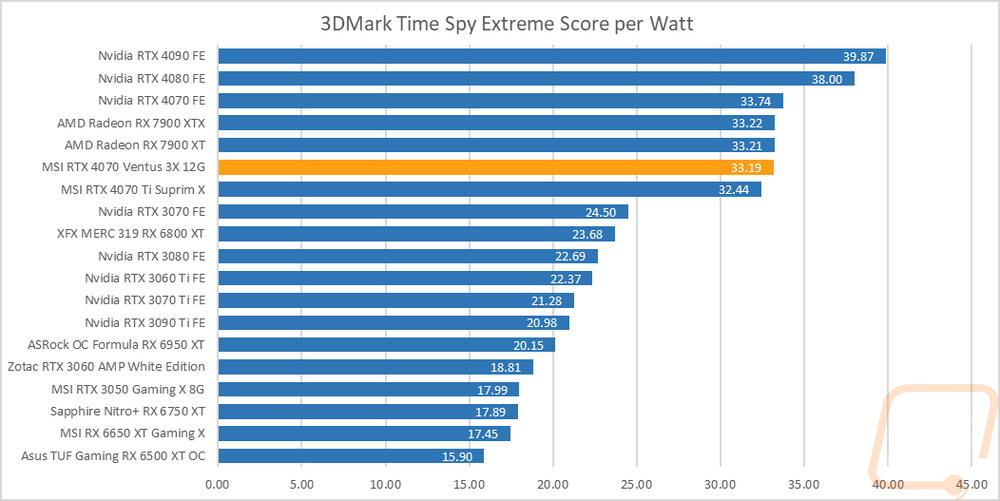
Having exact peak wattage numbers when running Time Spy Extreme I was also able to put together a graph showing the total score for each watt that a card draws which gives us an interesting look at overall power efficiency in the popular and demanding benchmark. The change in power usage as well as the Time Spy result for the MSI RTX 4070 Ventus 3X being slightly behind the Founders Edition also affects the score per watt chart putting it behind the 4070 FE by .55 which is enough to drop it down below the 7900 XT and 7900 XTX reference cards.
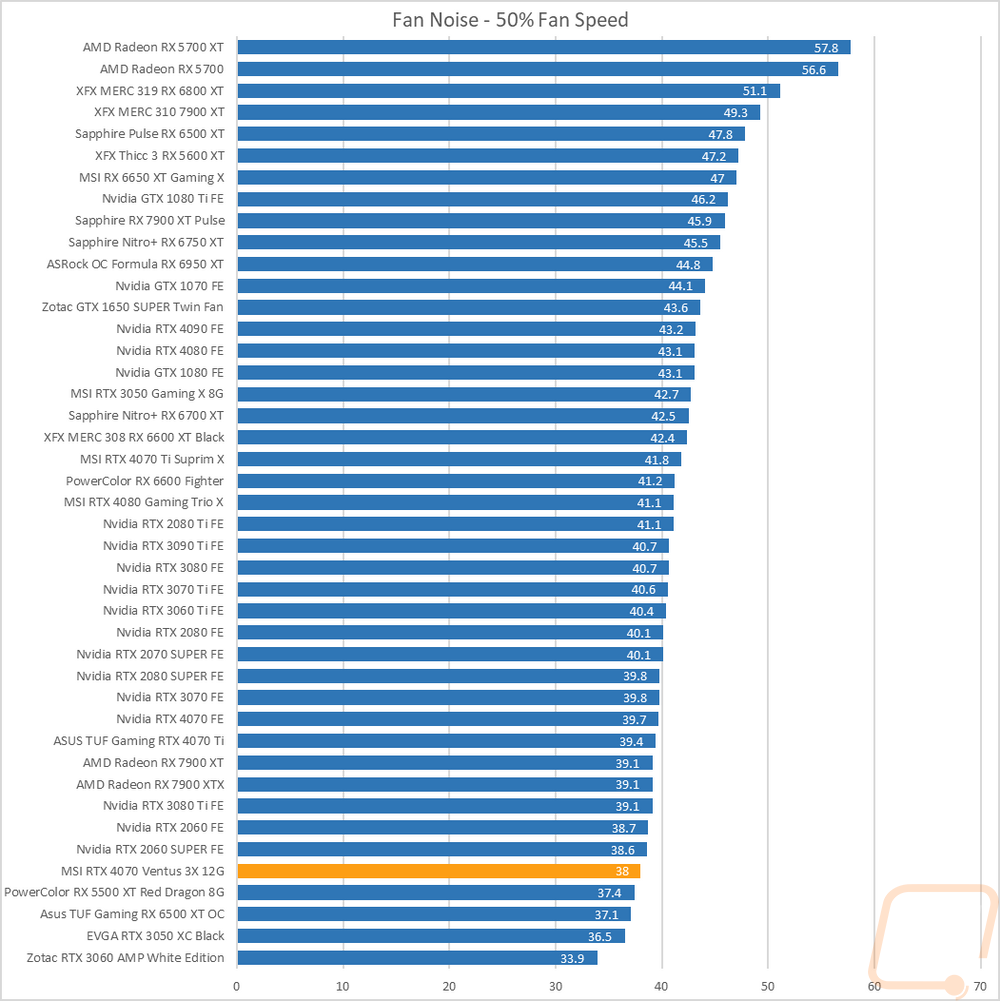
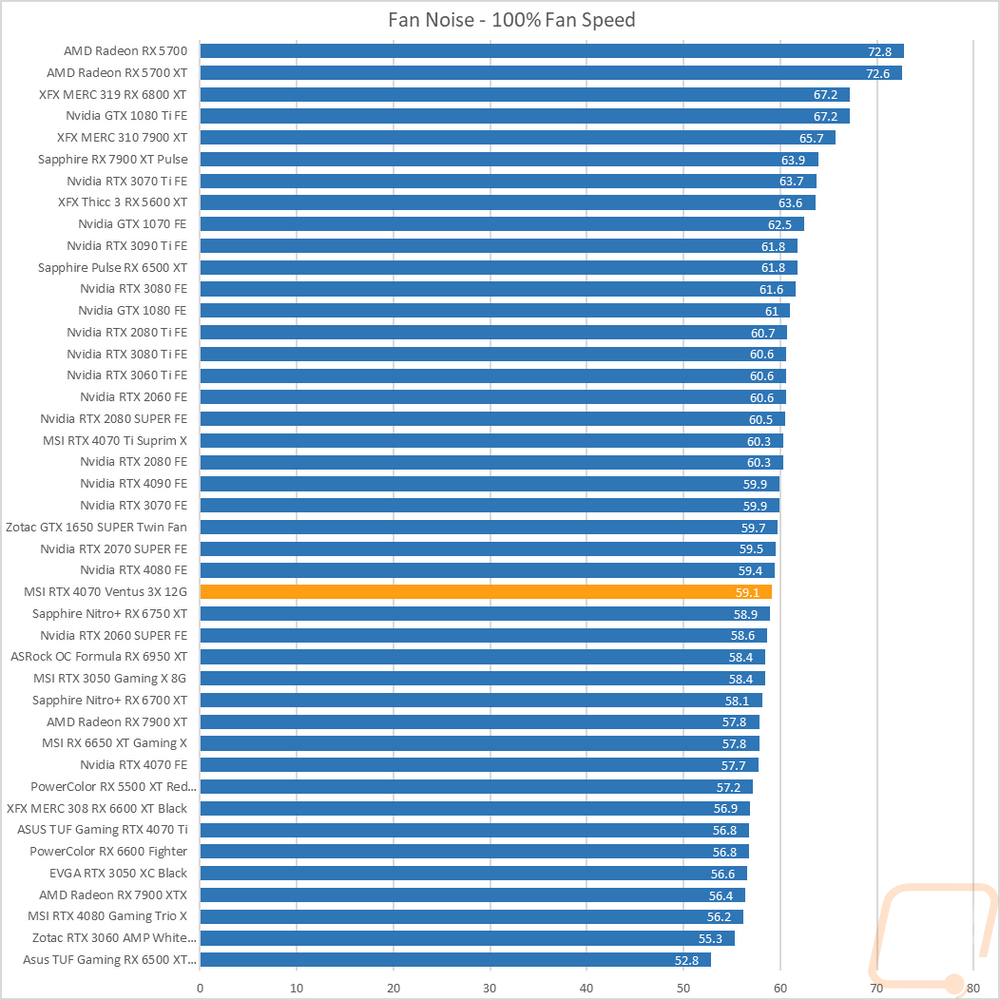
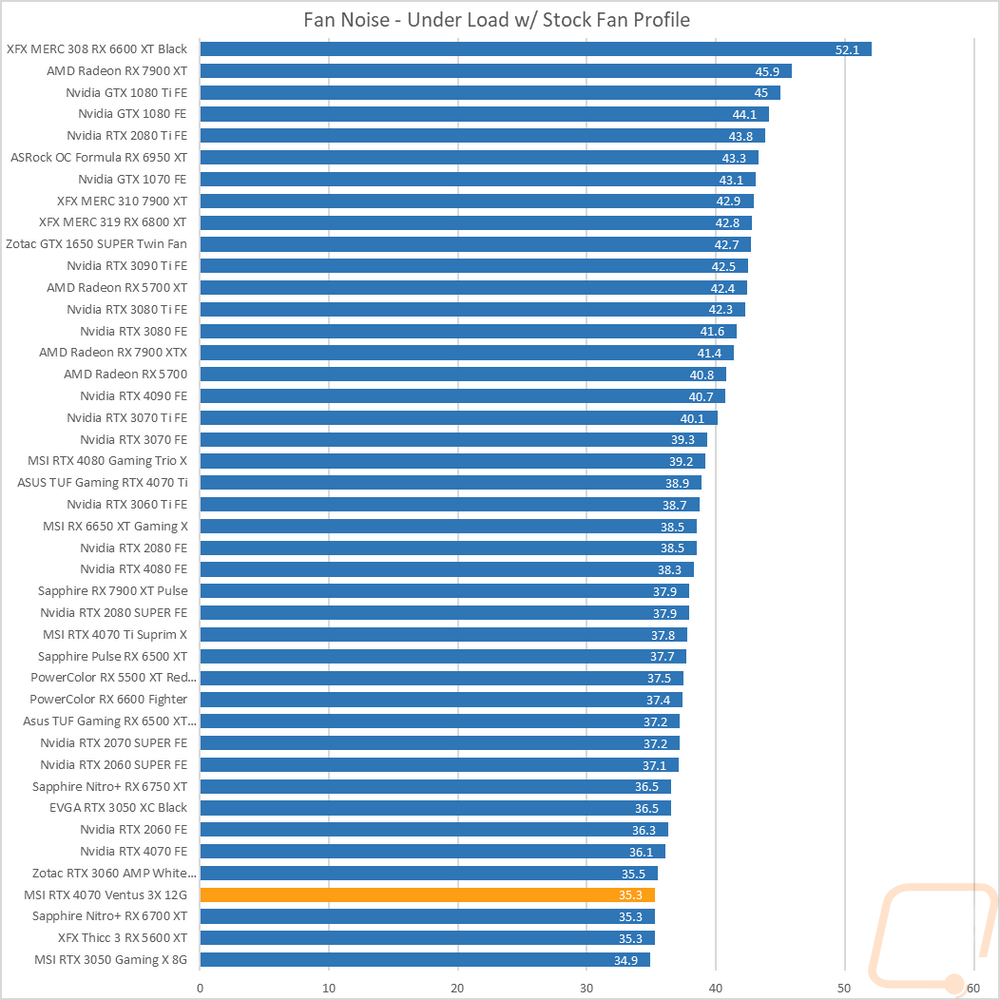
My next round of tests were looking at noise levels. These are especially important to me because I can’t stand to listen to my PC whirling. Especially when I’m not in game and other applications are using the GPU. For my testing, though I first tested with the fan cranked up to 100% to get an idea of how loud it can get, then again at 50% to get an idea of its range. The MSI RTX 4070 Ventus 3X is down near the bottom of the chart for the 50% fan speed chart and was 1.7 db lower than the Founders Edition but did move up in the 100% fan speed chart with 59.1 db. This was louder than the 4070 Founders Edition and isn’t too big of a surprise given the Ventus has a third fan and the Founders Edition is unusually quiet for its fan speeds. I also take a look at noise performance while under load. For that when running AIDA64’s stress test I wait until the temperature of the card has leveled off and then measure how loud things are when the card is at its worst-case scenario with the stock fan profile. Here the MSI RTX 4070 Ventus 3X is again back down at the bottom of the chart and almost a decibel lower than the 4070 Founders Edition.
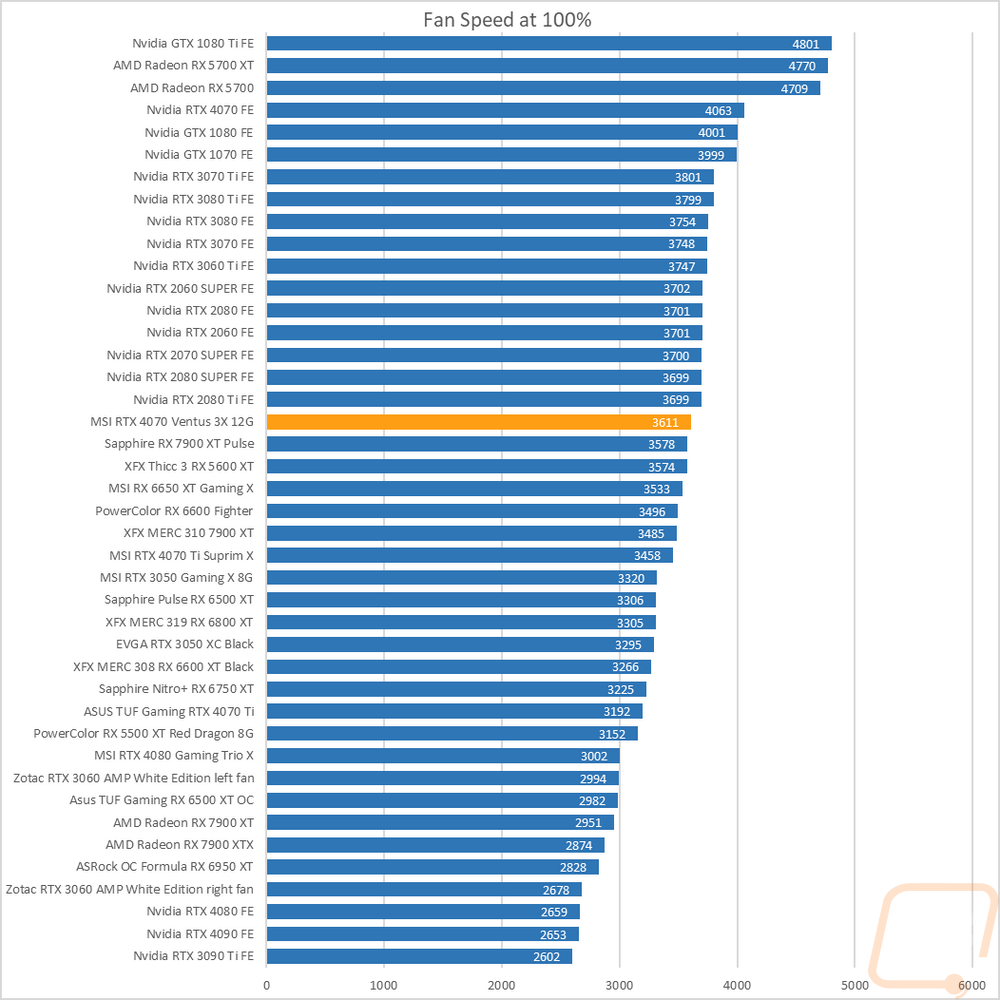
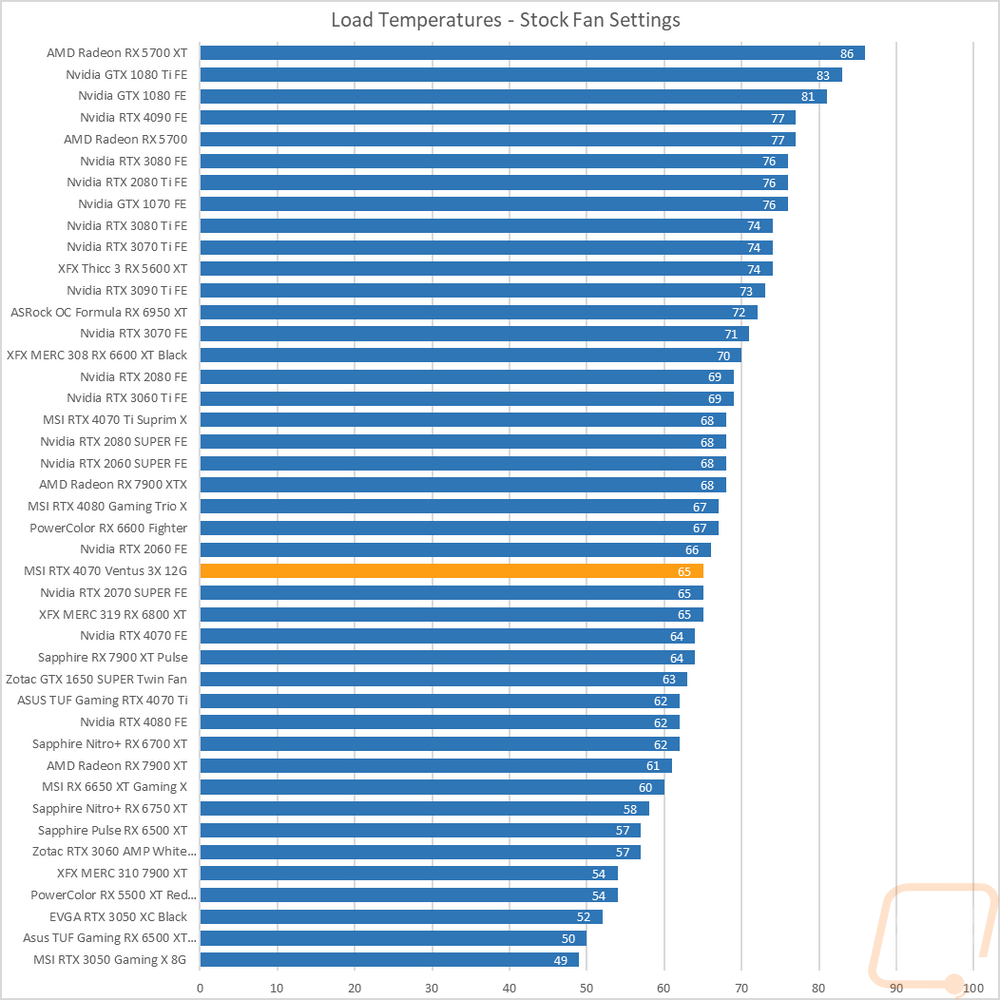
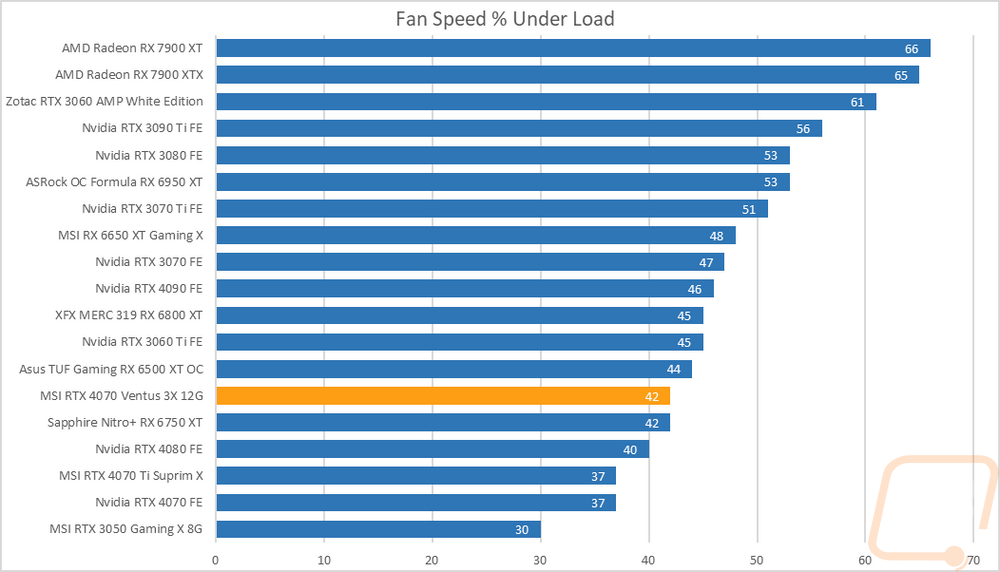
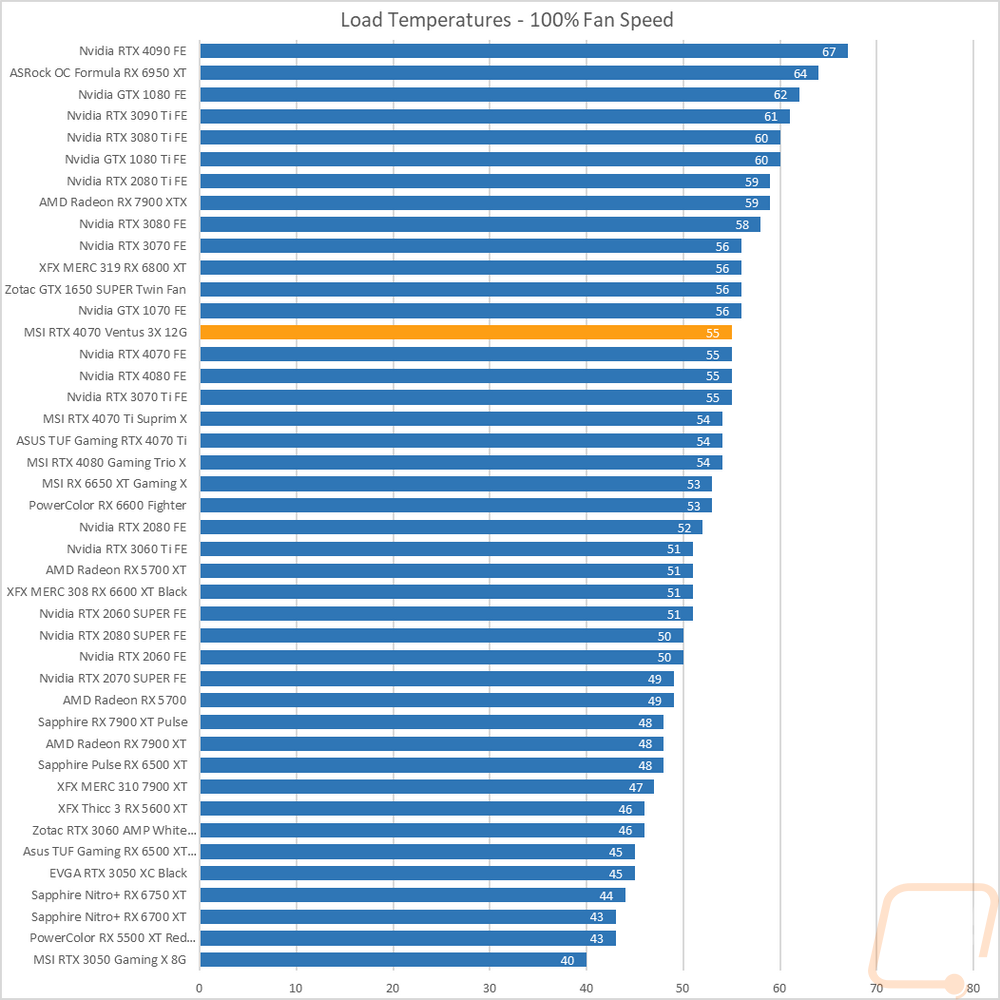
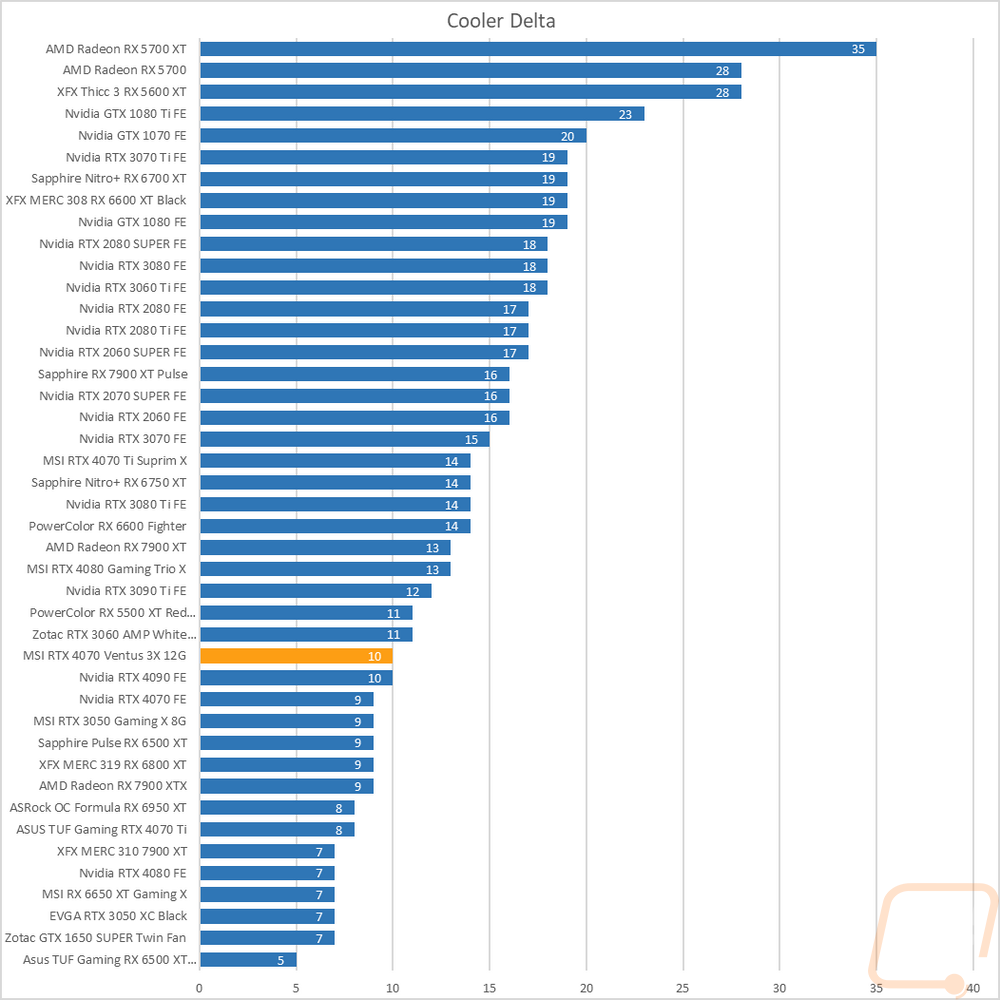
To finish up my testing I of course had to check out the cooling performance. To do this I ran two different tests. I used AIDA64’s Stress Test run for a half-hour each to warm things up. Then I documented what temperature the GPU leveled out at with the stock fan profile and then again with the fans cranked up to 100%. With the stock profile, the MSI RTX 4070 Ventus 3X leveled off at 65 degrees. This was 1 degree above the Founders Edition. More interestingly I also noted what the fan percentage was at to maintain that and the MSI RTX 4070 Ventus 3X was at 42%. This is 5% higher than the Founders Edition but still near the bottom of the chart. Then with the fans cranked up, the MSI RTX 4070 Ventus 3X is up higher in the chart at 55c, the same as the 4070 Founders Edition making the delta between the stock and 100% results 10c.
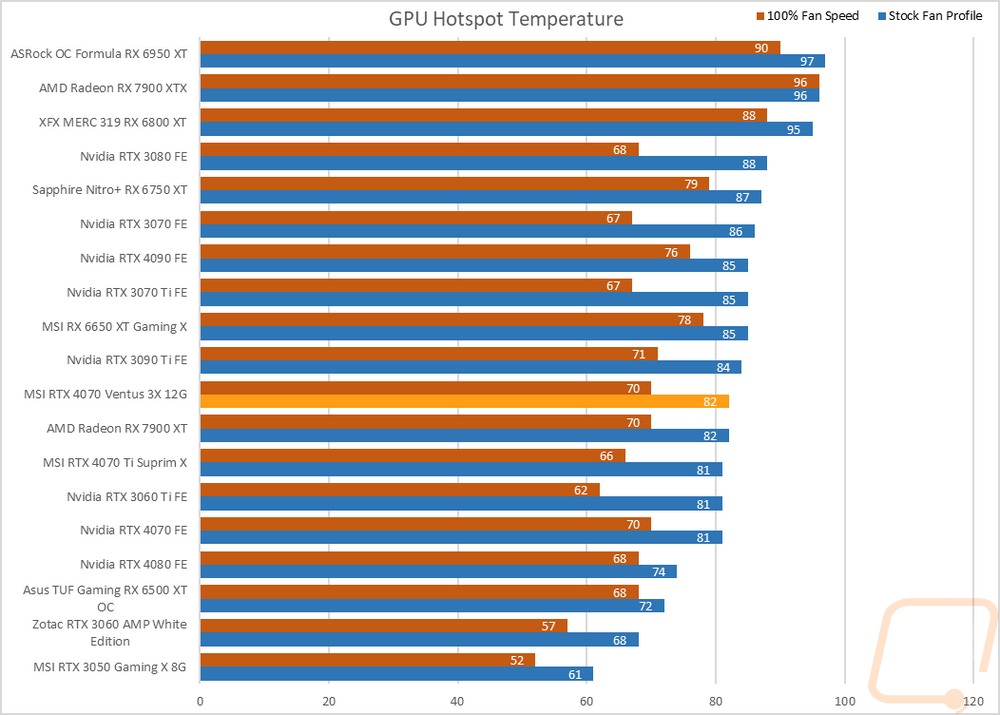
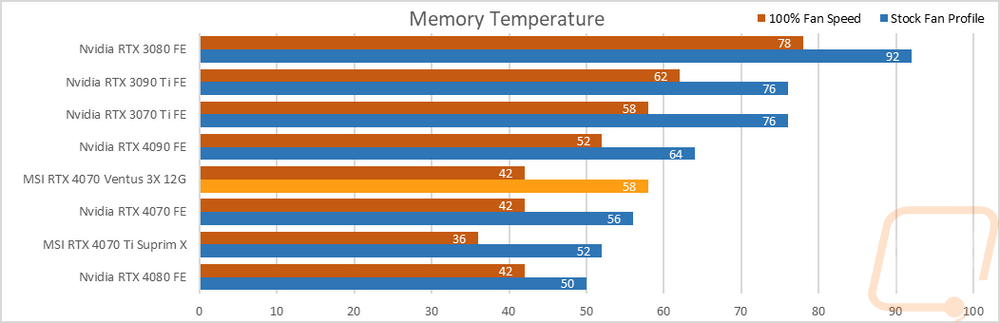
With the MSI RTX 4070 Ventus 3X still under load on both the stock fan profile and the 100% fan speed tests I also took a look at the GPU Hotspot temps. The Ventus had a hotspot temp of 82c with the stock fan profile which was just 1c higher than the Founders Edition. With the fan cranked up to 100% this dropped down to 70c, 2c higher than the 4070 FE. I also noted the memory temperatures on all of the cards that support it. This is the high-end Nvidia 3000 Series cards and all of the 4000 Series cards to date as well but none of the AMD models. The MSI RTX 4070 Ventus 3X had its memory at 58c with the stock fan profile, 2c higher than the FE. Then at 100% fan speed, both cards were at 42c.
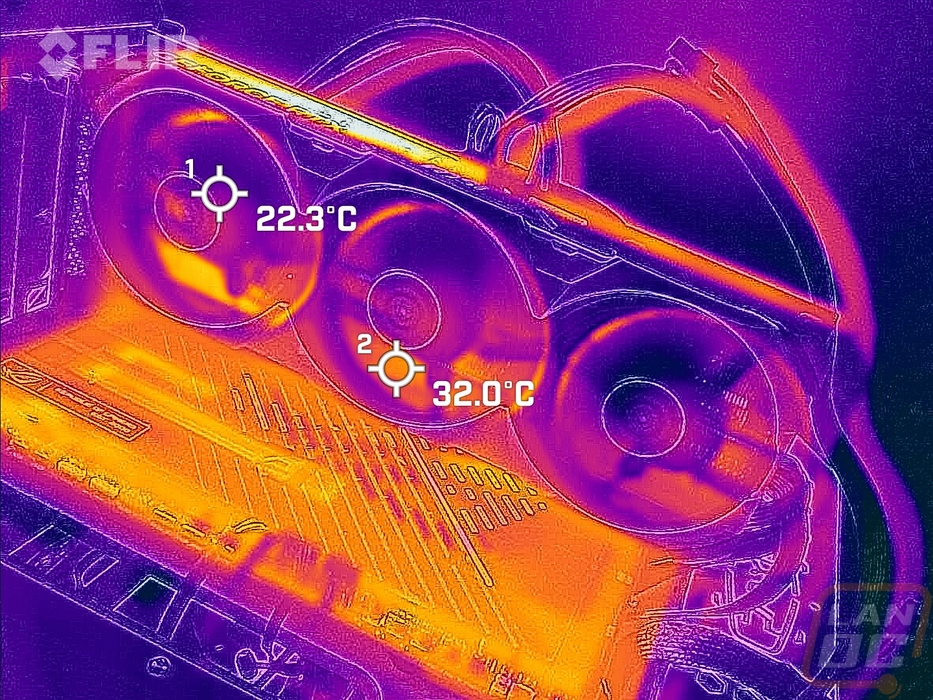
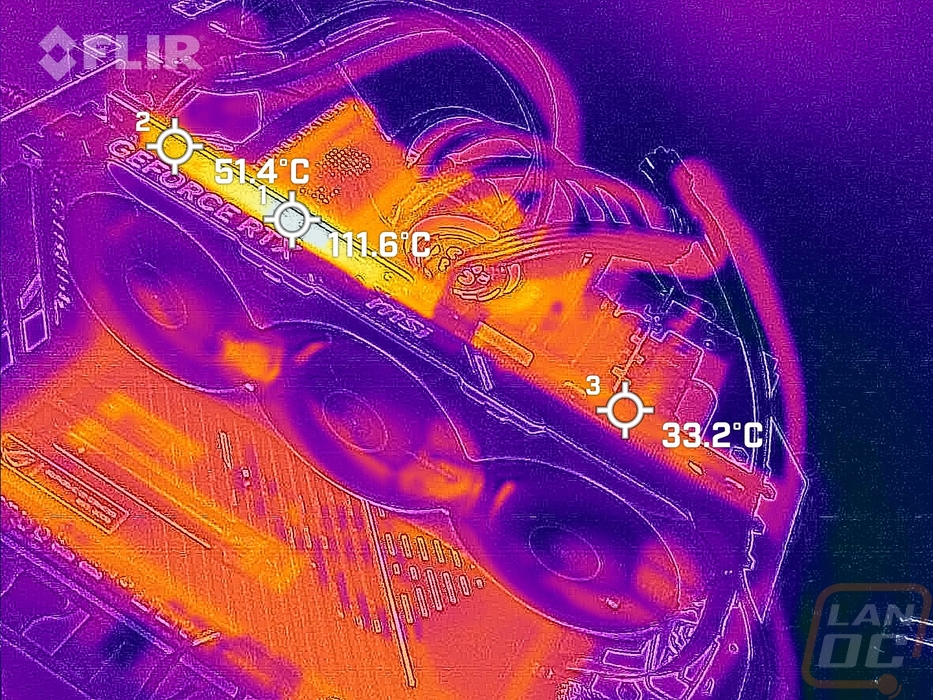
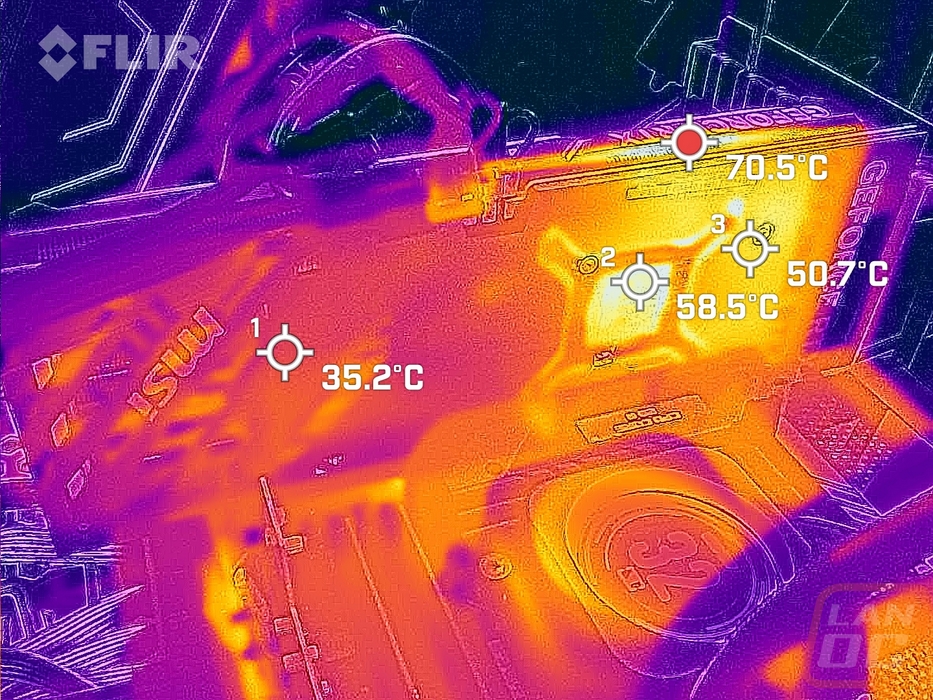
While running the stock fan profile testing I also took the time to get a few thermal images so we could see what is going on. For the thermal images of the MSI RTX 4070 Ventus 3X, the fan side of the card is mostly running extremely cool with just some heat on the bottom side of the heatsink behind the far left fan. The top edge of the card on the other hand was extremely hot on the PCB just above the PCB running at 111.6c in that area. It was cooler towards the PCI bracket and towards the power cable but something isn’t in line for that one specific area to be that hot. The back of the card with its plastic backplate doesn’t show most of the heat as the plastic is more of an insulator. You can see the blow-through vents on the left with some heat and the exposed back of the GPU is warm at 58.5c but the top edge here was again where the heat was concentrated.