With today's 7700 XT and 7800 XT launch, I had the chance to check out a reference RX 7800 XT up against XFX’s MERC 319 RX 7800 XT Black and I was extremely impressed with its performance both from the overclock as well as its cooling and noise performance. So getting in the stock clocked RDX 7700 XT Pulse and checking it out then getting to check out the XFX Qick 319 RX 7700 XT Black which is overclocked and has a similar looking cooler design minus a few bells and whistles. I’m excited to see if the QICK 319 RX 7700 XT Black can impress as well. So we are going to dive in and see what the QICK is all about then put it through our full test suite to check out its performance. Let’s get into it!
Product Name: XFX QICK 319 RX 7700 XT Black
Review Sample Provided by: XFX
Written by: Wes Compton
Amazon Affiliate Link: HERE
AMDs new RX 7700 XT and 7800 XT
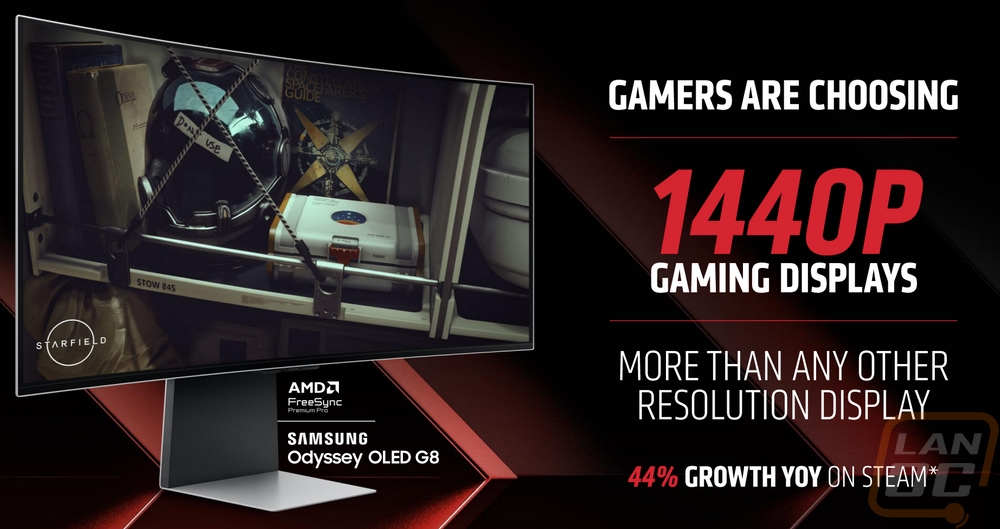
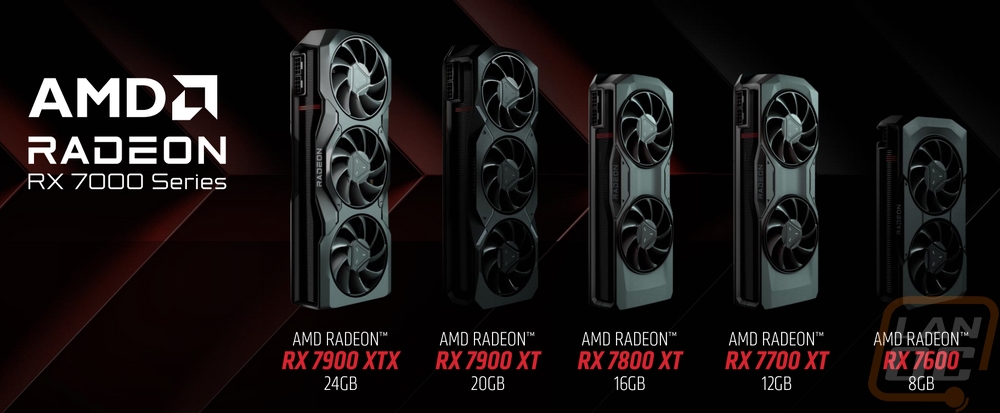
At Gamescom this year AMD announced two new GPUs to fill in a few big gaps in their current 7000 Series GPU lineup. Before the announcement, they had the RX 7600, RX 7900 XT, and RX 7900 XTX. That covered the higher end of the market with their 4K focused cards and the 7600 which is a mid-range 1080p focused card. The two new models fit in the middle with a 1440p resolution focus. While 1080p is still the most widely used resolution on Steam hardware surveys, the 1440p resolution is growing quickly, AMD highlighted this in the presentation pointing out a 44% growth year on year on the Steam hardware survey.
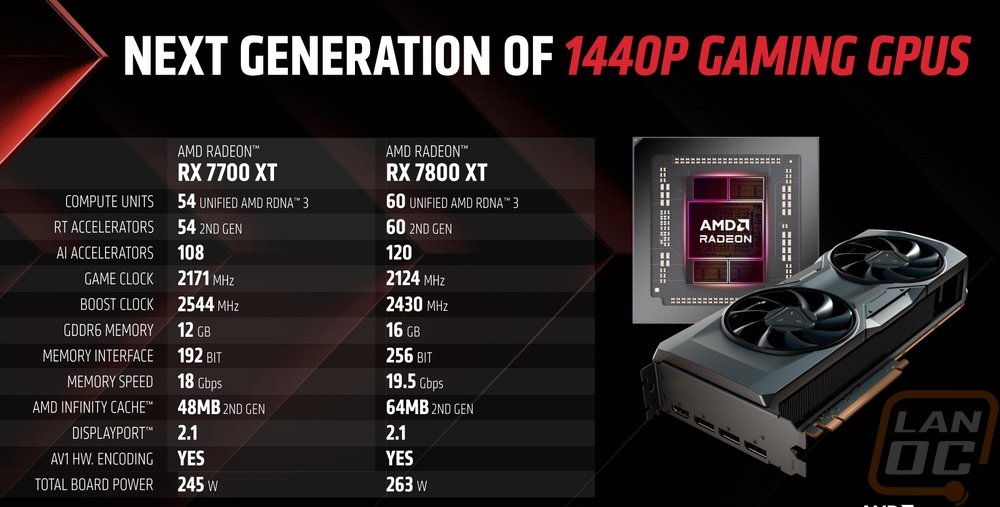
To get a look at where the new RX 7700 XT and RX 7800 XT sit spec wise I have the specs from the AMD briefing as well as a full breakdown that includes the RX 7600 and RX 7900 XT which for the 7000 Series sit above and below the two cards as well as the RX 6700 XT and RX 6800 which are the comparable cards from last generation. Both the 7700 XT and the 7800 XT have the same 5nm and 6nm combination of manufacturing process that the 7900 XT has. The two GPUs have the same die size and transistor count with them sharing the same base GPU but the compute units and the stream processor counts show us that it has been cut down slightly for the 7700 XT compared to the 7800 XT. The 7800 XT is right with the 6800 in stream processors as well as compute units and ray accelerators but last generation's cards didn’t have the AI accelerators which the 7800 XT has 120 and the 7700 XT has 108. The 7800 XT has a slightly lower game GPU clock than the 7700 XT with it at 2124 MHz to 2171 MHz on the 7700 XT. The same goes for the boost clock which the 7800 XT can see up to 2430 MHz whereas the 7700 XT can do up to 2544 MHz. The single precision performance numbers give us an idea of what the lower clock speeds but higher core counts translate to. The 7700 XT can do up to 35 TFLOPS whereas the 7800 XT is slightly higher at 37 TFLOPS. The 7900 XT is way out ahead of that at 51 TFLOPS and the 7600 is well below the two at 21 TFLOPS. Then both the 6700 XT and the 6800 are well below the 7600 at 13.21 TFLOPS and 16.17 TFLOPS.
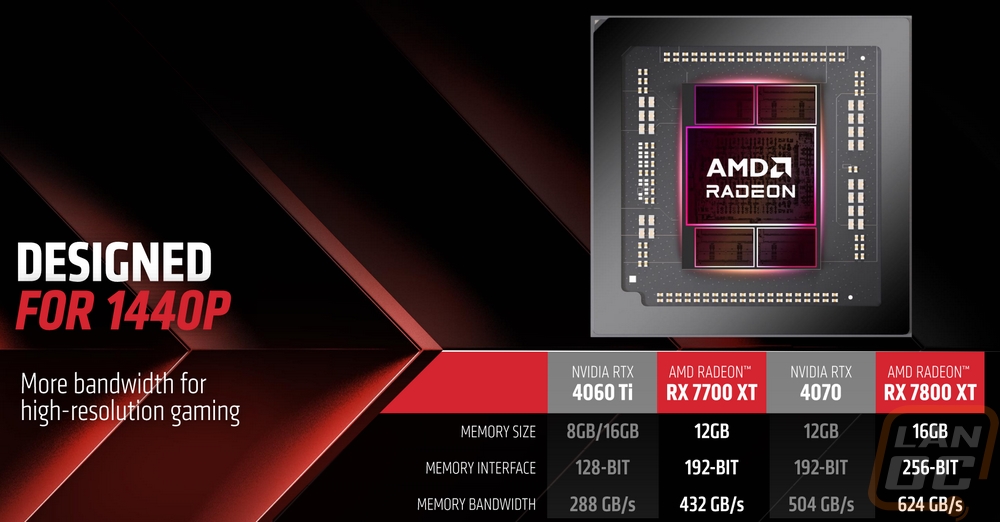
The 7700 XT has 48 MB of the 2nd generation Infinity Cache whereas the 7800 XT has 64 MB. Then for memory, the 7700 XT has 12GB of GDDR6 memory to the 16GB on the 7800 XT. They also have different memory bus interfaces with a 192-bit interface for the 7700 XT and 256-bit for the 7800 XT and the memory on the 7800 XT is also clocked faster with it running at 19.5 Gbps and 18 Gbps for the 7700 XT. Overall the higher cache and everything else translates to the 7700 XT having an effective memory bandwidth of 1995.3 GB/s to the 2708.4 GB/s for the 7800 XT. Both cards have a traditional PCIe 4.0 x16 interface, not the x8 that the RX 7600 had. Then for power, the two cards do have different total board power ratings with the 7700 XT at 245 watts and the 7800 XT at 263 watts. AMD also announced the base pricing of the cards at Gamescom with the RX 7700 XT at $449 and the RX 7800 XT at $499. The 7800 XT is available in a reference design directly from AMD as well as designs from their partners but the 7700 XT doesn’t have a reference design and will only be available with the partner designs.
|
Specifications |
RX 7600 |
RX 6700 XT |
RX 7700 XT |
RX 6800 |
RX 7800 XT |
RX 7900 XT |
|
Architecture |
RDNA 3 |
RDNA 2 |
RDNA 3 |
RDNA 2 |
RDNA 3 |
RDNA 3 |
|
Manufacturing Process |
6nm |
7nm |
5nm GCD + 6nm MCD |
7nm |
5nm GCD + 6nm MCD |
5nm GCD + 6nm MCD |
|
Transistor Count |
13.3 Billion |
17.2 Billion |
28.1 Billion |
26.8 Billion |
28.1 Billion |
57.7 Billion |
|
Dia Size |
204 mm² |
335 mm² |
200mm² GCD 150mm² MCD |
520 mm² |
200mm² GCD 150mm² MCD |
529 mm² |
|
Compute Units |
32 |
40 |
54 |
60 |
60 |
84 |
|
Ray Accelerators |
32 |
40 |
54 |
60 |
60 |
84 |
|
AI Accelerators |
64 |
-- |
108 |
-- |
120 |
168 |
|
Stream Processors |
2048 |
2560 |
3456 |
3840 |
3840 |
5376 |
|
Game GPU Clock |
2250 MHz |
2424 MHz |
2171 MHZ |
1815 MHZ |
2124 MHz |
2025 MHz |
|
Boost GPU Clock |
Up to 2655 MHz |
Up to 2581 MHz |
Up to 2544 MHz |
Up to 2105 MHz |
Up to 2430 MHz |
Up to 2394 MHz |
|
Peak Single Precision Perf. |
Up to 21 TFLOPS |
Up to 13.21 TFLOPS |
Up to 35 TFLOPS |
Up to 16.17 TFLOPS |
Up to 37 TFLOPS |
Up to 51 TFLOPS |
|
Peak Half Precision Perf. |
Up to 43 TFLOPS |
Up to 26.43 TFLOPS |
Up to 70 TFLOPS |
Up to 32.33 TFLOPS |
Up to 74 TFLOPS |
Up to 103 TFLOPS |
|
Peak Texture Fill-Rate |
Up to 339 GT/s |
Up to 413 GT/s |
Up to 550 GT/s |
Up to 505.2 GT/s |
Up to 583 GT/s |
Up to 804 GT/s |
|
ROPs |
64 |
64 |
96 |
64 |
96 |
192 |
|
Peak Pixel Fill-Rate |
Up to 169 GP/s |
Up to 165.2 GP/s |
Up to 244 GP/s |
Up to 202.1 GP/s |
Up to 233 GP/s |
Up to 459 GP/s |
|
AMD Infinity Cache |
32 MB (2nd Gen) |
96 MB (1st Gen) |
48 MB (2nd Gen) |
128 MB (1st Gen) |
64 MB (2nd Gen) |
80 MB (2nd Gen) |
|
Memory |
8GB GDDR6 |
12GB GDDR6 |
12GB GDDR6 |
16GB GDDR6 |
16GB GDDR6 |
20GB GDDR6 |
|
Memory Speed |
18 Gbps |
16 Gbps |
18 Gbps |
16 Gbps |
19.5 Gbps |
20 Gbps |
|
Effective Memory Bandwidth w/AMD Infinity Cache |
Up to 476.9 GB/s |
Up to 1278.0 GB/s |
Up to 1995.3 GB/s |
Up to 1664.2 GB/s |
Up to 2708.4 GB/s |
Up to 2900 GB/s |
|
Memory Bus Interface |
128-bit |
256*bit |
192-bit |
256-bit |
256-bit |
320-bit |
|
PCIe Interface |
PCIe 4.0 x8 |
PCIe 4.0 x16 |
PCIe 4.0 x16 |
PCIe 4.0 x16 |
PCIe 4.0 x16 |
PCIe 4.0 x16 |
|
Total Board Power |
165W |
230W |
245W |
250W |
263W |
300W |
|
Launch MSRP |
$269 |
$479 |
$449 |
$649 |
$499 |
$899 |
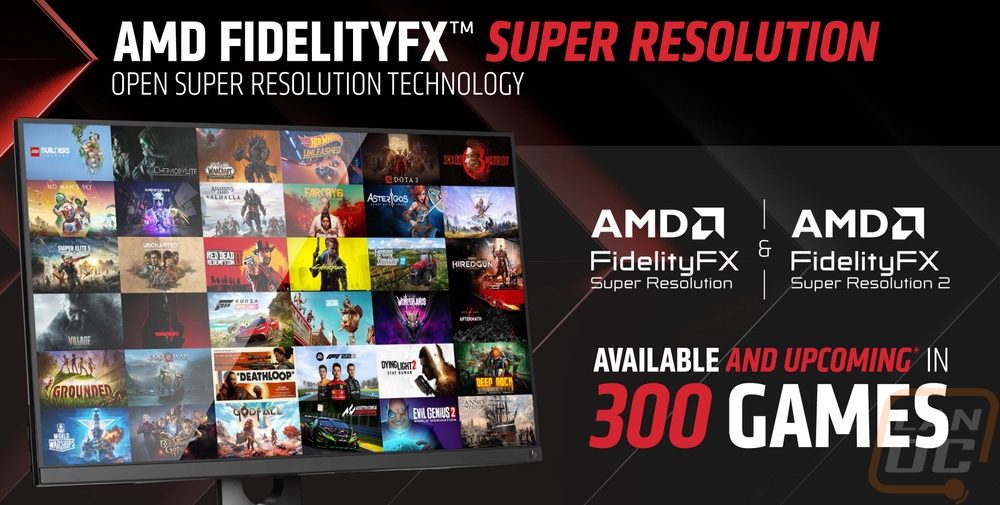
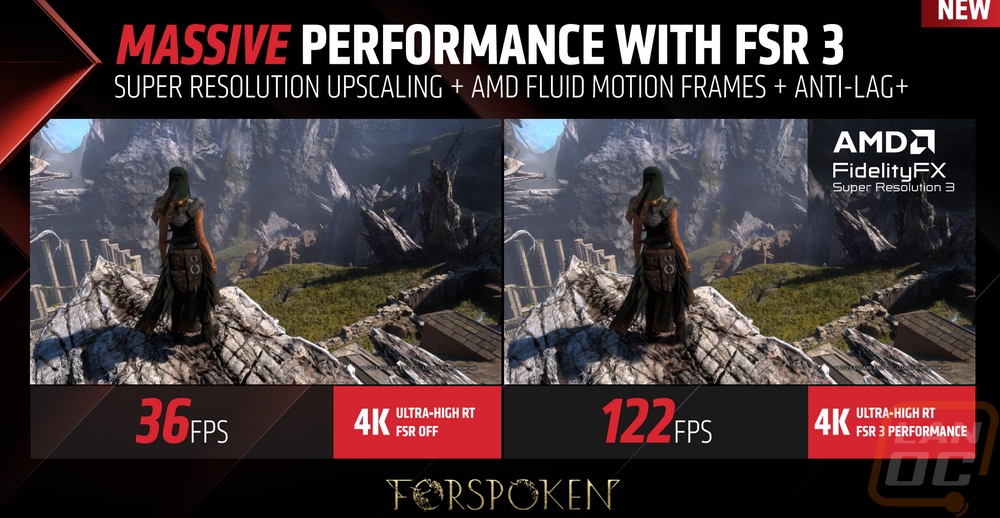
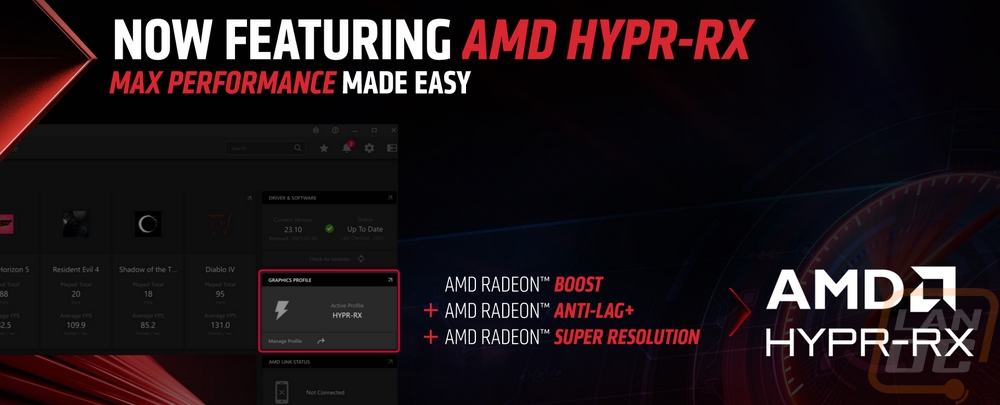
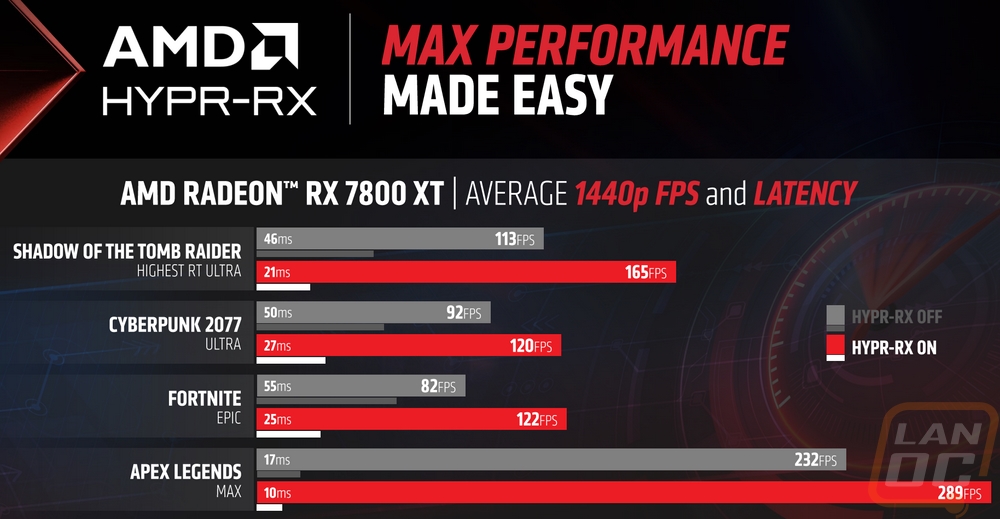
Alongside of the two new cards, AMD also announced their FidelityFX Super Resolution 3 which brings frame generation to AMD cards. Unlike DLSS from Nvidia AMD has this as an open standard so it can not only work with all of AMDs cards, but it can also work with Nvidia cards as well. FSP 3 with upscaling can work with AMD cards back to the RX 590 and Nvidia 10 Series cards but that doesn’t include frame generation. For that, you will need an AMD 5700 or better and RTX 20 Series or higher. They showed off the performance differences that you can see with Forspoken from Square Enix where they were able to go from 36 FPS up to 122 FPS at 4K by using FSR 3 performance mode. FSR 3 has a list of upcoming games and game support of course will make or break this as a feature. The performance is great, but if none of the games you play support It, well that doesn’t help at all. FSR and FSR 2 have 300 games with current or upcoming support so if that is any indication. They also have combined Radeon Boost, Anti-Lag+, and Super Resolution on the driver side into one feature they are calling Hyper-RX which helps make getting better performance easier, with that they showed off some performance improvements you can see with average FPS improving and latency dropping by big margins in all of the games shown.

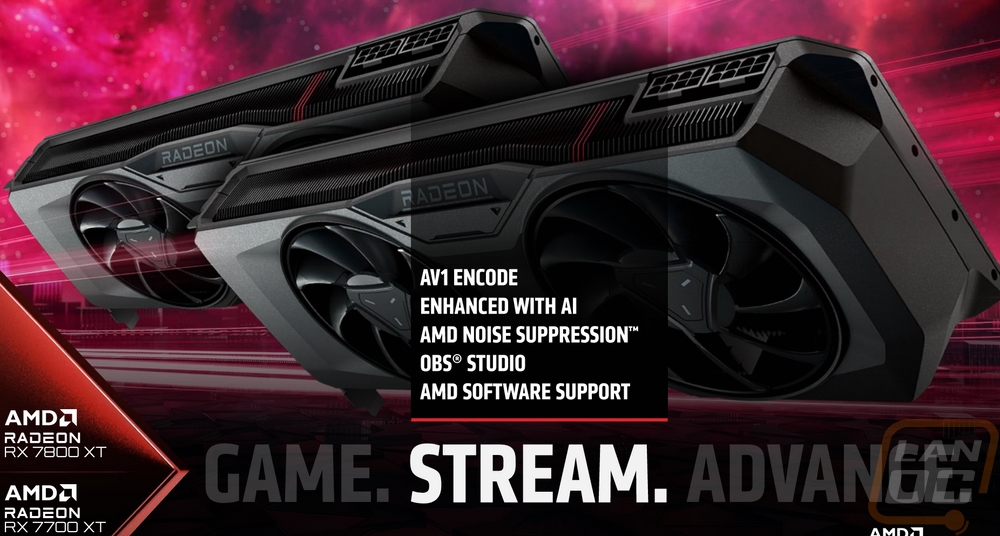
AMD also touched on the streaming capabilities as well on their call. Highlighting AV1 support which is the future of streaming. AV1 can get you higher quality while lowering the bandwidth needs. They also touched on AMDs noise suppression which can help cut out background noise from your microphone.
With the RX 7700 XT and RX 7800 XT hitting stores tomorrow September 6th, the cards are also timed to launch the same day as Starfield which utilizes AMDs technology. AMD is also offering a copy of the game to anyone who picks up the 7700 XT or the 7800 XT. This is a great way to add some value to the cards and also make sure everyone has access to a brand new game to check out how your new cards can perform.

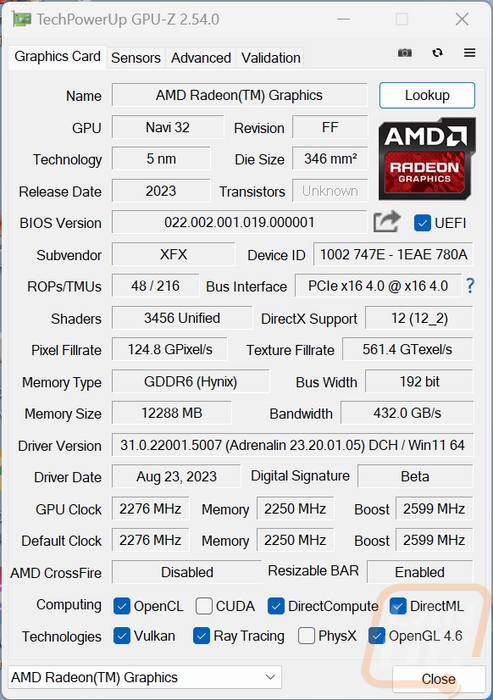
Before getting into testing I did also run GPUz to double-check that our clock speeds matched up with the specifications. The QICK 319 RX 7700 XT Black, unlike the Sapphire RX 7700 XT Pulse that I already took a look at is an overclocked card. It has a game clock of 2276 MHz which is 105 MHz over the stock clock on the Pulse. Then for the boost clock, it can see up to 2599 MHz which is 55 MHz higher than the Pulse. For testing, I used the Adrenalin 23.20.01.05 driver which AMD provided ahead of the launch, and the BIOS revision is also noted on GPUz in case it is needed in the future.
|
XFX QICK 319 7700 XT Black Specifications |
|
|
Model Number |
RX-79XMERCB9 |
|
Product Description |
XFX SPEEDSTER QICK319 RADEON RX 7700 XT BLACK Gaming Graphics Card with 12GB GDDR6 HDMI 3xDP, AMD RDNATM 3 |
|
Card Dimension (cm) |
33.5 x 13 x 5.2 |
|
Card Dimension (inch) |
13.2 x 5.1 x 2 |
|
Card Profile |
2.5 Slot |
|
DUAL BIOS Setting |
Right: OC: 220w Factory Default Setting Game Clk: up to 2276 MHz Boost Clk: up to 2599 MHz Note: Right BIOS is the position closest to I/O shield. Left: OC: 220w Backup Bios Game Clk: up to 2276 MHz Boost Clk: up to 2599 MHz Note: There is no difference in BIOS positions at this time |
|
Thermal Solution |
3 Fan |
|
Memory Type |
GDDR6 |
|
Memory Size |
12 GB |
|
Memory Clock |
18 Gbps |
|
Memory Bus |
192 bit |
|
Compute Units |
54 |
|
Stream Processors |
3456 |
|
Bus Type |
PCI-E 4.0 |
|
TGP |
220w |
|
Warranty |
3 Years with product registration |
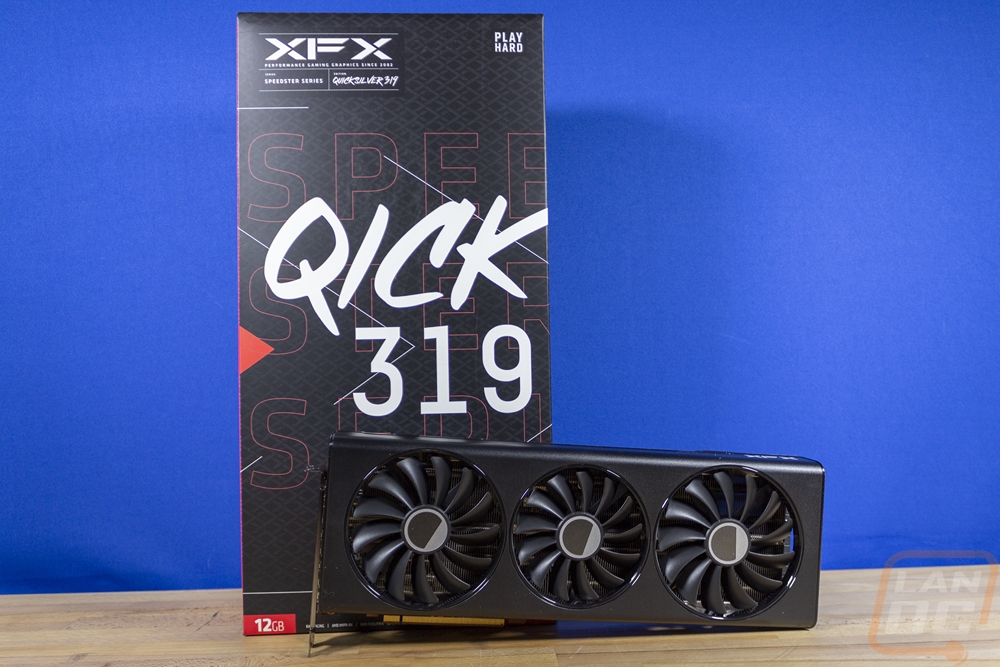
Packaging
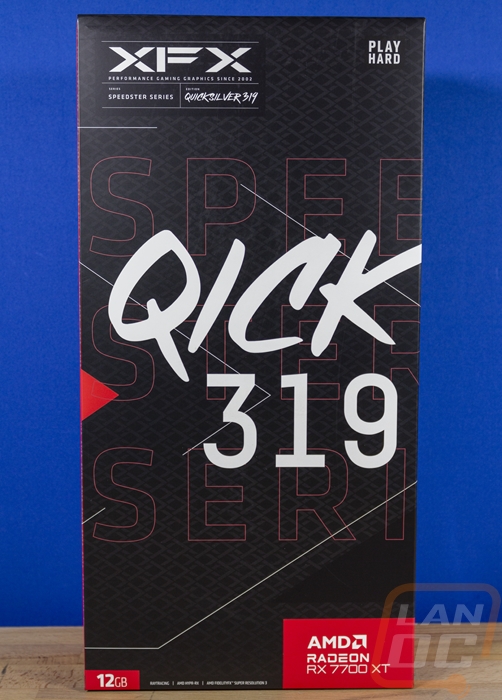
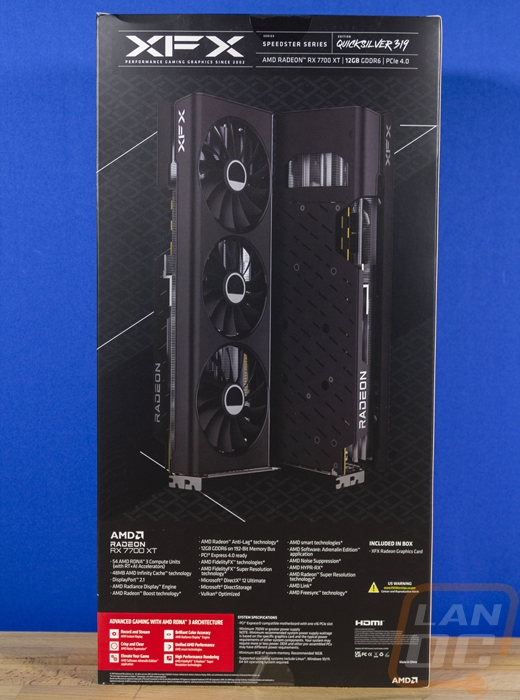
If you have seen the last few generations of cards the styling for the XFX Speedster Qick319 RX 7700 XT Black isn’t going to be too much of a surprise for you. But if you haven’t the vertical orientation that XFX has gone with is going to be a little different for you. This setup is similar to what EVGA did with some of their cards and I always like the look because it also shrinks down the size of the wrap-around down at the bottom to be a little less in your face. The Speedster branding is hidden in the black background with the Qick319 model name taking up most of the front and is extra visible being white on the black background. The XFX logo is in the top left corner and then down in the bottom right in the red wrap around you have the AMD branding as well as the GPU model name. Around on the back of the box, the black background continues but here they have a design overlayed in a dark grey. Then in the center, there are two pictures of the XFX Speedster Qick319 RX 7700 XT Black with it sitting vertically to match the box orientation. One picture shows the top edge and fans and the other shows the back and more of the top edge. Below that is a feature breakdown which touches on the normal AMD features, nothing specific from XFX and they let you know that the card is the only thing in the box. I love having pictures of the card on the box but do wish there could be at least some basic specifications like card dimensions, If you are shopping in retail that would be important information to have.
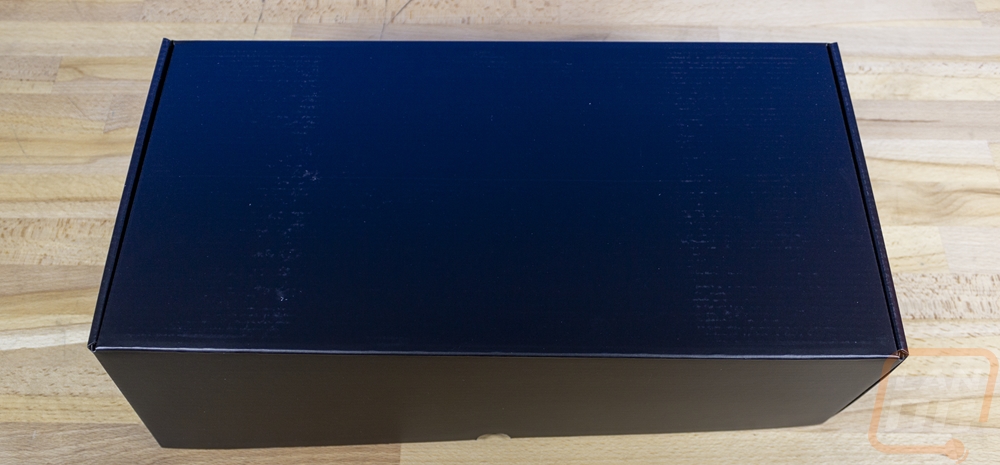
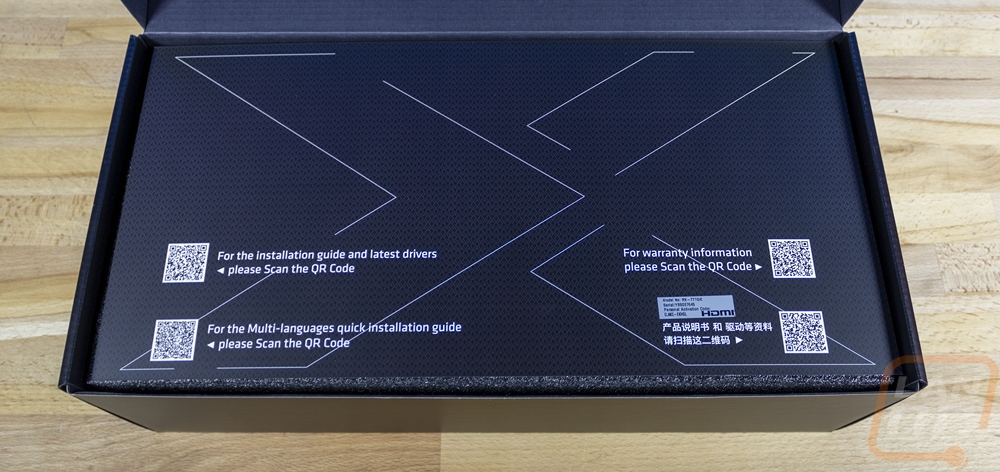
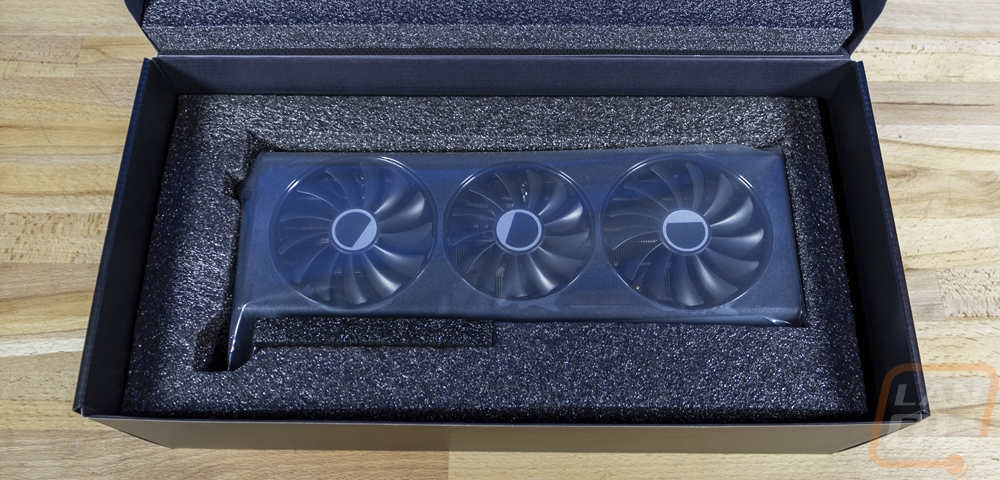
Inside the outer box is the main thicker cardboard box which has a black finish. When you open this one up right up on to is a card that covers the entire box. This has the XFX X shape across it and then four QR codes. One has the warranty information, one is for an installation guide links to the latest drivers. There is also a multi-language guide and one in the bottom right which is in Chinese but the QR code takes you to a driver page. They also have a your serial number sticker on this card, just like the one on the card itself which makes any warranty registration or RMA easier to do. Under the card, you will find an inch thick layer of foam. Under that foam, the XFX Speedster Qick319 RX 7700 XT Black is packed away. It comes in a heavy clean plastic bag and also comes with plastic covering most of the cooler and backplate to prevent any scuffs or scratches. Then it is sitting in a thick foam tray cut to fit it.
Card Layout and Photos
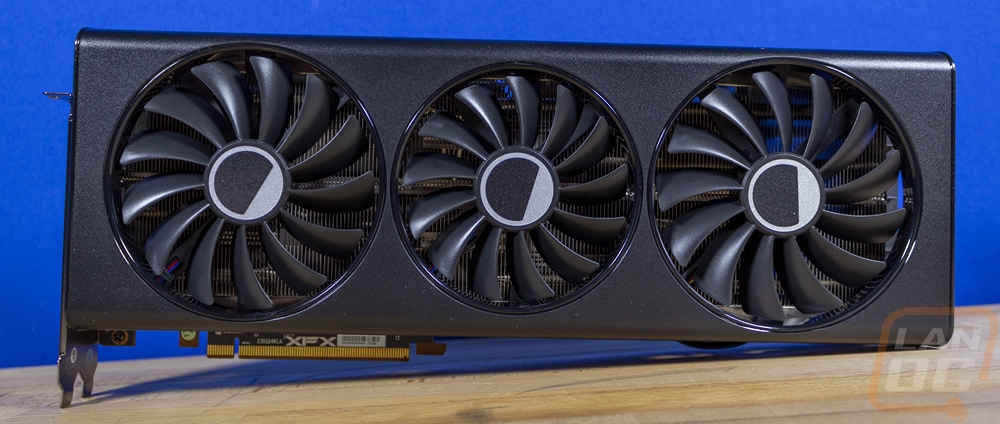
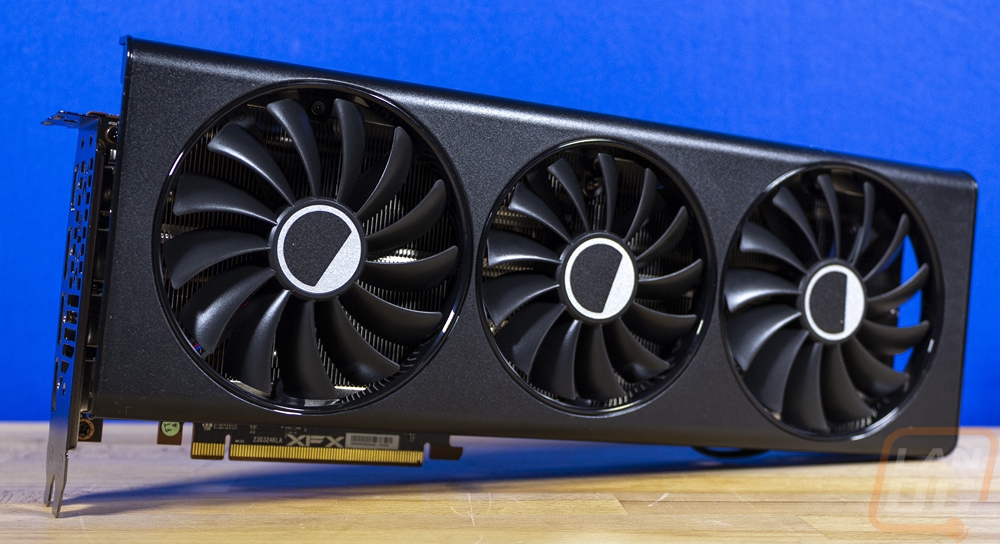
In my review of the XFX MERC 319 RX 7800 XT Black earlier today I said it's simple black with silver styling was a lot like a tuxedo, it is simple, clean, and never goes out of style. If the MERC design is a tux then the QICK 319 RX 7700 XT is an all-black suit. It has the same styling with its flat-fronted black plastic fan shroud that wraps around on to the top and bottom. But unlike the MERC the QICK 319 RX 7700 XT doesn’t have the same silver accents around the fans or the all-silver backplate. This setup is just as simple but all black. It's also still the same setup that XFX has used for this and last generations cards but I just love that it doesn’t go over the top trying to look ”gamer”. It also doesn’t have any lighting on it and branding is at a minimum.
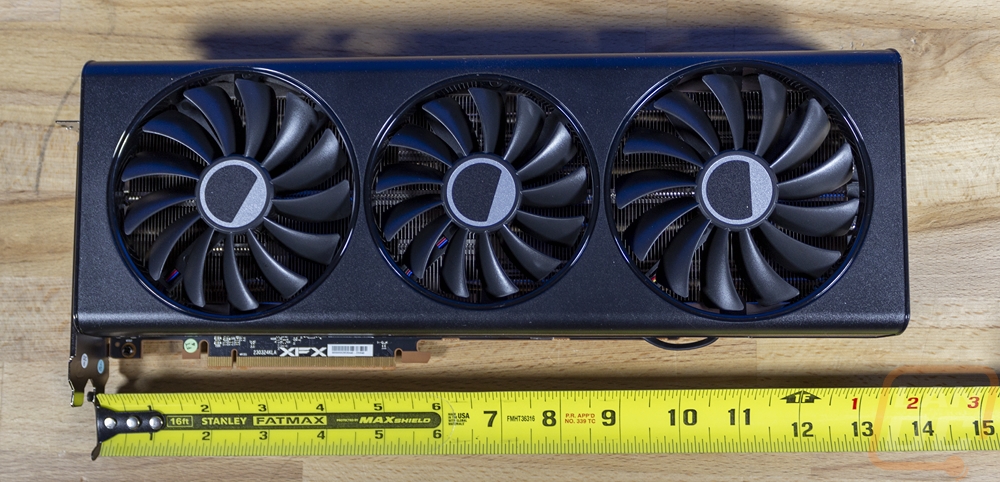
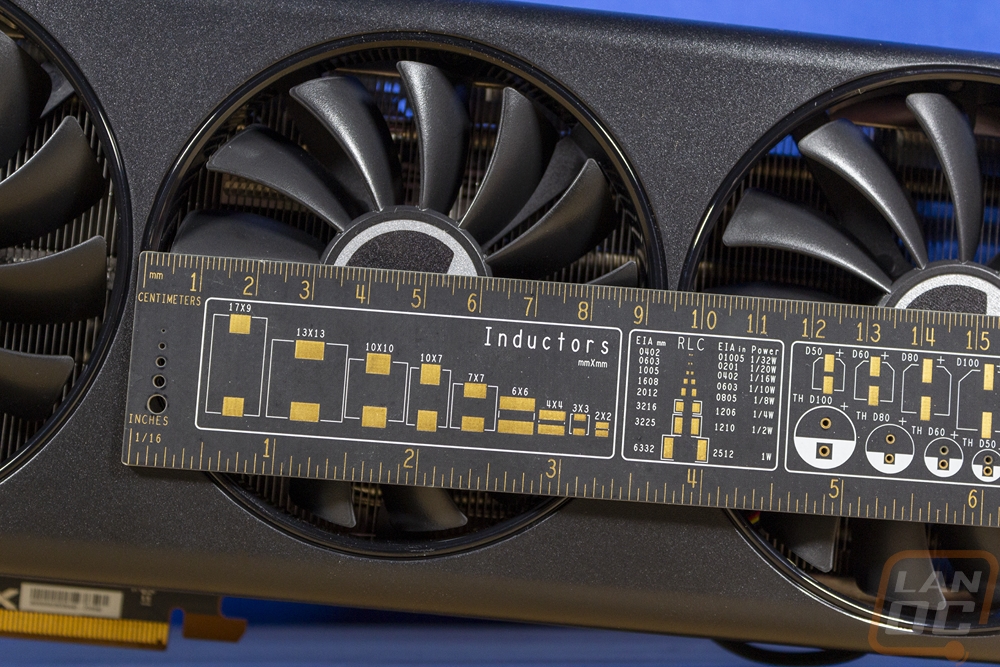
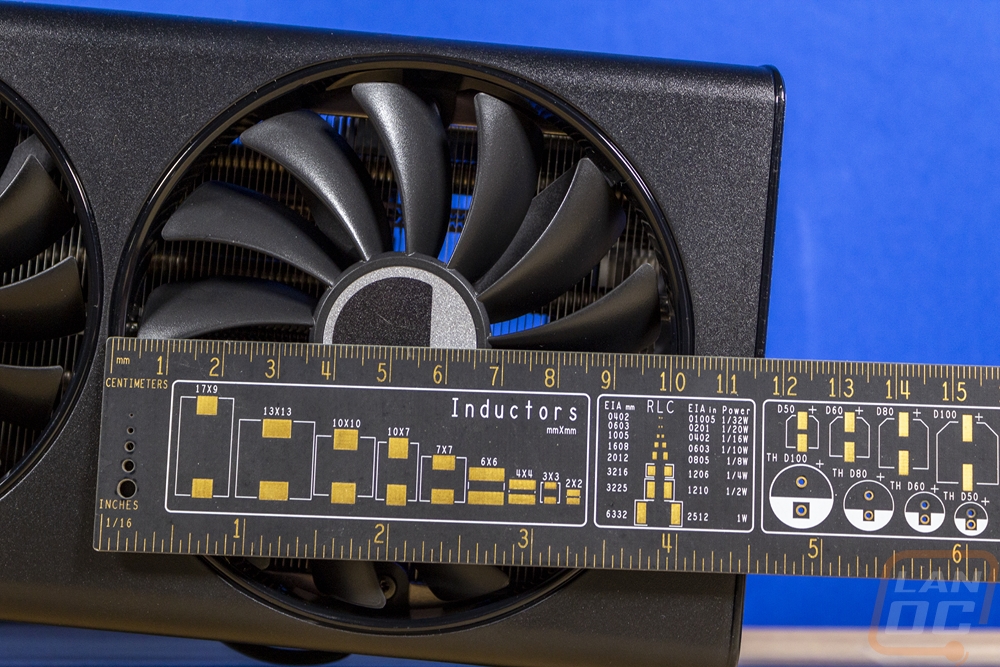
The QICK 319 RX 7700 XT Black isn’t a small card by any means. It is 13.189 inches or 335 mm long which is needed to pack in the triple card design. The top of the cooler sticks up past the top of the PCI bracket by 25mm making it tall but these days this is close to average. The total height of the card is 130 mm. Then for thickness, the card comes in at 52 mm thick or just a hair past a two and a half slot card. With all of that, it is larger than the Sapphire 7700 XT Pulse I just took a look at but mostly on the card length.
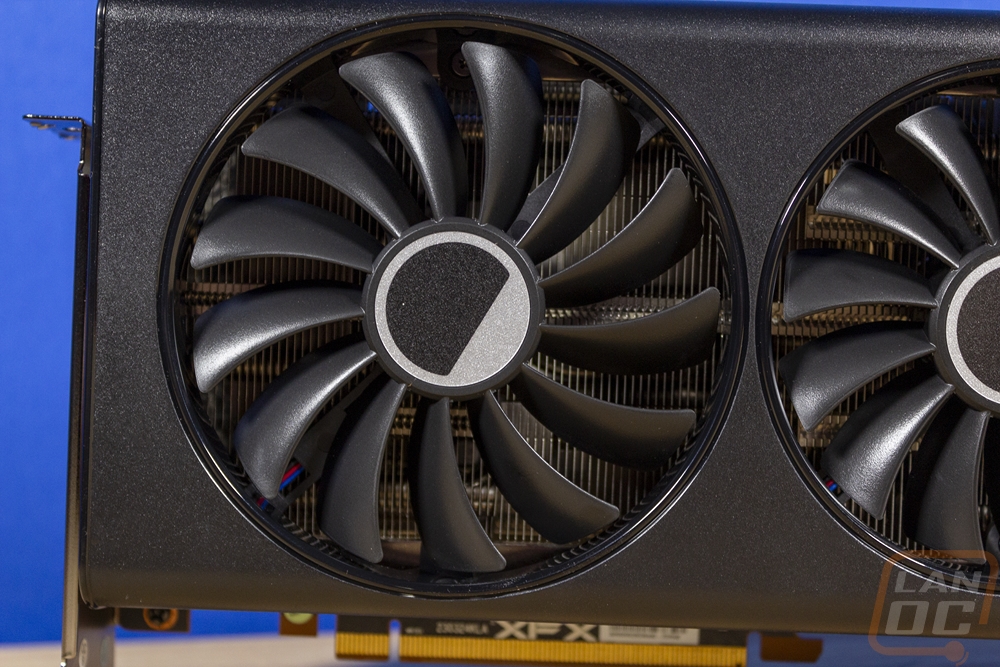
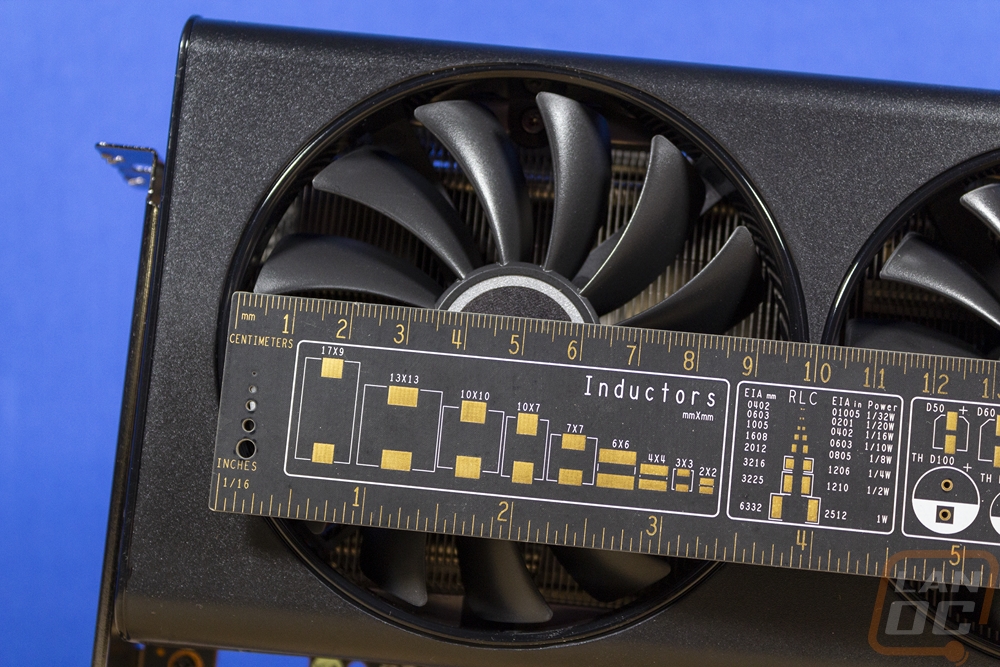
The fan design on the QICK 319 RX 7700 XT is the same as we saw on the MERC 319 RX 7800 XT Black. You get a triple fan layout with two 100 mm fans on the ends and one smaller 90 mm fan in the center. Those are the measurements for the fan openings the fans were 96 mm tip-to-tip for the 100 mm and 86 mm tip-to-tip for the 90 mm fan and all three are 15 mm thick. They all have 13 blades and blow down in an axial configuration to blow down into the heatsink below. XFX also has them set to turn off at below 50c to keep the noise down when you aren’t gaming. The fans are black to match the blacked-out card but do have the same silver and black sticker on the center which takes away from the all blacked out look slightly.
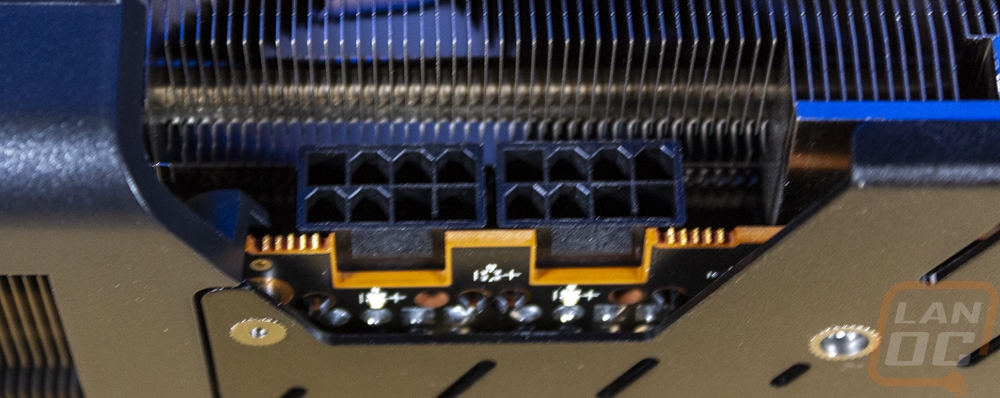
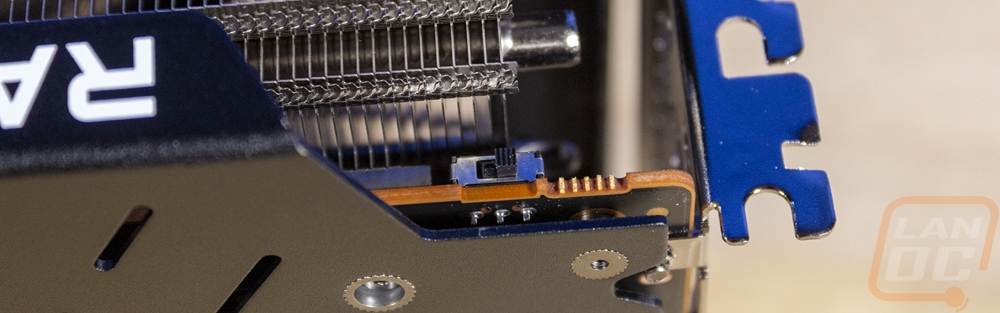
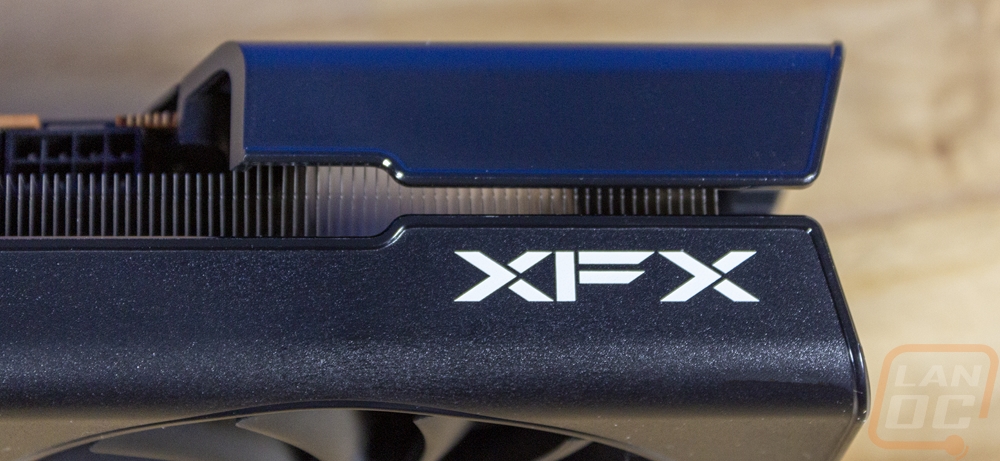
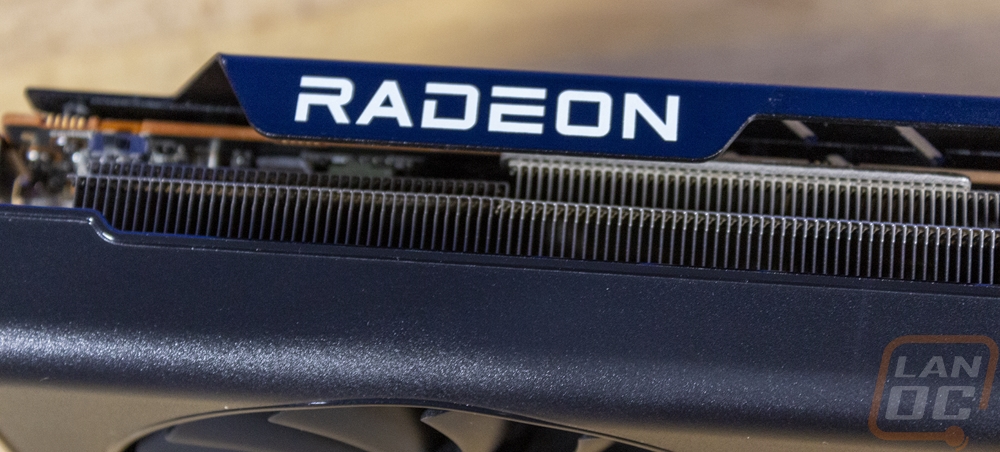
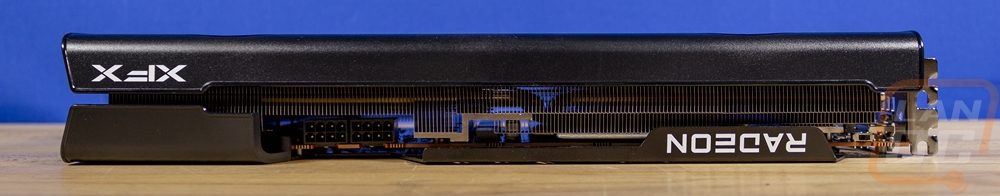
Up along the top edge of the QICK 319 RX 7700 XT Black, the backplate wraps around in one section and has the Radeon logo printed on it in bright white. Then on the other end, the fan shroud wraps around and has the XFX logo. There aren’t any backlit logos or any lighting at all in fact and with everything in white it looks great on the otherwise all-black card. The top also has two sections where the backplate is cut down to the height of the PCB. One is on the far right near the PCI bracket, this is a dual BIOS switch. Our card has just the same profile on both, I’m not sure if XFX is planning on having two different profiles or if they just have it as a safety for someone who wants to overclock. The other recessed area has the two power connections. The QICK 319 RX 7700 XT Black has two 8-pin PCIe power plugs, just like the Pulse and both of the 7800 XTs that I have tested as well. This does mean that you don’t have to worry about needing an updated power supply or running ugly adapters. With the power plugs being down lower, the extra height of the QICK 319 RX 7700 XT Black is just utilizing the height that your power plugs would already be using which is nice for card height in cramped cases.
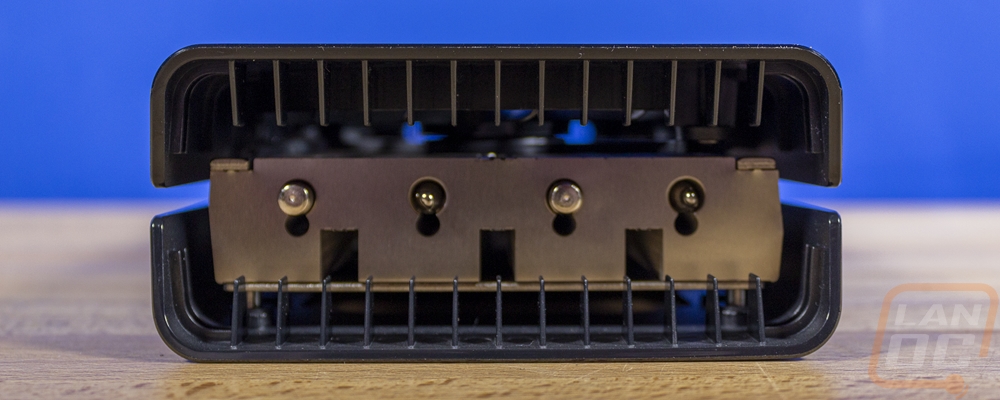
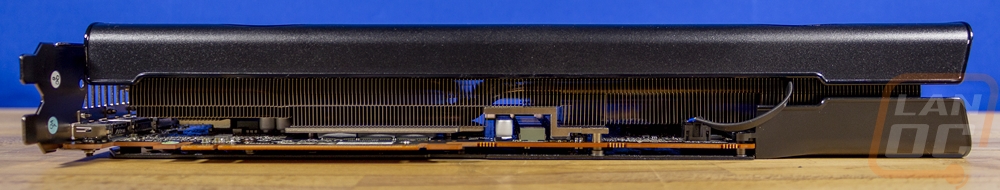
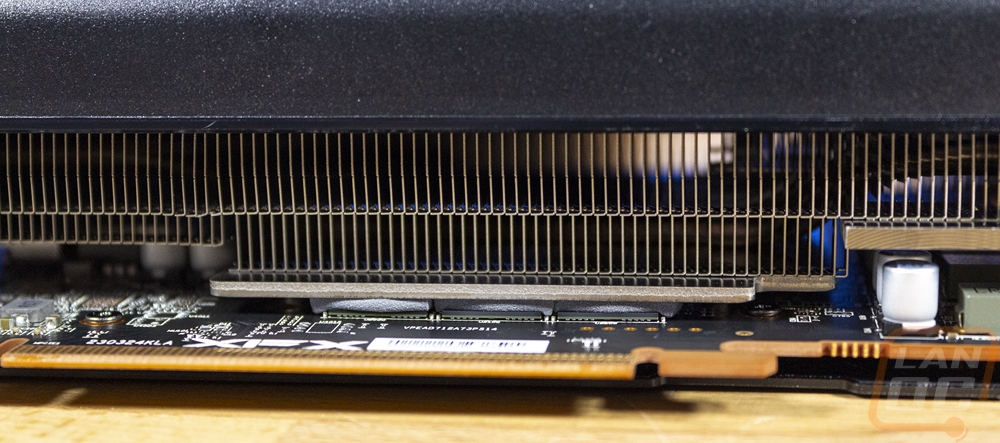
Working around the top, bottom, and end of the card we can get a better idea of XFX’s cooling configuration. I was surprised at how much of the top edge of the card is covered given that is where most of the air flow will be going. It makes sense down at the end where all of the air will be going out the back but it is a little restrained the rest of the way with the shroud wrapping around a lot. The end of the card is also open with small fins sticking up into it from the fan shroud that looks like a car bumper diffuser. This gives us a peak at the heatpipes, the QICK 319 RX 7700 XT Black has 5 in total but four of them run down to this end of the card. Then the bottom view does show us that the cooler is designed to wrap around components on the PCB, not just a universal design. The QICK 319 RX 7700 XT Black has a copper cold plate that sits on top of the GPU and VRAM, this isn’t a vapor chamber design like on the MERC 319 RX 7800 XT Black but they do get contact on everything and have the heatpipes on top of it to pull the heat out across the card. It isn’t visible here but the VRM also has thermal pads on them with 8 in total on the card. The PWM is fully digital and has 14 phases with DrMos chips, the 14 MOSFETs are all MP87997C and the three PWM are model number MP2856.
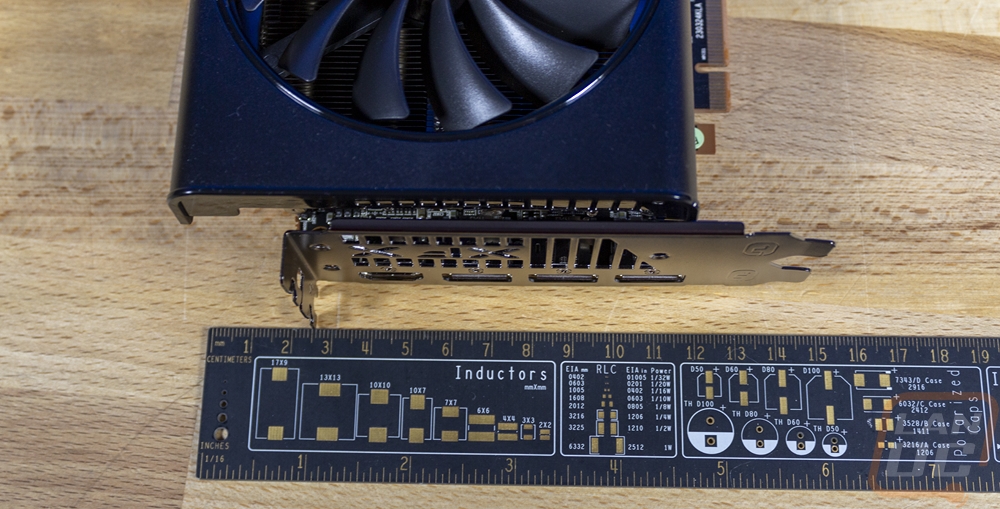
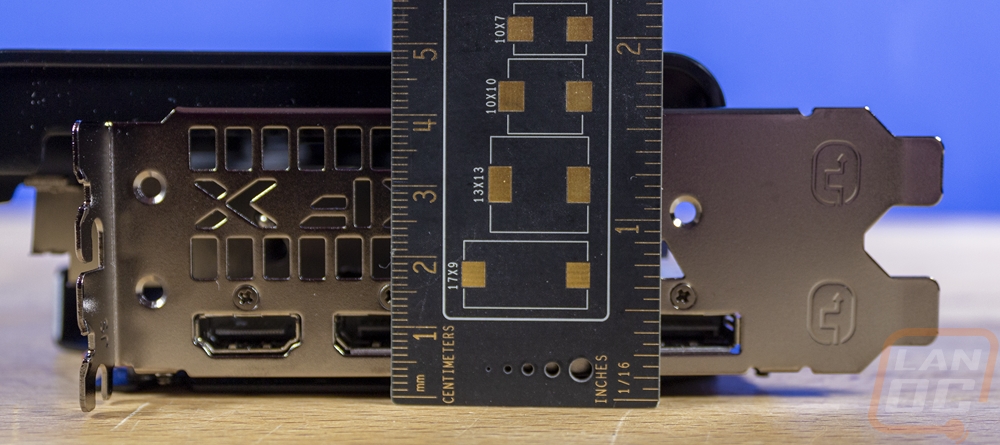
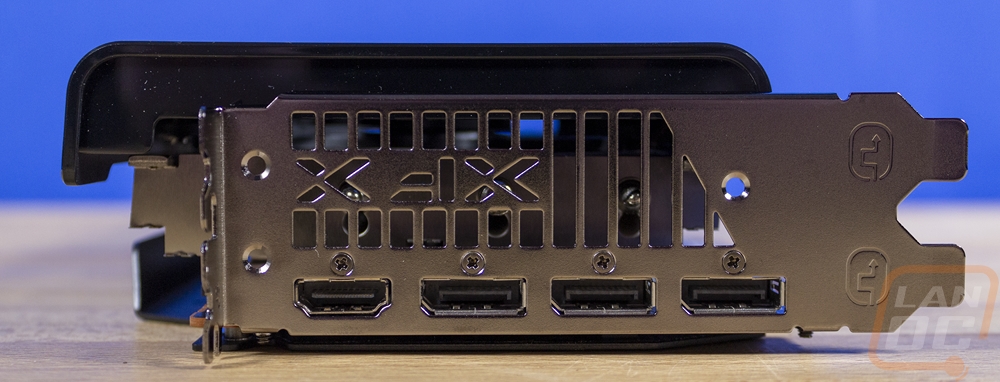
For display connections, the Qick319 RX 7700 XT Black has four connections. You get three DisplayPort 2.1 connections which start towards the bottom and then you end with one HDMI up at the top. All four run along the PCB which leaves a lot of room above that. Some of that is filled with some ventilation which has the XFX branding in it and then strips but there is some of the bracket towards the bottom edge that is just blocked off. None of the ventilation matters at all as the cooler design doesn’t push air in this direction at all.
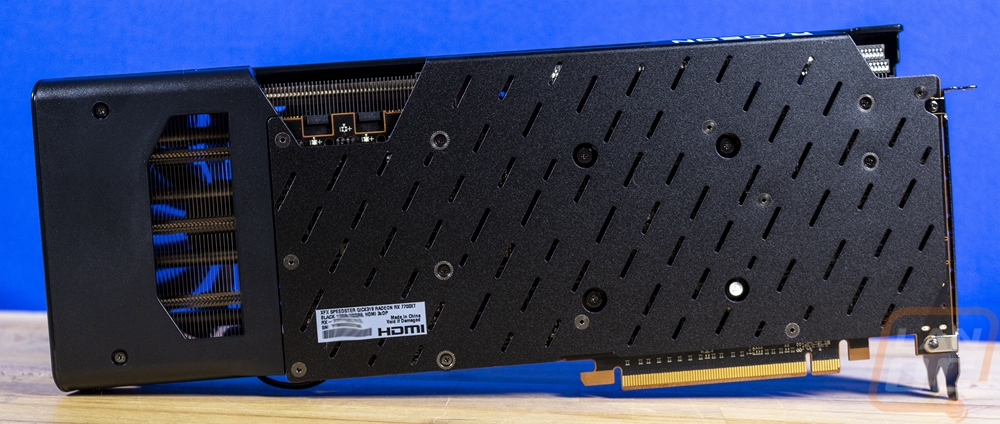
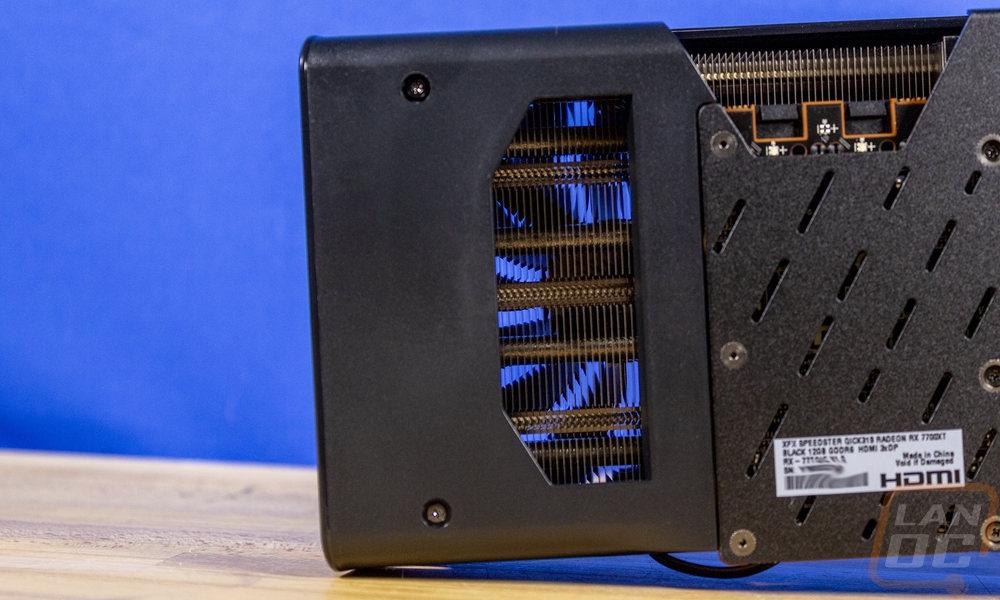
Unlike the MERC 319 RX 7800 XT Black which had that thick die-cast aluminum backplate which had a bright silver finish. XFX went a different direction for the QICK 319 RX 7700 XT Black. This has a black backplate for starters and this one is sheet metal aluminum not die-cast. It also doesn’t run the full length of the card, it ends at the end of the PCB, and from there on the plastic fan shroud wraps around. That end section does have the blow-through design but the hole is smaller than I saw on the MERC. The rest of the backplate has small angled slots across it for some ventilation. There isn’t any branding on the entire back of the card. But XFX did include the information sticker with the model name and your serial number on it.
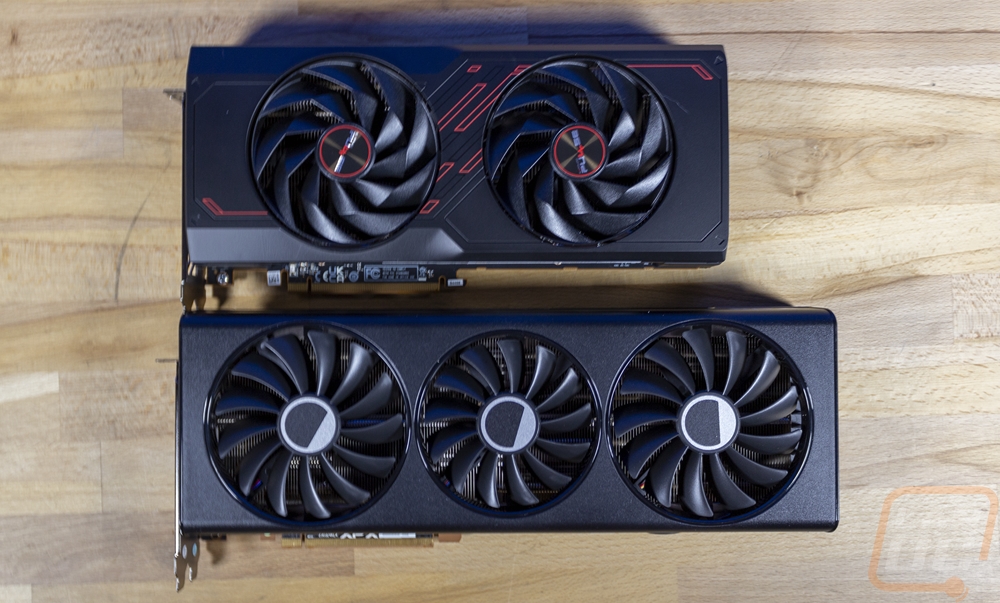
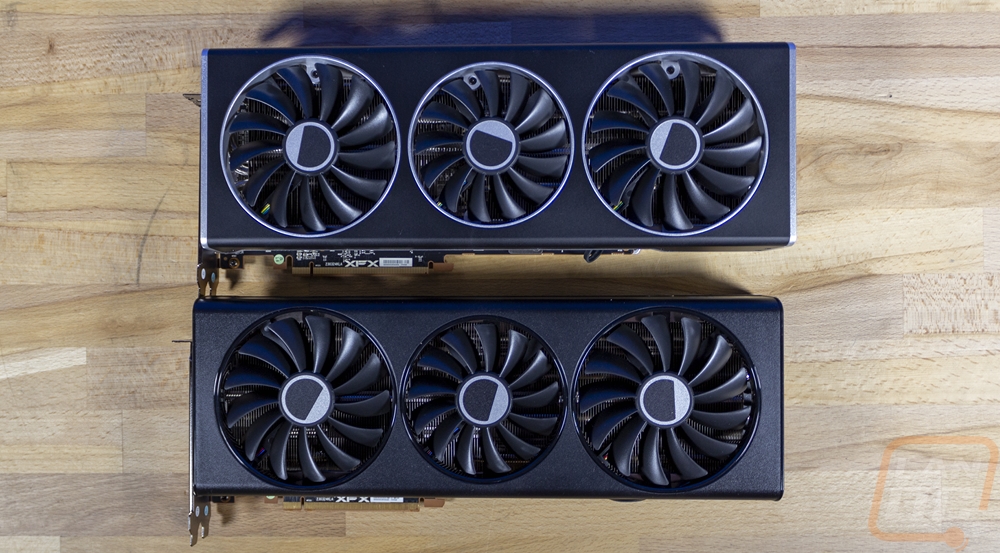
I did get a comparison shot between the QICK 319 RX 7700 XT Black and the Sapphire RX 7700 XT Pulse that I reviewed just before this card. The size difference between the two is easy to see but that extra space helped XFX fit a third fan into the mix as well as the blow-through cooler section at the end. For height though the two cards are similar in height. I also have a picture of the QICK 319 RX 7700 XT Black next to its big brother the MERC 319 RX 7800 XT Black that also launched today. The QICK 319 RX 7700 XT Black is just a hair smaller but you can see the similarities with the same triple fan configuration and the basic flat fan shroud, of course the QICK 319 RX 7700 XT Black doesn’t have any of the silver other than on the fan centers.
Test Rig and Procedures
CPU: Intel Core-i9 13900K – Live Pricing
PL1=PL2: 253, τ: 56 / 307A
Motherboard: Asus Z790 Extreme – Live Pricing
Cooling: Corsair H100i Elite LCD Display - Live Pricing
Noctua NT-H1 Thermal Paste - Live Pricing
Memory: Crucial 32GB Kit (2 x 16GB) DDR5-5600 UDIMM– Live Pricing
Storage: Sabrent Rocket Q4 2TB – Live Pricing
Power Supply: be quiet! Dark Power Pro 13 1600W- Live Pricing
Case: Primochill Wetbench - Live Pricing
OS: Windows 11 Pro 64-bit - Live Pricing
|
Our Testing Procedures |
|
|
3DMark |
All 3DMark-based tests are done using the most recent version. We test using all three versions of Fire Strike, Both Time Spy and Time Spy Extreme, and Speed Way. Tests to look at ray tracing performance are done with Port Royal when supported and for Nvidia cards that support DLSS, the DLSS subtest is also done at 1440p with the performance setting and DLSS 2.0 as well as a look at DLSS 1, 2, and 3 at 4K. |
|
Unigine Superposition |
1080p Extreme and 4k Optimized benchmarks along with the VR Future test are done. The VR test is done at the Oculus resolution |
|
VRMark |
Only the Blue room test is run |
|
CS:GO |
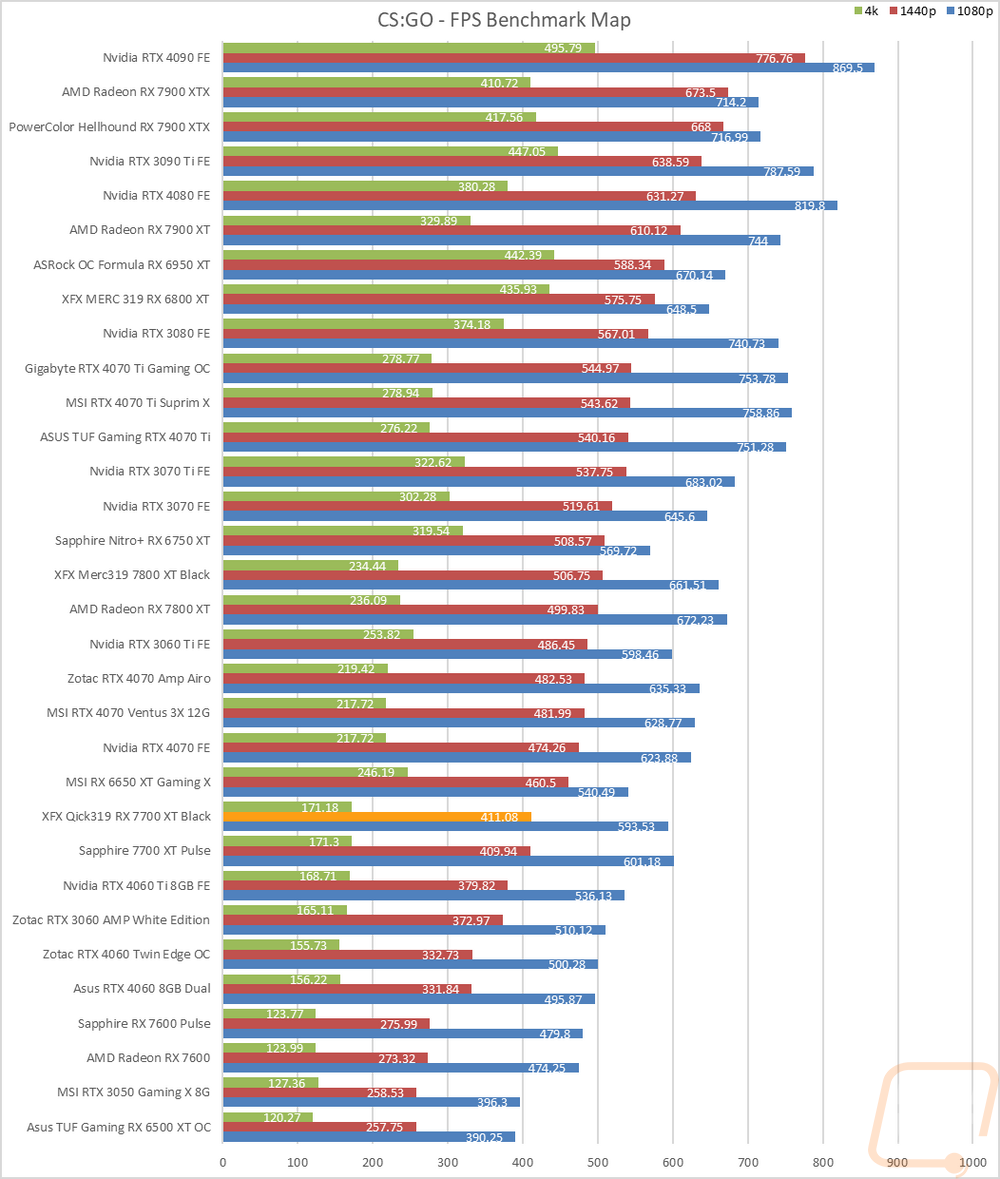
This test is done using the workshop map called CS:GO Benchmark. You can find more information at this link. https://www.gamingpcbuilder.com/how-to-install-csgo-fps-benchmark-map/ I test at 1080p, 1440p, and 4K resolutions. All auto settings are turned off and detail is set to their highest settings. shadow quality high, model texture detail high, shader detail very high, AA set to 16x, uber shaders enabled |
|
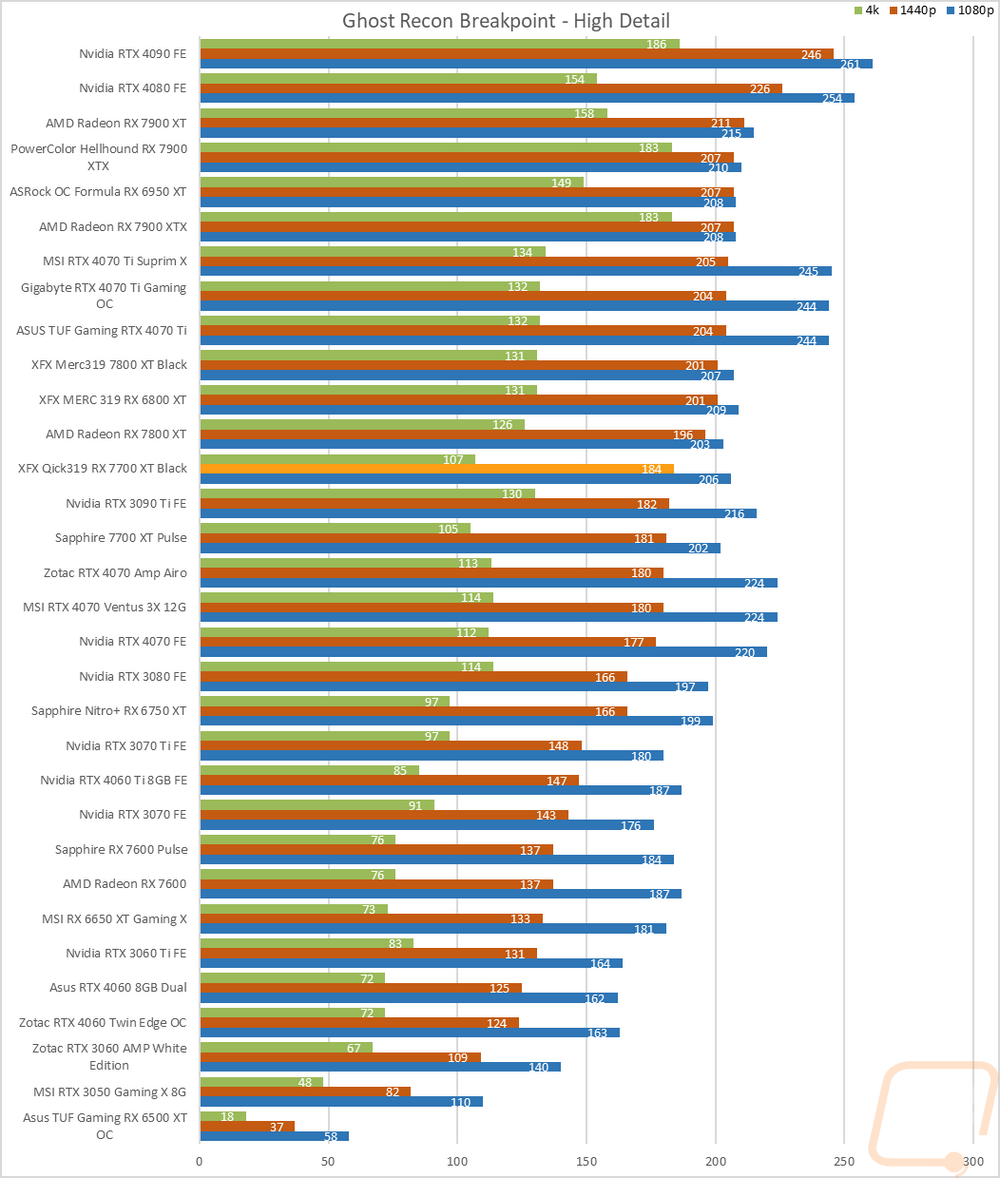
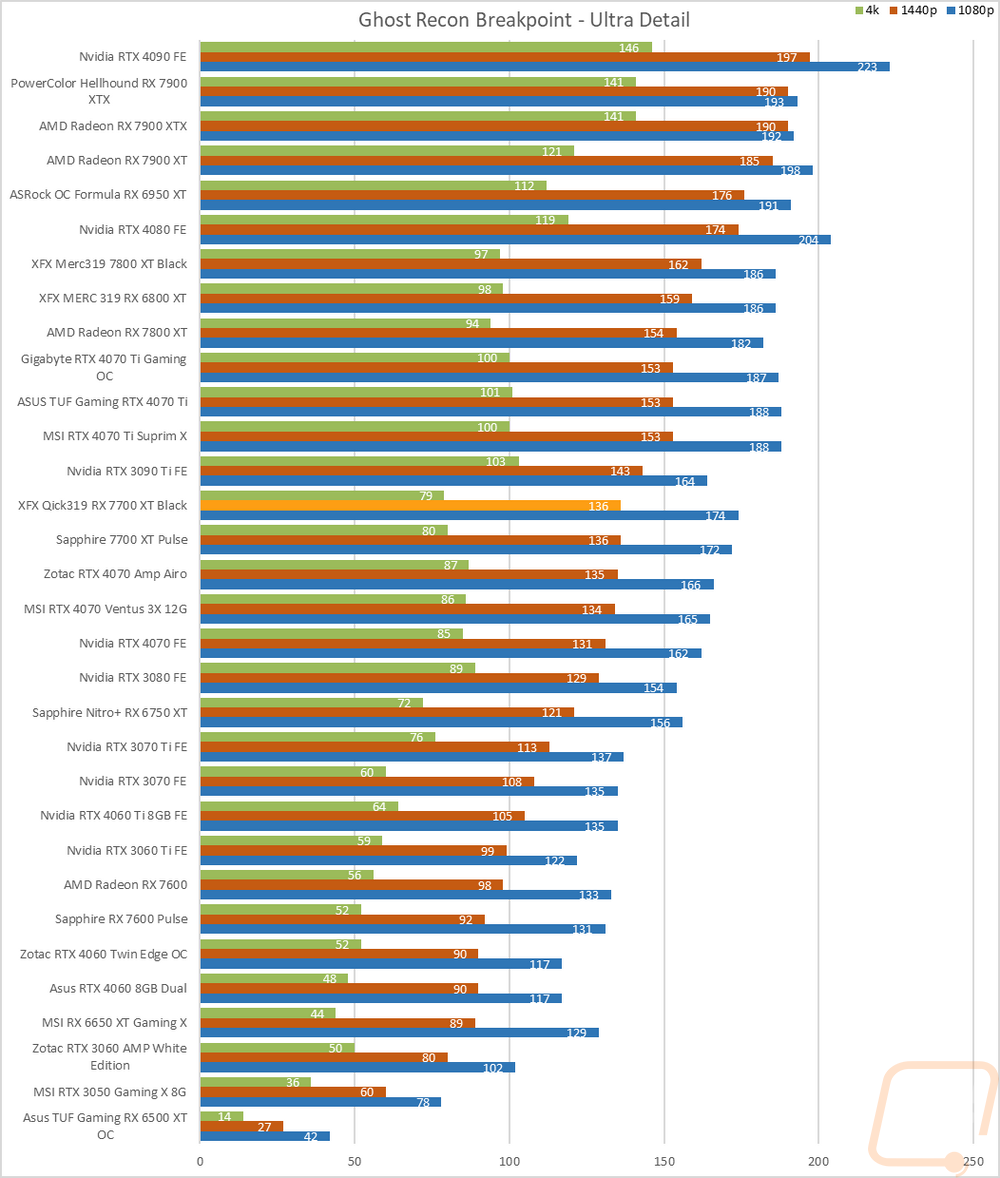
Ghost Recon Breakpoint |
Built-in benchmark tested at 1080p, 1440p, and 4k with the Ultra and Medium detail settings |
|
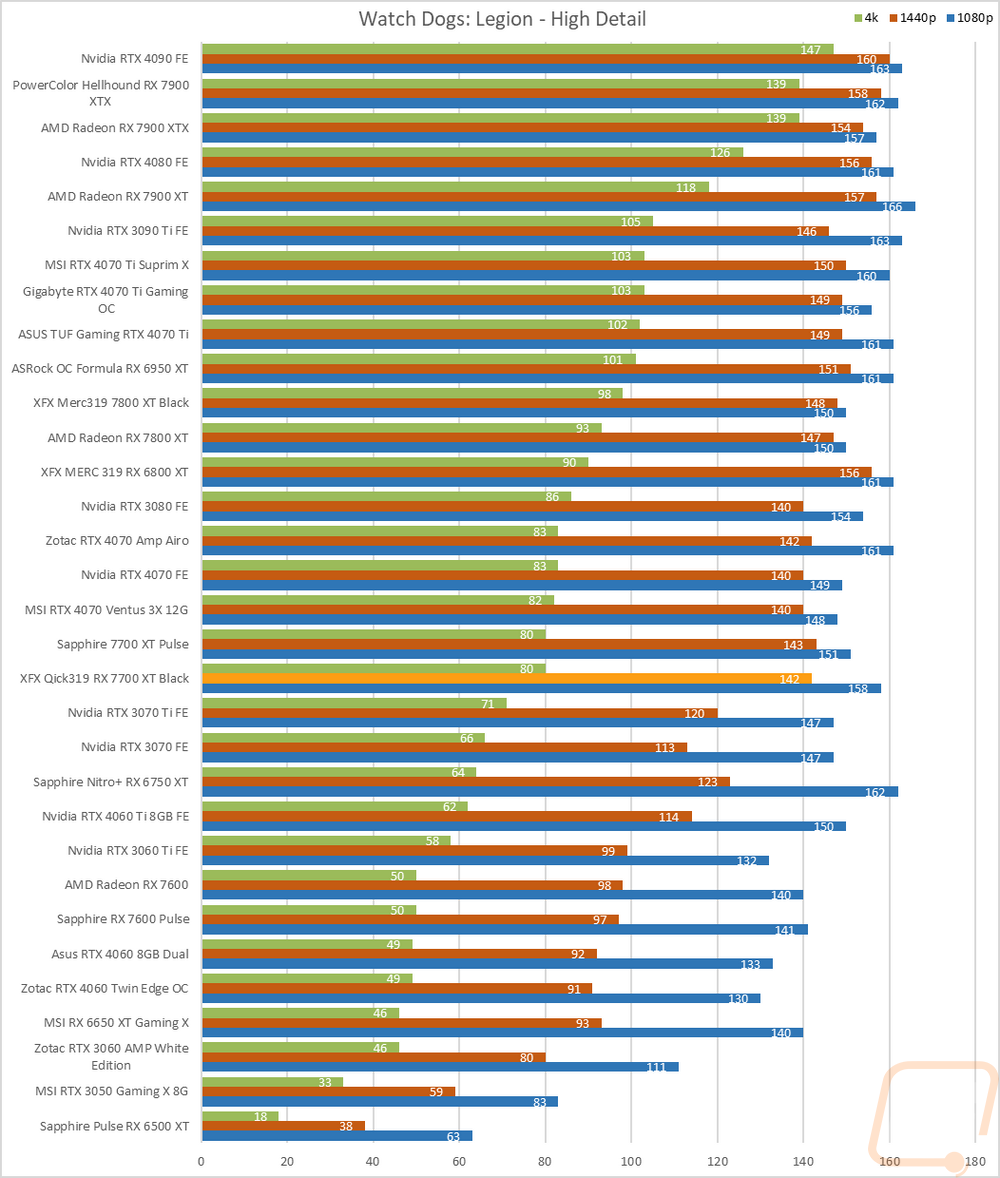
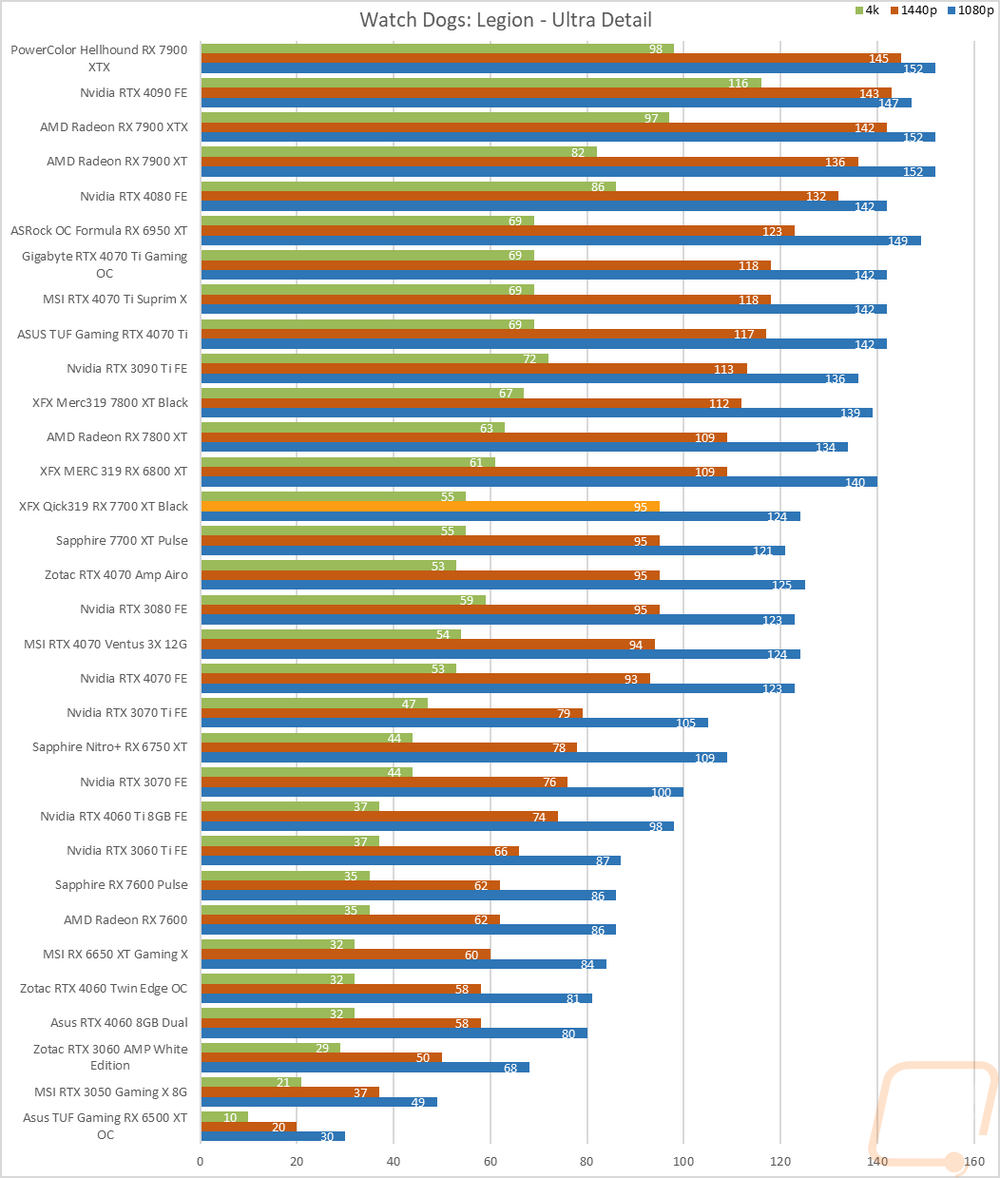
Watch Dogs: Legion |
Built-in benchmark testing at ultra and high details. Tested at 1080p, 1440p, and 4k. I also do RTX and DLSS testing on Nvidia cards at 4K using the Ultra detail settings as a base as well. |
|
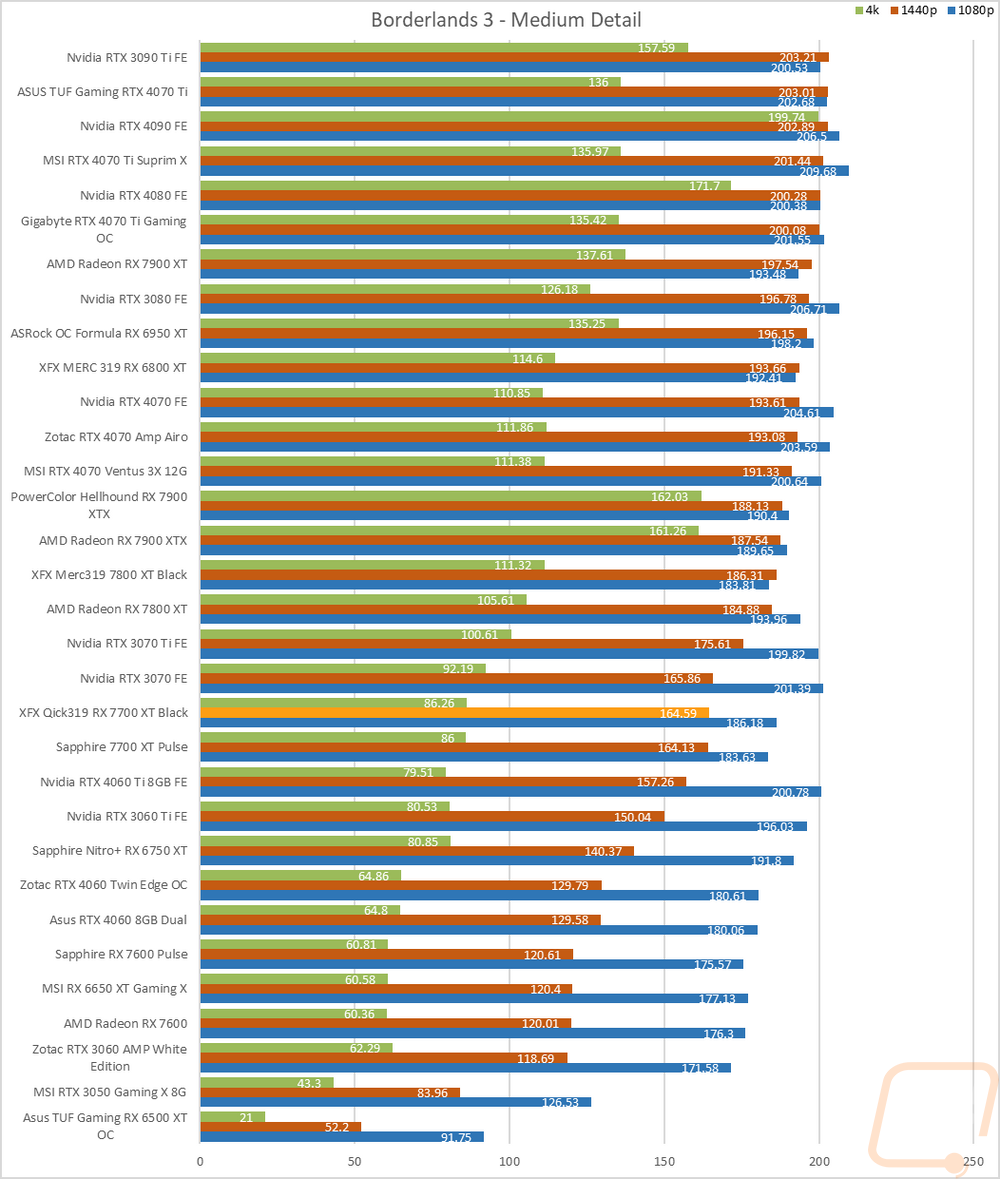
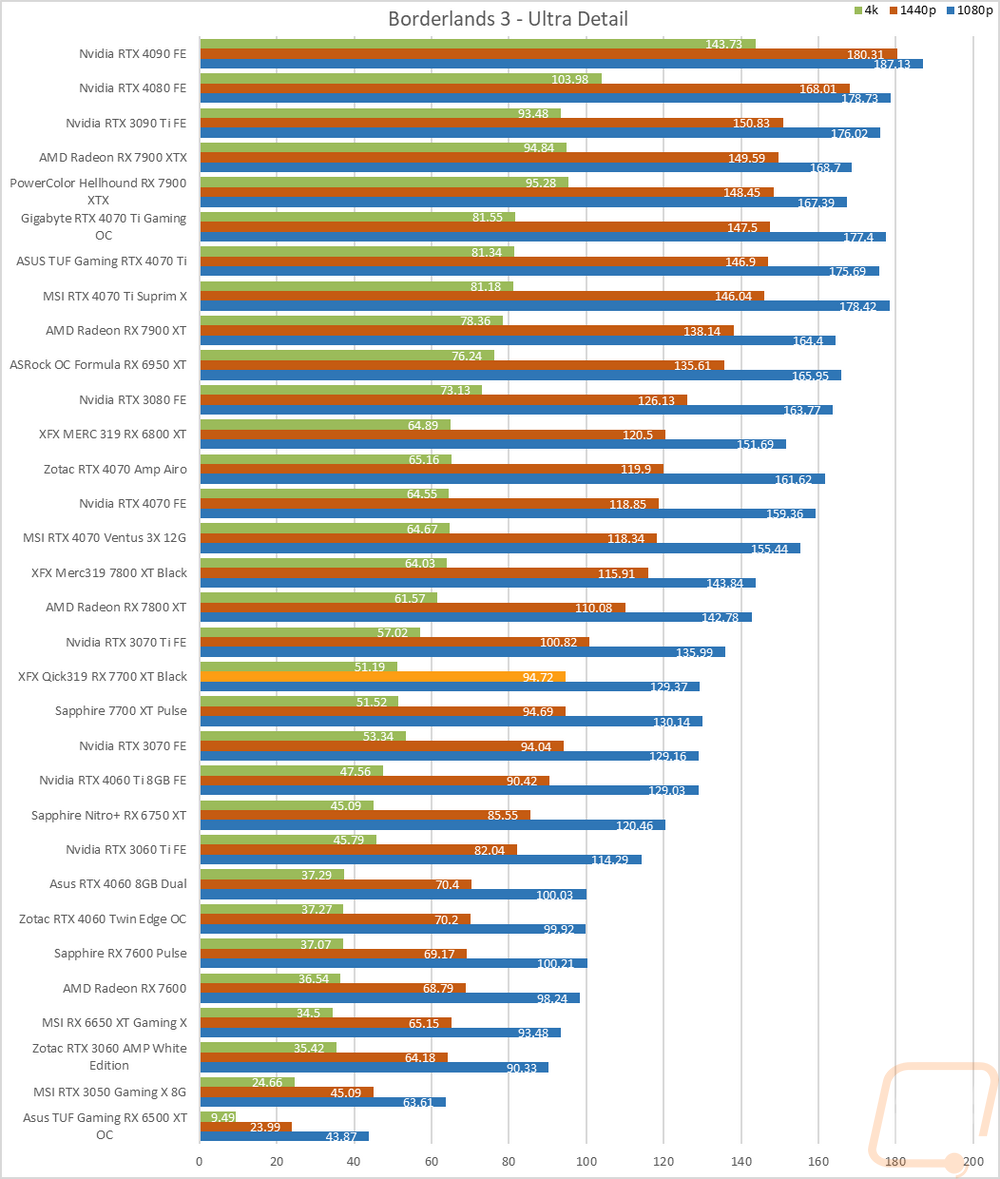
Borderlands 3 |
Built-in benchmark testing with the ultra detail setting and medium detail setting, done at full screen with default settings at 1080p, 1440p, and 4k on DX11 |
|
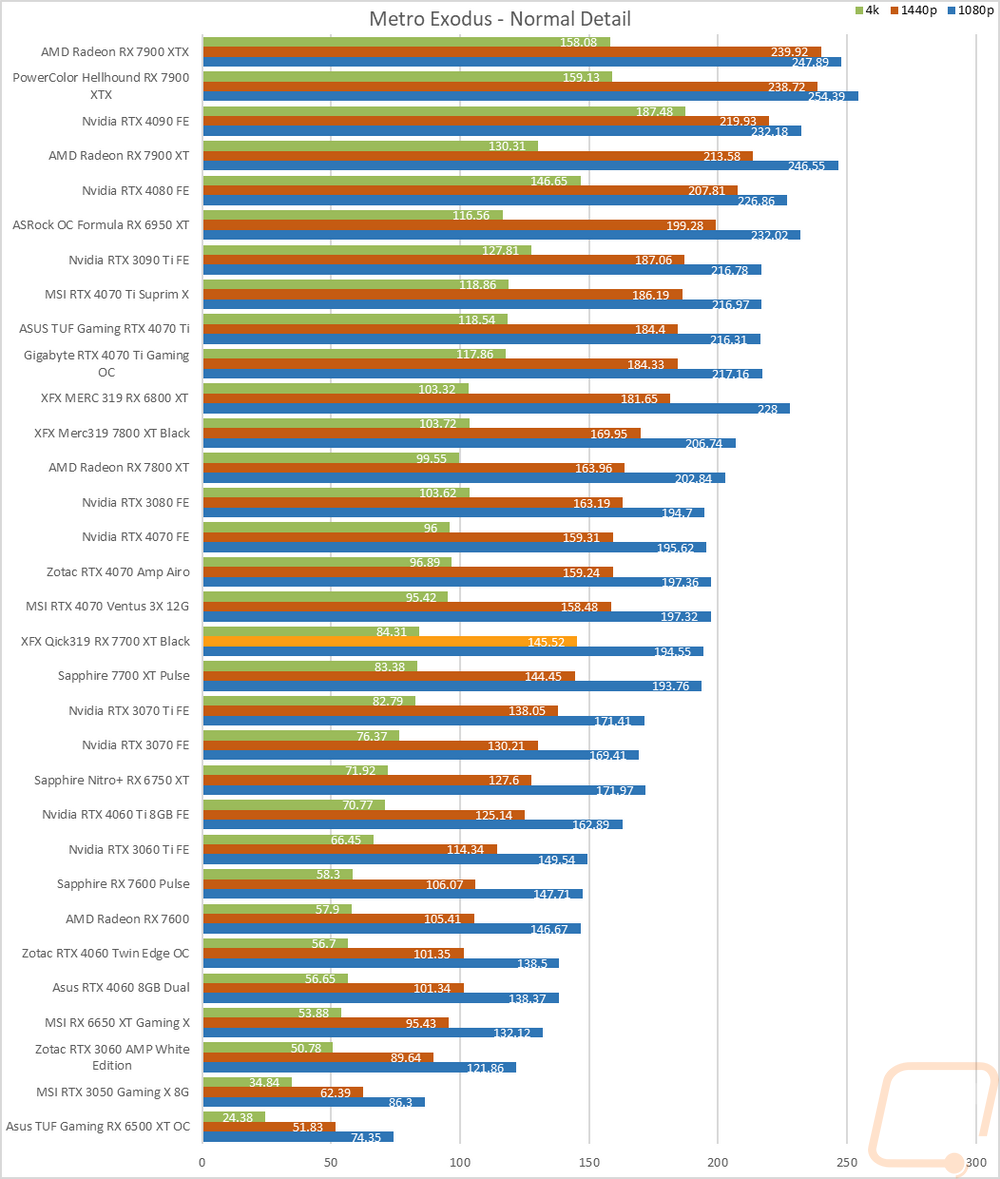
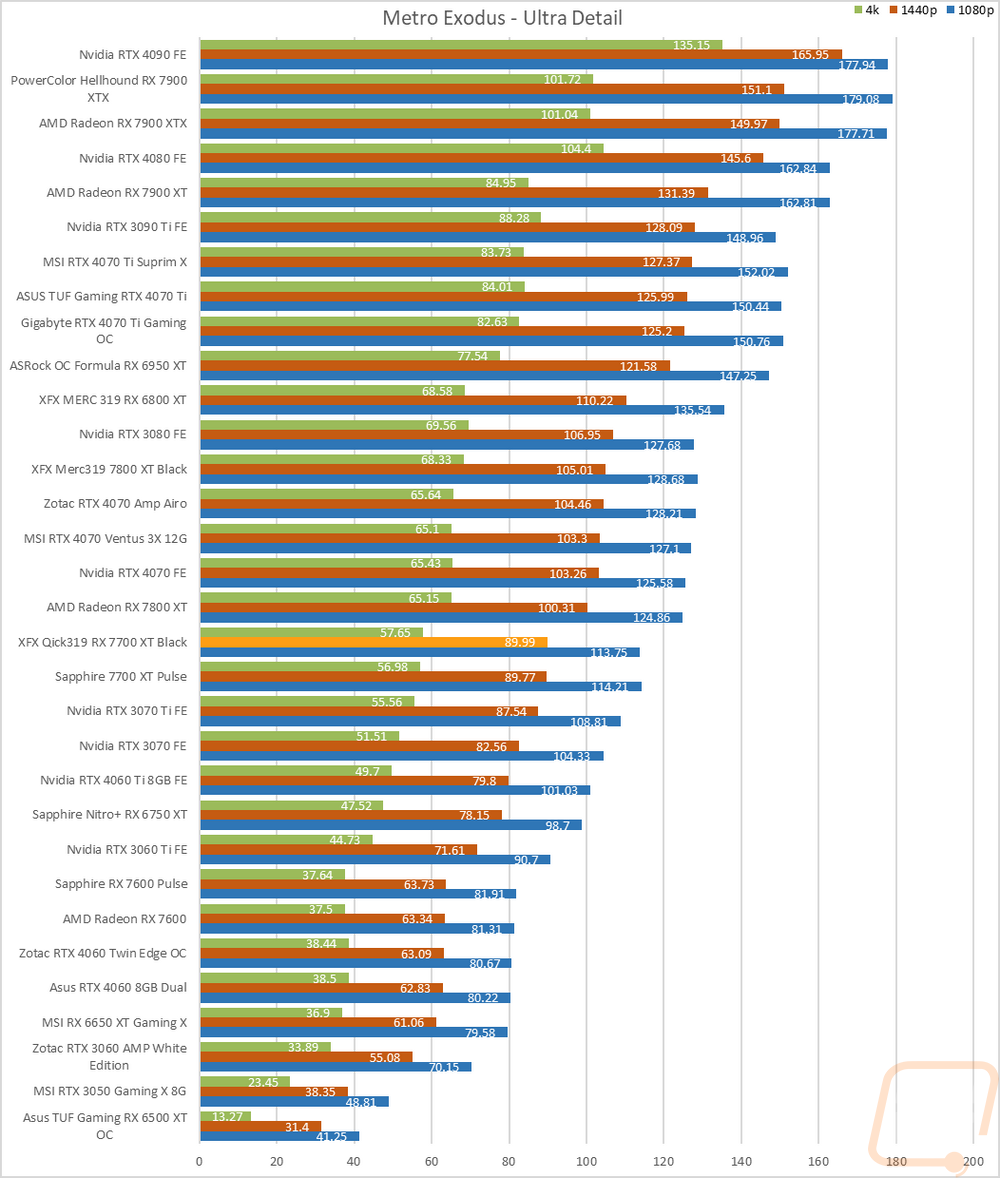
Metro Exodus |
Using built-in benchmark, testing at ultra and normal details at 1080p, 1440p, and 4k. I also do RTX and DLSS testing at 4K with the ultra-detail base settings for Nvidia cards as well. |
|
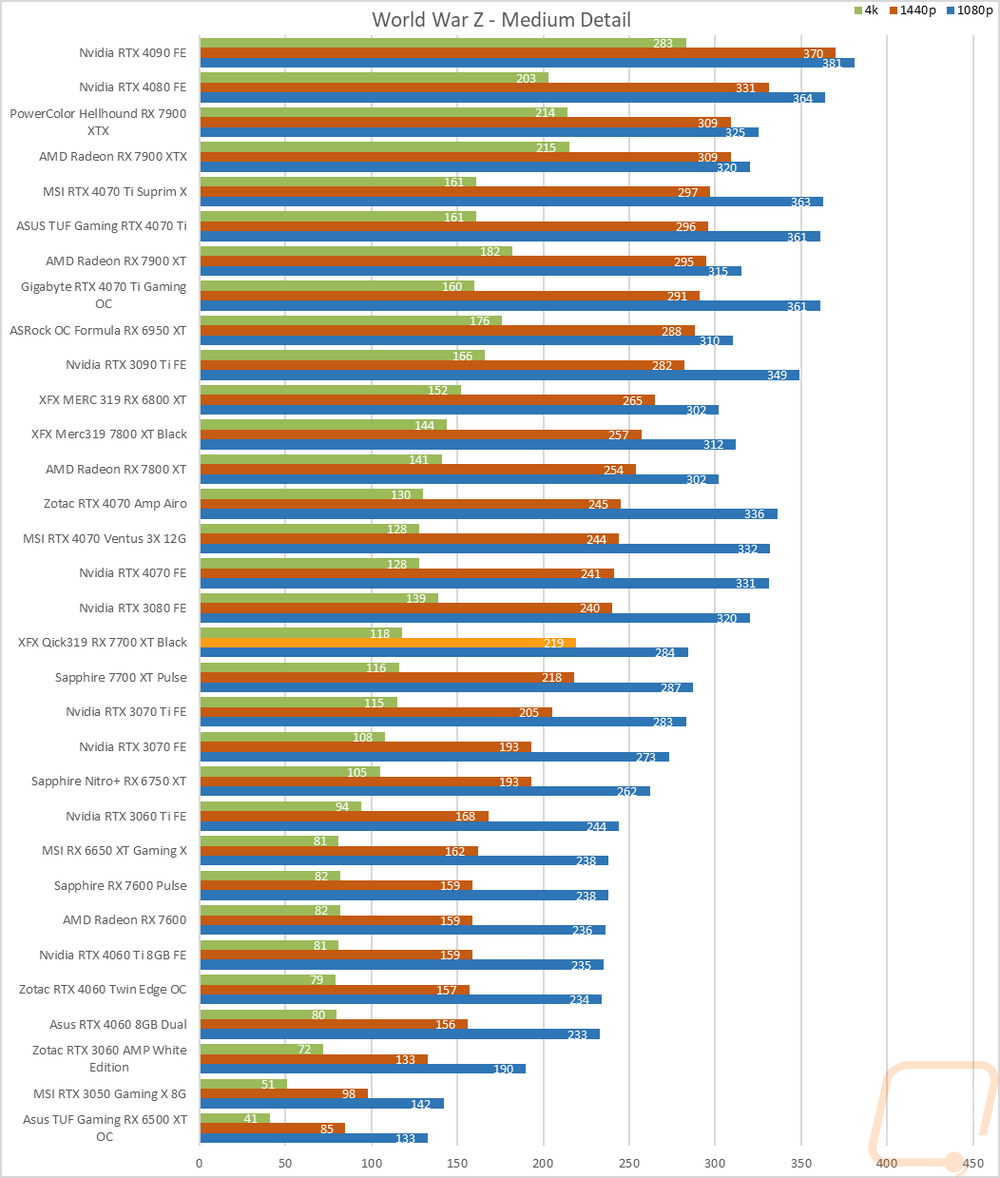
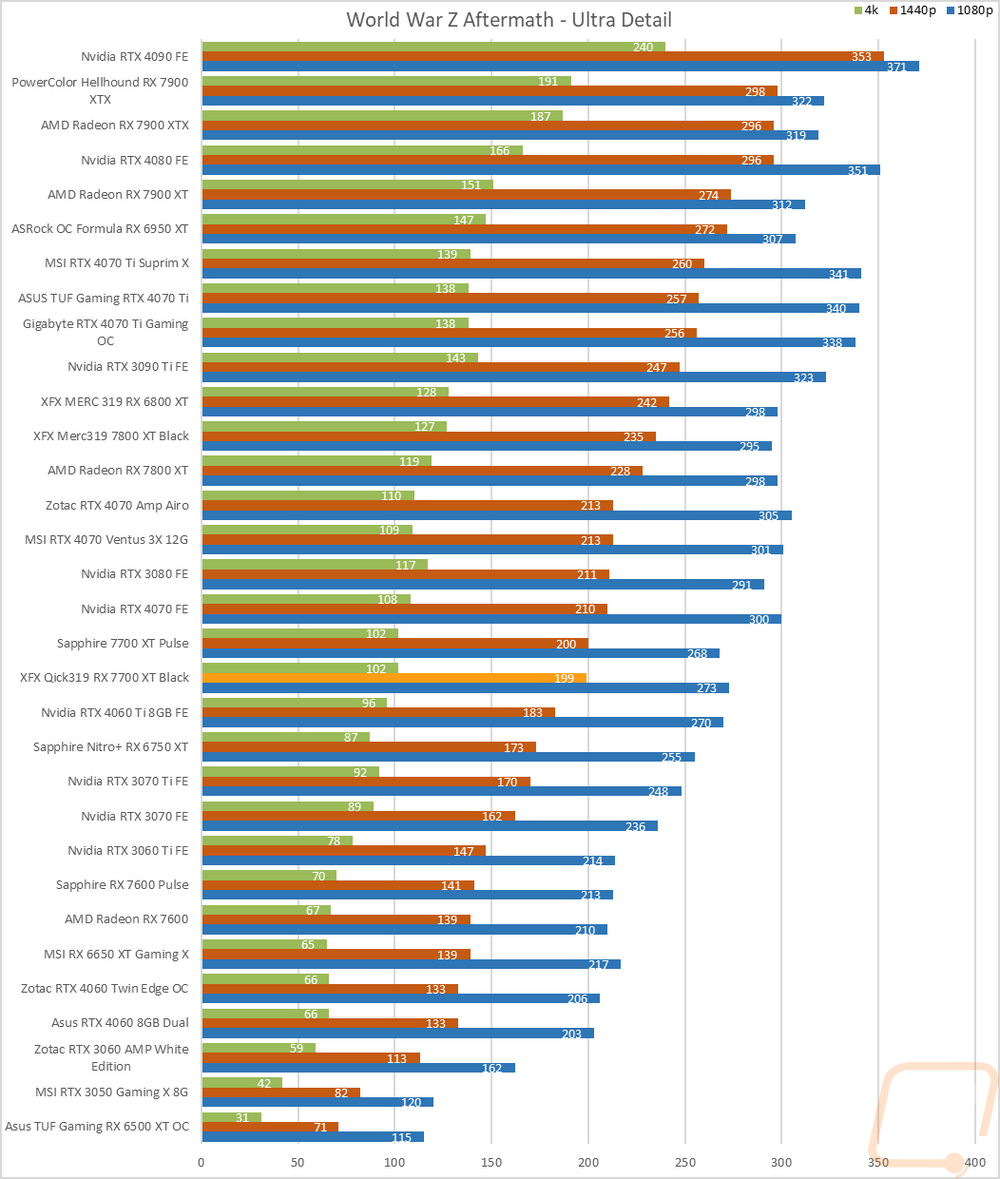
World War Z Aftermath |
Built-in benchmark in DX11 testing both the Ultra detail and Medium detail levels at 1080p, 1440p, and 4K resolutions |
|
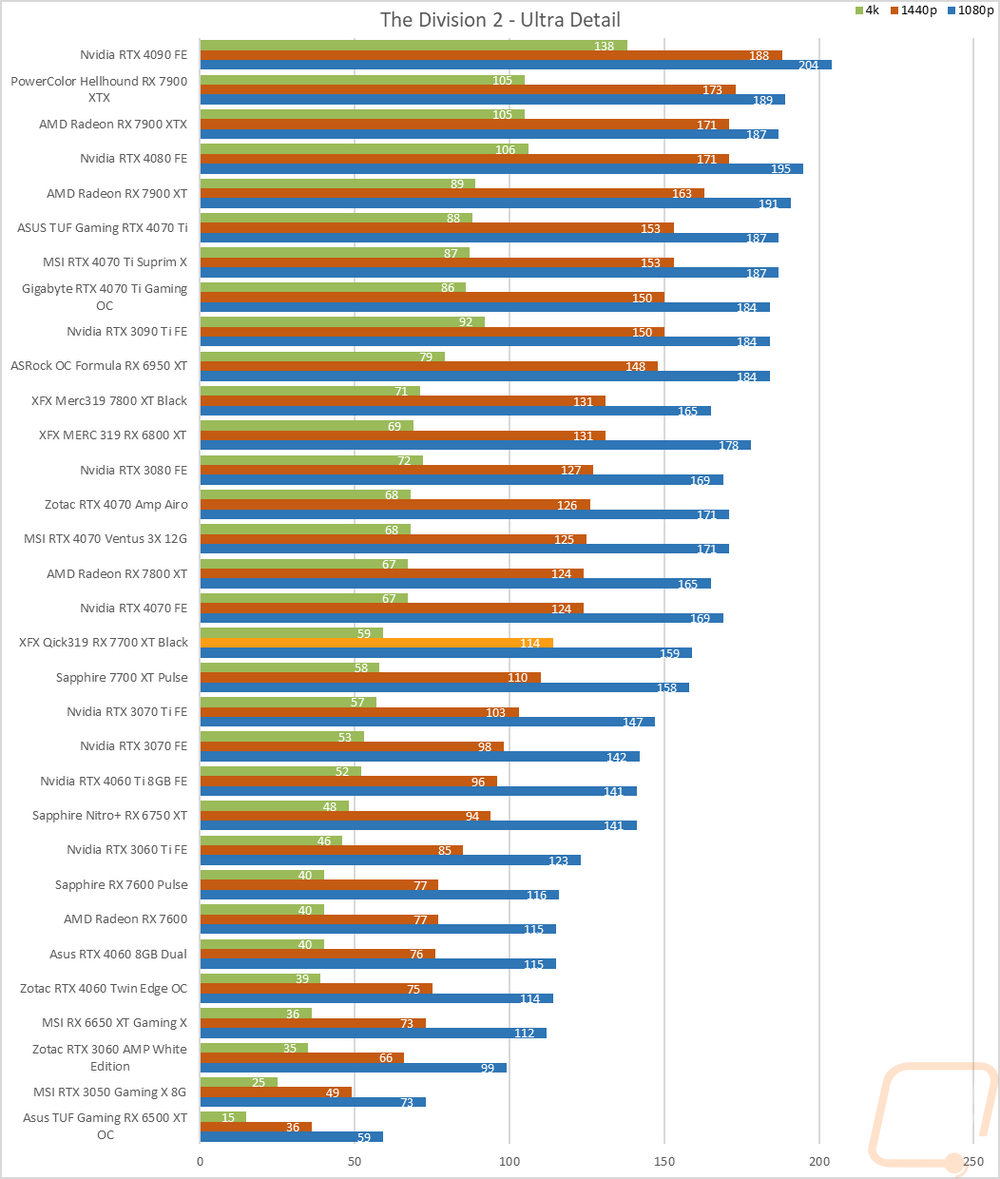
The Division 2 |
Built-in benchmark at Ultra detail with V-Sync turned off at 1080p, 1440p, and 4k resolutions. |
|
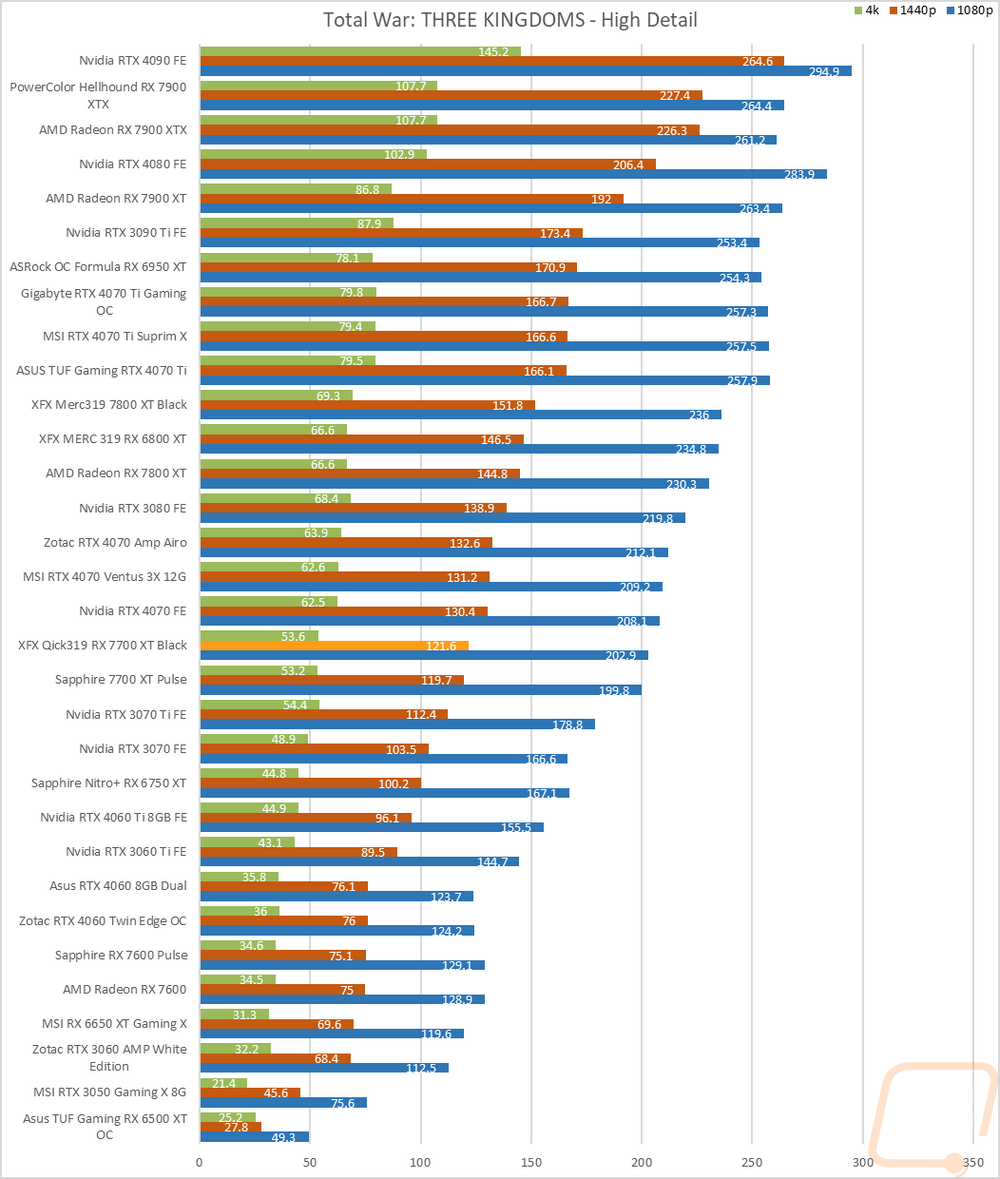
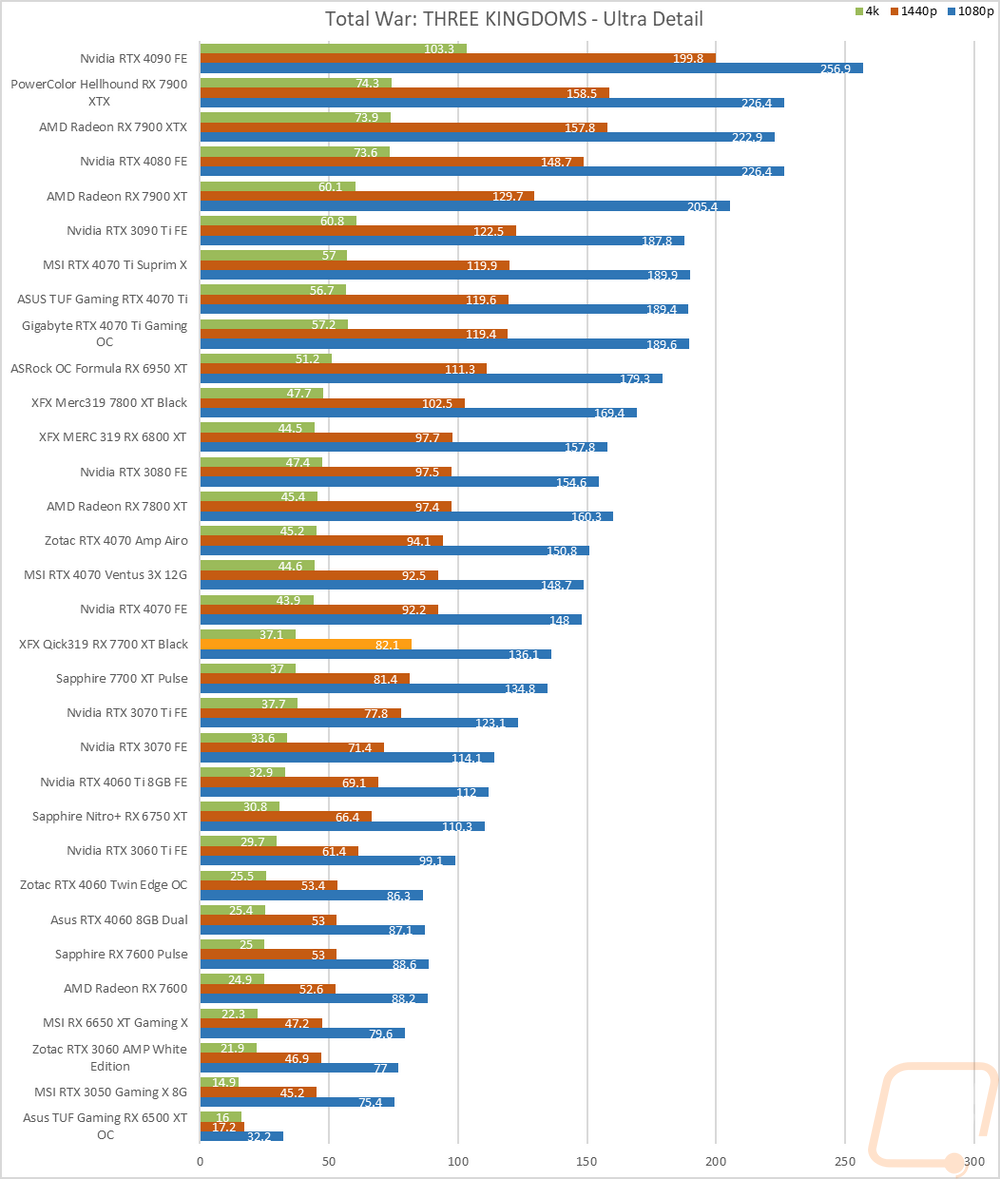
Total War: Three Kingdoms |
Built-in benchmark using the Battle Benchmark setting. Tested at 1080p, 1440p, and 4k at both high and ultra detail settings |
|
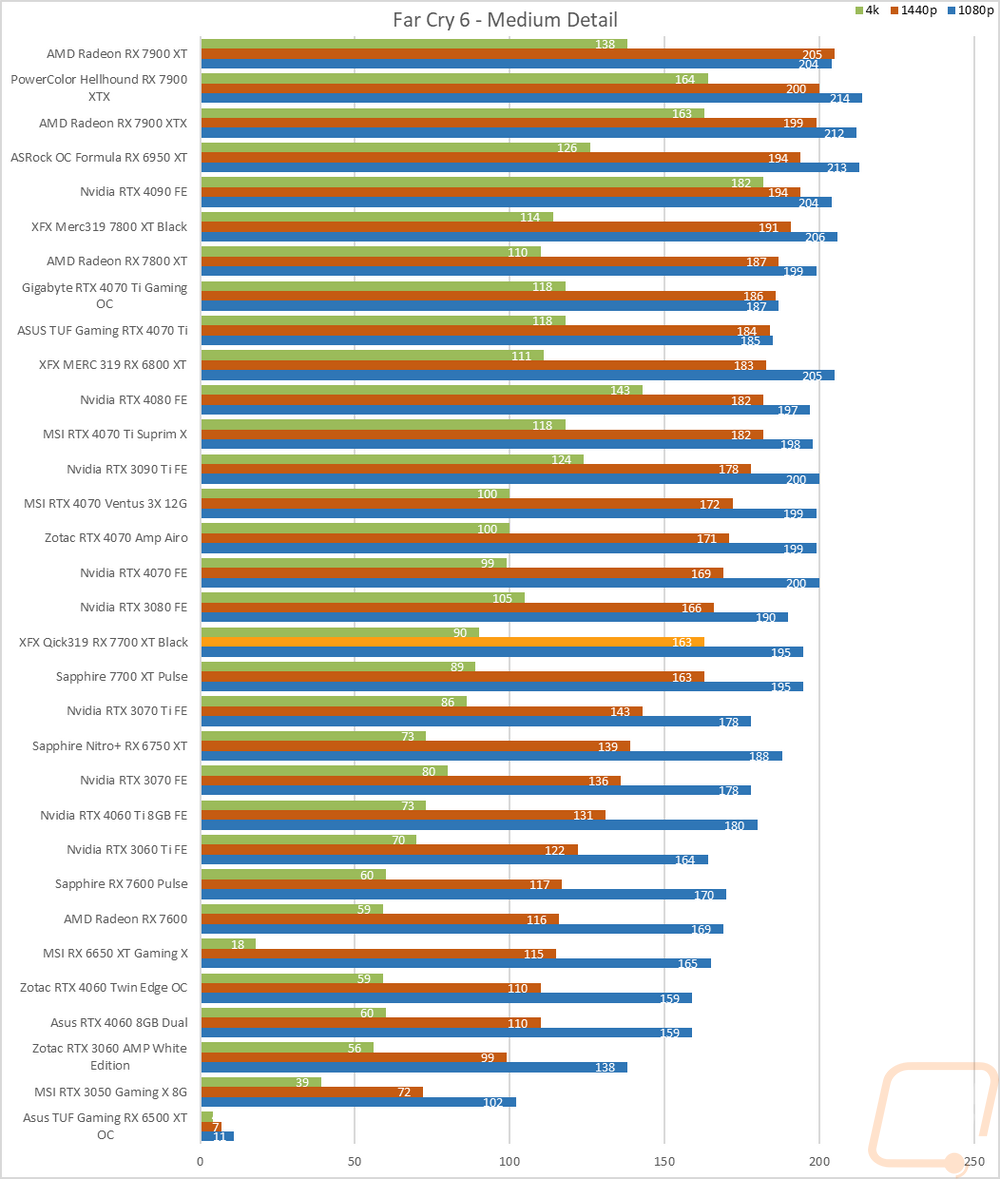
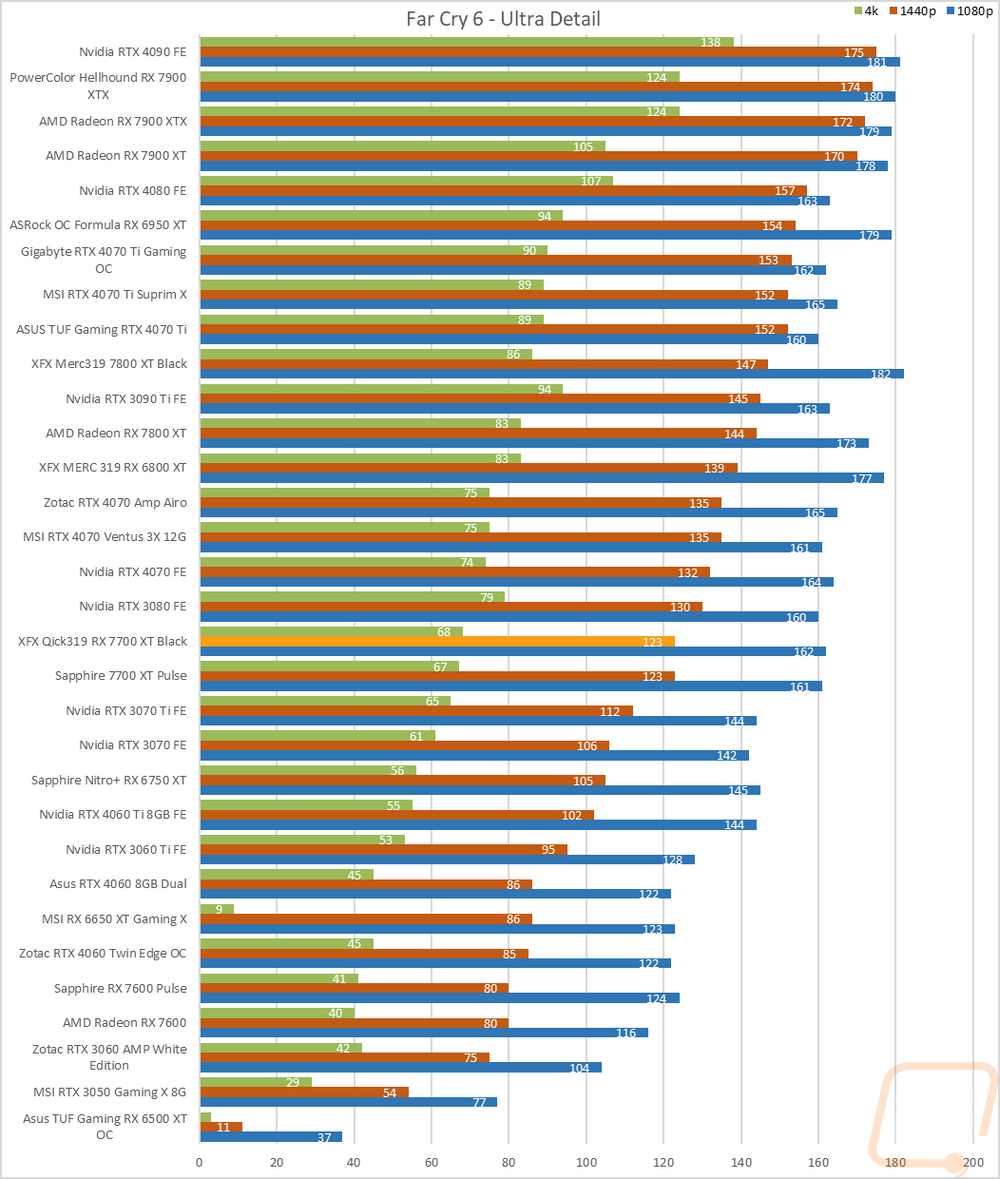
Far Cry 6 |
Built-in benchmark tested at 1080p, 1440p, and 4k with the Ultra and Medium detail settings |
|
V-Ray 5 |
V-Ray 5 benchmark us run with CUDA and RTX settings on cards that support it |
|
Boundary Benchmark |
Testing different DLSS detail levels on cards that support it. All testing is done at 4k with RTX on |
|
Bright Memory Infinite RTX Benchmark |
Benchmark all of the different RTX detail levels. Resolution at 4k and DLSS on balanced for each test |
|
Passmark Performance Test 10.2 |
Test using the GPU Compute Score inside of PassMark's Performance Test 10.2 |
|
Blender |
Using the standard Blender Benchmark I run the test using the Blender 3.4 setting which tests using the Monster, Junkshop, and Classroom tests. |
|
OctaneBench 2020.1 |
OctaneBench is designed to test rendering in OctaneRender. RTX and non-RTX are both ran. This is a CUDA-only test so only Nvidia cards are tested |
|
Power Testing |
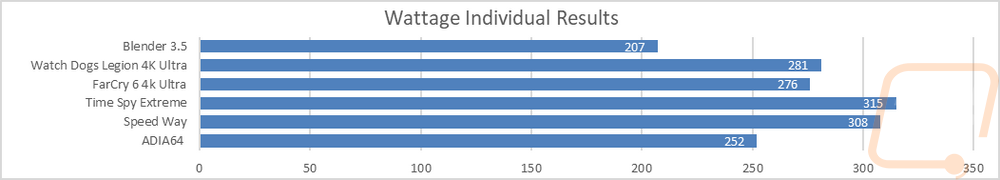
Using a PCat v2 to monitor power between the PCIe slot and the card as well as power through the power cables I test the peak power when running ADIA64, 3DMark Speed Way, 3DMark Time Spy Extreme, FarCry 6 at 4k and Ultra Detail, Watch Dogs Legion at 4K and Ultra detail, and Blender 3.4.0. The results are then averaged as well as the highest result. |
|
Noise Testing |
Our Noise testing is done using a decibel meter 18 inches away from the video card on the bottom/fan side of the card. We test at 50% and 100% fan speeds as well as a third test while under load using AIDA64's stress test. This is done using a Protmex PT02 Sound Meter that is rated IEC651 type 2 and ANSI S1.4 type 2. Tests are done set weighted to A and set to a slow response using the max function. The ambient noise level in the testing area is 33.3 decibels. |
|
Temperature Testing |
Using AIDA64, the GPU stress test is run for 30 minutes or until the result has leveled off. The test is run twice, once with the stock fan profile and a second time with 100% fan speed. During this, I also document the 100% fan speed RPM and document the delta between the fan profile and 100% fan speed as well as get thermal images. |
Synthetic Benchmarks
As always I like to start my testing with a few synthetic benchmarks. 3DMark especially is one of my favorites because it is very optimized in both Nvidia and AMD drivers. It's nice to not have to worry about it being favored too much either way and the repeatability of the results makes it a nice chance to compare from card to card, especially when comparing with the same GPU. The QICK 319 RX 7700 XT Black is an overclocked card and I did just earlier take a look at the Sapphire RX 7700 XT Pulse which was clocked at AMDs stock clock speeds. The QICK 319 RX 7700 XT Black is clocked at 105 MHz higher for its game clocks and 55 MHz higher on the boost clocks so it will be interesting to see how that changes performance. Beyond that of course I do want to keep an eye on how it compares to the RTX 4060 Ti, the RTX 3070, and RTX 3070 Ti from Nvidia and the 7800 XT and 6750 XT from last generation as well.
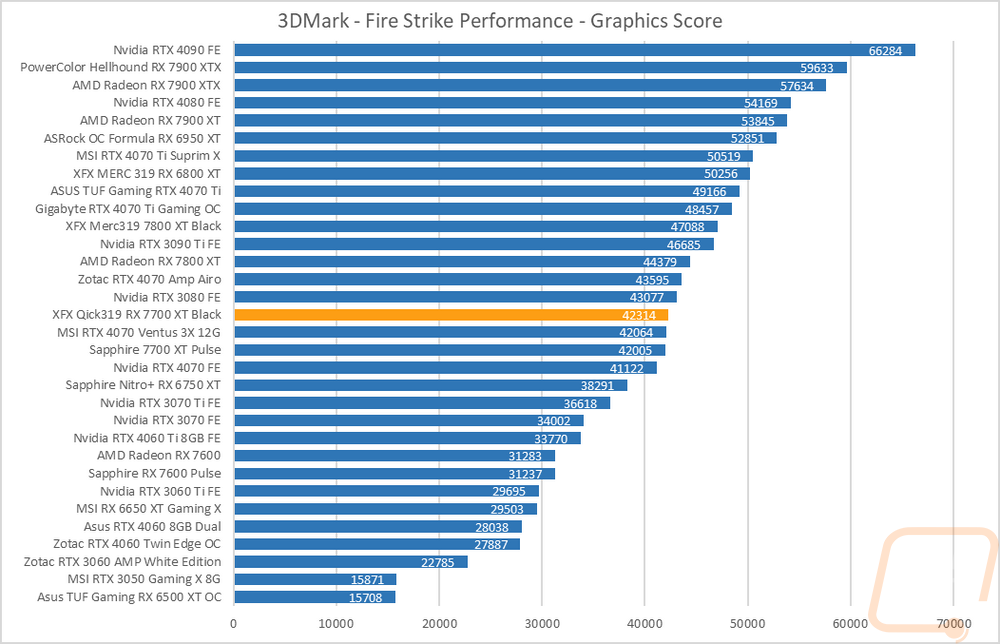
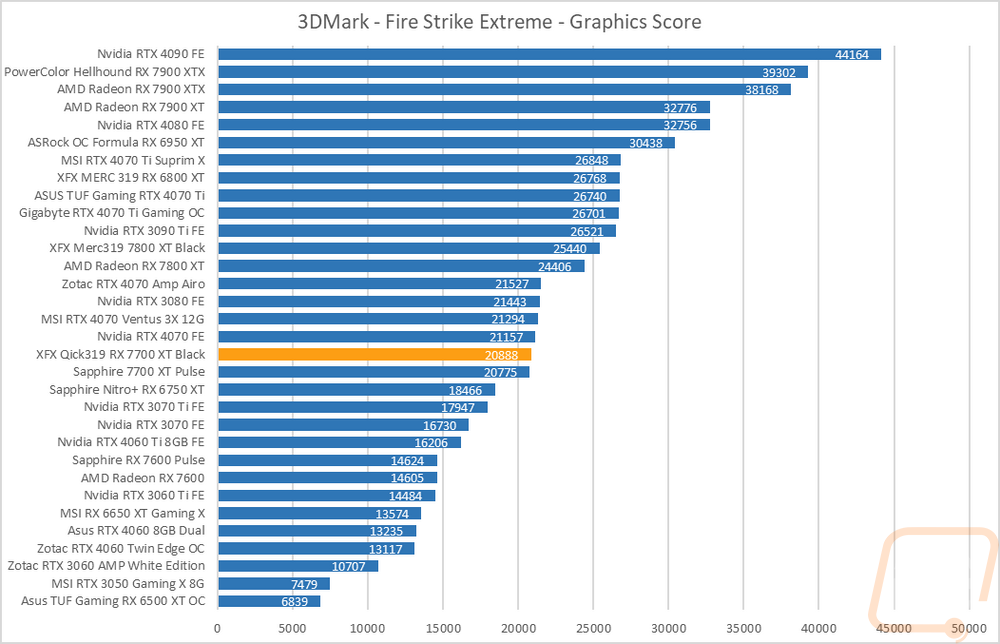
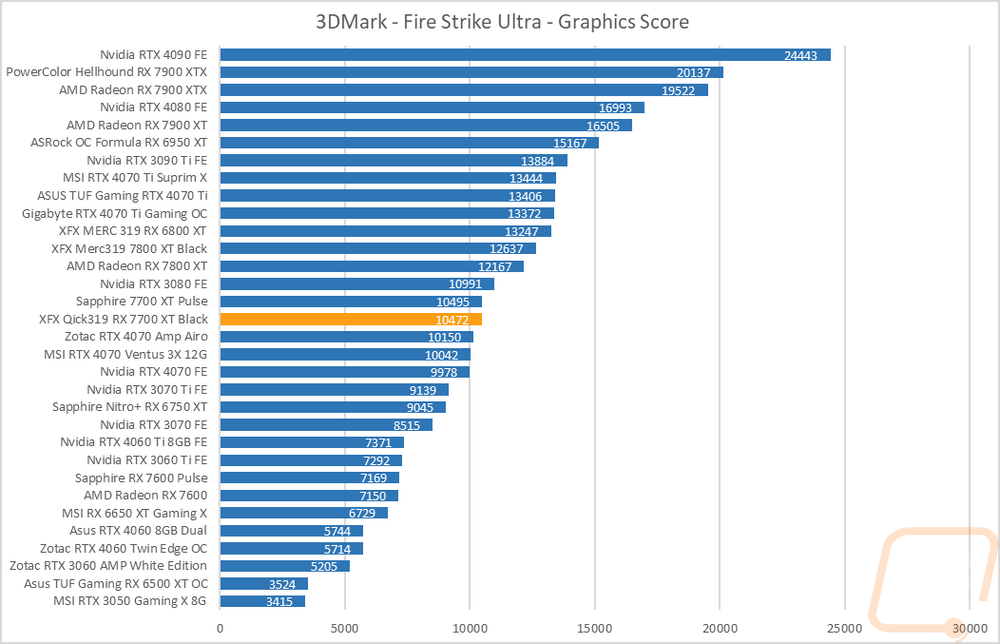
The first round of tests were done in the older Fire Strike benchmark which is a DX11 test. There are three detail levels, performance, extreme, and ultra. The QICK 319 RX 7700 XT Black scored a 42314 in the base Fire Strike benchmark which was just 309 points ahead of the 7700 XT Pulse, that was enough to jump ahead of the 4070 Ventus but still behind the RTX 3080 and both cards are ahead of the 4070 FE as well as the 6750 XT, 4060 Ti, and 3070 Ti. The Fire Stike Extreme test has the QICK 319 RX 7700 XT Black just ahead of the Pulse once again but behind the 4070 FE this time around and then for Fire Stike Ultra the QICK 319 RX 7700 XT Black ended up a hair behind the Pulse but back in front of all of the RTX 4070s.
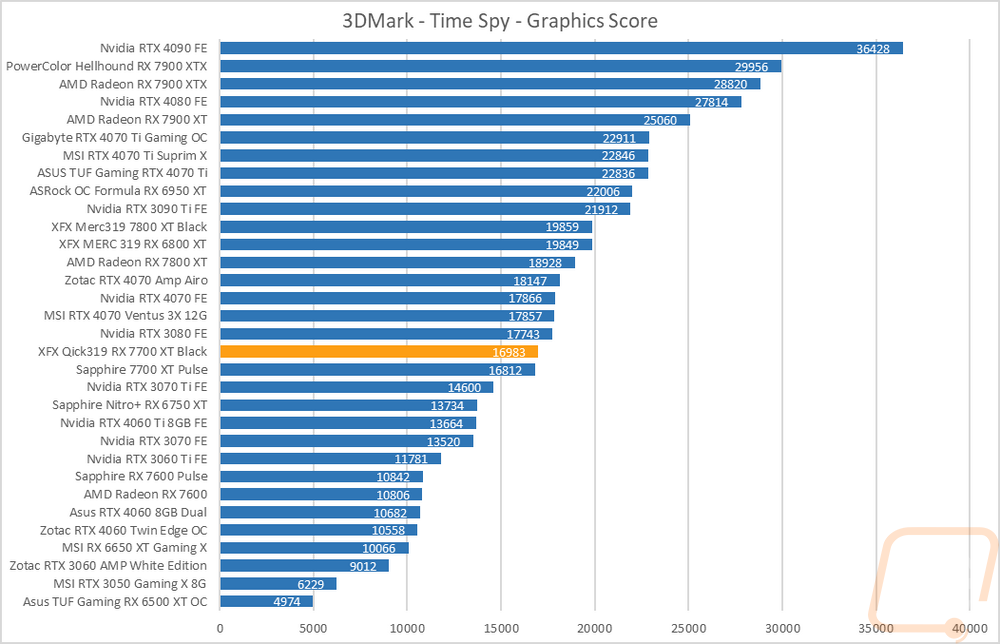
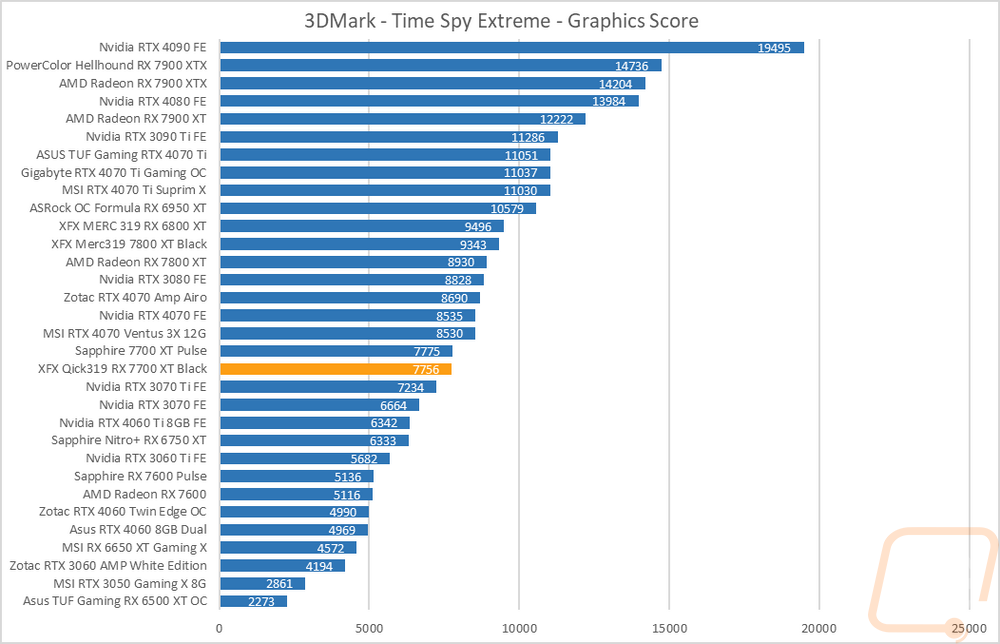
The next two were both based on the Time Spy benchmark. One is the standard test and then there is the extreme detail level. The QICK 319 RX 7700 XT Black has a slightly bigger lead on the Pulse in the base Time Spy test with a score 171 points higher. This wasn’t enough to close the gap at all between the 7700 XT and the RTX 3080 or RTX 4070s which are above it but both cards are well ahead of eh RTX 3070 Ti. The Time Spy Extreme test on the other hand has the Pulse out in front of the QICK 319 RX 7700 XT Black by 19 points, not enough to change anything. Both cards are in front of the RTX 3070 Ti and behind the RTX 4070 with big gaps in both directions.
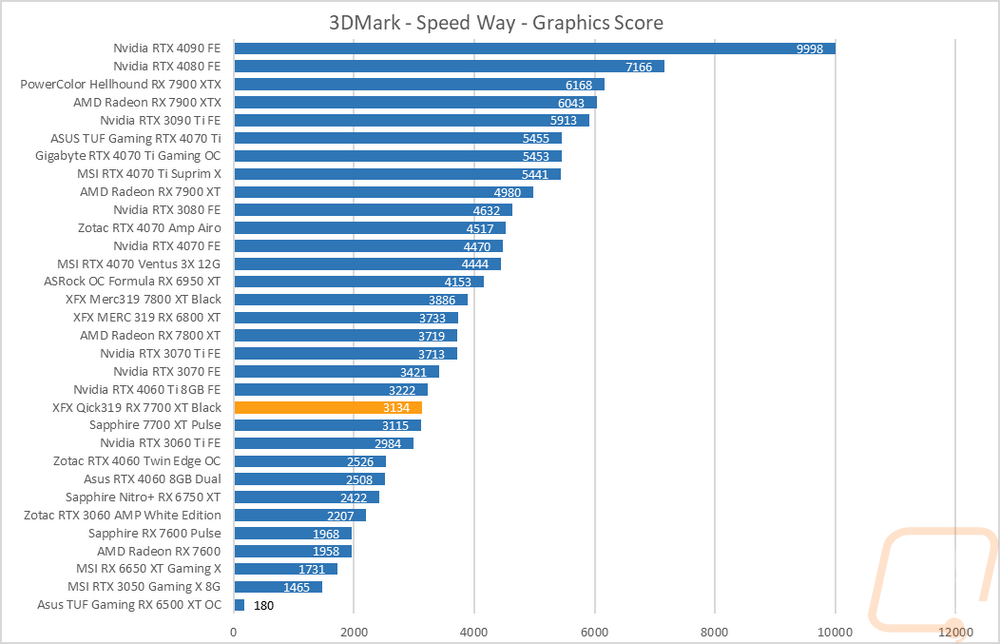
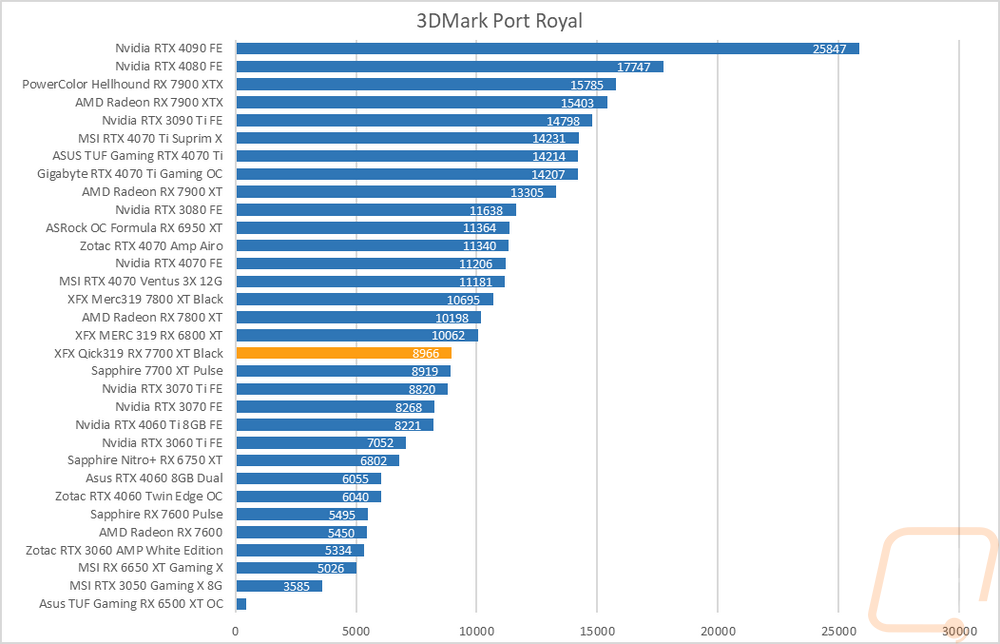
For ray tracing performance, I ran both the 3DMark Port Royal test which is ray tracing focused as well as the new 3DMark Speed Way test which tests all future-looking features including ray tracing. In Speed Way, the QICK 319 RX 7700 XT Black was right with the Pulse with just 19 more points on its score. That wasn’t enough to catch up to the RTX 4060 Ti 8GB which was ahead here. As a whole AMDs performance is a step behind on all of the cards in this test compared to Nvidia. The QICK 319 RX 7700 XT Black was 47 points in front of the Pulse for the Port Royal benchmark and both cards were just a hair above the RTX 3070 Ti and behind the 6800 XT.
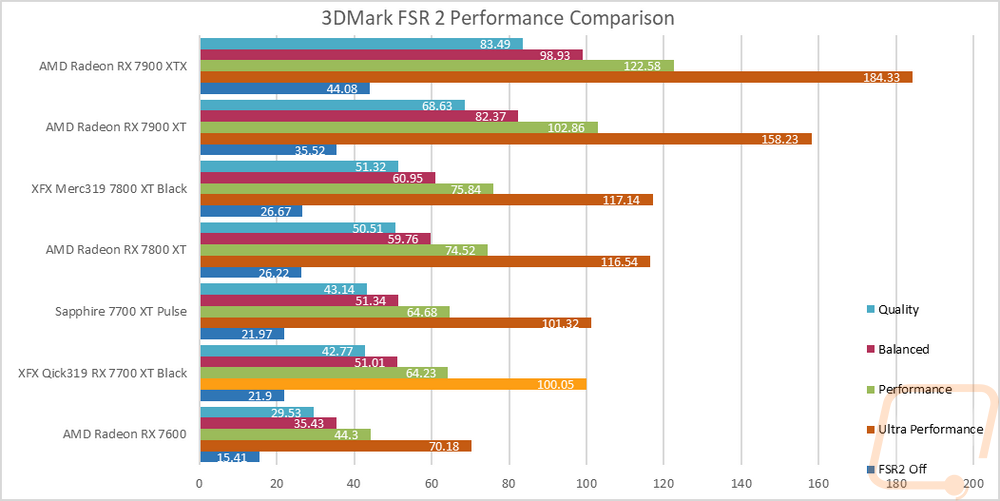
I wanted to check out the AMD FSR 2 performance and for that, I ran the test that 3Dmark has put together. I ran it at all four detail levels so we could see what kind of improvements are possible in performance when running it. The QICK 319 RX 7700 XT Black ran at just 21.9 FPS with FSR 2 turned off but jumped up to 42.77 with the highest quality setting on. Balanced and Performance settings improved things up to 51.01 and 64.23. Then with the ultra-performance setting it jumped even farther up to 100.05 FPS. The QICK 319 RX 7700 XT Black ended up being just behind the Pulse on all of these tests as well which is interesting.
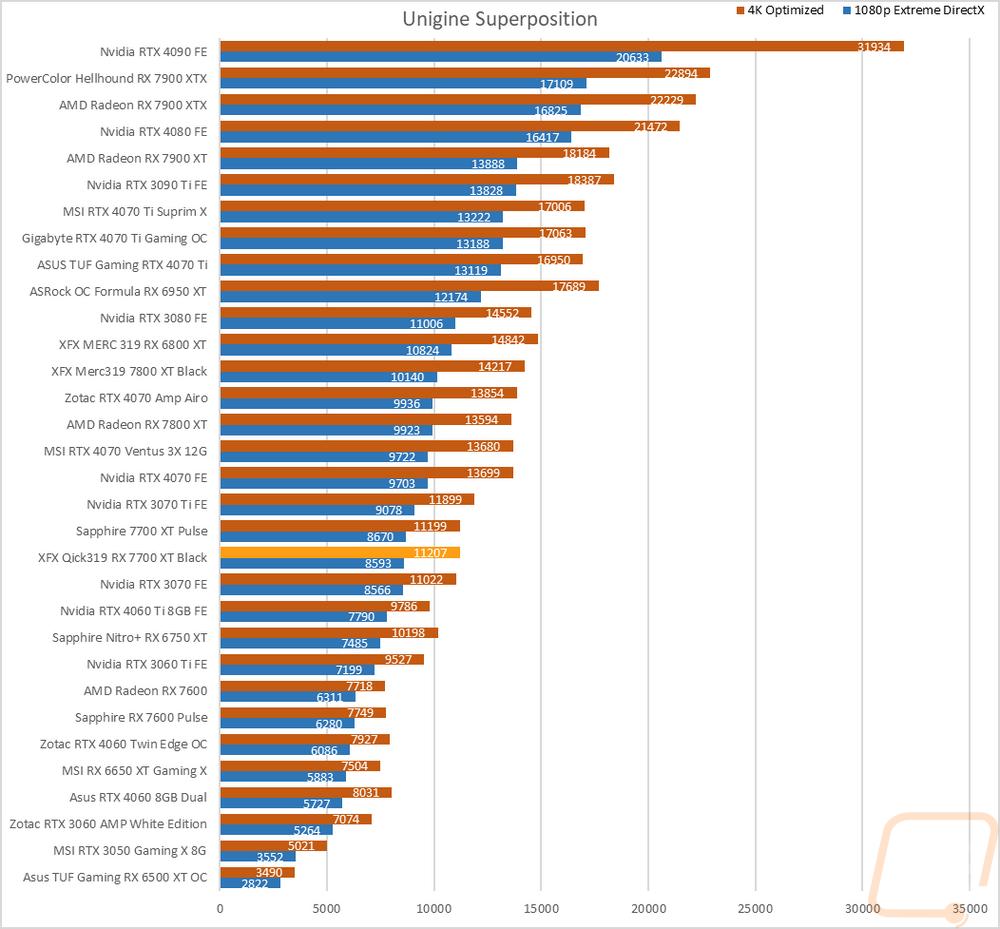
The last test was using the Unigine-based Superposition benchmark and I tested at 1080p with the extreme detail setting as well as the 4K optimized setting. In the extreme detail setting the QICK 319 RX 7700 XT Black came in just behind the Pulse in both the 1080 Extreme and 4K tests and both cards we just ahead of the RTX 3070 and behind the RTX 3070 Ti.
VR Benchmarks
As for Virtual Reality, I love it but it is more demanding than traditional gaming. This is partially because of the resolutions needed to render for two eyes and because they render more than what is immediately visible. But also because of post effects to get the proper “fisheye” effect for it to look proper in your eyes with the HMD. You also have to have much higher expectations for frame rates in VR, skipping frames or lower FPS can cause motion sickness in VR. Because of that, I ran a few tests.
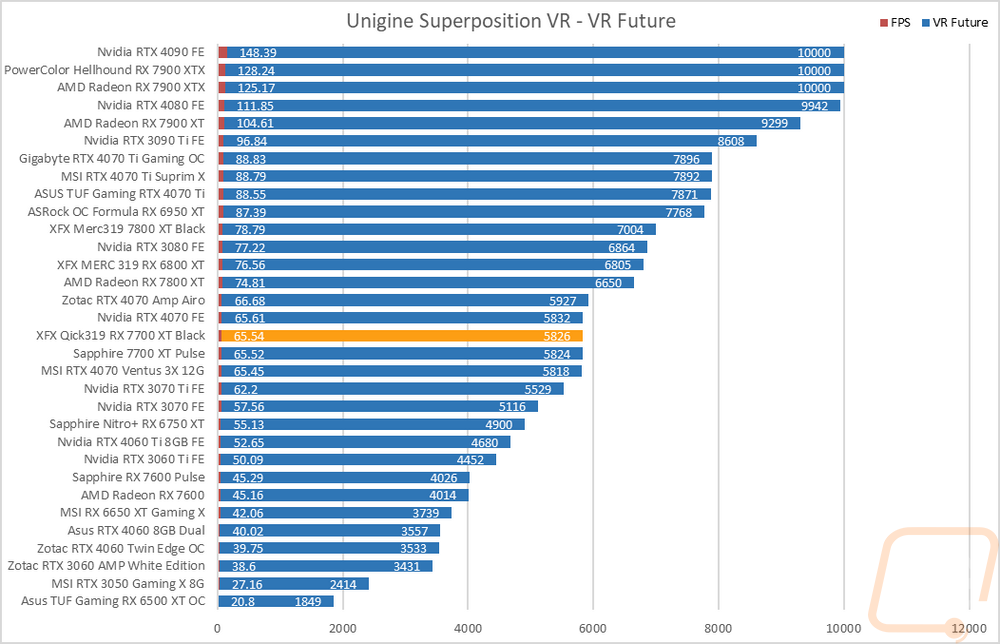
My first test was again in Superposition. This time I tested the VR Future test using the Oculus resolution. I have also included the average frame rate as well which is important for the cards at the top of the chart because for some reason Superposition is capped at 10,000 for its scores and that doesn’t show the performance gap in those cards at the top. The QICK 319 RX 7700 XT Black and the Pulse are just 2 points off from each other here and sitting right in the middle of the overclocked RTX 4070s.
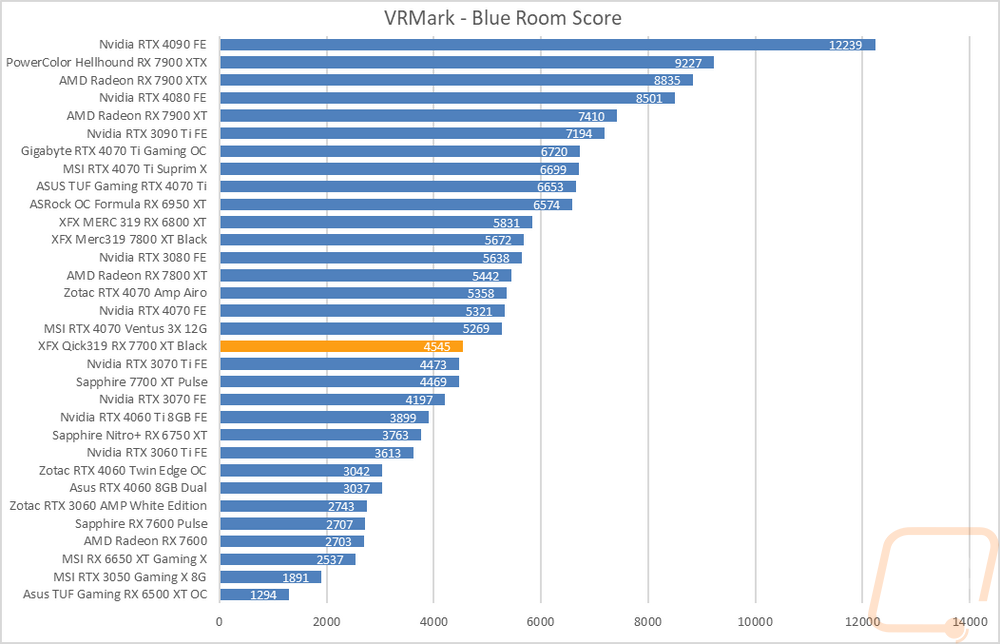
My second round of VR testing was in VRMark which has three tests that are similar to the VR tests in Superposition. I only focused on just the most demanding test called Blue Room which is looking more at future VR performance. The QICK 319 RX 7700 XT Black has a little bit of a lead on the Pulse here by 76 points which was enough to slide ahead of the RTX 3070 Ti but it is still well behind all of the RTX 4070s which is the next card up.
In-Game Benchmarks
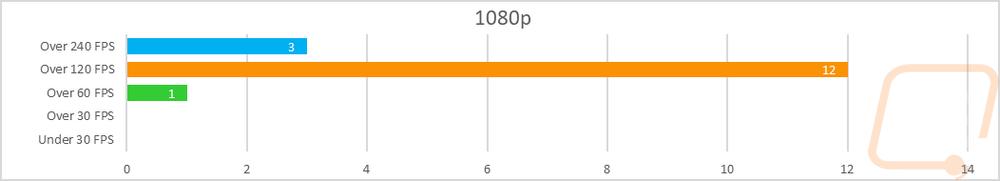
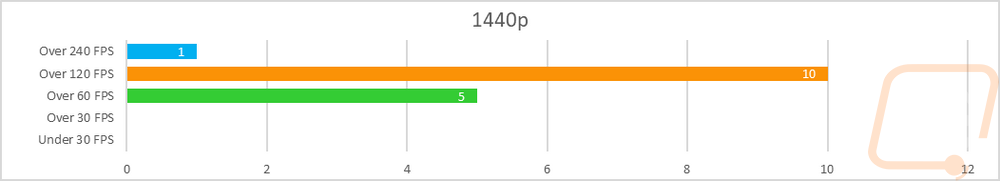
Now we finally get into the in game performance and that is the main reason people pick up a new video card. To test things out I ran through our new benchmark suite that tests 10 games at three different resolutions (1080p, 1440p, and 4k). Most of the games tested have been run at the highest detail setting and a mid-range detail setting to get a look at how turning things up hurts performance and to give an idea of if turning detail down from max will be beneficial for frame rates. In total, each video card is tested 48 times and that makes for a huge mess of results when you put them all together. To help with that I like to start with these overall playability graphs that take all of the results and give an easier-to-read result. I have one for each of the three resolutions and each is broken up into four FPS ranges. Under 30 FPS is considered unplayable, over 30 is playable but not ideal, over 60 is the sweet spot, and then over 120 FPS is for high refresh rate monitors.
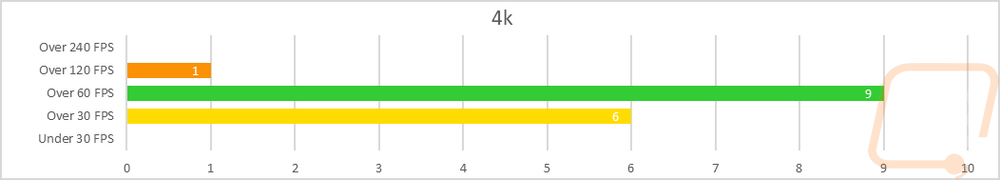
So how did the QICK 319 RX 7700 XT Black do? Well, first we should understand that AMD is targeting this card for 1440p, just like the 7800 XT. So my expectations for 4K performance were low but it does have 10 out of the 16 results sitting up over 60 FPS which isn’t bad at all. One of those is also up over 120 FPS, then there were 6 results in the 30-60 FPS range which is still playable but not ideal. At 1440p all of the results for the QICK 319 RX 7700 XT Black were over 60 FPS but at 11 a majority were over 120 FPS and one (CS:GO) was over 240 FPS as well. Then at 1080p, everything was once again up over 60 FPS, no surprise there but only one result was in the 60-119 FPS range with the rest up over 120 FPS, and 3 of those were even up over 240 FPS.
Of course, I have all of the actual in game results as well for anyone who wants to sort through the wall of graphs below. I have also put together a list of averaged results at all three resolutions across all of the cards in range of the QICK 319 RX 7700 XT Black to get a good look at everything. In our synthetic tests, the QICK 319 RX 7700 XT Black struggled to stand out from the Sapphire RX 7700 XT pulse but in game the overclock helped the QICK 319 RX 7700 XT Black pull out in front consistently at all three resolutions. It wasn’t a big gap but it was an extra FPS on average. That wasn’t enough to make any difference when compared to the next card up which was the RTX 4070. But with the numbers averaged out we can see how the QICK 319 RX 7700 XT Black stands way out in front of the 4060 Ti and it is even ahead of the 3070 Ti by 12 FPS at 1440p. That shrinks at 4k down to a gap of 3 FPS but it still did well. As for the main graphs, they repeat what you see except in Ghost Recon where you see both of the RX 7700 XT’s jump ahead of the RTX 4070.
|
|
1080p |
1440p |
4K |
|
XFX MERC 319 RX 6800 XT |
197.1 |
162.3 |
92.4 |
|
XFX Merc 319 RX 7800 XT Black |
194.0 |
161.0 |
93.3 |
|
Radeon RX 7800 XT |
190.7 |
156.3 |
89.3 |
|
Nvidia RTX 4070 FE |
190.6 |
147.6 |
83.5 |
|
XFX QICK 319 RX 7700 XT Black |
179.9 |
138.2 |
75.2 |
|
Sapphire RX 7700 XT Pulse |
178.1 |
137.5 |
74.7 |
|
Nvidia RTX 3070 Ti FE |
165.8 |
125.7 |
72.9 |
|
Sapphire Nitro+ RX 6750 XT |
165.2 |
119.4 |
64.5 |
|
Nvidia RTX 3070 FE |
160.9 |
118.8 |
67.2 |
|
Nvidia RTX 4060 Ti 8GB FE |
160.1 |
115.3 |
62.0 |
|
Zotac RTX 4060 Twin Edge OC |
135.7 |
94.5 |
50.1 |
Compute Benchmarks
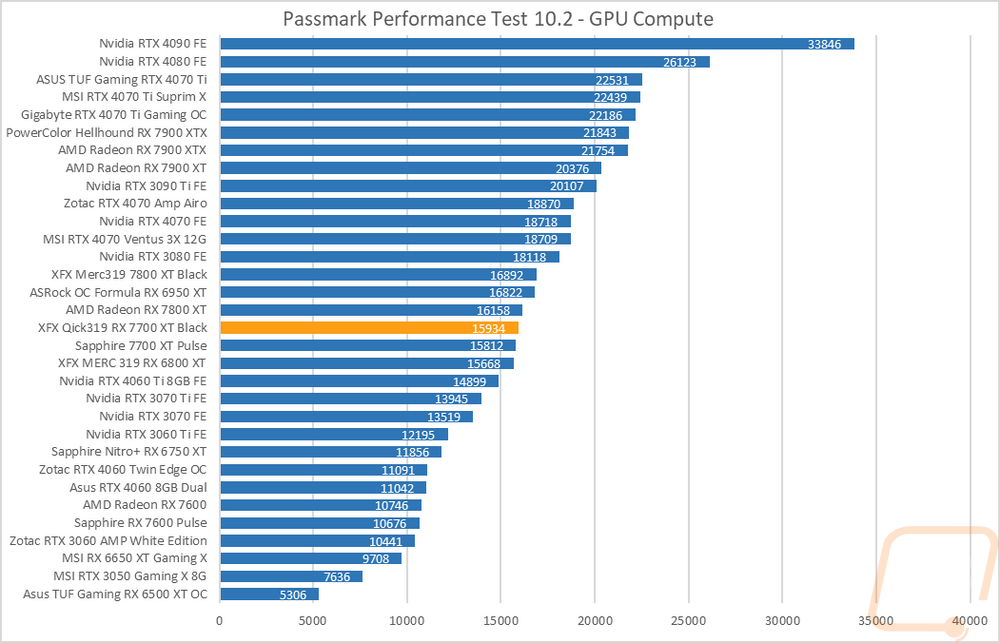
Now some people don’t need a video card for gaming, they need the processing power for rendering or 2D/3D production, or in some cases, people who game also do work on the side. So it is also important to check out the compute performance on all of the video cards that come in. That includes doing a few different tests. My first test was a simple GPU Compute benchmark using PassMark's Performance Test 10 and the QICK 319 RX 7700 XT Black scored 15934 which was 122 points ahead of the Pulse and also in front of the RX 6800 XT as well.
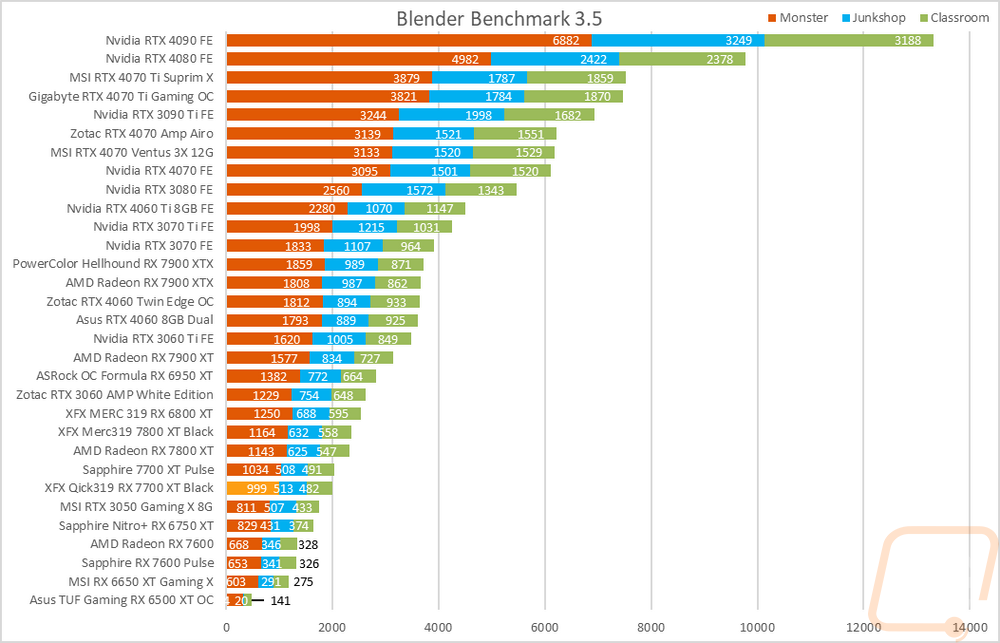
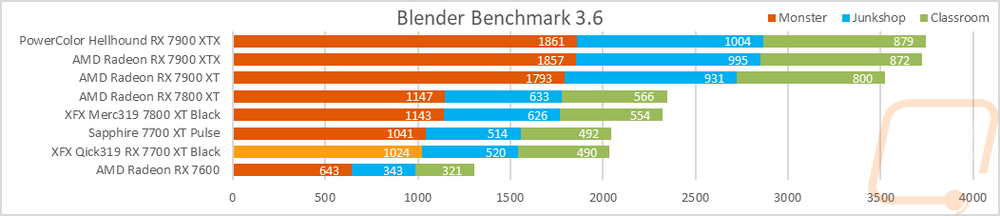
Blender is always my favorite compute benchmark because the open-source 3D rendering software is very popular and it isn’t a synthetic benchmark. With the latest version of Blender, they redid the benchmark so we now have a new test that runs three different renderings and gives each a score. I have all three stacked together so we can see the overall performance. The QICK 319 RX 7700 XT Black fell below the 7700 XT Pulse in both 3.5 and 3.6 Blender tests. Both cards are sitting back with the Nvidia RTX 3050 which shows just how far back AMD performance is in Blender compared to Nvidia with Optix integration in Blender.
Cooling Noise and Power
For my last few tests, rather than focusing on in game performance, I like to check out other aspects of video card performance. These are also the most important ways to differentiate the performance between cards that have the same GPU. To start things off I took a look at power usage.
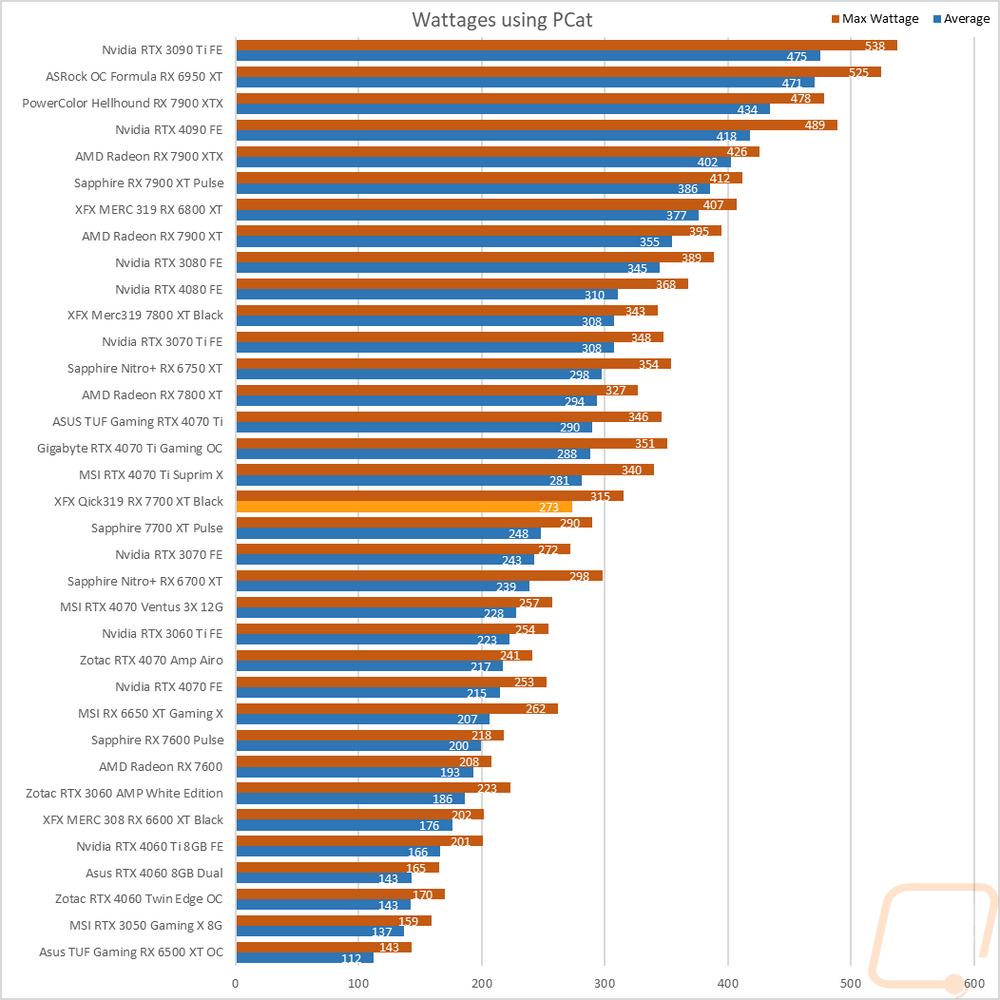
For this, our new test setup utilizes the Nvidia-designed PCat v2 along with cables to handle both traditional 6 or 8-pin connections as well as the new 12VHPWR. The PCat also utilizes a PCIe adapter to measure any power going to the card through the PCIe slot so we can measure the video card wattage exclusively, not the entire system as we have done in the past. I test with a mix of applications to get both in game, synthetic benchmarks, and other workloads like Blender and AIDA64. Then everything is averaged together for our result. I also have the individual results for this specific card and I document the peak wattage result as well which is almost always Time Spy Extreme. The QICK 319 RX 7700 XT Black averaged 273 watts across our tests and peaked at 315 watts. This put it above the stock-clocked 7700 XT Pulse but 25 watts ahead in both the average and peak. This put it close to the RTX 4070 Ti as well.
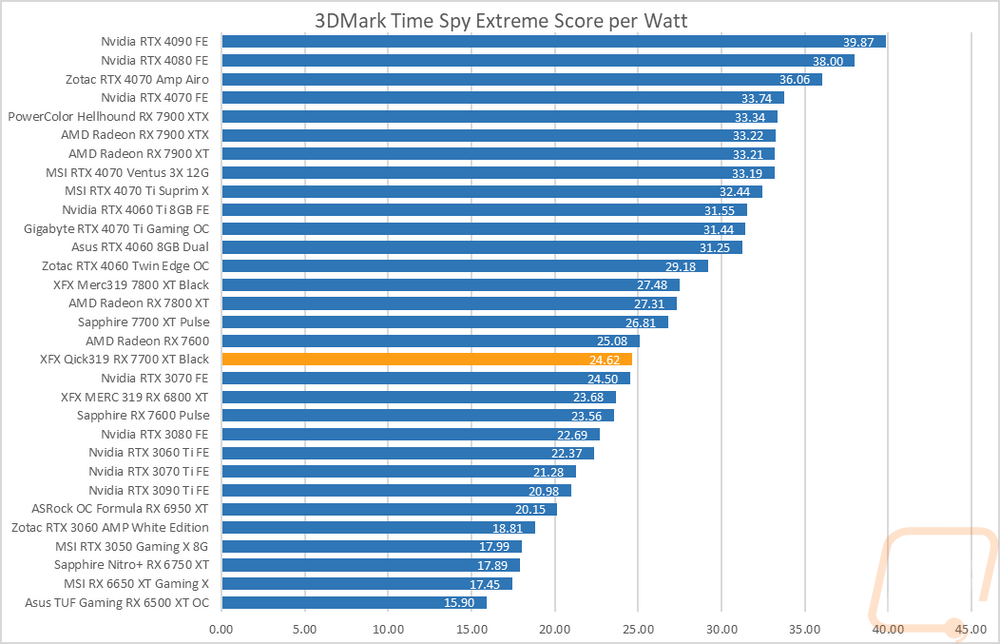
With having exact peak wattage numbers when running Time Spy Extreme I was also able to put together a graph showing the total score for each watt that a card draws which gives us an interesting look at overall power efficiency in the popular and demanding benchmark. The QICK 319 RX 7700 XT Black came in with a score per watt of 24.62 which is down two from the stock-clocked Pulse and was close in efficiency with the RTX 3070 Founders Edition and behind the reference RX 7600. Given how close our synthetic results this isn’t a surprise at all.
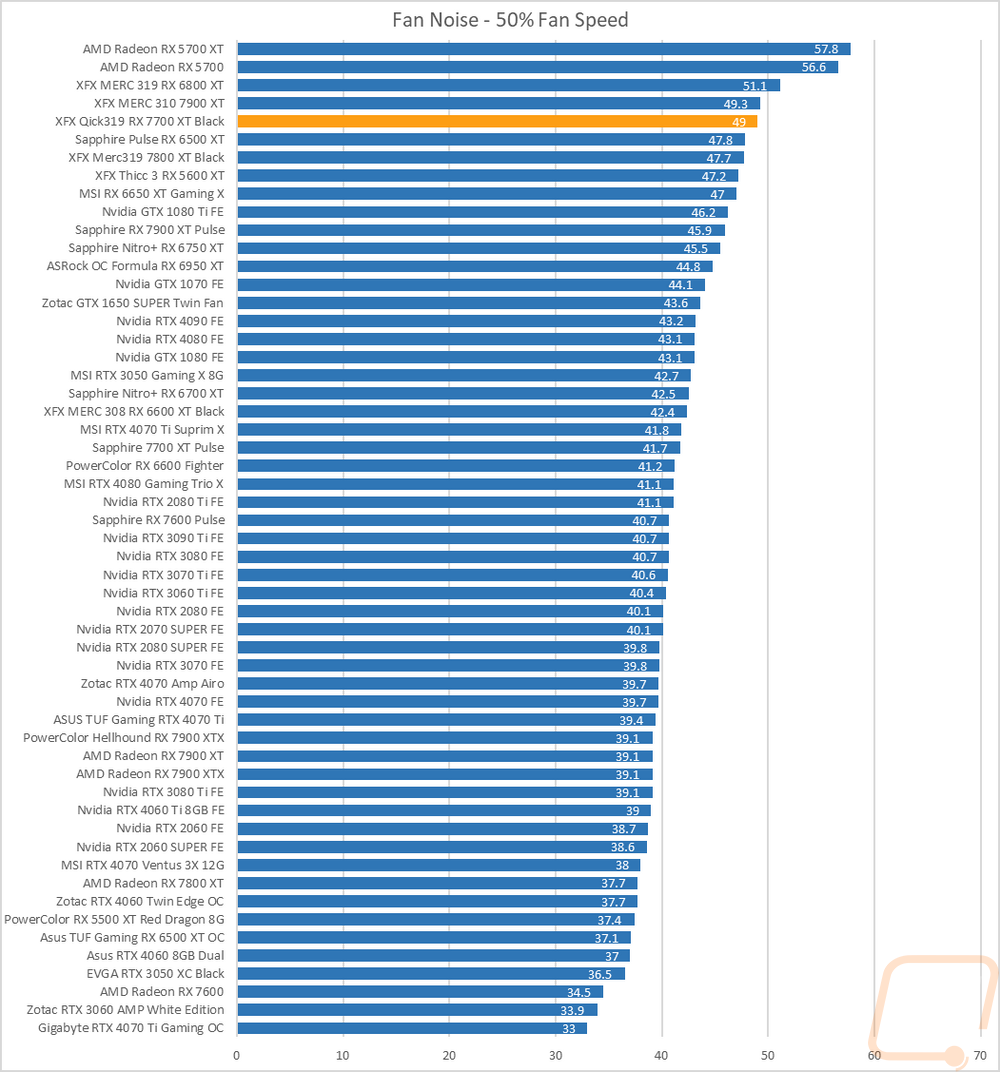
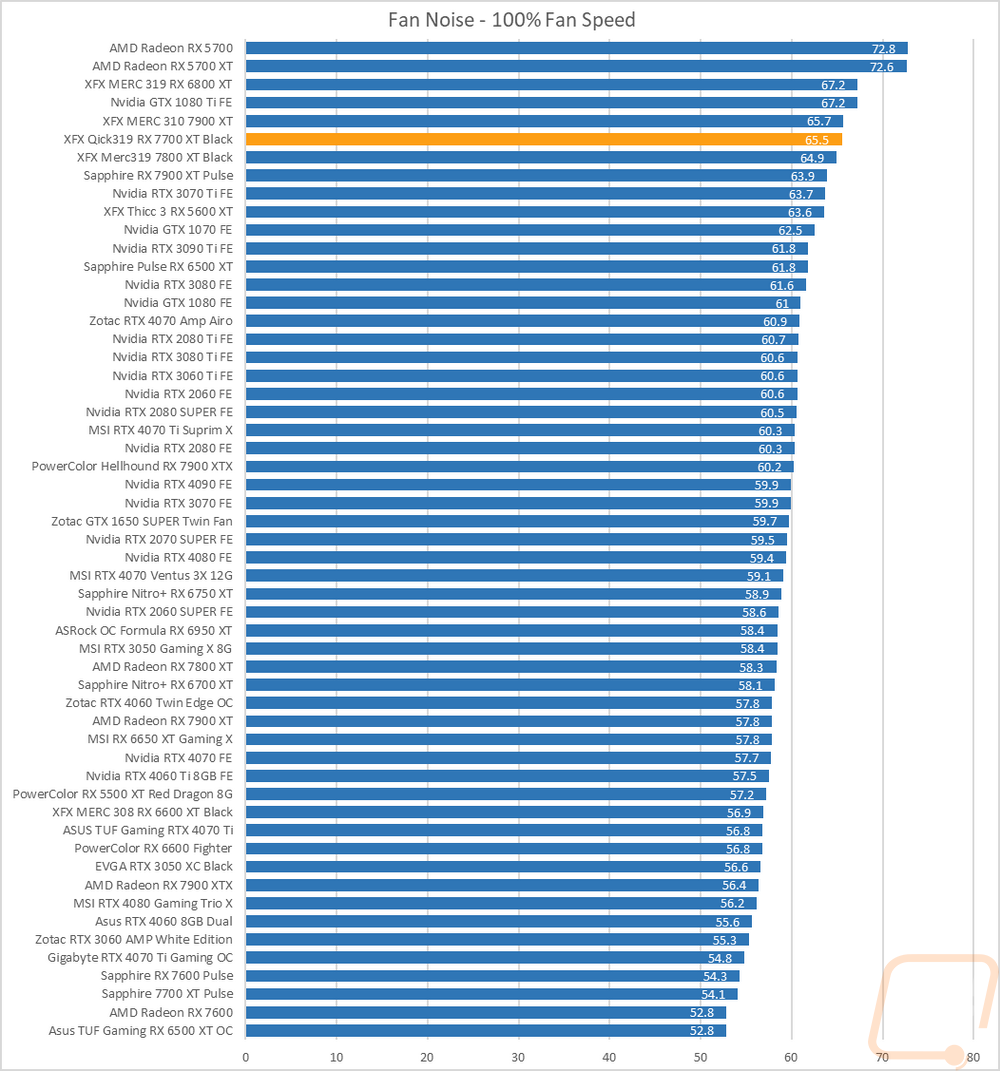
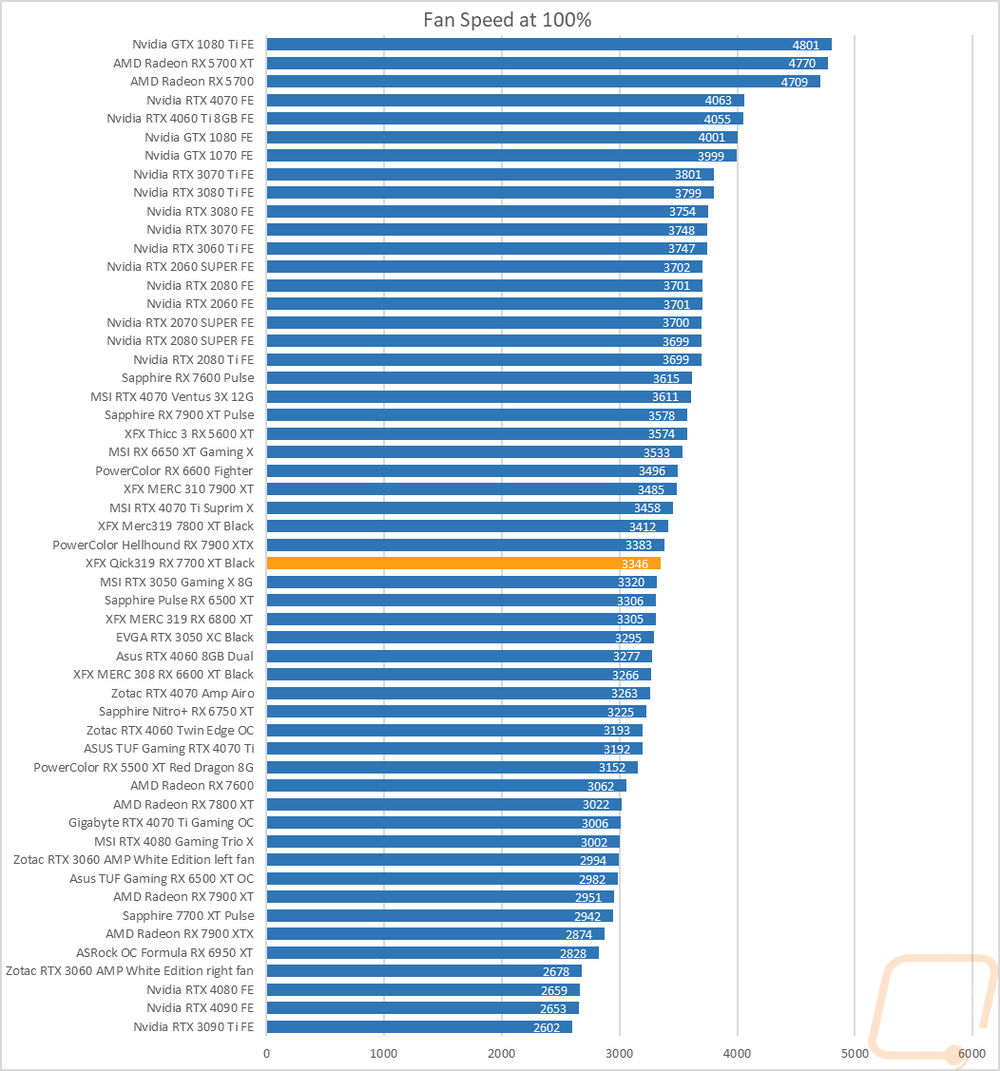
My next round of tests were looking at noise levels. These are especially important to me because I can’t stand to listen to my PC whirling. Especially when I’m not in game and other applications are using the GPU. For my testing, though I first tested with the fan cranked up to 100% to get an idea of how loud it can get, then again at 50% to get an idea of its range. The QICK 319 RX 7700 XT Black was up in the top ¼ of the charts for both its 50% and 100% fan speed results. At 100% fan speed the three fans were running at 3346 RPM which is in the middle of the chart.
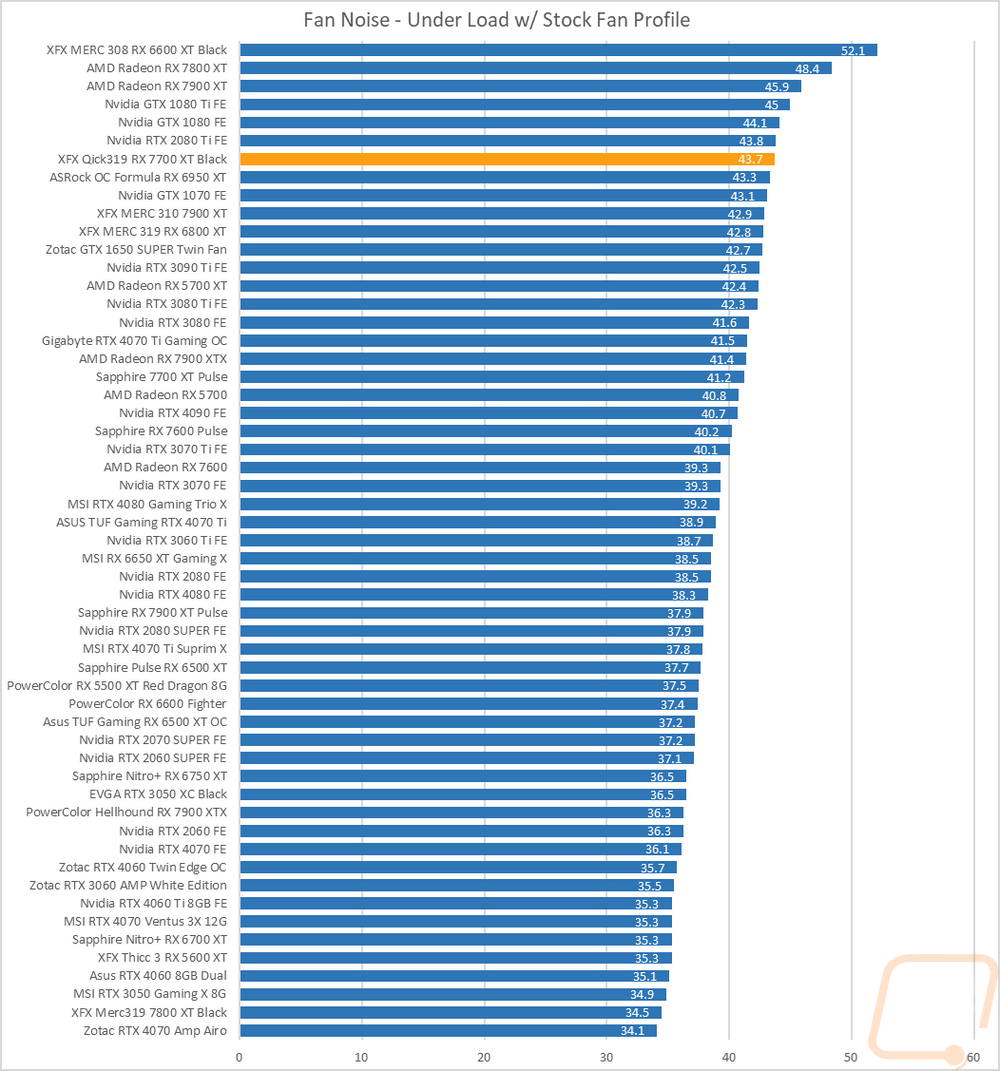
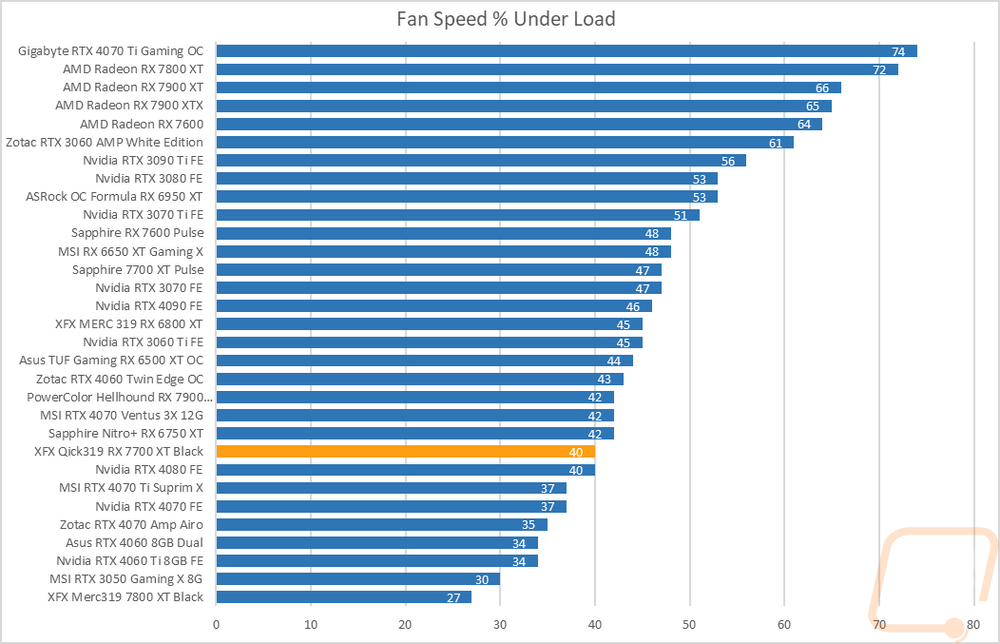
I also take a look at noise performance while under load. For that when running AIDA64’s stress test I wait until the temperature of the card has leveled off and then measure how loud things are when the card is at its worst-case scenario with the stock fan profile. Here the QICK 319 RX 7700 XT Black was again up in the top ¼ of the chart which is a complete change from the XFX MERC 319 RX 7800 XT which is down at the bottom of this chart. The QICK 319 RX 7700 XT Black was at least not running too high with its fan speed % when under load with the fans running at 40% but that also means that adjusting the fan profile isn’t the fix here.
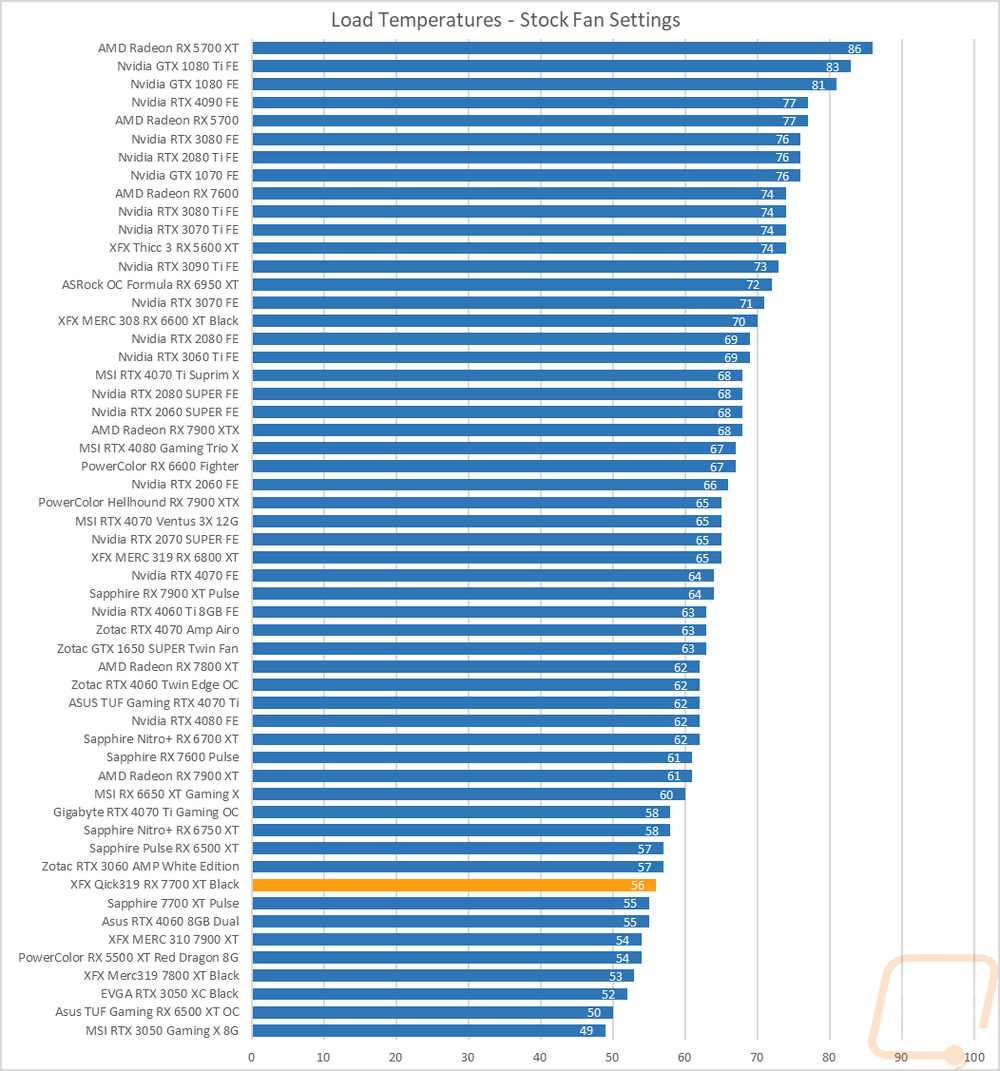
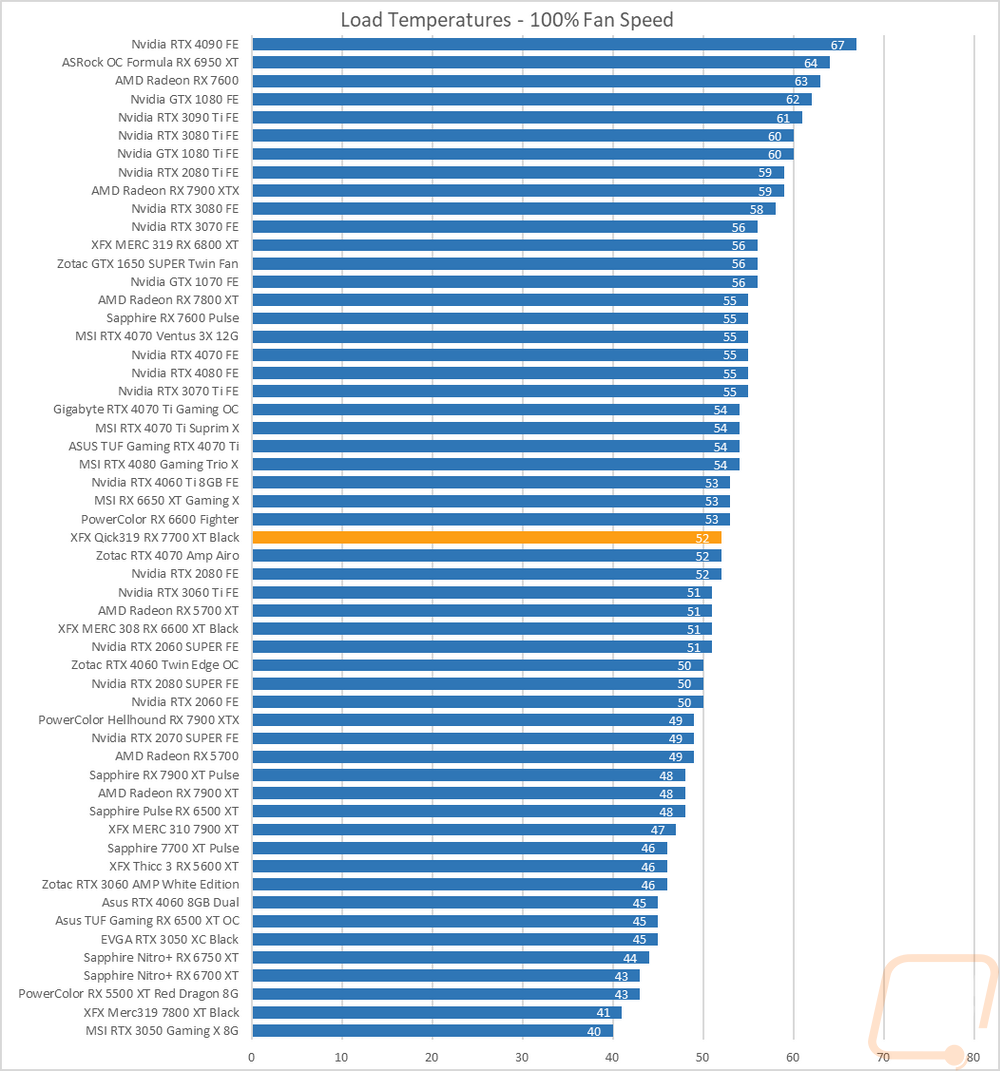
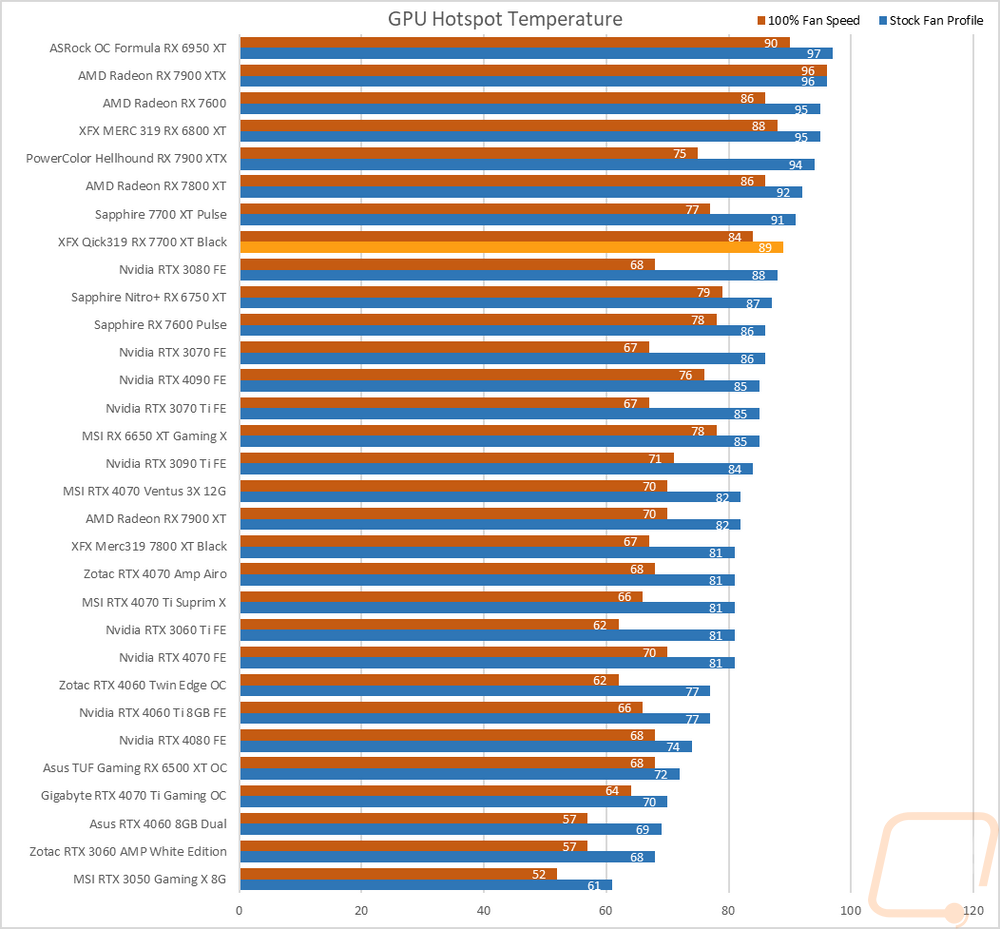
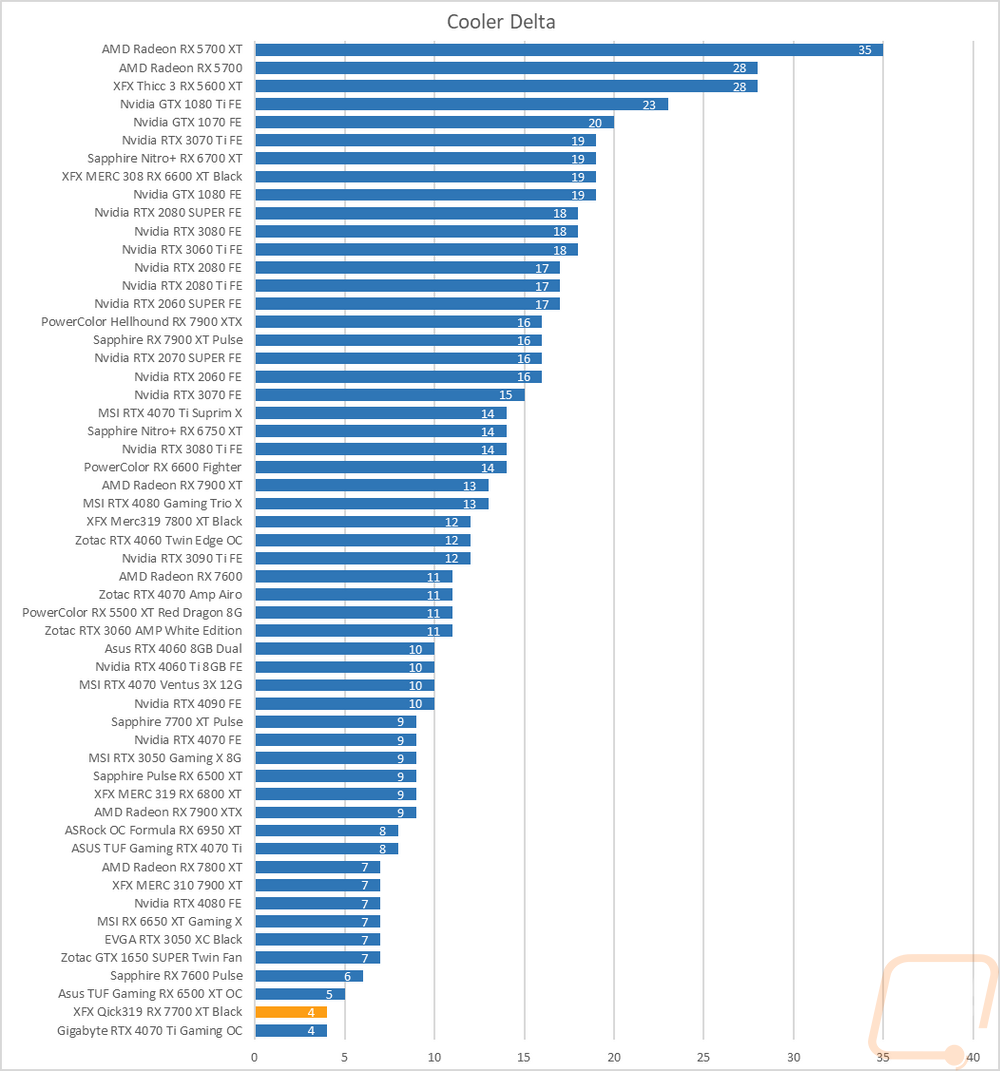
To finish up my testing I of course had to check out the cooling performance. To do this I ran two different tests. I used AIDA64’s Stress Test run for a half-hour each to warm things up. Then I documented what temperature the GPU leveled out at with the stock fan profile and then again with the fans cranked up to 100%. With the stock profile, the QICK 319 RX 7700 XT Black ran surprisingly cool 56c. This was just 1 degree more than the stock-clocked 7700 XT Pulse. Its GPU hotspot was at 89c, 2 degrees below the Pulse. Then with the fans cranked up it dropped down to 52c which moved the QICK 319 RX 7700 XT Black up into the middle of the chart. The GPU hotspot at 100% fan speed was also warmer at 84c, 7c higher than the Pulse in that same situation. Overall the delta between the two cards was just 4c which shows that while the QICK 319 RX 7700 XT Black wasn’t running at a high fan speed the cooler doesn’t benefit much more from cranking them up. Without undervolting, there isn’t much headroom left here.
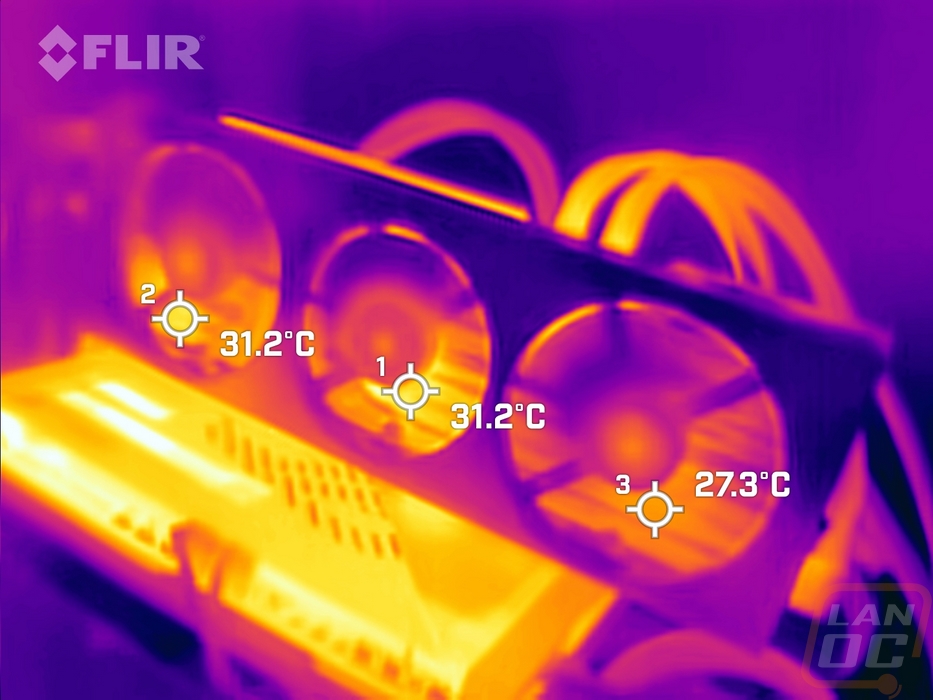
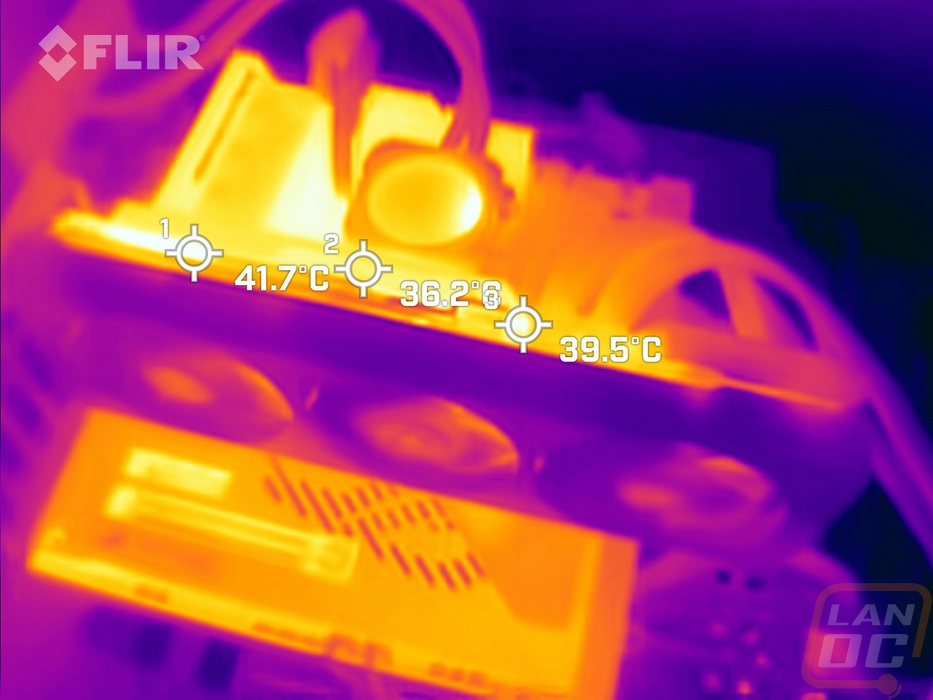
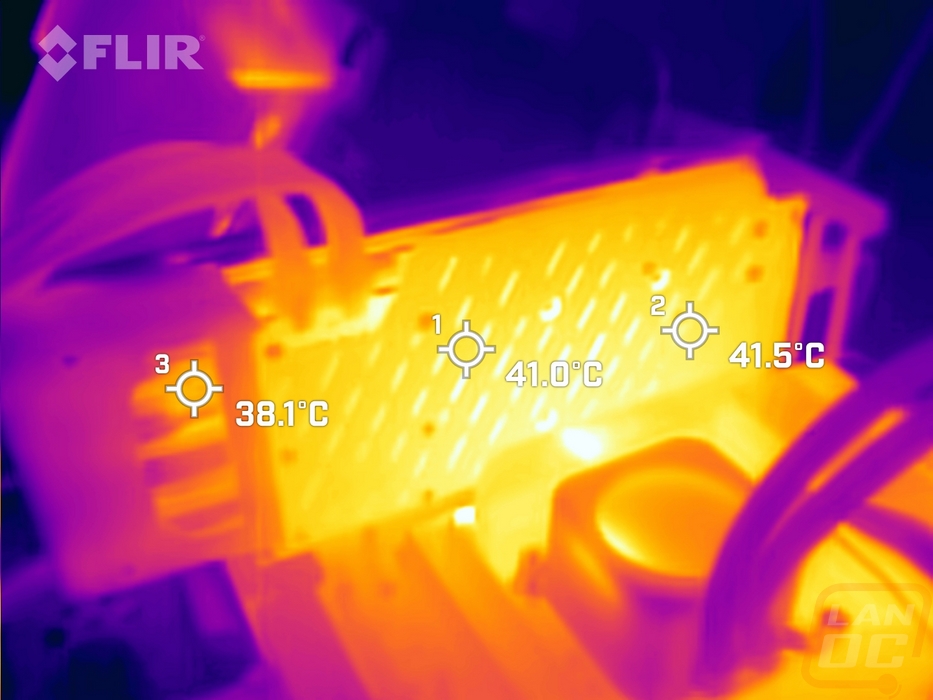
While running the stock fan profile testing I also took the time to get a few thermal images so we could see what is going on. The fan side of the XFX QICK 319 RX 7700 XT Black has the hot spots behind two of the three fans at the same 31.2c and the hottest spot on the end fan running cooler from the blow-through design at 27.3c. The plastic fan shroud hasn’t retained much of the card's heat but we can see some of the heat up under the card and especially at the top where it blows out and up onto the power cables. The top edge was up to 41.7c on the far left on the PCB which is a lot cooler than most cards. Then the slotted backplate which is metal, even though it doesn’t have thermal pads between it and the PCB like the MERC 7800 XT Black did you can still see how much heat the sheet metal aluminum backplate has picked up. You can see the temperature difference in the backplate vs. the fan shroud and blow-through area at the end.
Overall and Final Verdict
In my review of the Sapphire RX 7700 XT pulse, we got a look at the 7700 XT’s stock-clocked performance and I was impressed with how it compared with the RTX 4060 Ti. That was no different this time with the XFX QICK 319 RX 7700 XT Black. It is overclocked and in a majority of our tests that translated to a small performance bump. 1440p performance was solid, not up into the same range as the new 7800 XT but perfect to pair with a 1440p 144Hz display while also having some capabilities at 4k should you need it. Blender performance is still not that impressive. Ray tracing performance isn’t caught up to Nvidia, but has improved from the last generation.
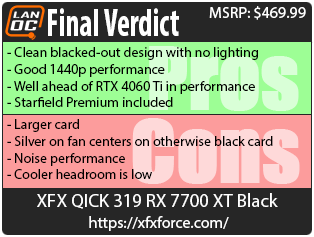
Like with all of the AMD cards I have taken a look at today, the QICK 319 RX 7700 XT Black has standard PCIe power connections which means you can save money by reusing your older power supply if you have one or avoid having to use adapters. XFX’s design is similar to the XFX MERC 319 RX 7800 XT but the QICK 319 RX 7700 XT Black doesn’t have the silver trim that the MERC has making it a simple blacked-out card design. The only fault there is that the fans have the same silver and black accents on them that the MERC had which spoils the blacked-out look. The cooler on the QICK 319 RX 7700 XT Black handled things fine but there wasn’t much headroom left over, it didn’t perform much better when going from the stock fan profile to 100% fan speed. Our noise testing had it up near the top of our charts in all three tests as well which is the opposite of what I saw from the MERC. In the end, the large card did improve on what I saw from the Sapphire 7700 XT Pulse, but I do wish that XFX had a more compact design like the Pulse as well.
For pricing the QICK 319 RX 7700 XT Black should be priced between 459.99 and 469.99 and for comparison the base MSRP of the 7700 XT is $449. AMD didn’t leave much room between the 7700 XT and the 7800XT which is the biggest downside to the 7700 XT. It isn’t a bad performing GPU, but once you start looking at a card like the QICK 319 RX 7700 XT Black you get close to a stock-clocked RX 7800 XT quick. The QICK 319 RX 7700 XT Black like with all of the other 7700 XT and 7800 XT’s does come with Starfield Premium Edition which is a $99 value. If you were already planning on picking up the game that isn’t a bad value add.

Live Pricing: HERE


