Cooling Noise and Power
For my last few tests, rather than focusing on in game performance, I like to check out other aspects of video card performance. These are also the most important ways to differentiate the performance between cards that have the same GPU. To start things off I took a look at power usage.
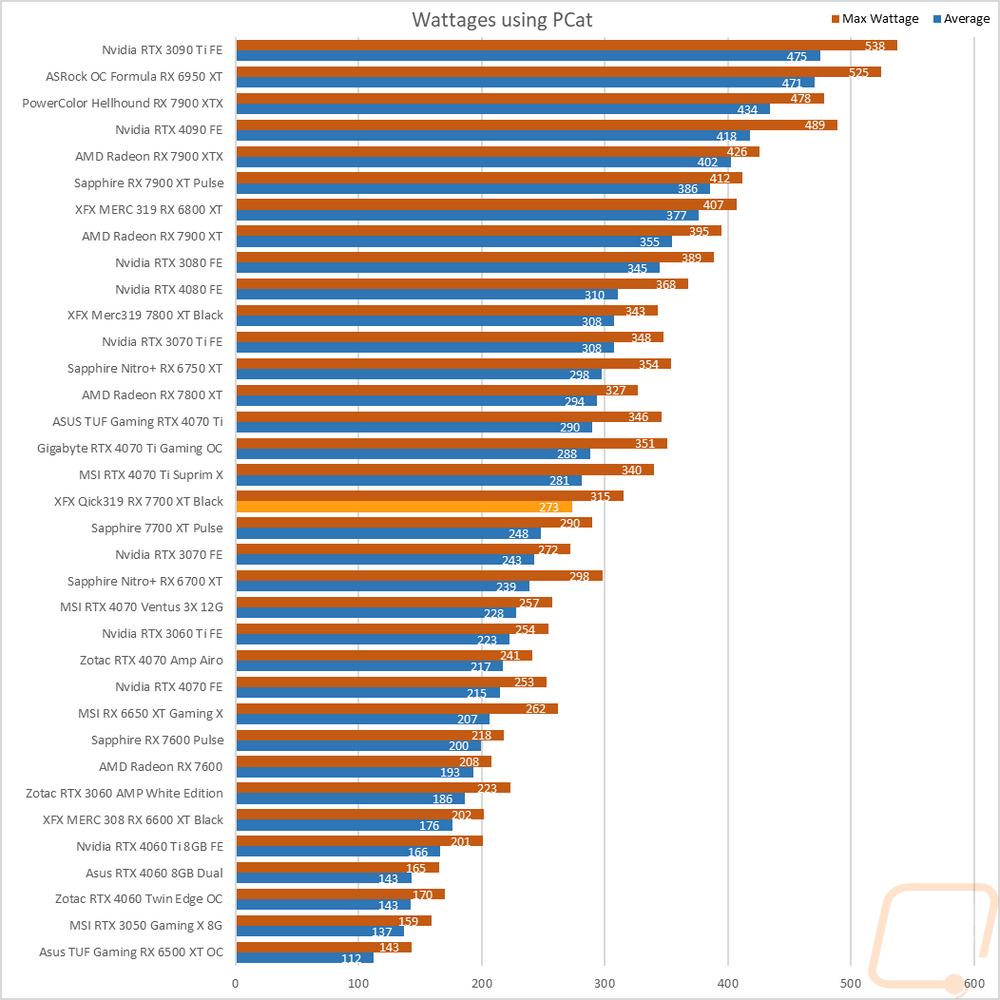
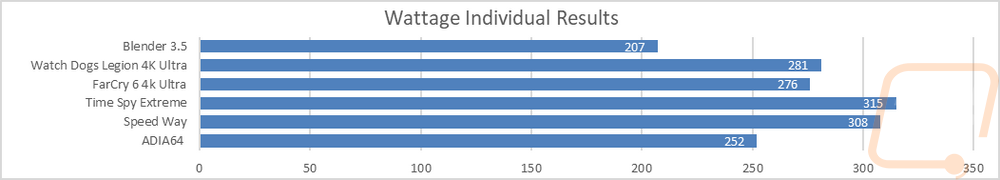
For this, our new test setup utilizes the Nvidia-designed PCat v2 along with cables to handle both traditional 6 or 8-pin connections as well as the new 12VHPWR. The PCat also utilizes a PCIe adapter to measure any power going to the card through the PCIe slot so we can measure the video card wattage exclusively, not the entire system as we have done in the past. I test with a mix of applications to get both in game, synthetic benchmarks, and other workloads like Blender and AIDA64. Then everything is averaged together for our result. I also have the individual results for this specific card and I document the peak wattage result as well which is almost always Time Spy Extreme. The QICK 319 RX 7700 XT Black averaged 273 watts across our tests and peaked at 315 watts. This put it above the stock-clocked 7700 XT Pulse but 25 watts ahead in both the average and peak. This put it close to the RTX 4070 Ti as well.
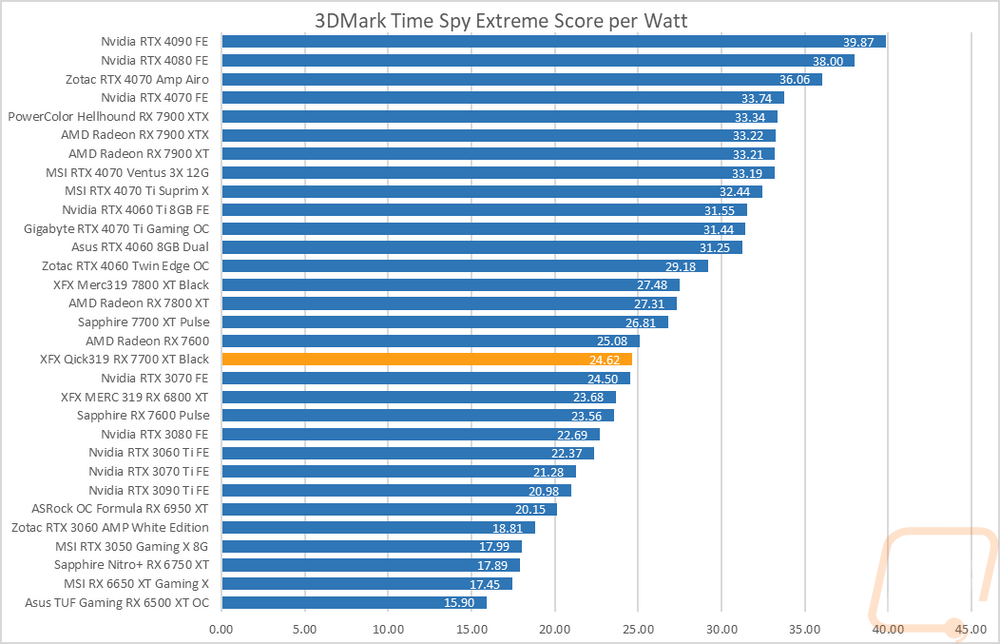
With having exact peak wattage numbers when running Time Spy Extreme I was also able to put together a graph showing the total score for each watt that a card draws which gives us an interesting look at overall power efficiency in the popular and demanding benchmark. The QICK 319 RX 7700 XT Black came in with a score per watt of 24.62 which is down two from the stock-clocked Pulse and was close in efficiency with the RTX 3070 Founders Edition and behind the reference RX 7600. Given how close our synthetic results this isn’t a surprise at all.
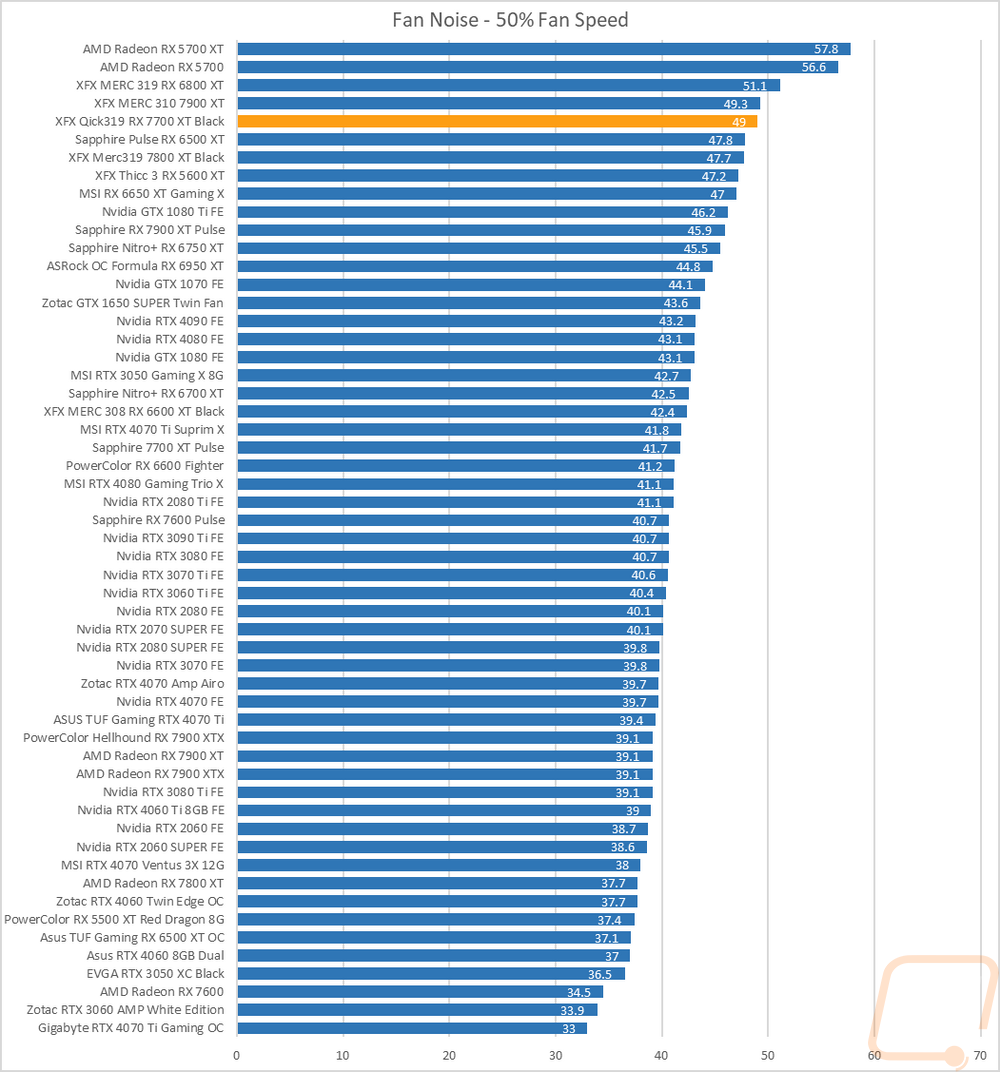
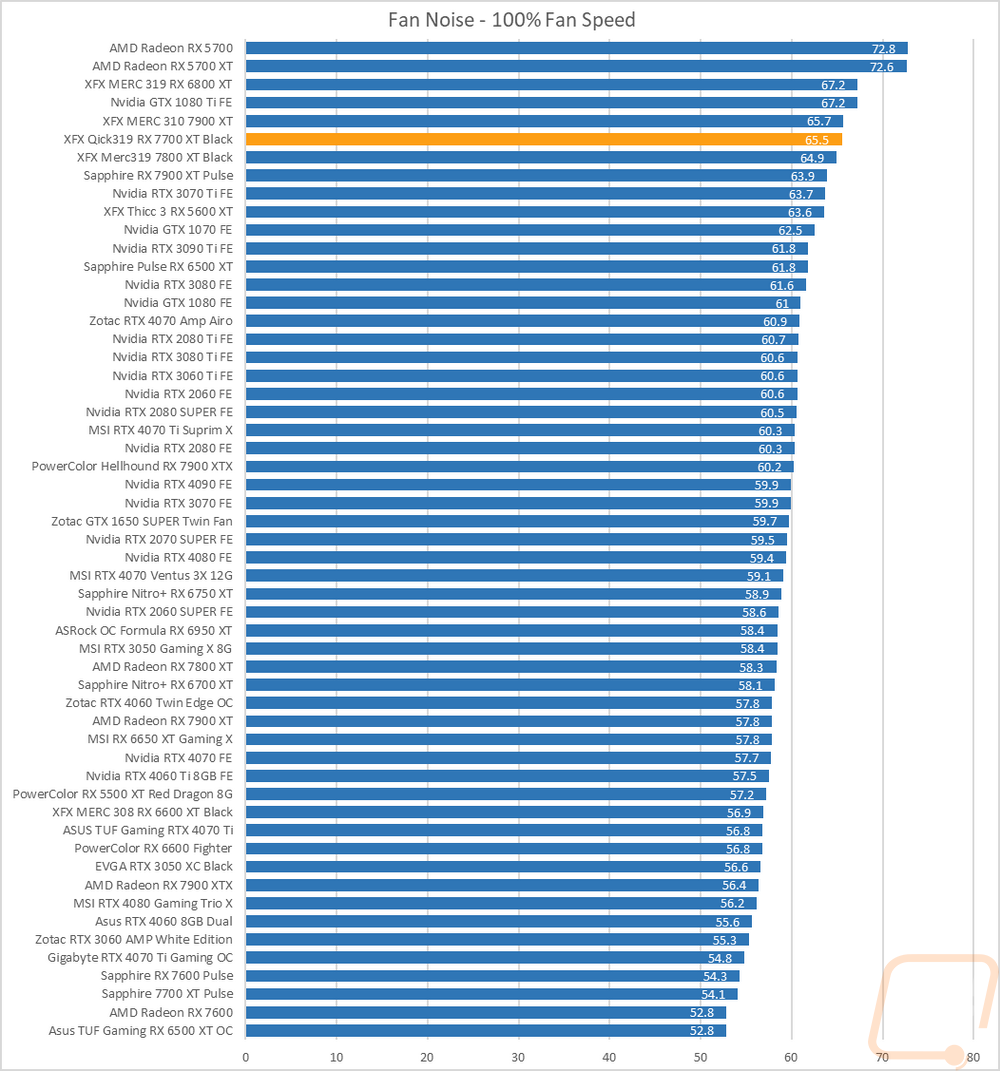
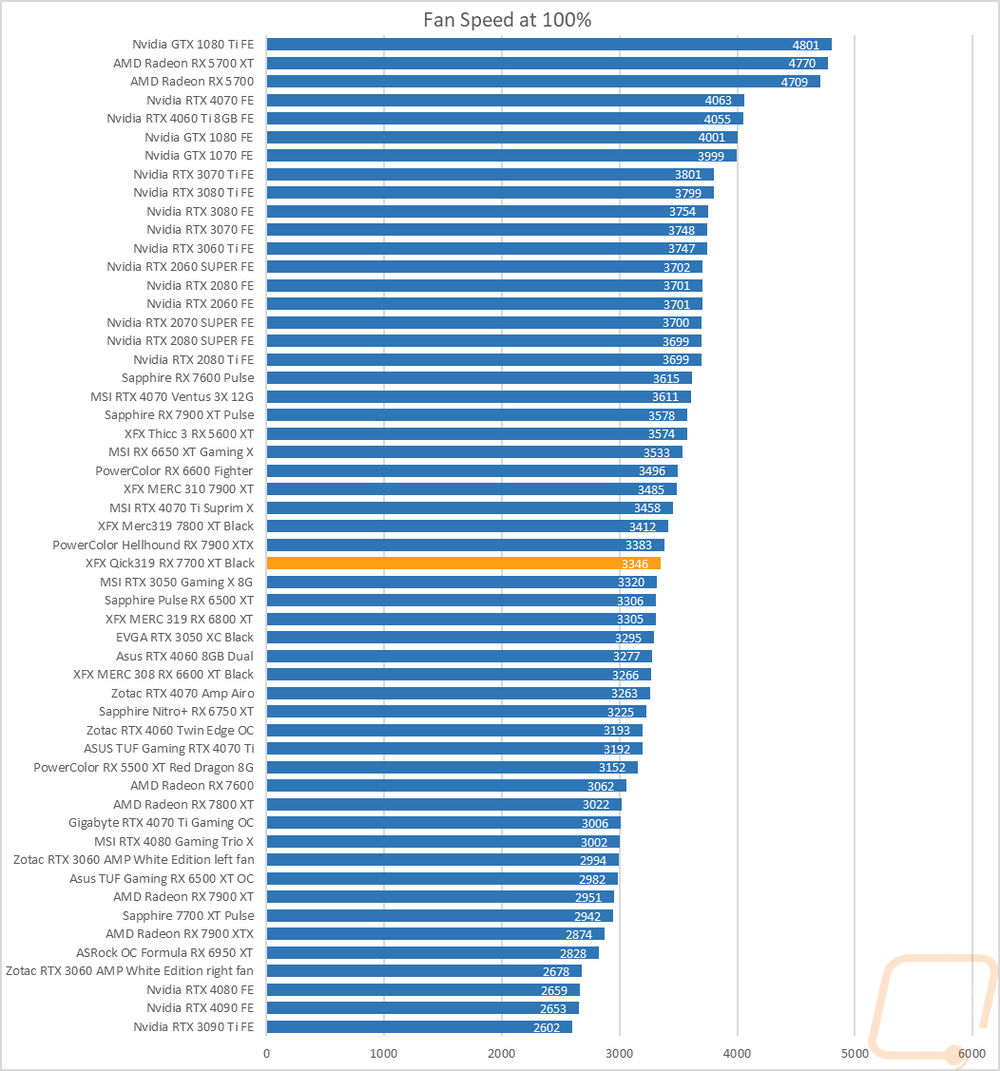
My next round of tests were looking at noise levels. These are especially important to me because I can’t stand to listen to my PC whirling. Especially when I’m not in game and other applications are using the GPU. For my testing, though I first tested with the fan cranked up to 100% to get an idea of how loud it can get, then again at 50% to get an idea of its range. The QICK 319 RX 7700 XT Black was up in the top ¼ of the charts for both its 50% and 100% fan speed results. At 100% fan speed the three fans were running at 3346 RPM which is in the middle of the chart.
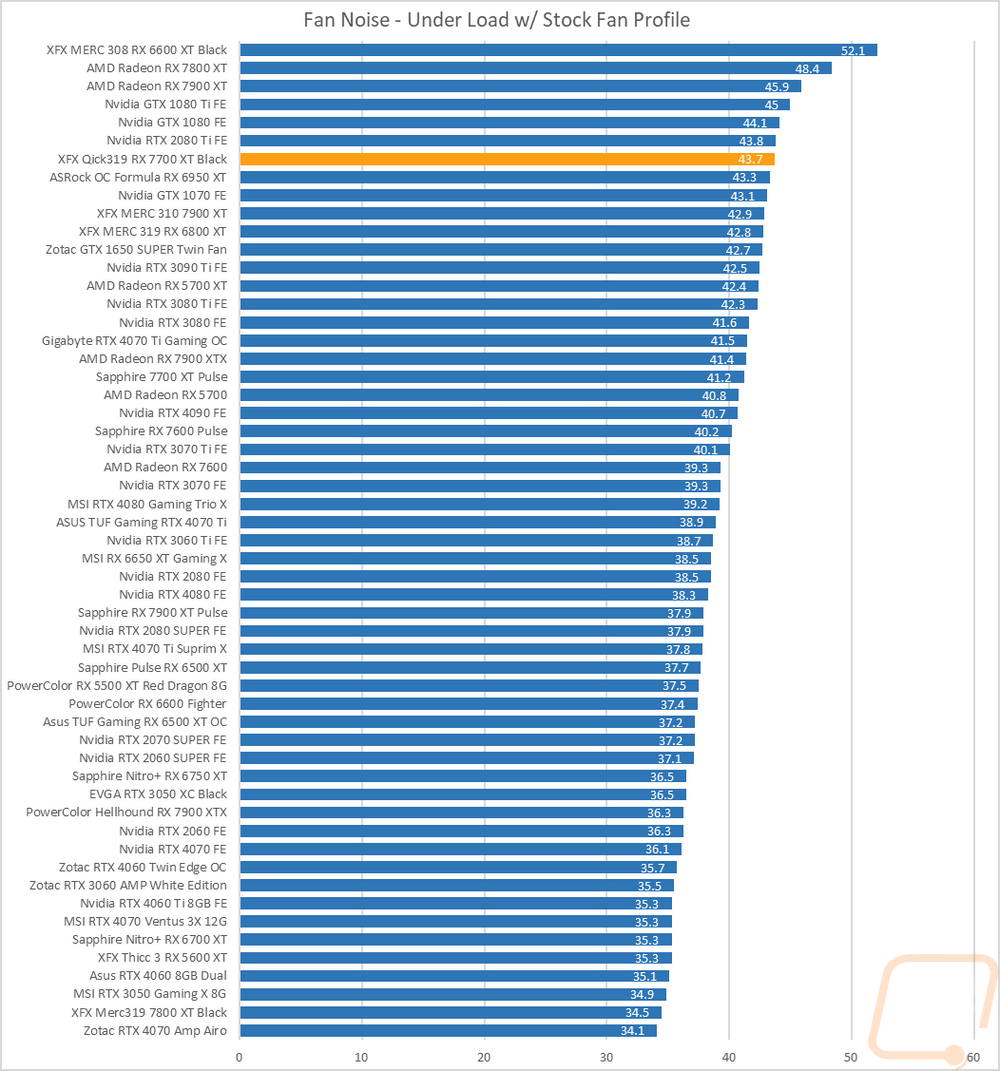
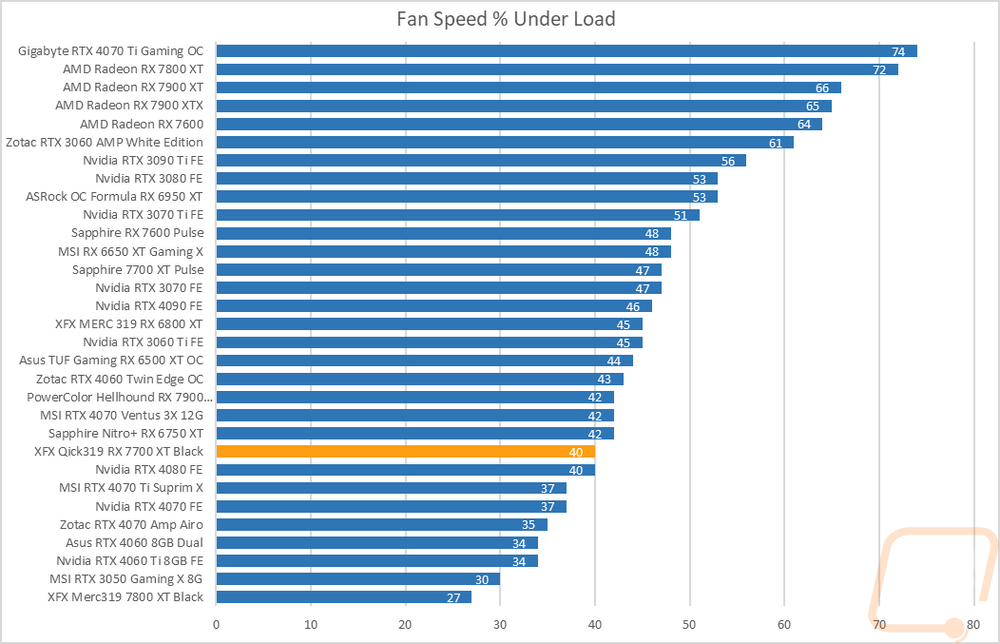
I also take a look at noise performance while under load. For that when running AIDA64’s stress test I wait until the temperature of the card has leveled off and then measure how loud things are when the card is at its worst-case scenario with the stock fan profile. Here the QICK 319 RX 7700 XT Black was again up in the top ¼ of the chart which is a complete change from the XFX MERC 319 RX 7800 XT which is down at the bottom of this chart. The QICK 319 RX 7700 XT Black was at least not running too high with its fan speed % when under load with the fans running at 40% but that also means that adjusting the fan profile isn’t the fix here.
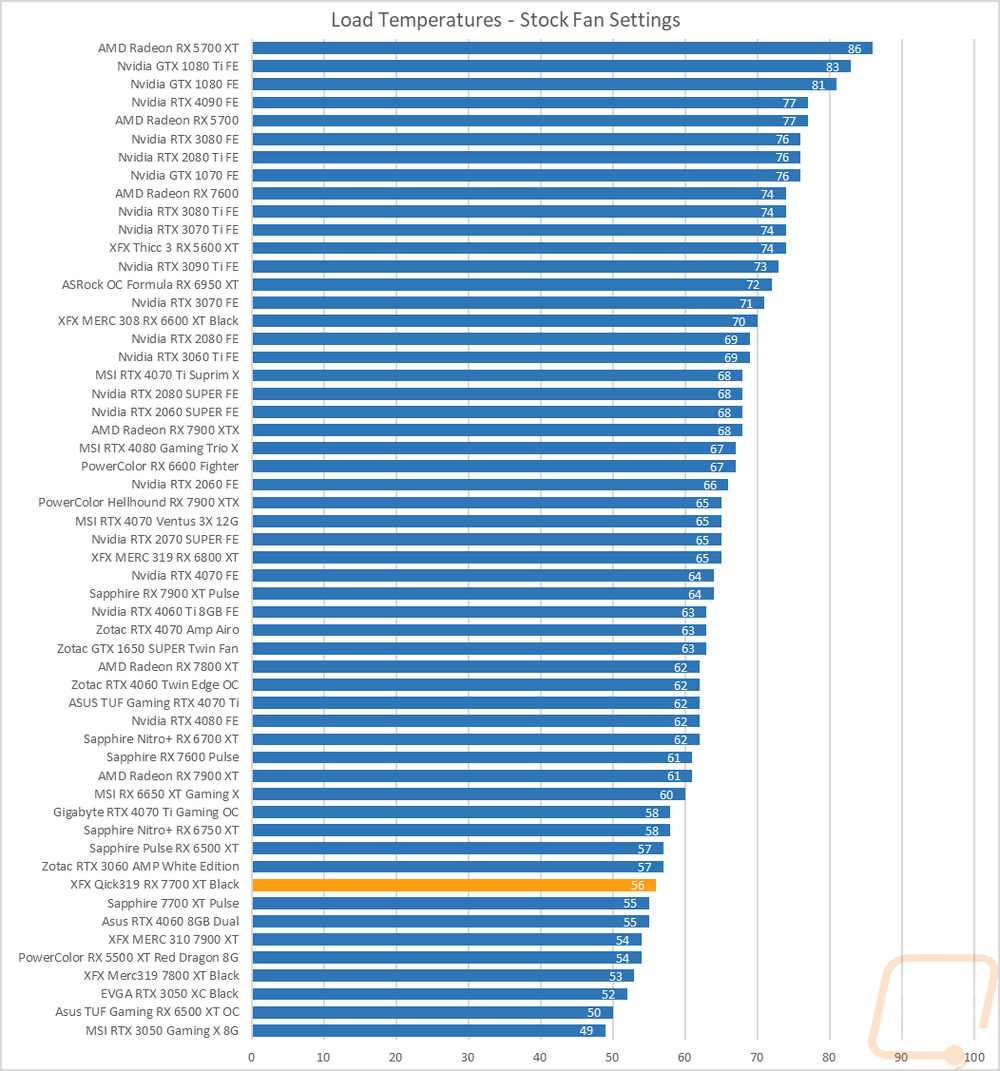
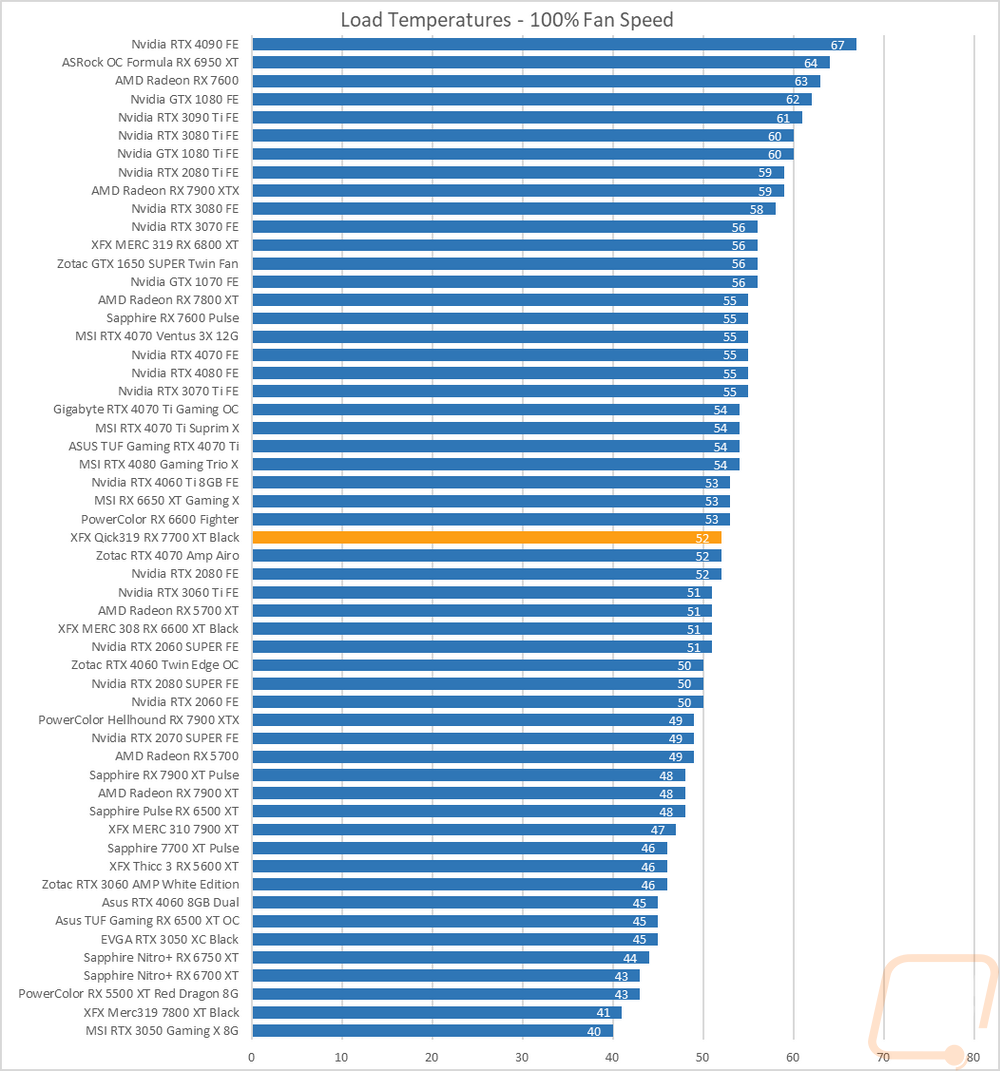
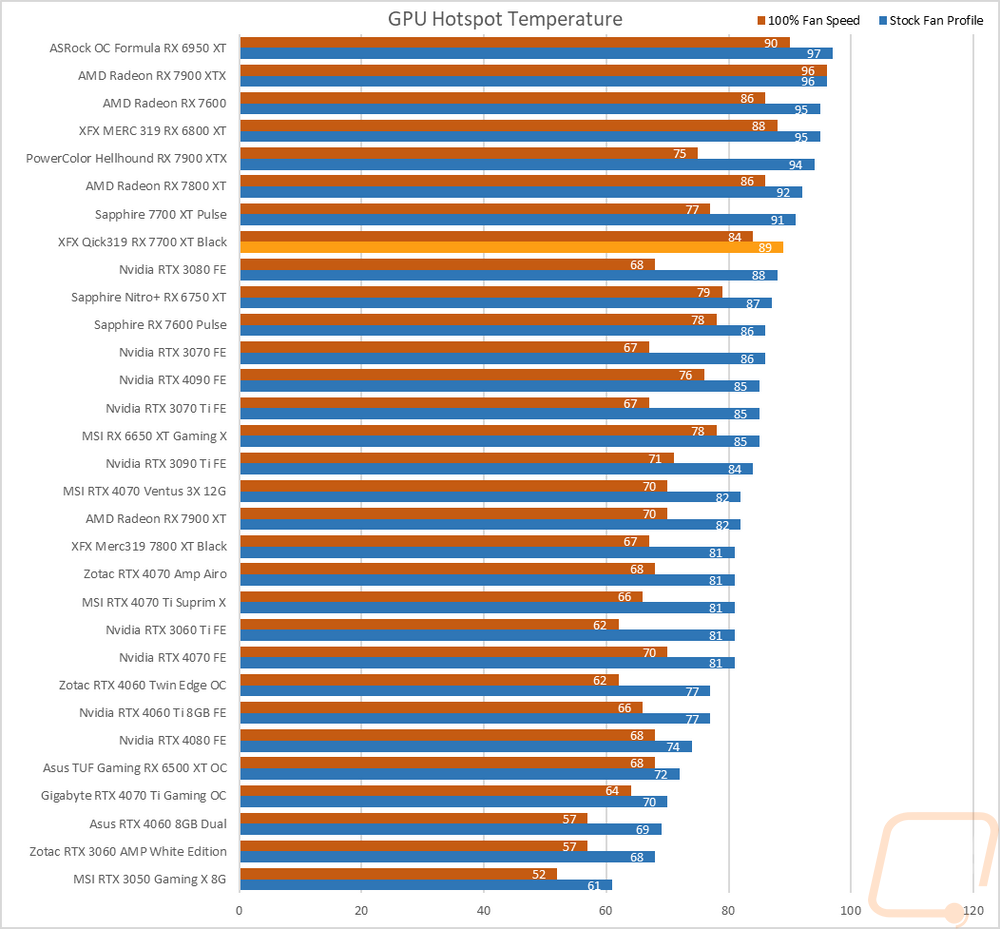
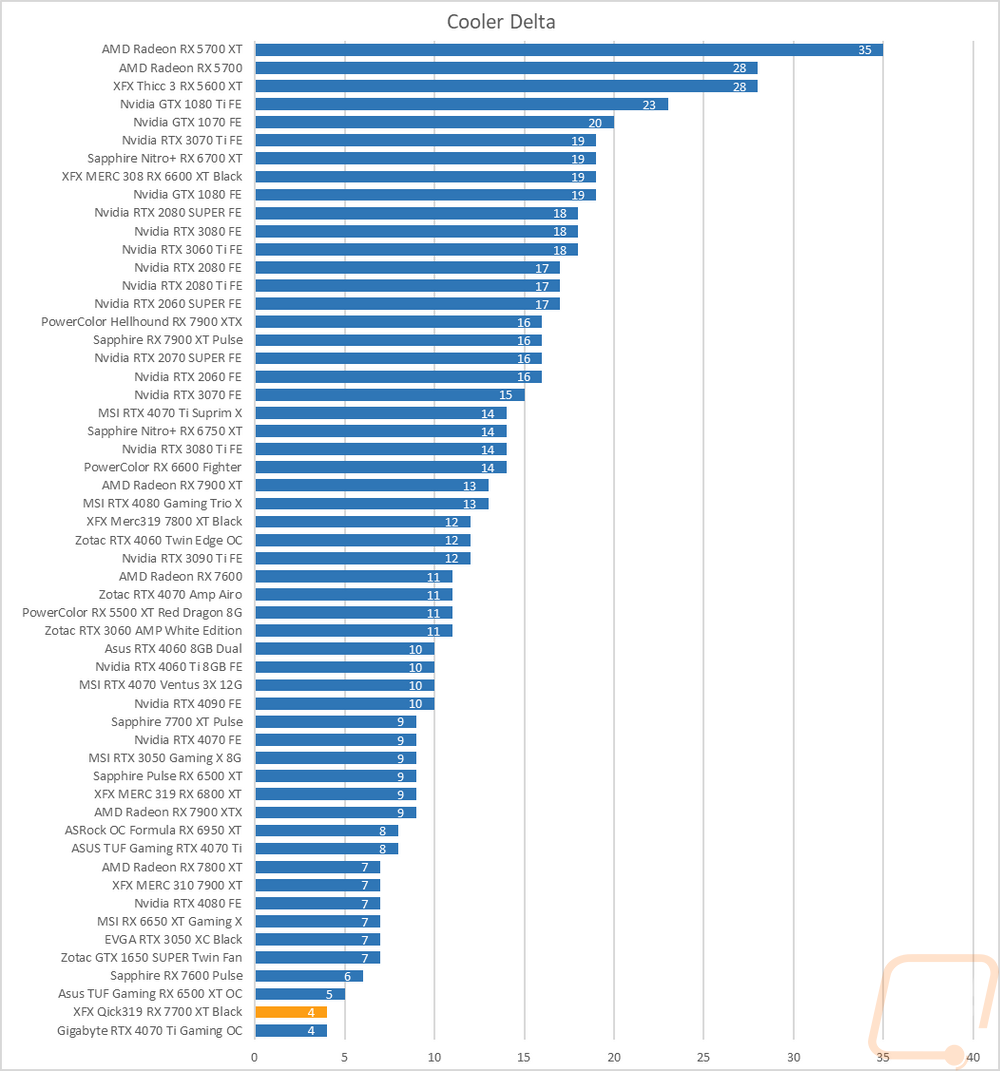
To finish up my testing I of course had to check out the cooling performance. To do this I ran two different tests. I used AIDA64’s Stress Test run for a half-hour each to warm things up. Then I documented what temperature the GPU leveled out at with the stock fan profile and then again with the fans cranked up to 100%. With the stock profile, the QICK 319 RX 7700 XT Black ran surprisingly cool 56c. This was just 1 degree more than the stock-clocked 7700 XT Pulse. Its GPU hotspot was at 89c, 2 degrees below the Pulse. Then with the fans cranked up it dropped down to 52c which moved the QICK 319 RX 7700 XT Black up into the middle of the chart. The GPU hotspot at 100% fan speed was also warmer at 84c, 7c higher than the Pulse in that same situation. Overall the delta between the two cards was just 4c which shows that while the QICK 319 RX 7700 XT Black wasn’t running at a high fan speed the cooler doesn’t benefit much more from cranking them up. Without undervolting, there isn’t much headroom left here.
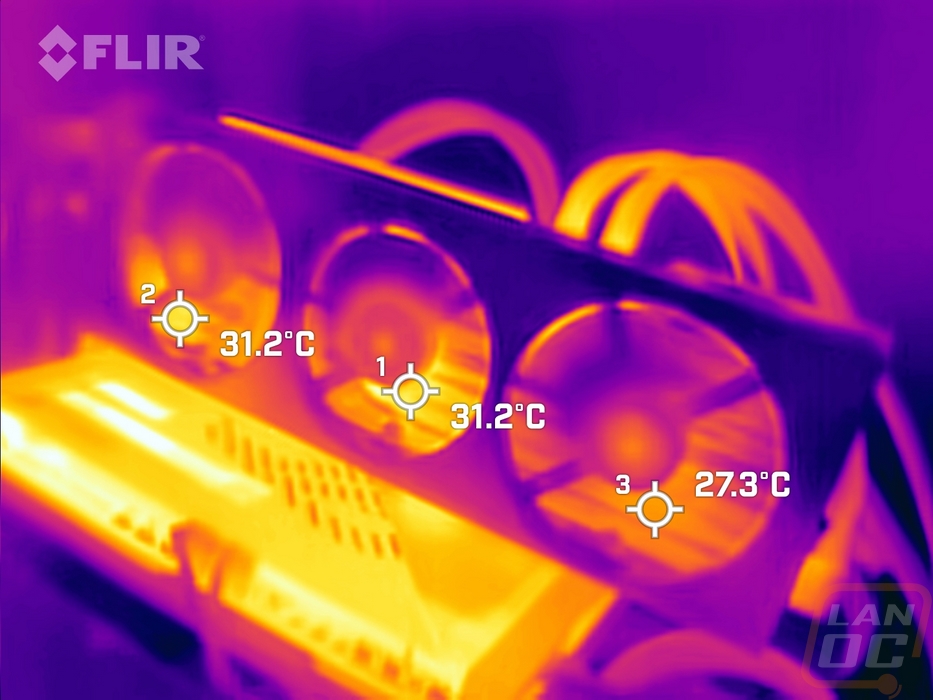
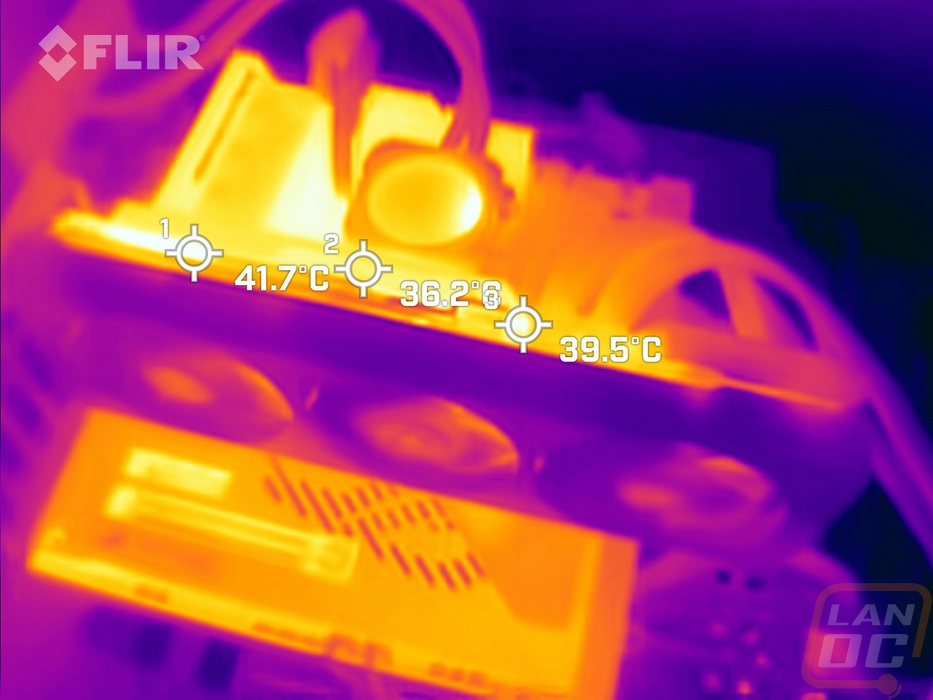
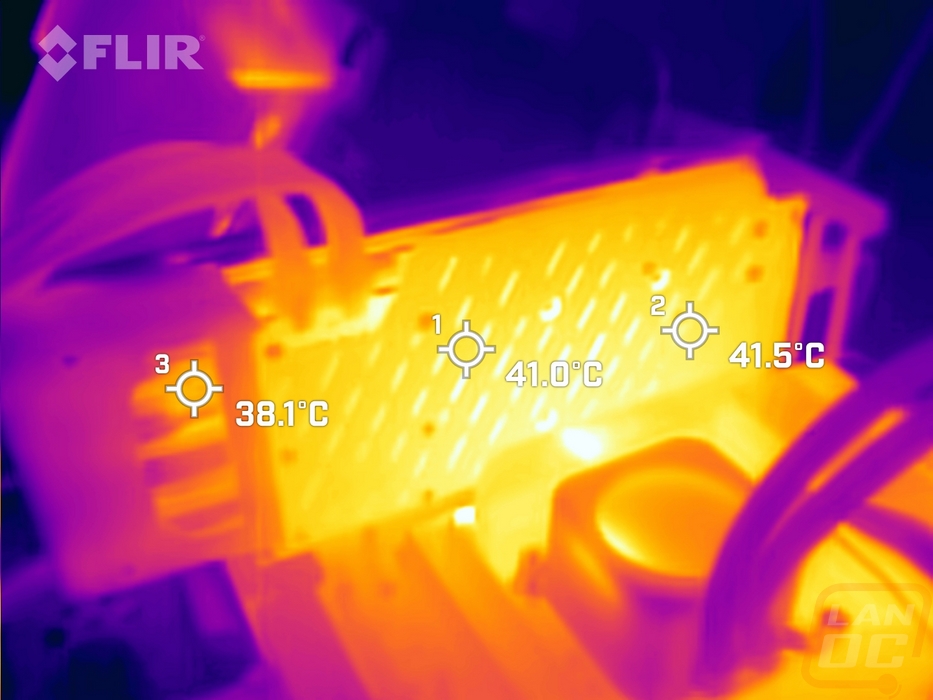
While running the stock fan profile testing I also took the time to get a few thermal images so we could see what is going on. The fan side of the XFX QICK 319 RX 7700 XT Black has the hot spots behind two of the three fans at the same 31.2c and the hottest spot on the end fan running cooler from the blow-through design at 27.3c. The plastic fan shroud hasn’t retained much of the card's heat but we can see some of the heat up under the card and especially at the top where it blows out and up onto the power cables. The top edge was up to 41.7c on the far left on the PCB which is a lot cooler than most cards. Then the slotted backplate which is metal, even though it doesn’t have thermal pads between it and the PCB like the MERC 7800 XT Black did you can still see how much heat the sheet metal aluminum backplate has picked up. You can see the temperature difference in the backplate vs. the fan shroud and blow-through area at the end.