In-Game Benchmarks
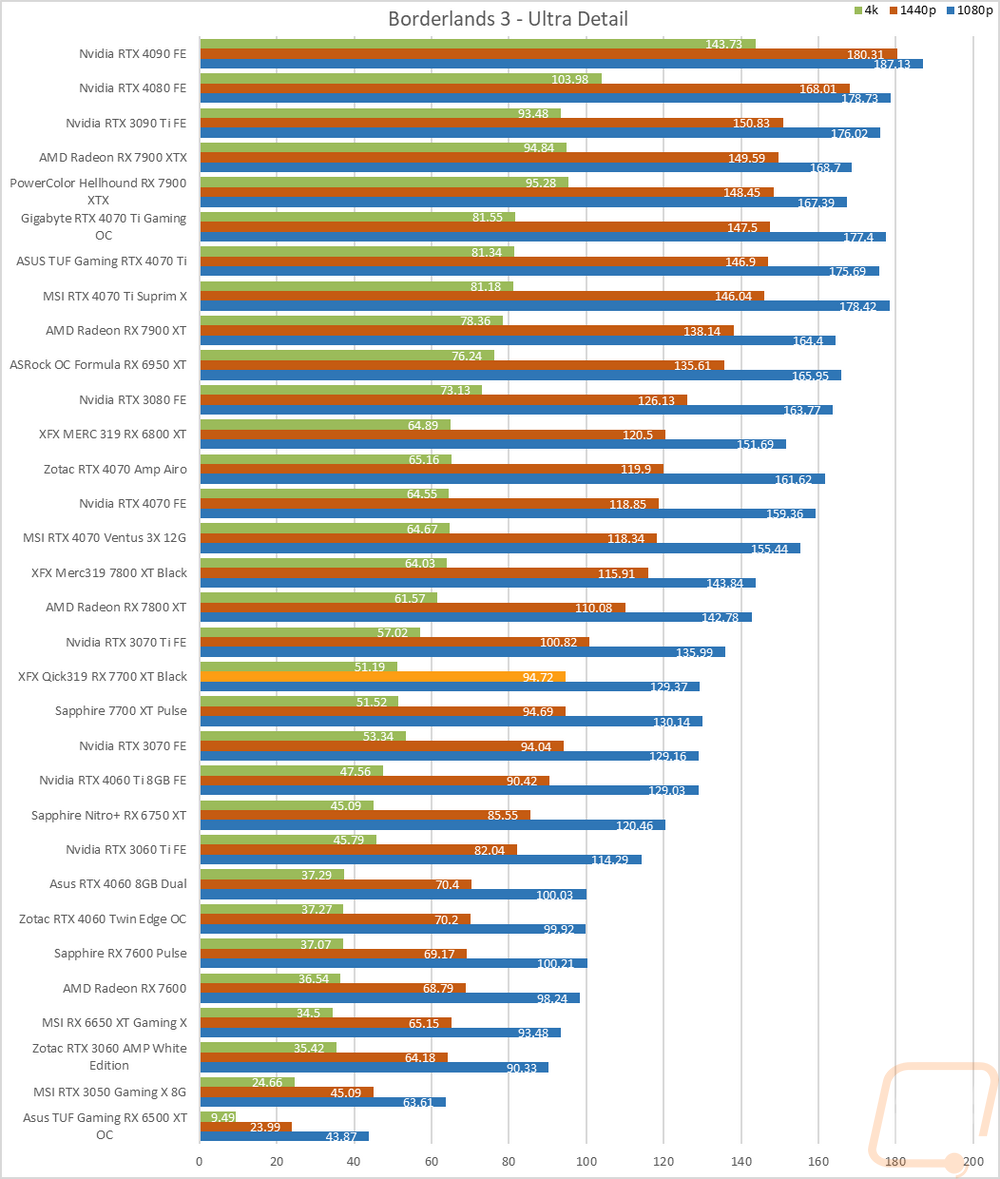
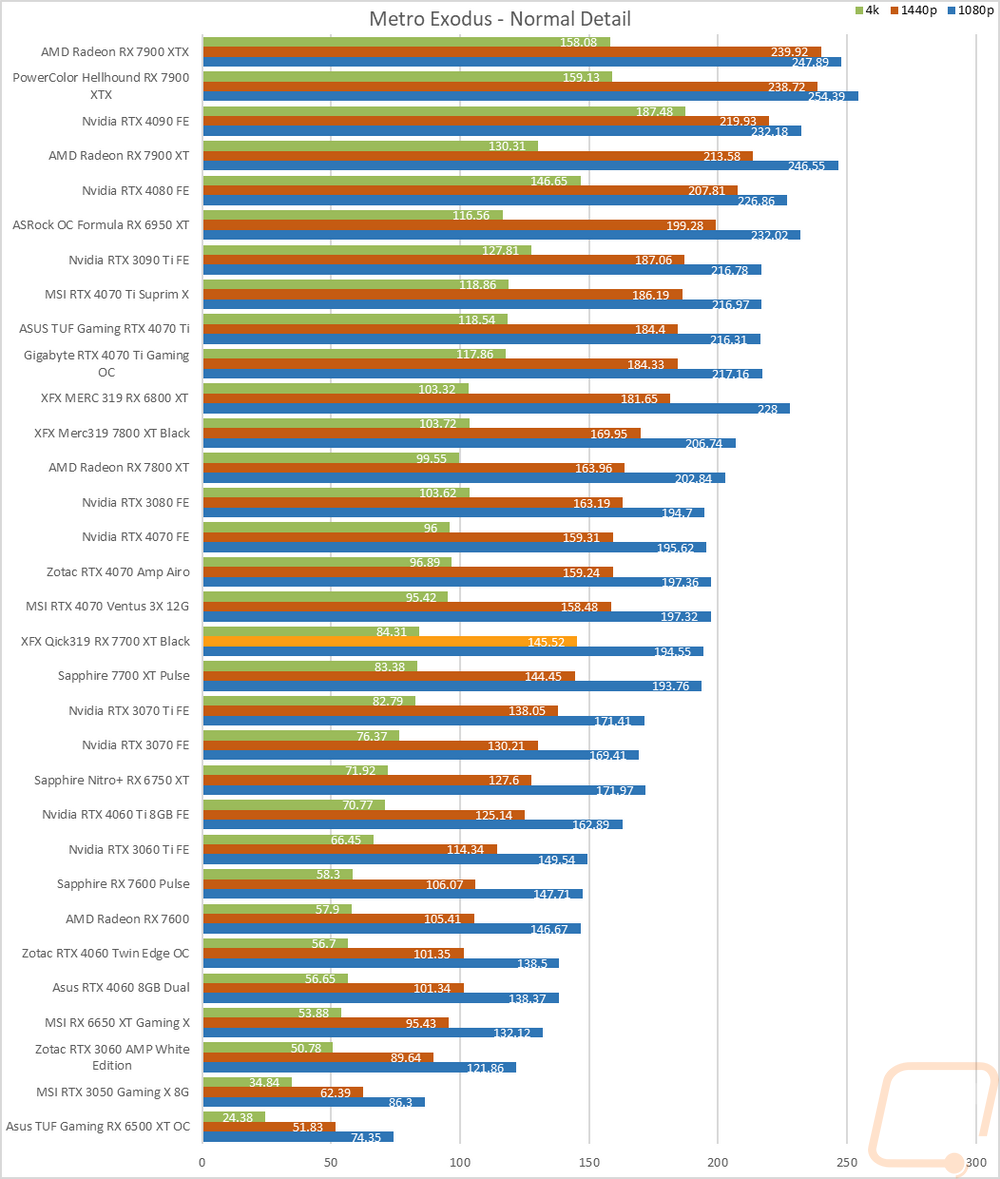
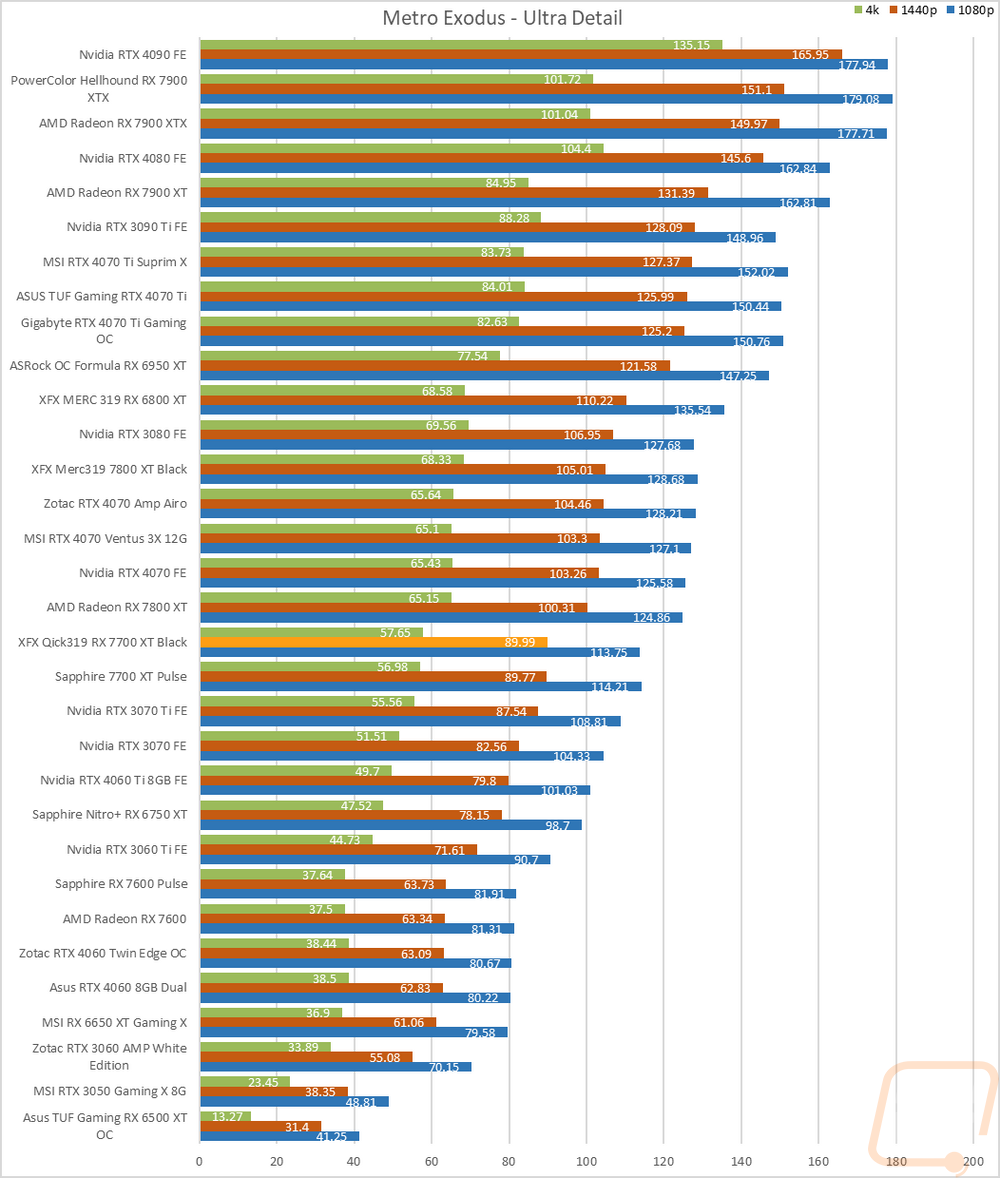
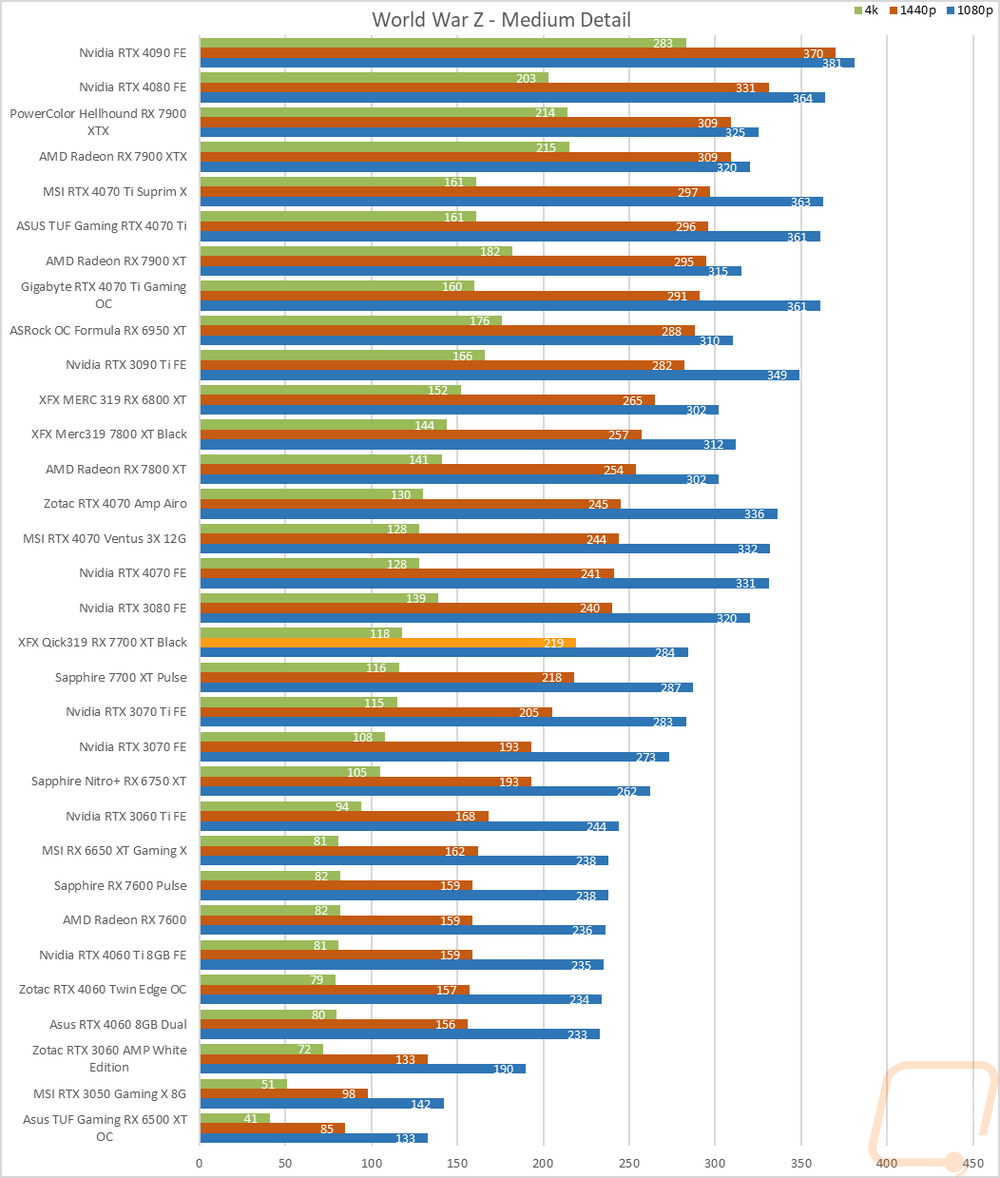
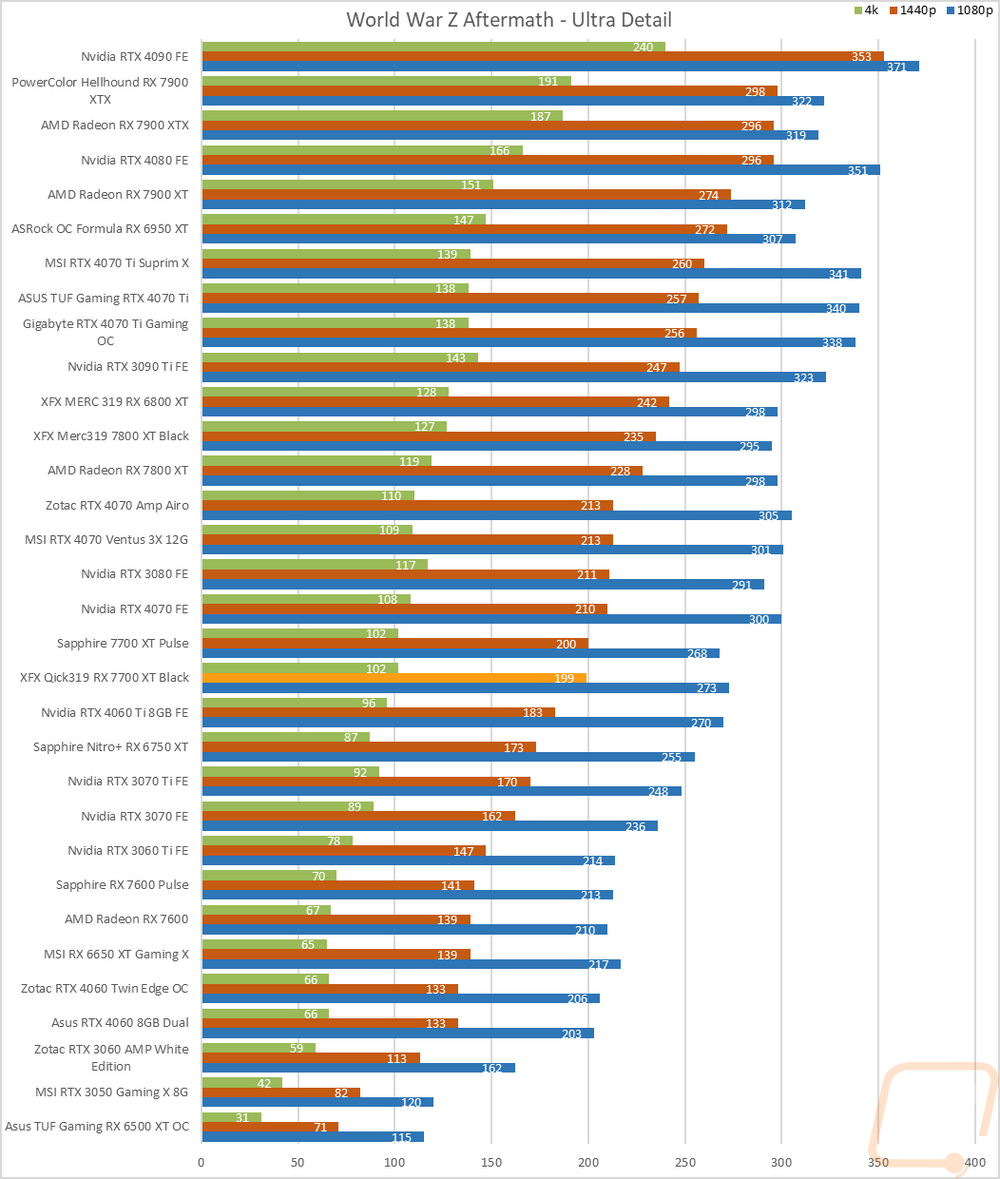
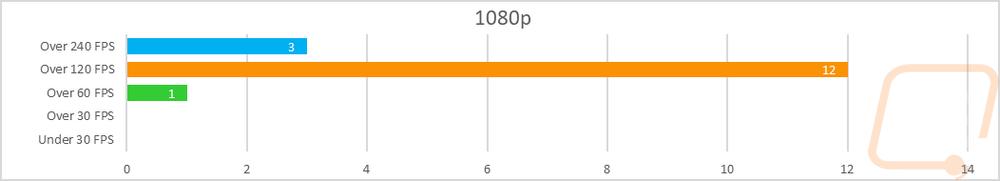
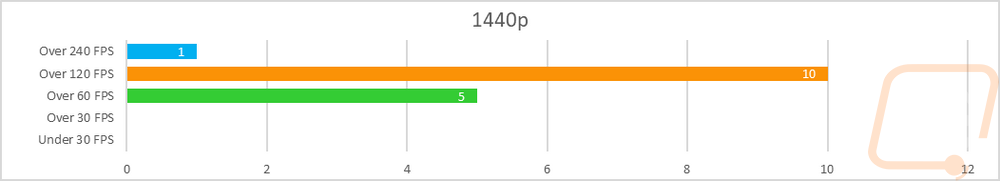
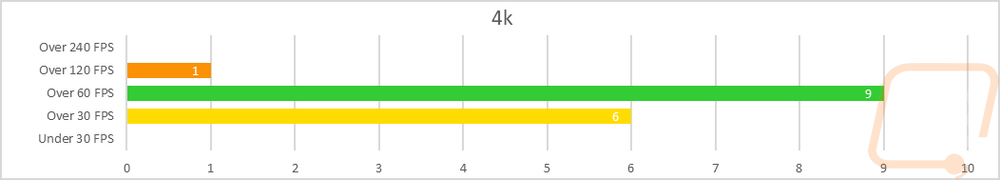
Now we finally get into the in game performance and that is the main reason people pick up a new video card. To test things out I ran through our new benchmark suite that tests 10 games at three different resolutions (1080p, 1440p, and 4k). Most of the games tested have been run at the highest detail setting and a mid-range detail setting to get a look at how turning things up hurts performance and to give an idea of if turning detail down from max will be beneficial for frame rates. In total, each video card is tested 48 times and that makes for a huge mess of results when you put them all together. To help with that I like to start with these overall playability graphs that take all of the results and give an easier-to-read result. I have one for each of the three resolutions and each is broken up into four FPS ranges. Under 30 FPS is considered unplayable, over 30 is playable but not ideal, over 60 is the sweet spot, and then over 120 FPS is for high refresh rate monitors.
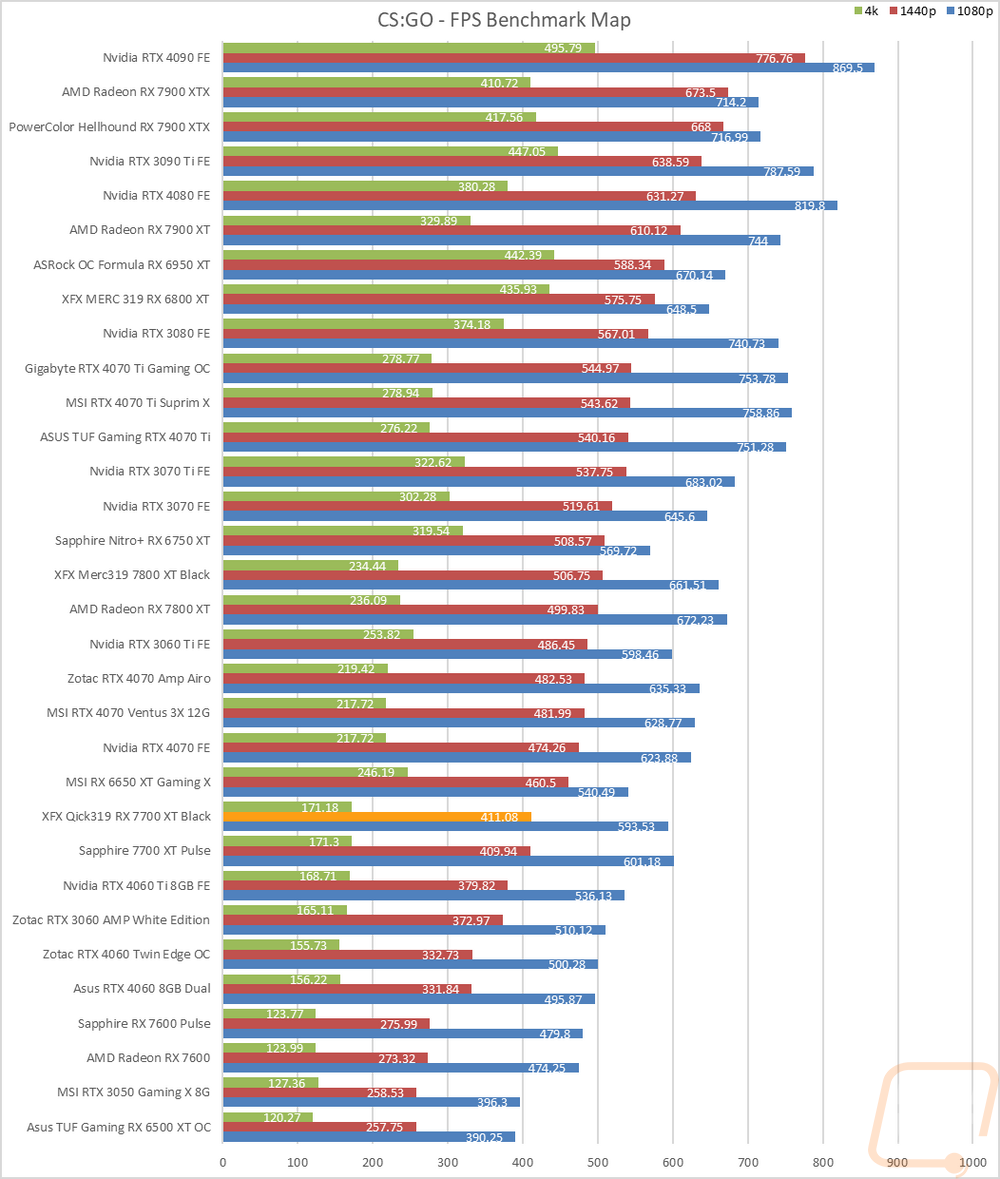
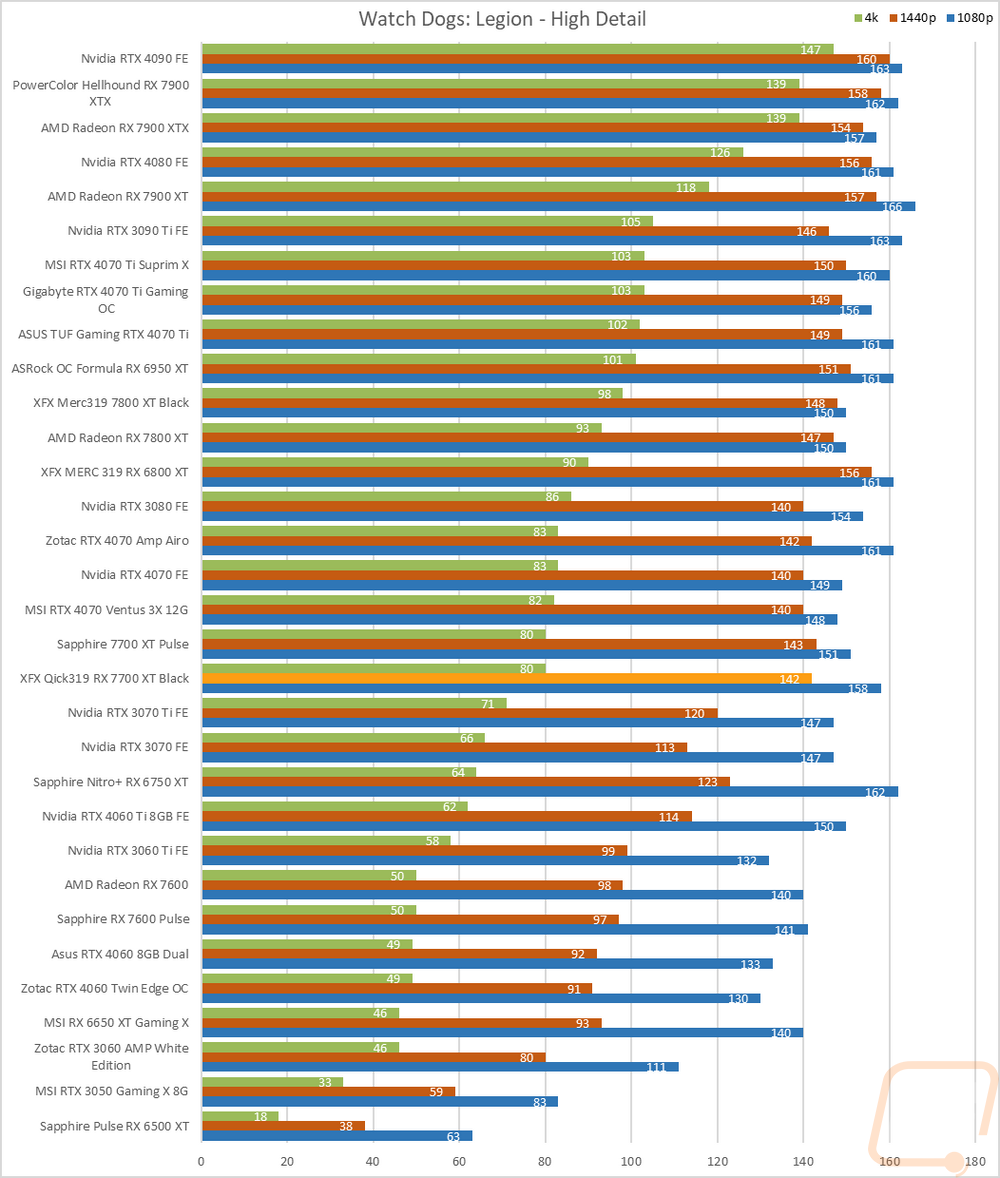
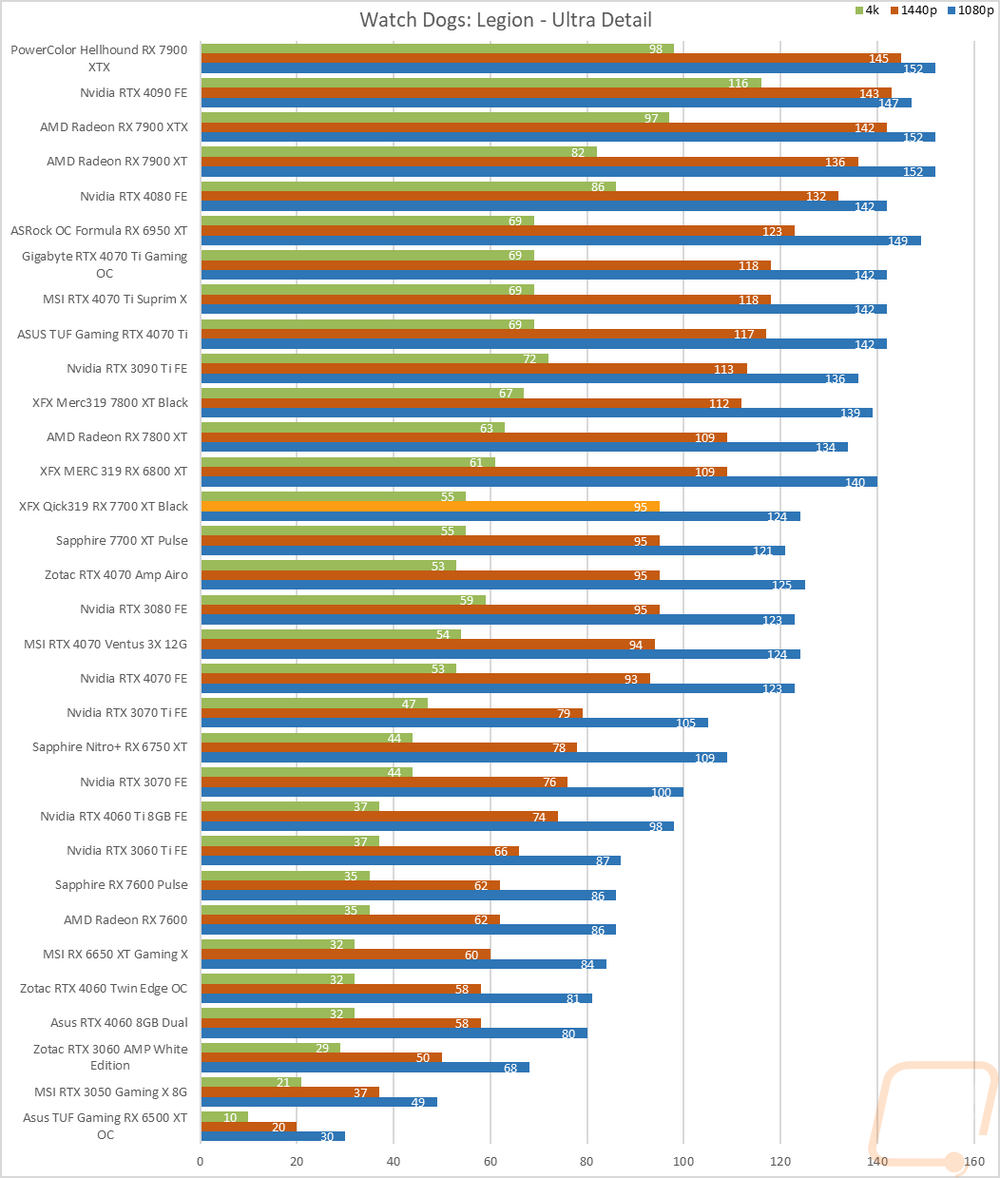
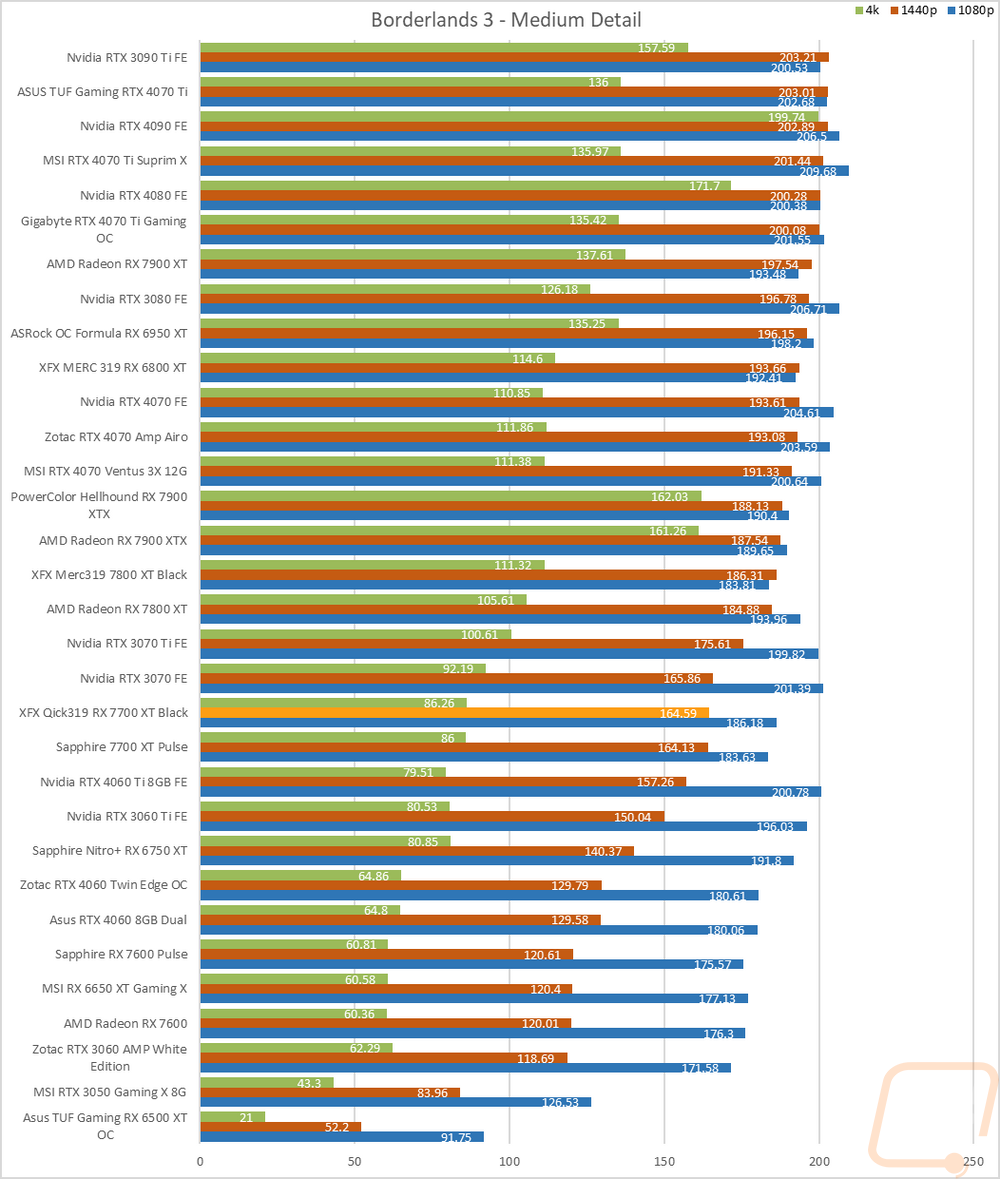
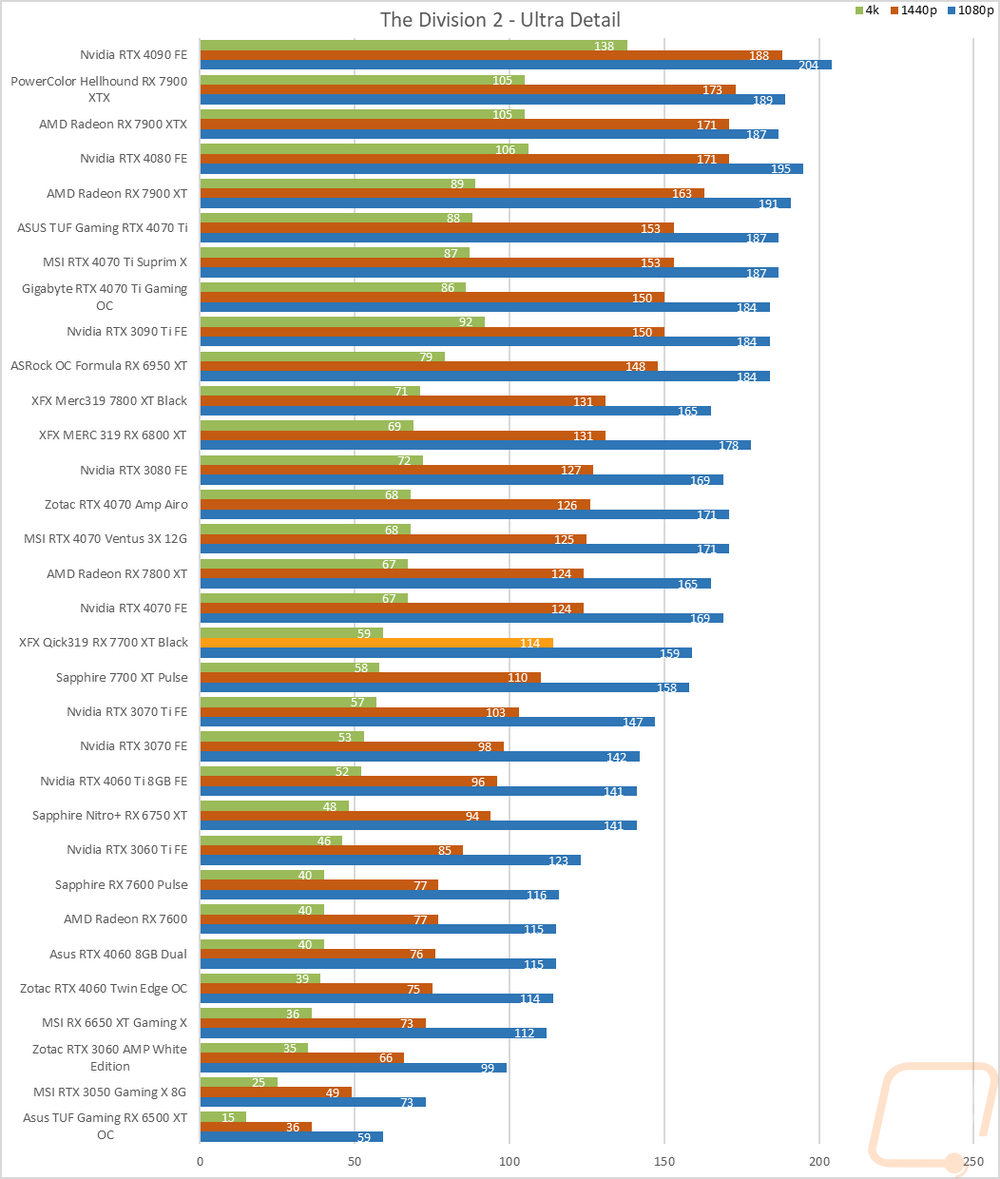
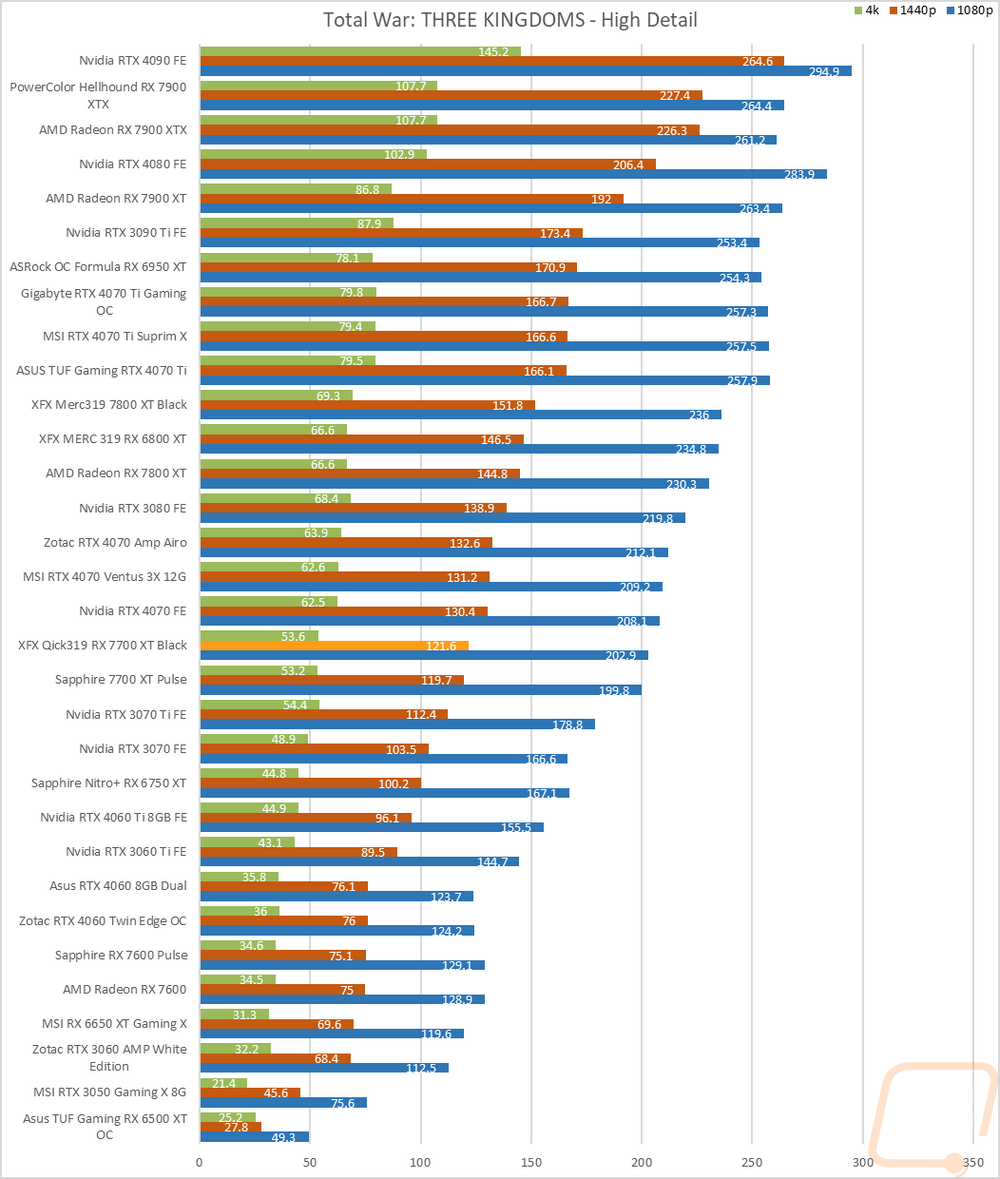
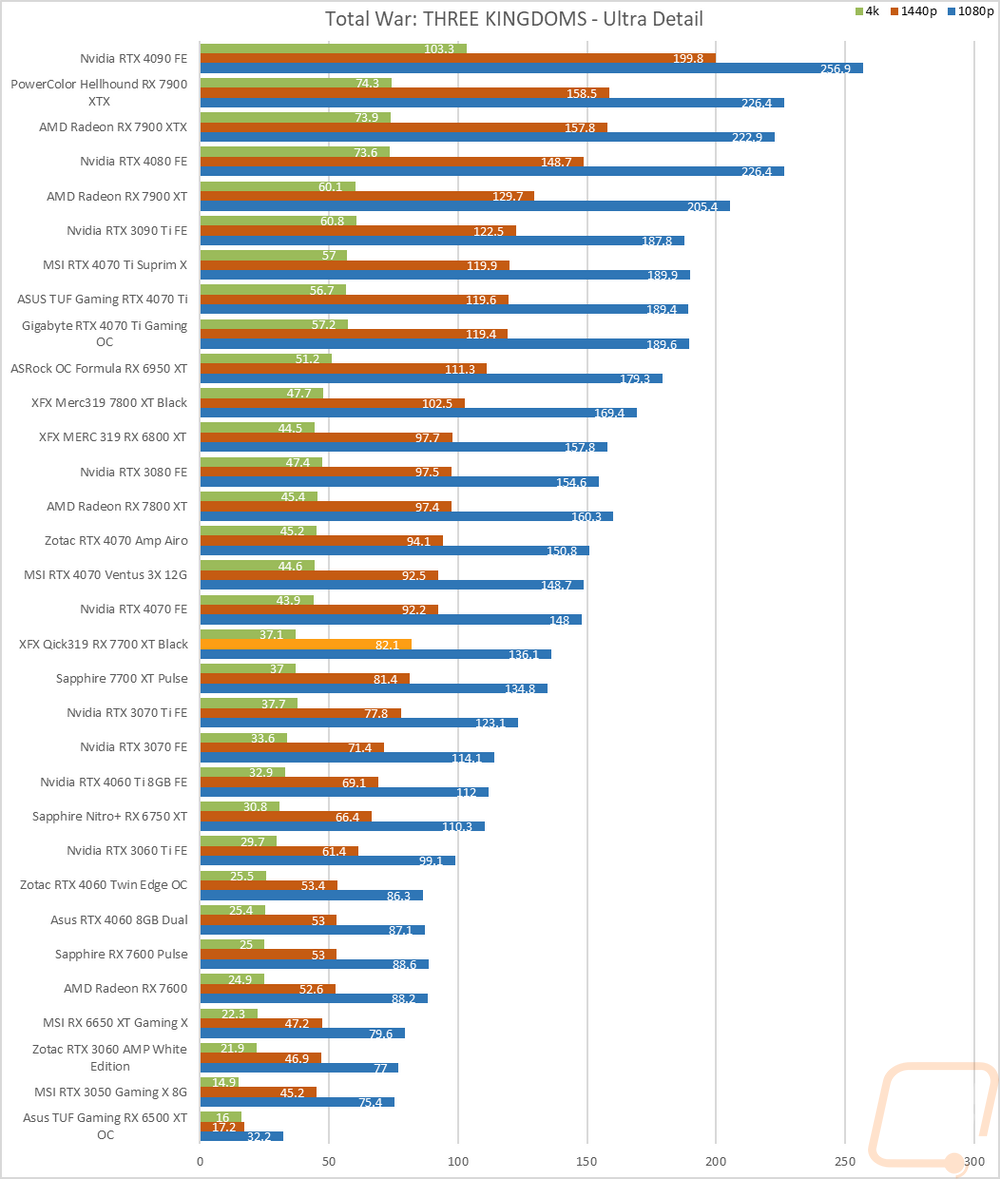
So how did the QICK 319 RX 7700 XT Black do? Well, first we should understand that AMD is targeting this card for 1440p, just like the 7800 XT. So my expectations for 4K performance were low but it does have 10 out of the 16 results sitting up over 60 FPS which isn’t bad at all. One of those is also up over 120 FPS, then there were 6 results in the 30-60 FPS range which is still playable but not ideal. At 1440p all of the results for the QICK 319 RX 7700 XT Black were over 60 FPS but at 11 a majority were over 120 FPS and one (CS:GO) was over 240 FPS as well. Then at 1080p, everything was once again up over 60 FPS, no surprise there but only one result was in the 60-119 FPS range with the rest up over 120 FPS, and 3 of those were even up over 240 FPS.
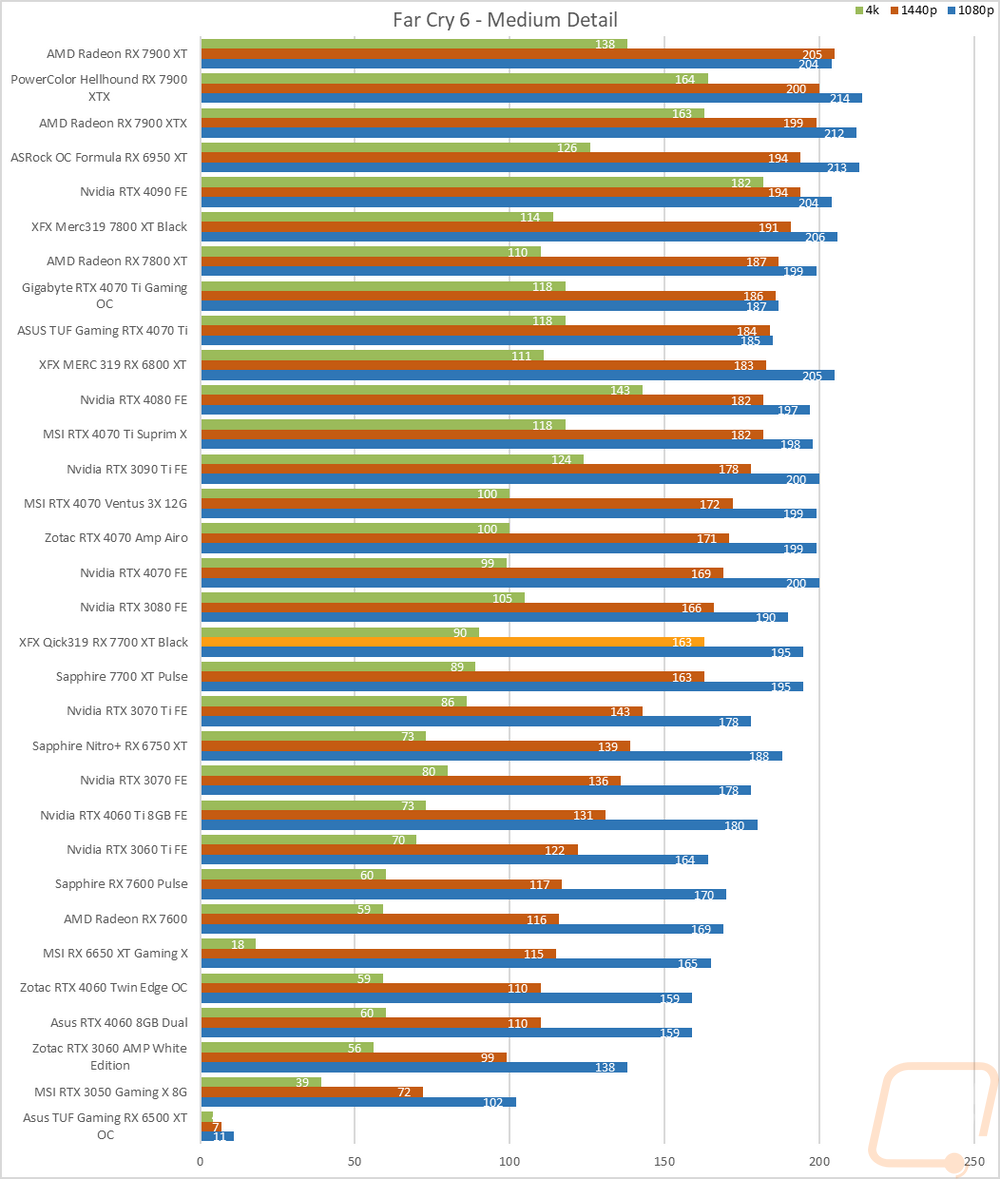
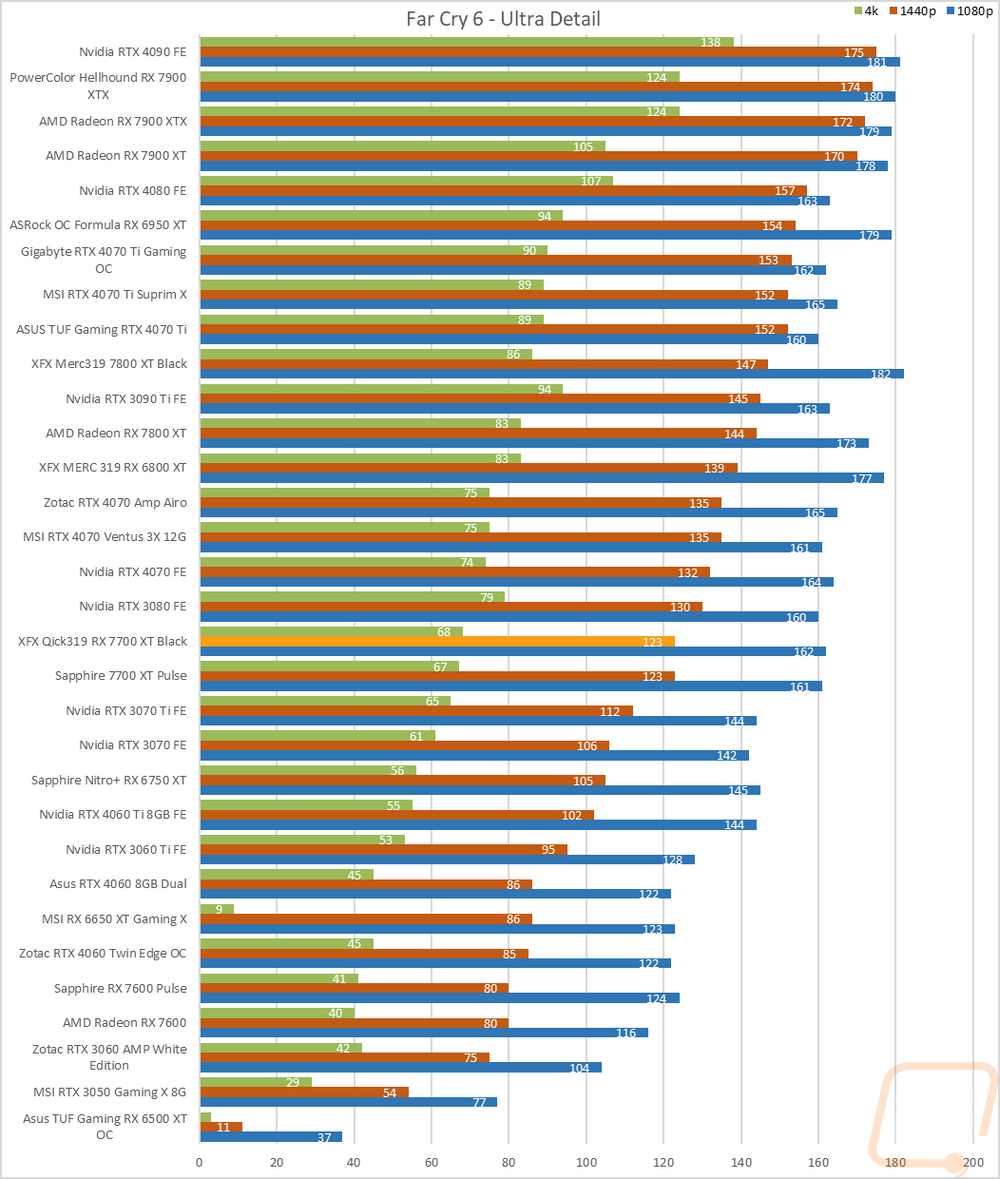
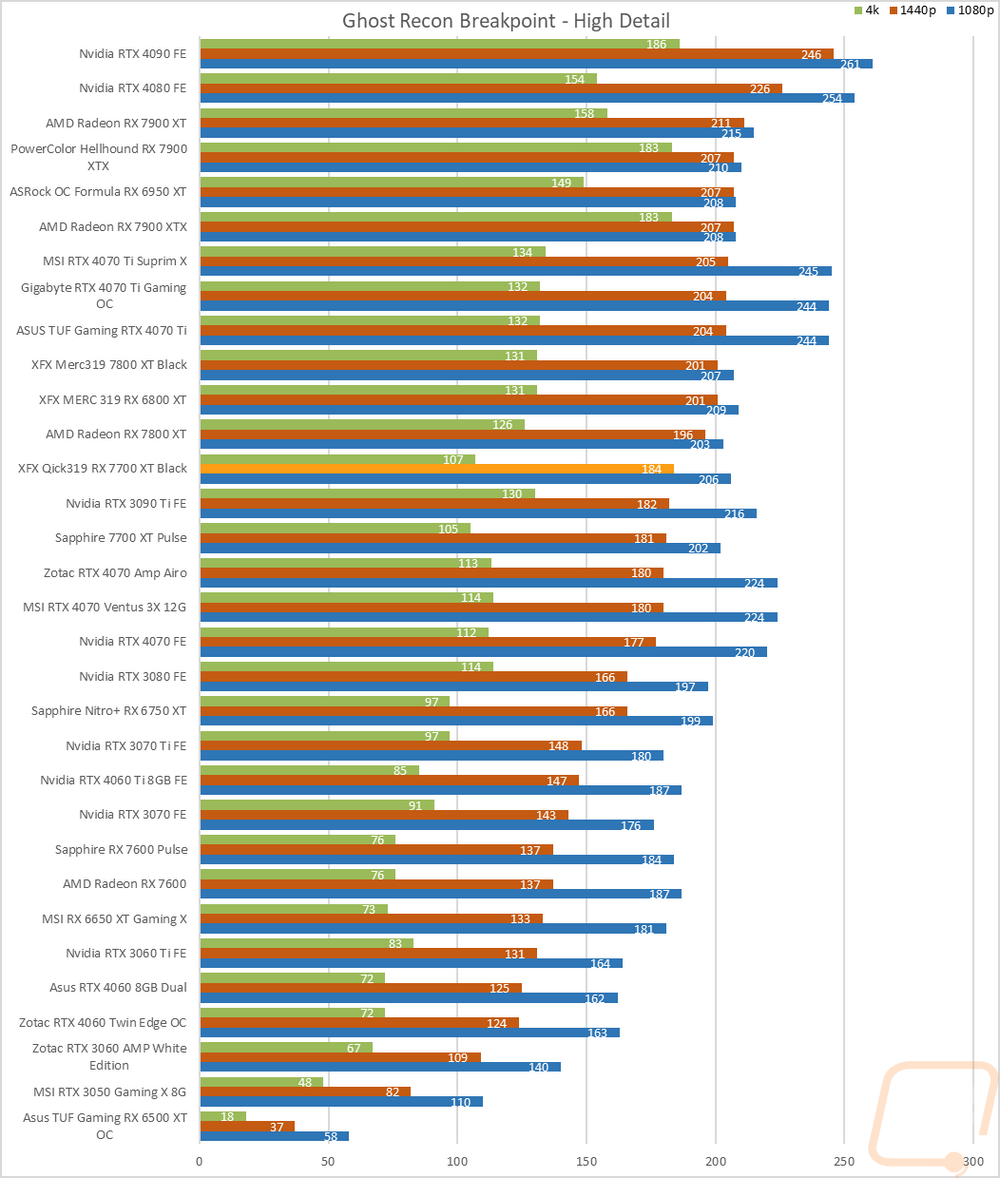
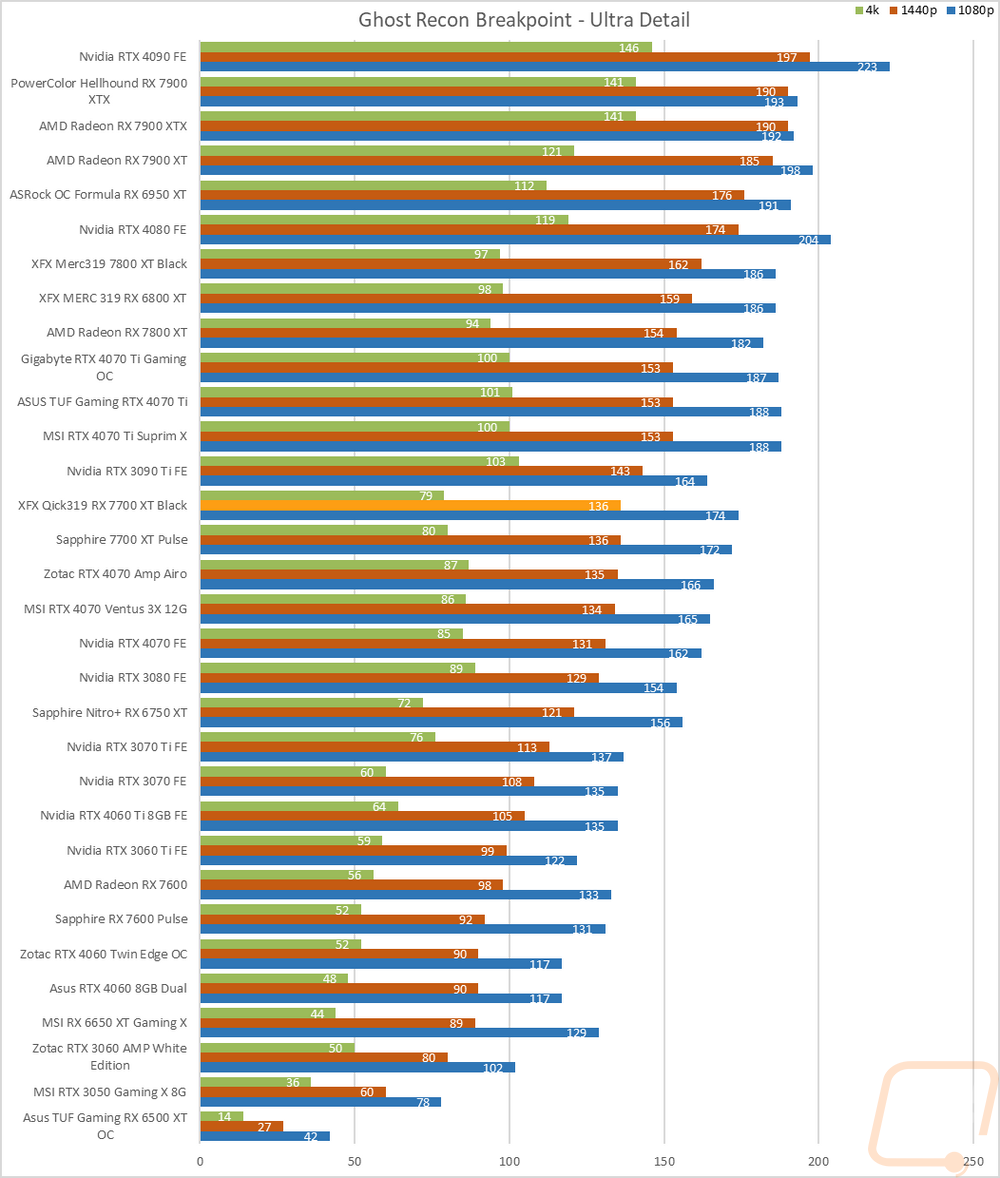
Of course, I have all of the actual in game results as well for anyone who wants to sort through the wall of graphs below. I have also put together a list of averaged results at all three resolutions across all of the cards in range of the QICK 319 RX 7700 XT Black to get a good look at everything. In our synthetic tests, the QICK 319 RX 7700 XT Black struggled to stand out from the Sapphire RX 7700 XT pulse but in game the overclock helped the QICK 319 RX 7700 XT Black pull out in front consistently at all three resolutions. It wasn’t a big gap but it was an extra FPS on average. That wasn’t enough to make any difference when compared to the next card up which was the RTX 4070. But with the numbers averaged out we can see how the QICK 319 RX 7700 XT Black stands way out in front of the 4060 Ti and it is even ahead of the 3070 Ti by 12 FPS at 1440p. That shrinks at 4k down to a gap of 3 FPS but it still did well. As for the main graphs, they repeat what you see except in Ghost Recon where you see both of the RX 7700 XT’s jump ahead of the RTX 4070.
|
|
1080p |
1440p |
4K |
|
XFX MERC 319 RX 6800 XT |
197.1 |
162.3 |
92.4 |
|
XFX Merc 319 RX 7800 XT Black |
194.0 |
161.0 |
93.3 |
|
Radeon RX 7800 XT |
190.7 |
156.3 |
89.3 |
|
Nvidia RTX 4070 FE |
190.6 |
147.6 |
83.5 |
|
XFX QICK 319 RX 7700 XT Black |
179.9 |
138.2 |
75.2 |
|
Sapphire RX 7700 XT Pulse |
178.1 |
137.5 |
74.7 |
|
Nvidia RTX 3070 Ti FE |
165.8 |
125.7 |
72.9 |
|
Sapphire Nitro+ RX 6750 XT |
165.2 |
119.4 |
64.5 |
|
Nvidia RTX 3070 FE |
160.9 |
118.8 |
67.2 |
|
Nvidia RTX 4060 Ti 8GB FE |
160.1 |
115.3 |
62.0 |
|
Zotac RTX 4060 Twin Edge OC |
135.7 |
94.5 |
50.1 |