Synthetic Benchmarks
As always I like to start my testing with a few synthetic benchmarks. 3DMark especially is one of my favorites because it is very optimized in both Nvidia and AMD drivers. It's nice to not have to worry about it being favored too much either way and the repeatability of the results makes it a nice chance to compare from card to card, especially when comparing with the same GPU. With the two other reviews, we already have a good idea of where the 7700 XT lands. What I’m most interested in this time around is seeing how the RX 7700 XT PURE compares to the RX 7700 XT Pulse and the XFX QICK 319 RX 7700 XT Black. The RX 7700 XT Pulse has AMDs stock clocks and the XFX and the RX 7700 XT PURE both are overclocked with the XFX having an edge with 15 MHz more on the boost clock and 50 MHz on the game clock. But we saw last time that a lot of our tests the overclock didn’t make much of a difference, I’m curious if that will be the same with the PURE this time around.
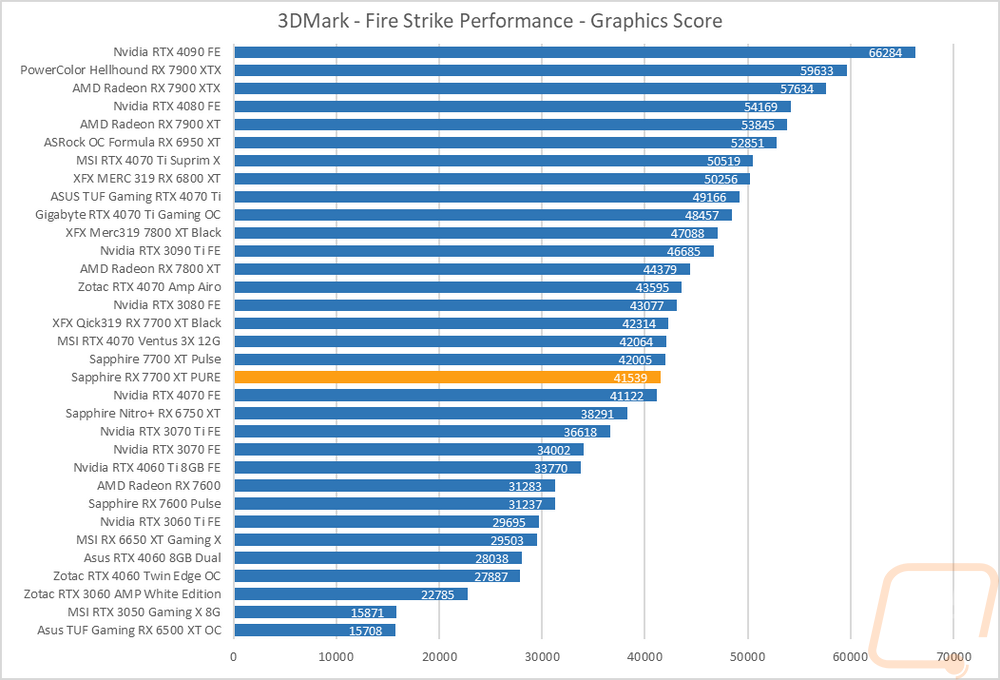
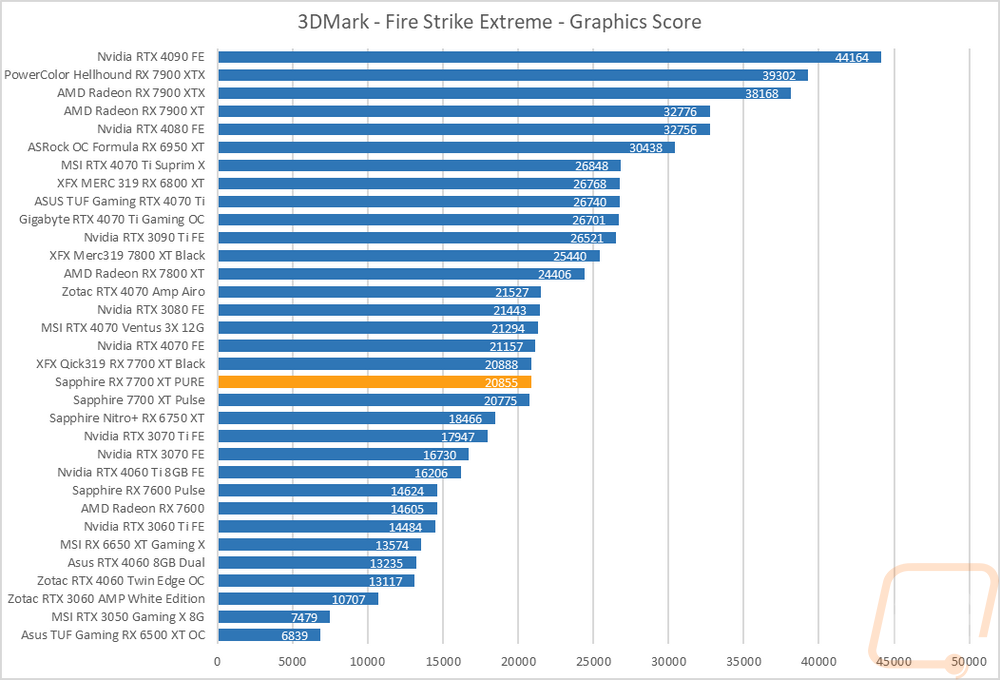
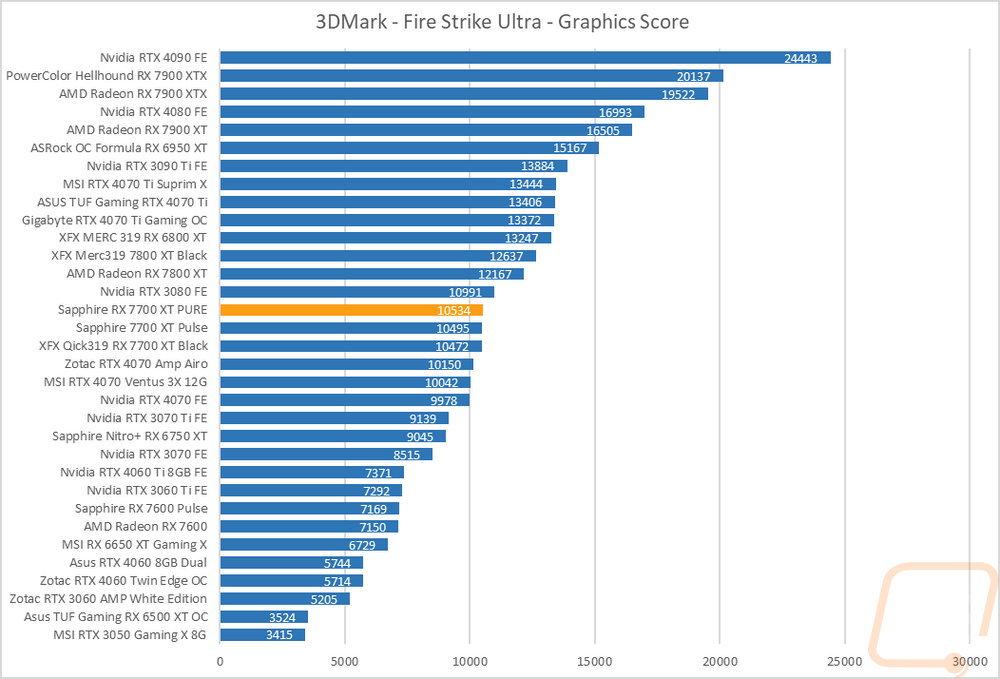
The first round of tests were done in the older Fire Strike benchmark which is a DX11 test. There are three detail levels, performance, extreme, and ultra. The RX 7700 XT PURE scored a 41539 in the base Fire Strike benchmark putting it behind both the Pulse and the QICK. In Fire Strike Extreme it moved back up in between the two cards then with Fire Strike Ultra it was out in front of them both.
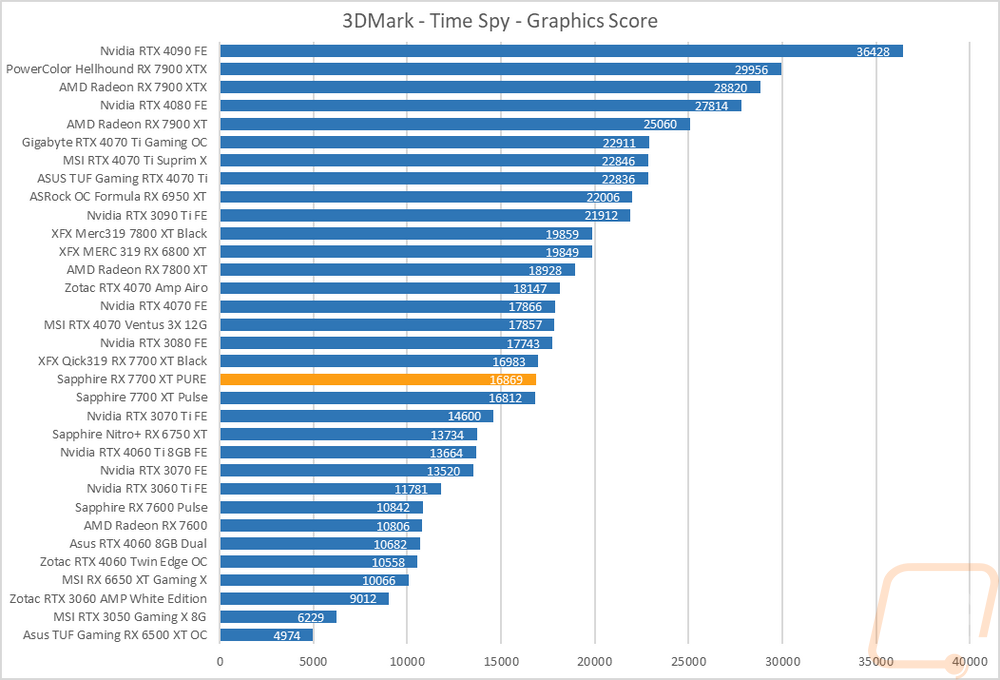
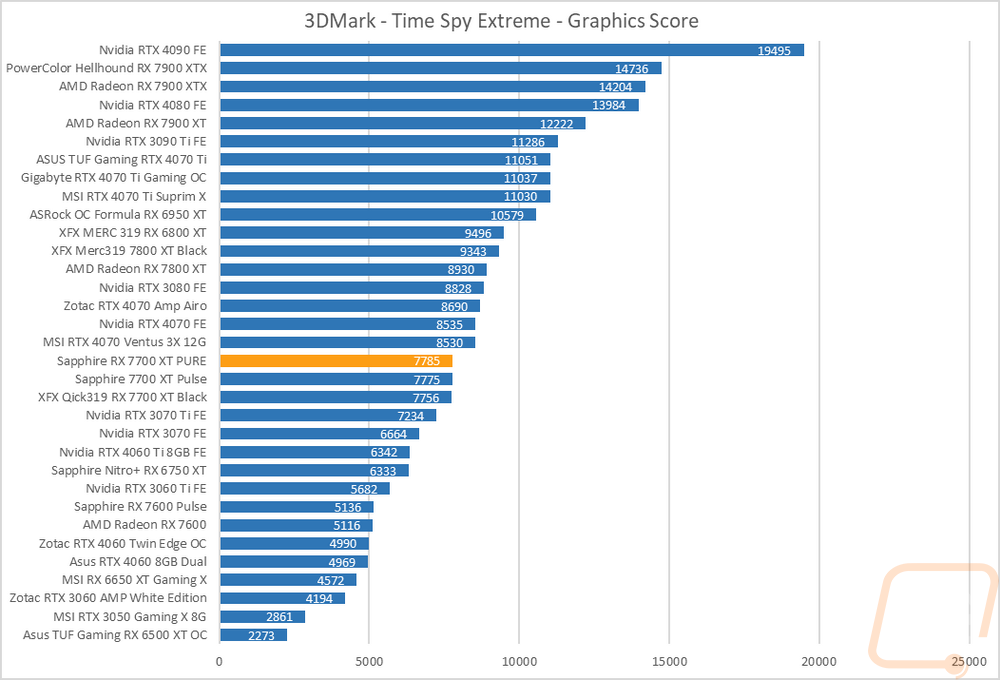
The next two were both based on the Time Spy benchmark. One is the standard test and then there is the extreme detail level. Time Spy is a DX12 benchmark and is a better representation of the current generation of games. The RX 7700 XT PURE scored a 16869 for the base Time Spy benchmark putting it ahead of the Pulse but behind the QICK, right where you would expect it to be. In Time Spy Extreme, however, it was out in front of both cards just slightly. That wasn’t enough to get any closer to the RTX 4070 but like with the other 7700 XT that put it in front of the RTX 3070 Ti and way out in front of the 4060 Ti.
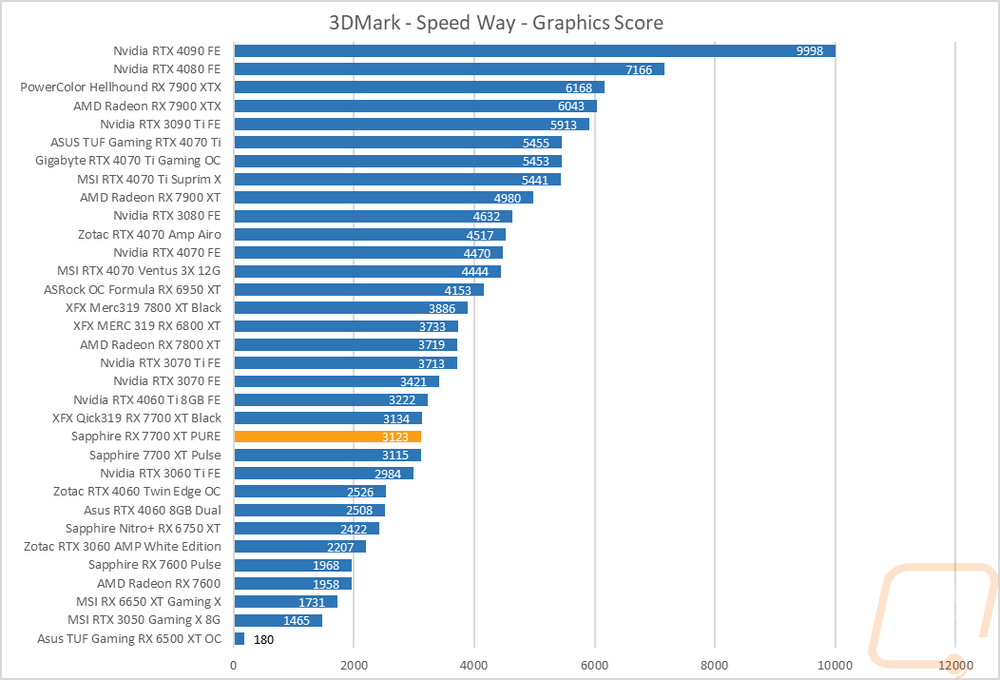
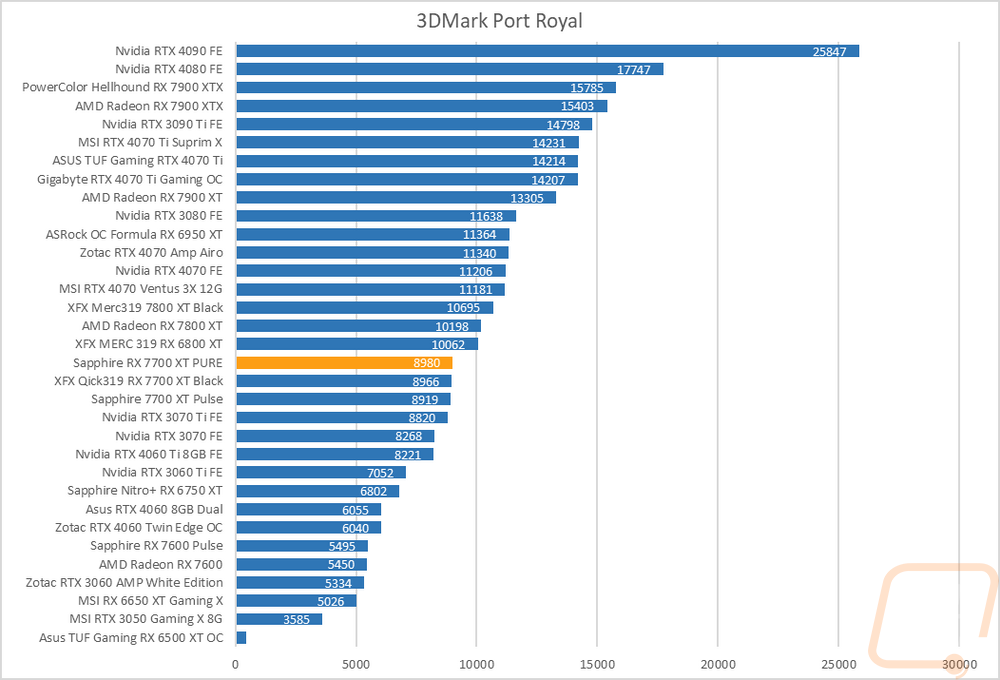
For ray tracing performance, I ran both the 3DMark Port Royal test which is ray tracing focused as well as the new 3DMark Speed Way test which tests all future-looking features including ray tracing. In Speed Way, the RX 7700 XT PURE is right in the middle of the two RX 7700 XTs once again. All three cards were down below the RTX 4060 Ti here. In Port Royal, the RX 7700 XT PURE is in front of the other RX 7700 XT by 14 points. When we compare that with Time Spy performance you can see that AMD is still playing catch up with ray tracing.
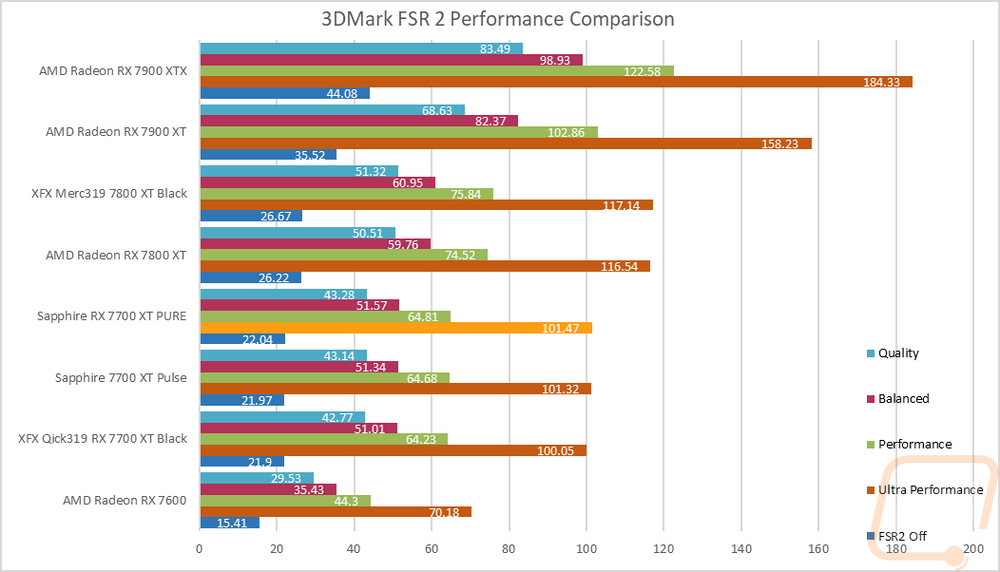
I did also run 3Dmark’s FSR 2 tests across all four of the detail levels. This wasn’t to compare card to card but to check out what kind of performance improvements you can see when using AMDs AI-based processing to lighten the load. The RX 7700 XT PURE went from 22.04 FPS without FSR 2 up to 43.28 FPS when using the highest detail setting. Balanced took it up to 51.57 FPS which is good but with the performance setting it surpassed 60 FPS for 64.81 FPS. Then with Ultra-Performance, it was up to 101.47 FPS.
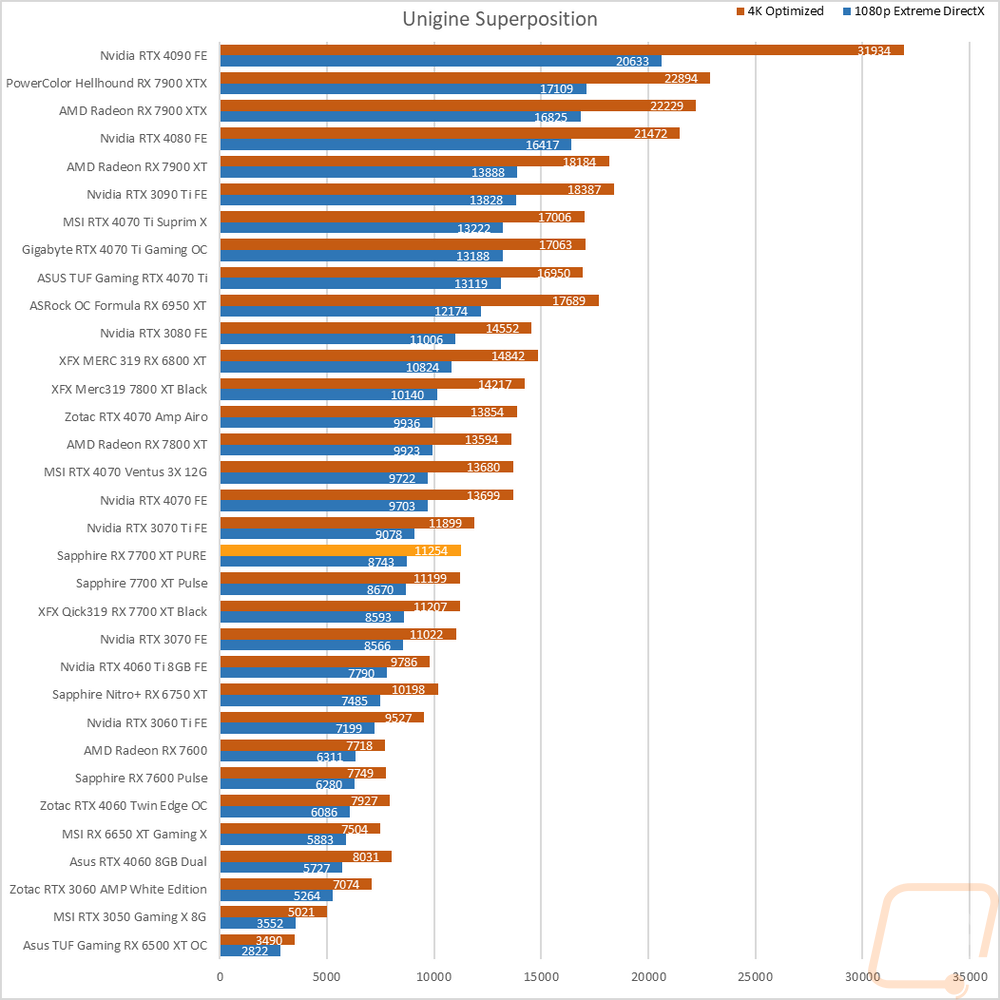
The last test was using the Unigine-based Superposition benchmark and I tested at 1080p with the extreme detail setting as well as the 4K optimized setting. In the extreme detail setting the RX 7700 XT PURE topped the three RX 7700 XT in both tests. It wasn’t enough to catch up to the RTX 370 Ti here though but was still in front of the RTX 4060 Ti 8GB.