In-Game Benchmarks
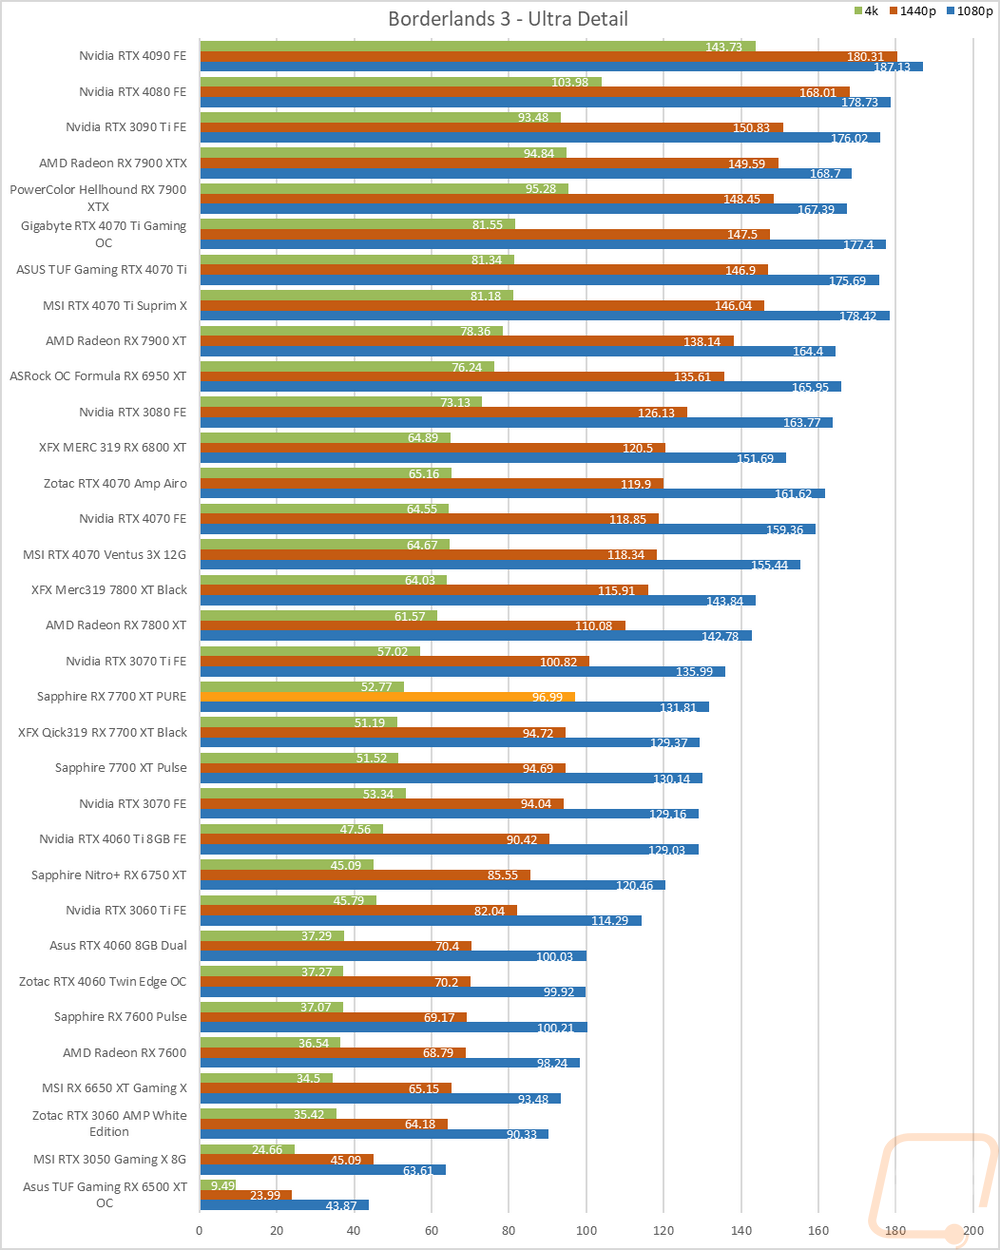
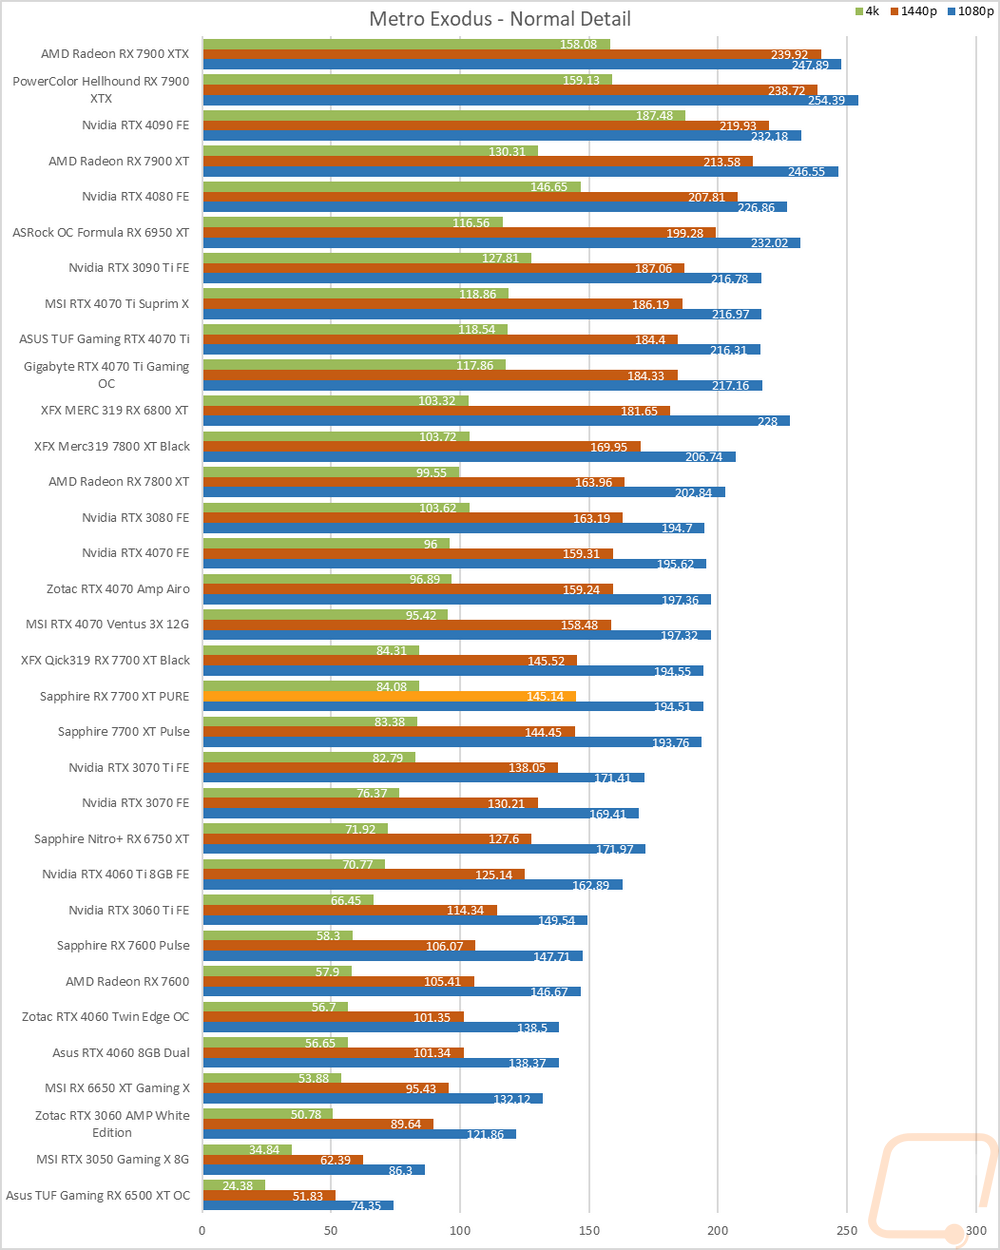
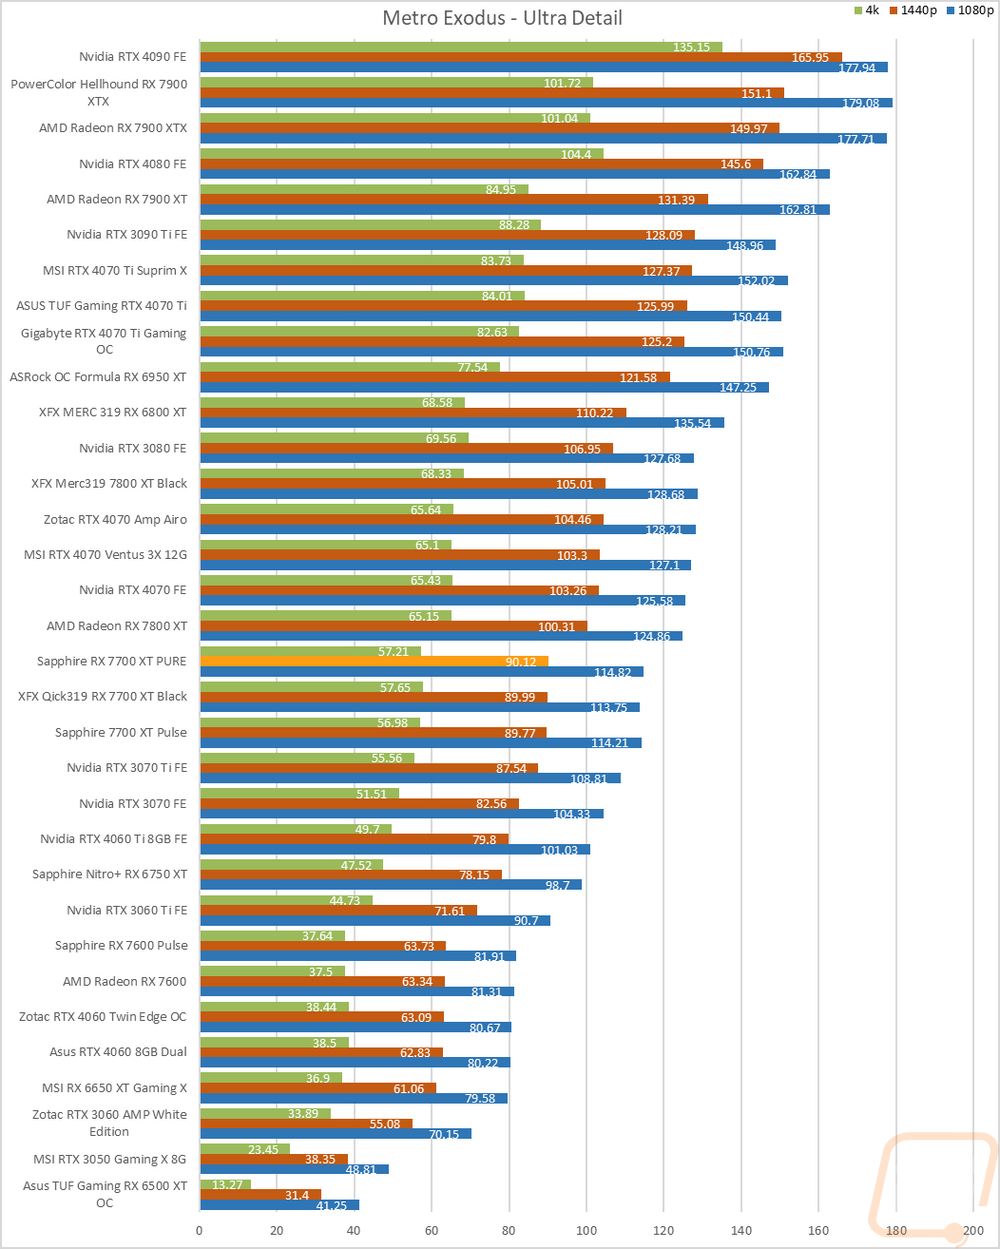
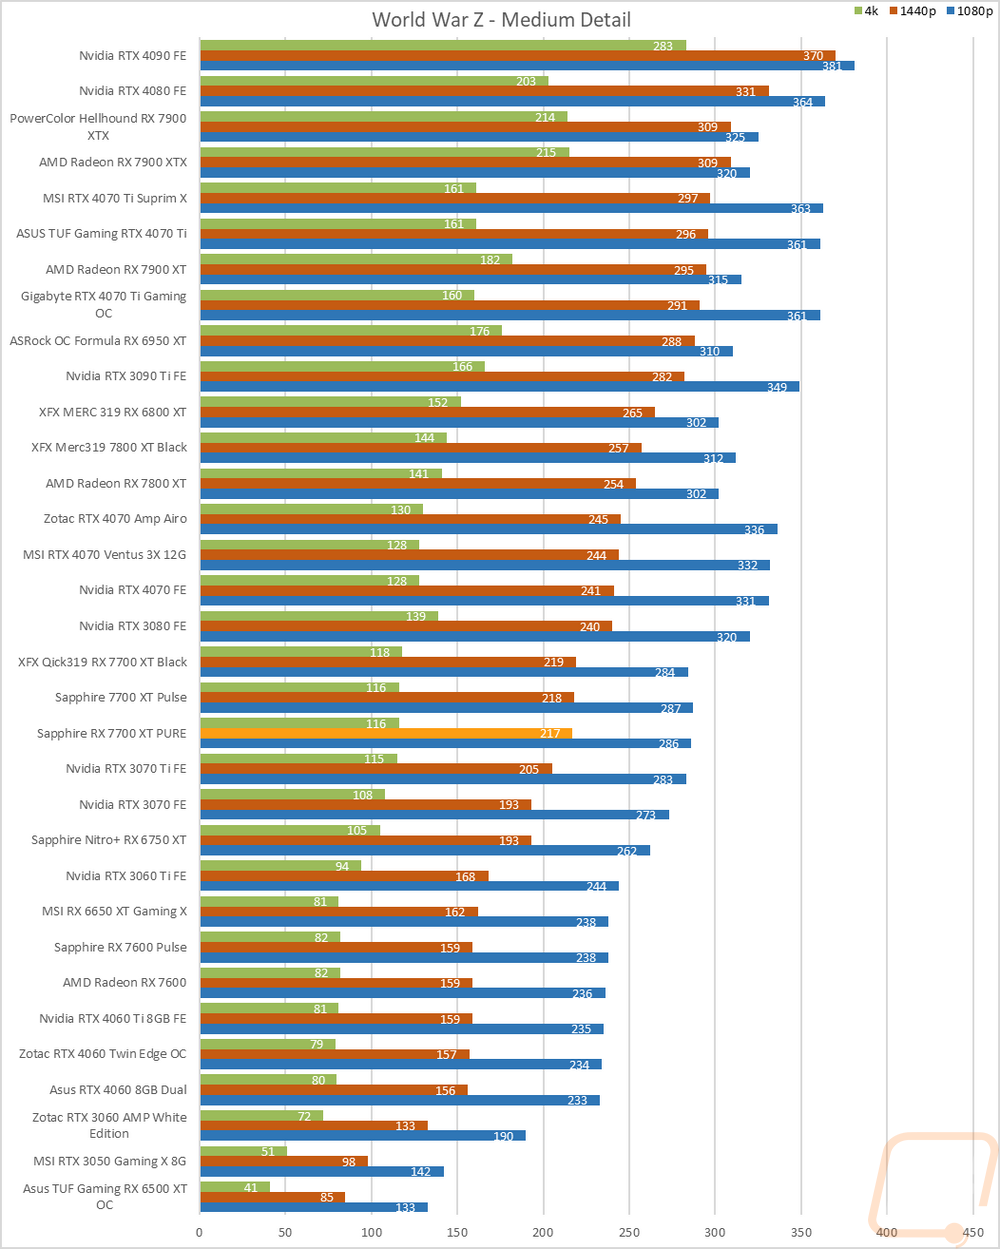
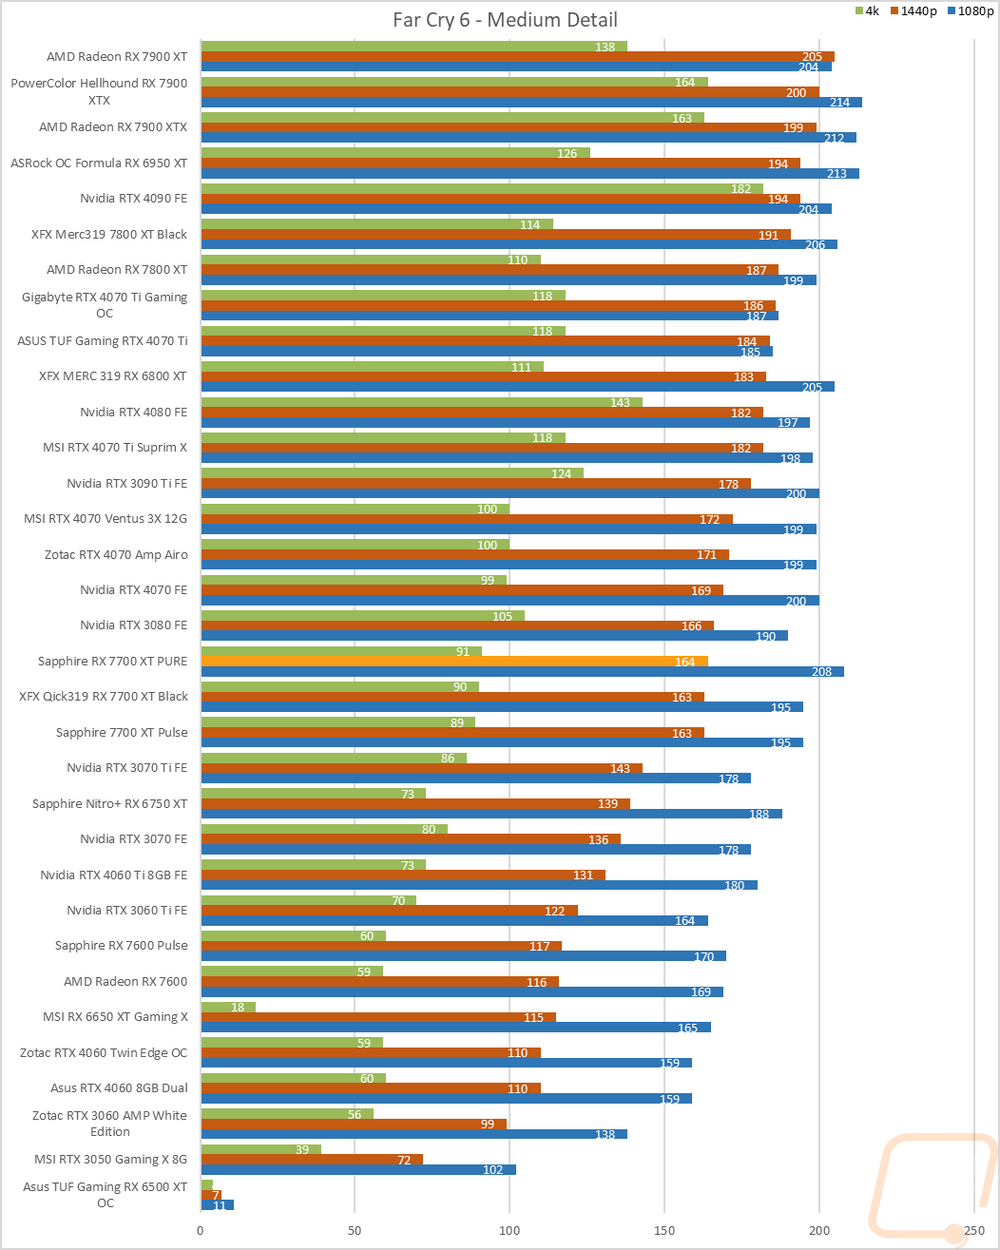
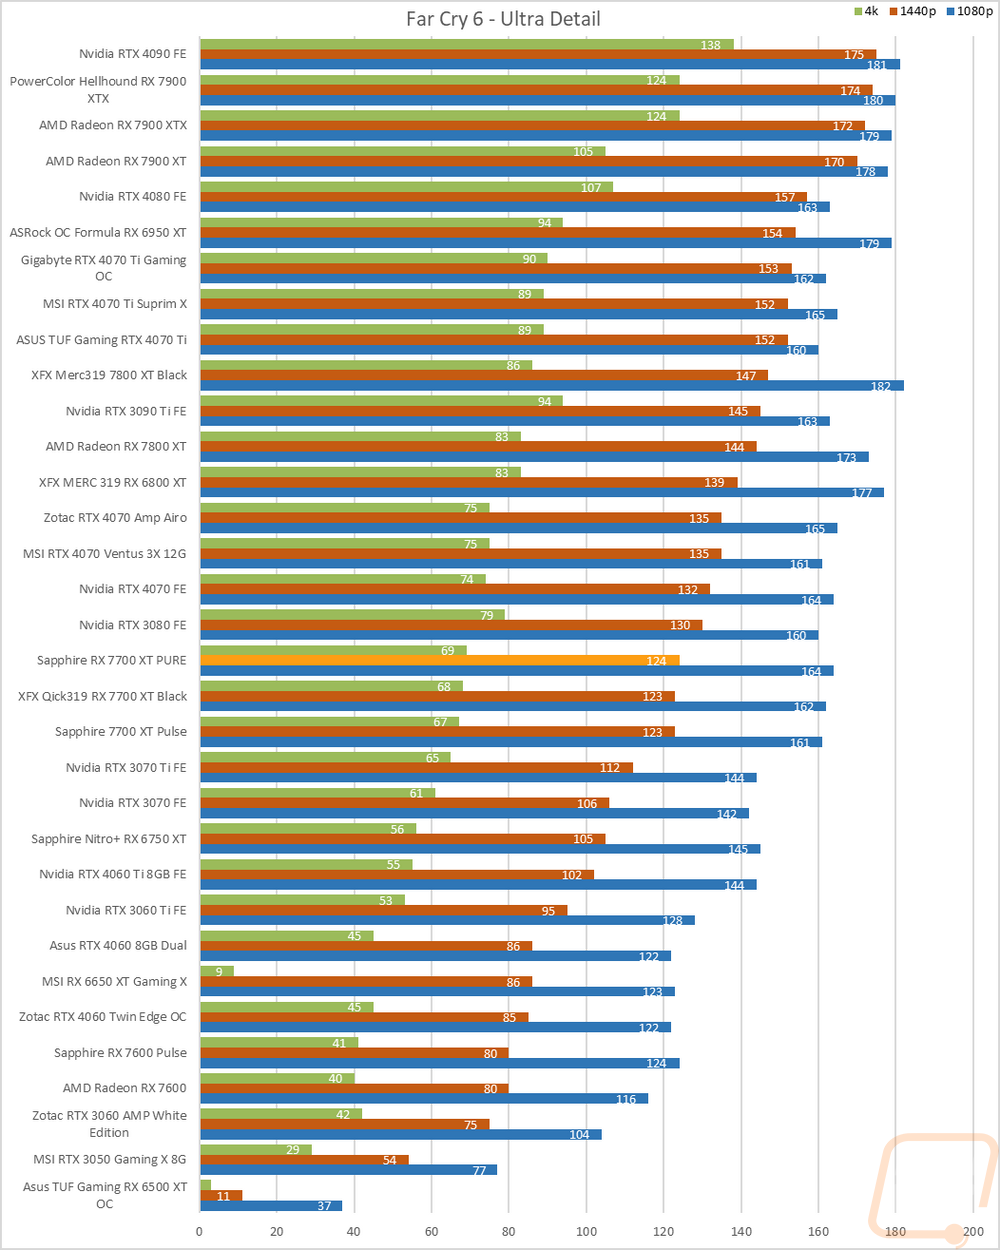
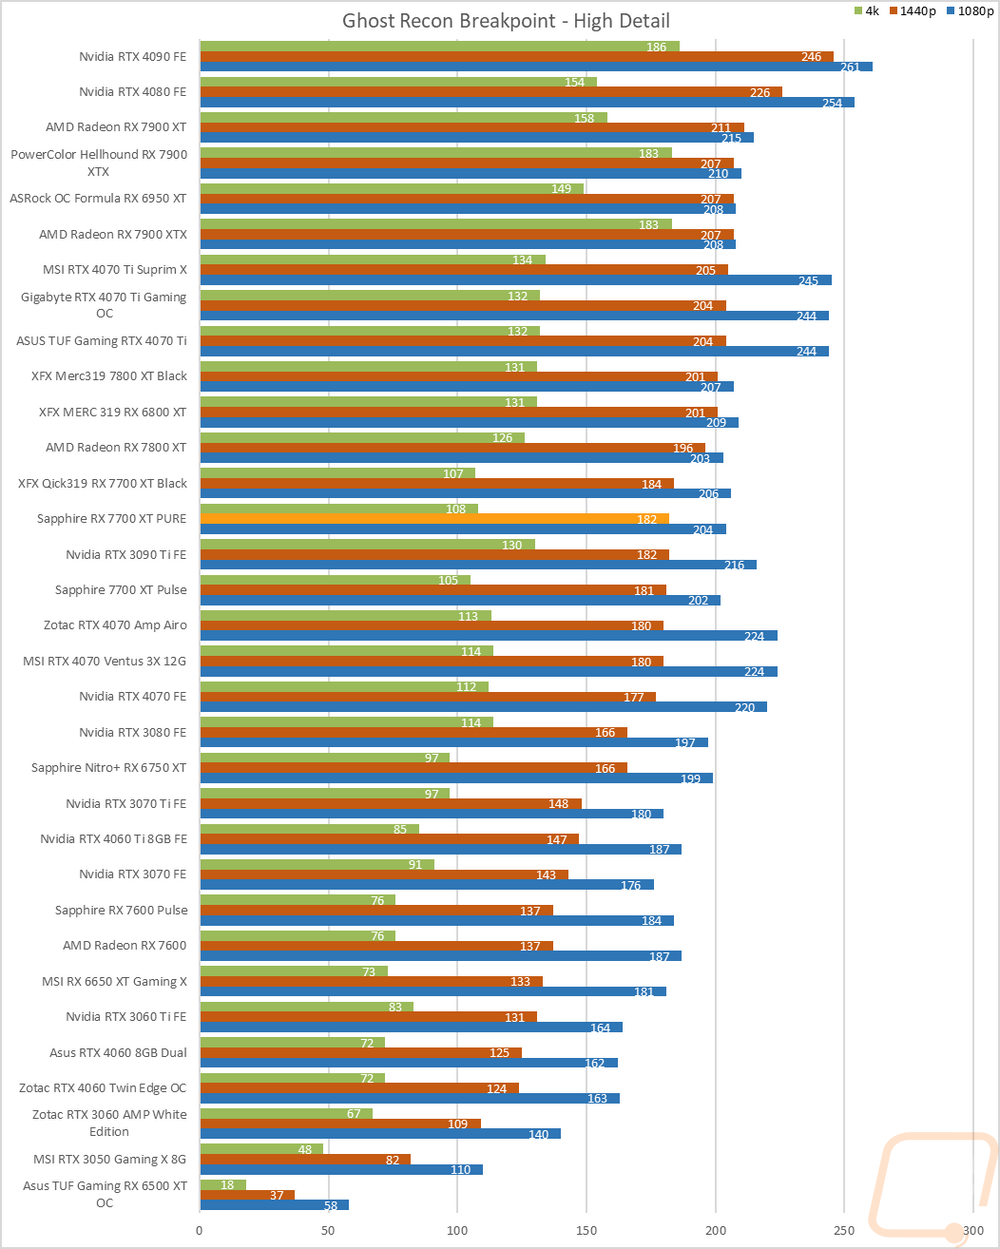
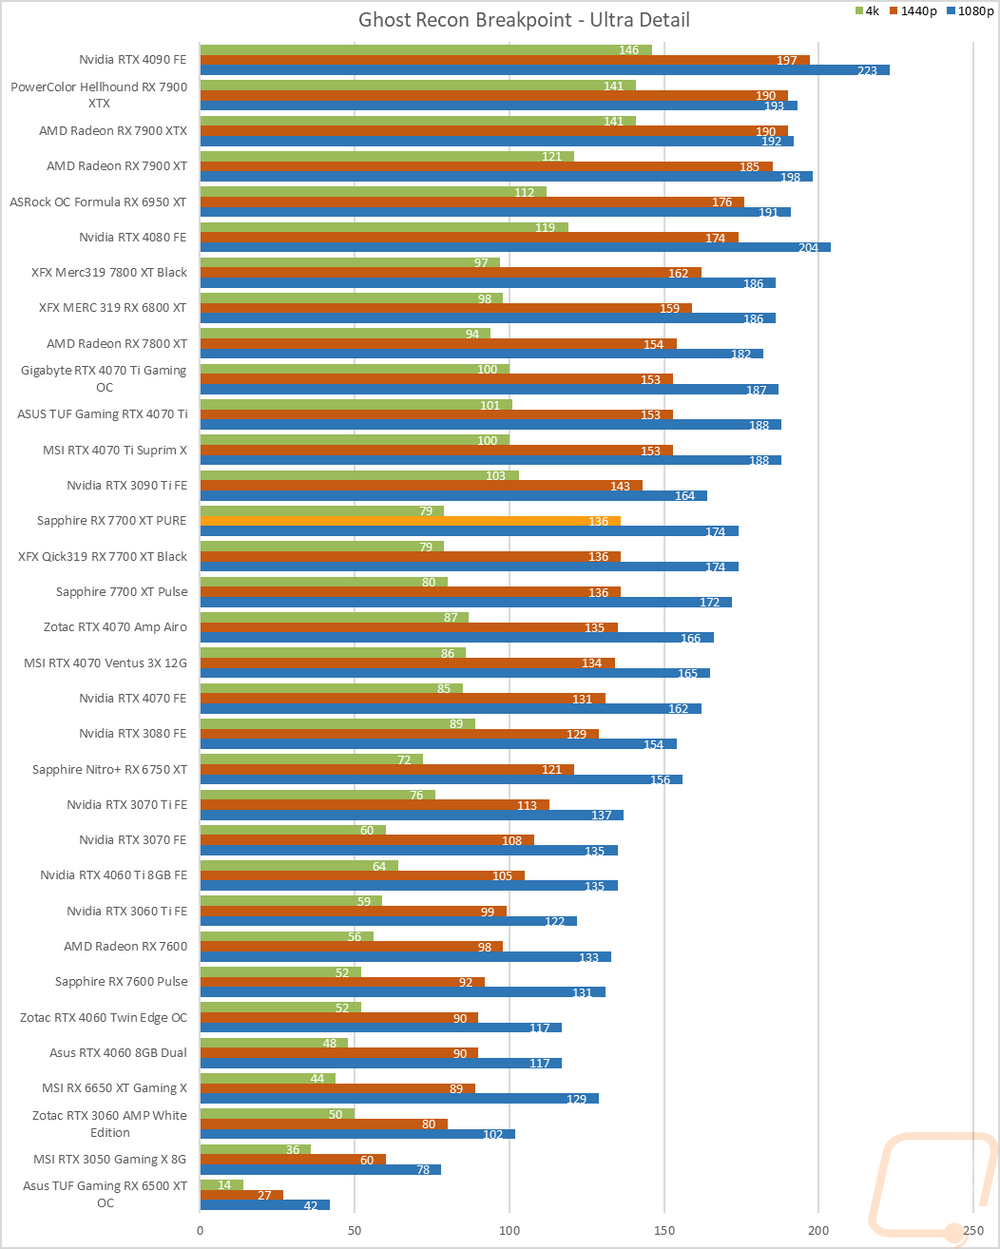
Now we finally get into the in game performance and that is the main reason people pick up a new video card. To test things out I ran through our new benchmark suite that tests 10 games at three different resolutions (1080p, 1440p, and 4k). Most of the games tested have been run at the highest detail setting and a mid-range detail setting to get a look at how turning things up hurts performance and to give an idea of if turning detail down from max will be beneficial for frame rates. In total, each video card is tested 48 times and that makes for a huge mess of results when you put them all together. To help with that I like to start with these overall playability graphs that take all of the results and give an easier-to-read result. I have one for each of the three resolutions and each is broken up into four FPS ranges. Under 30 FPS is considered unplayable, over 30 is playable but not ideal, over 60 is the sweet spot, and then over 120 FPS is for high refresh rate monitors.
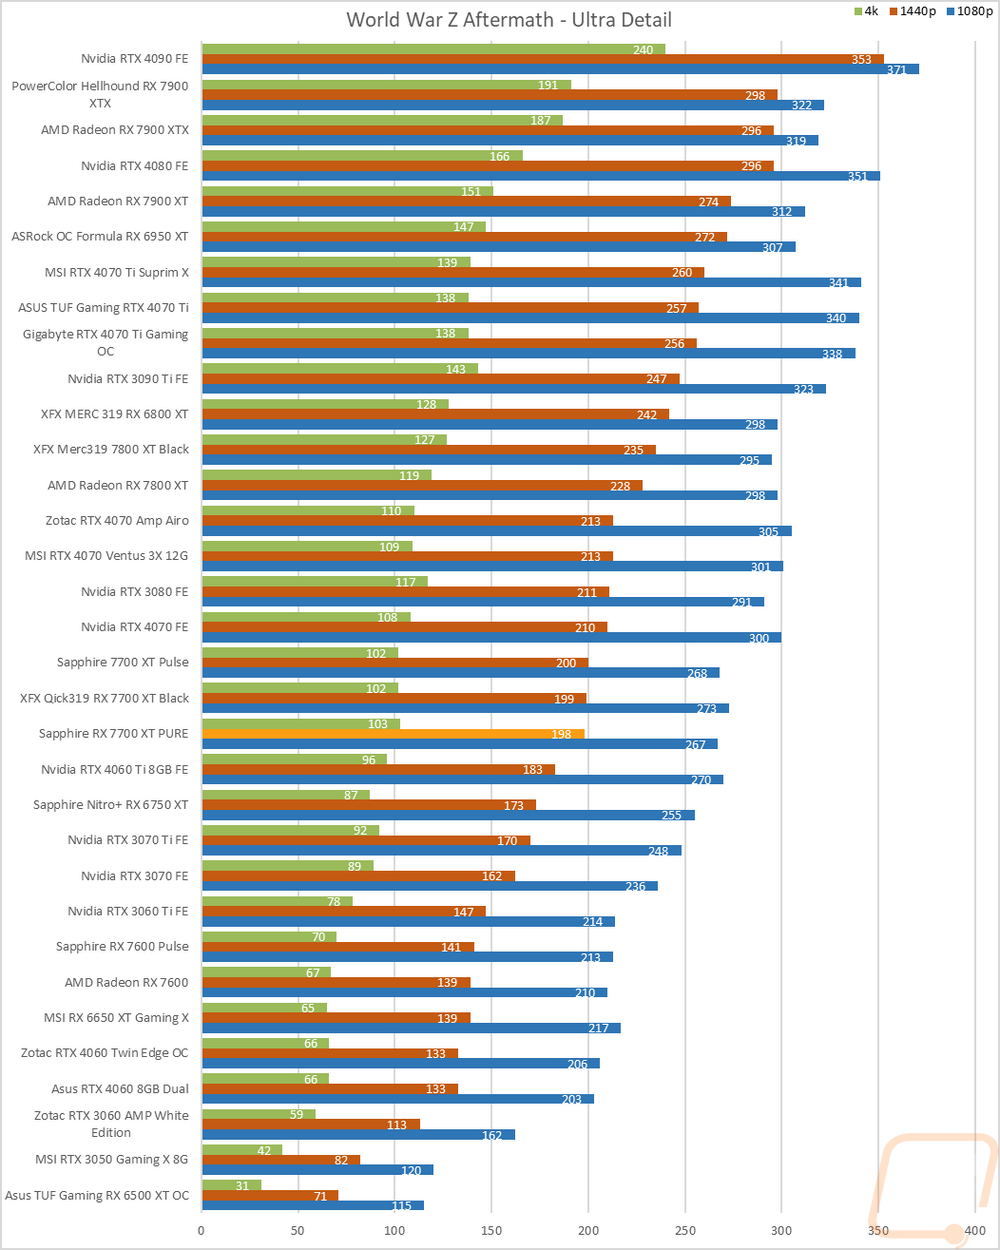
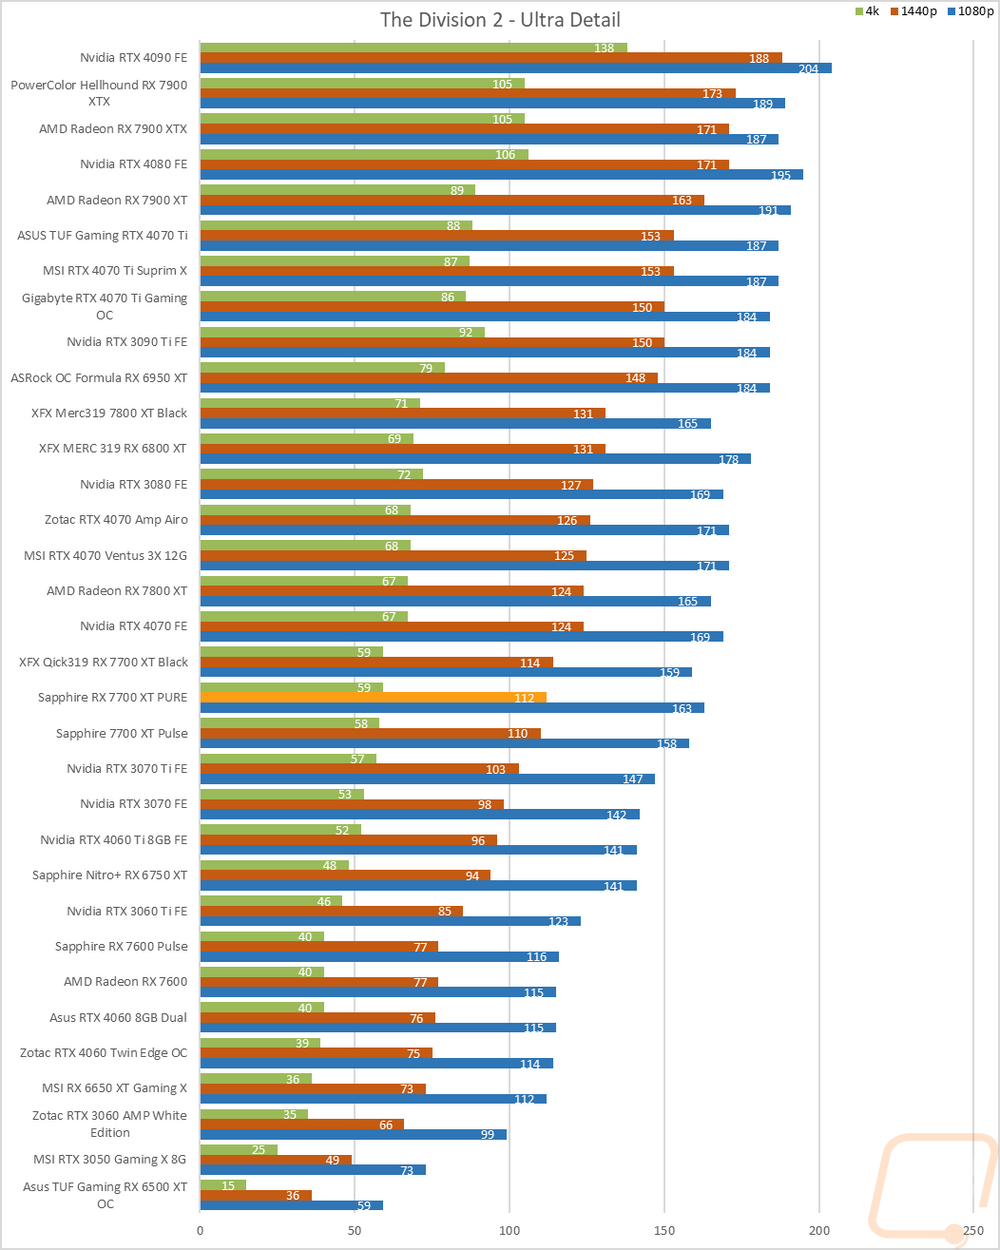
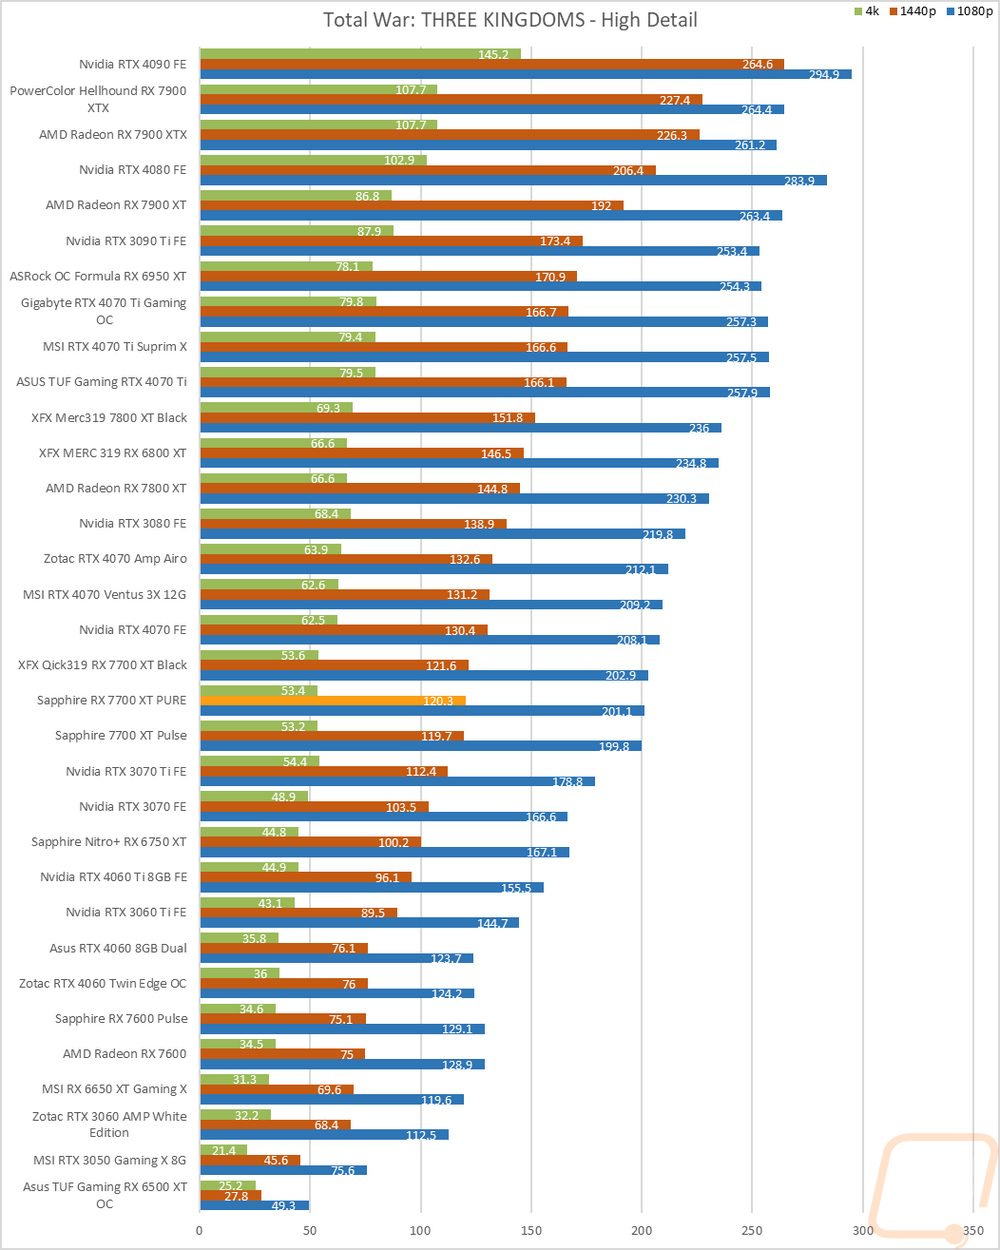
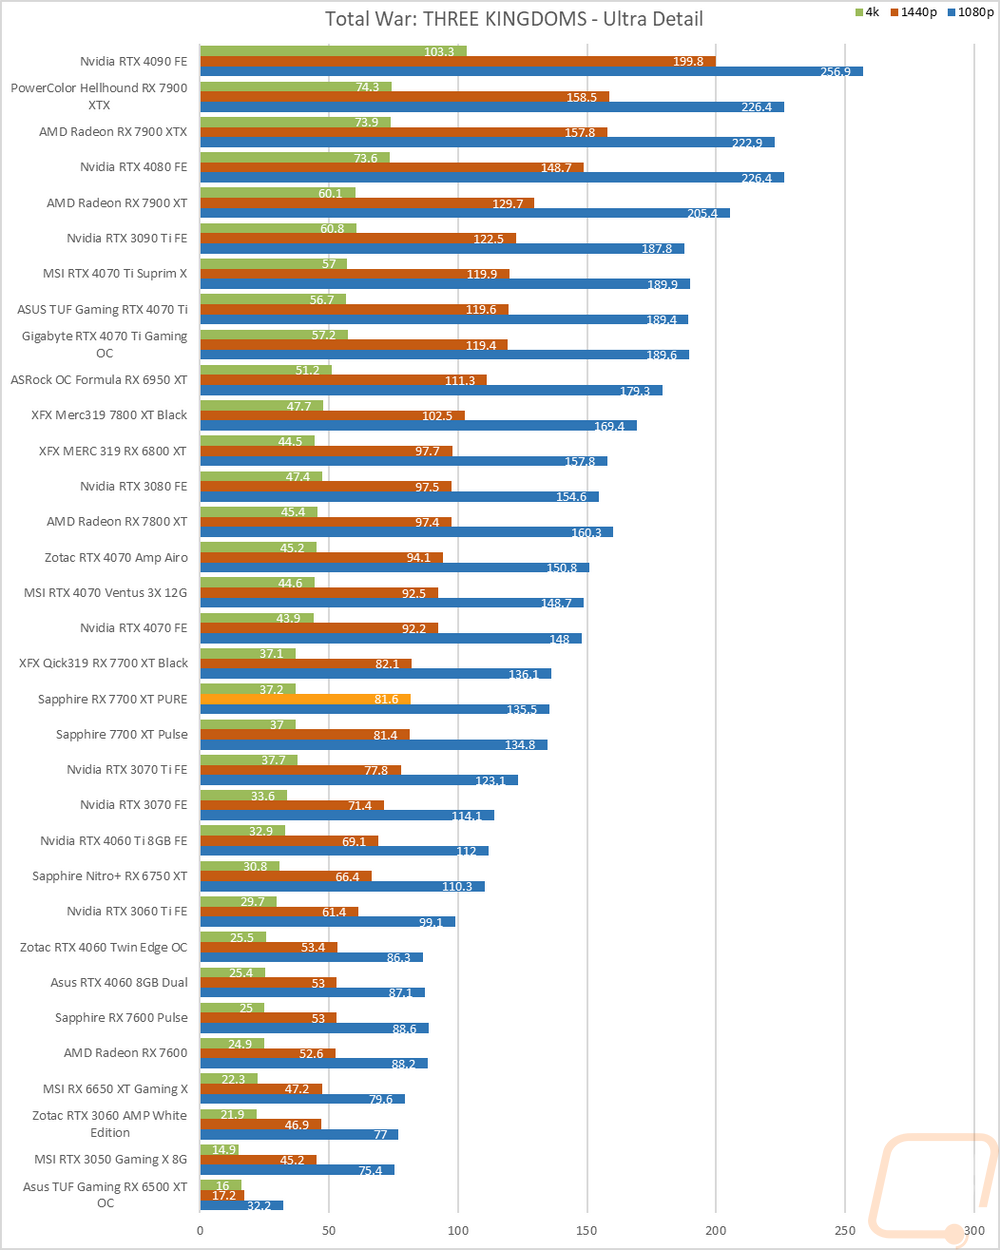
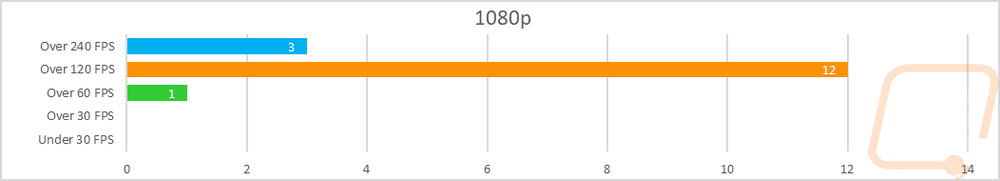
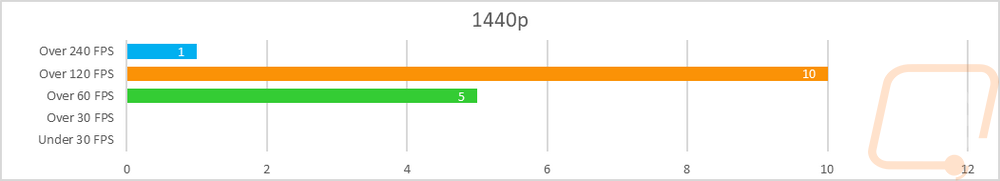
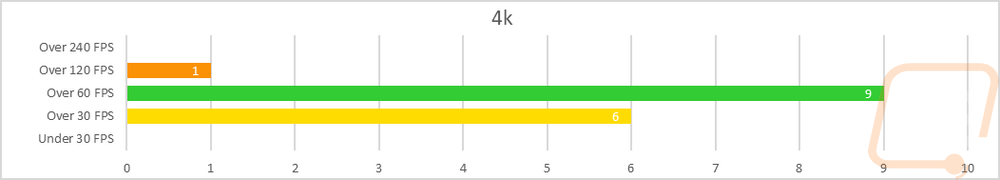
So how did the RX 7700 XT PURE do? At 4k 10 out of the 16 results were up over 60 FPS and 1 was up over 120 FPS as well. The other 6 results were all in the 30-59 FPS range where they are playable but not smooth. Overall 4k is possible but not ideal. The 7700 XT is targeted at 1440p gaming and you can see it with the RX 7700 XT PURE having every one of our results averaging up over 60 FPS. 11 results were even higher at 120 FPS and one of those was over 240 FPS. High refresh gaming is possible at 1440p. Then at 1080p, everything but one result was up over 120 FPS with three of those up over 240 FPS as well and that is with a lot of those games being CPU limited at that resolution.
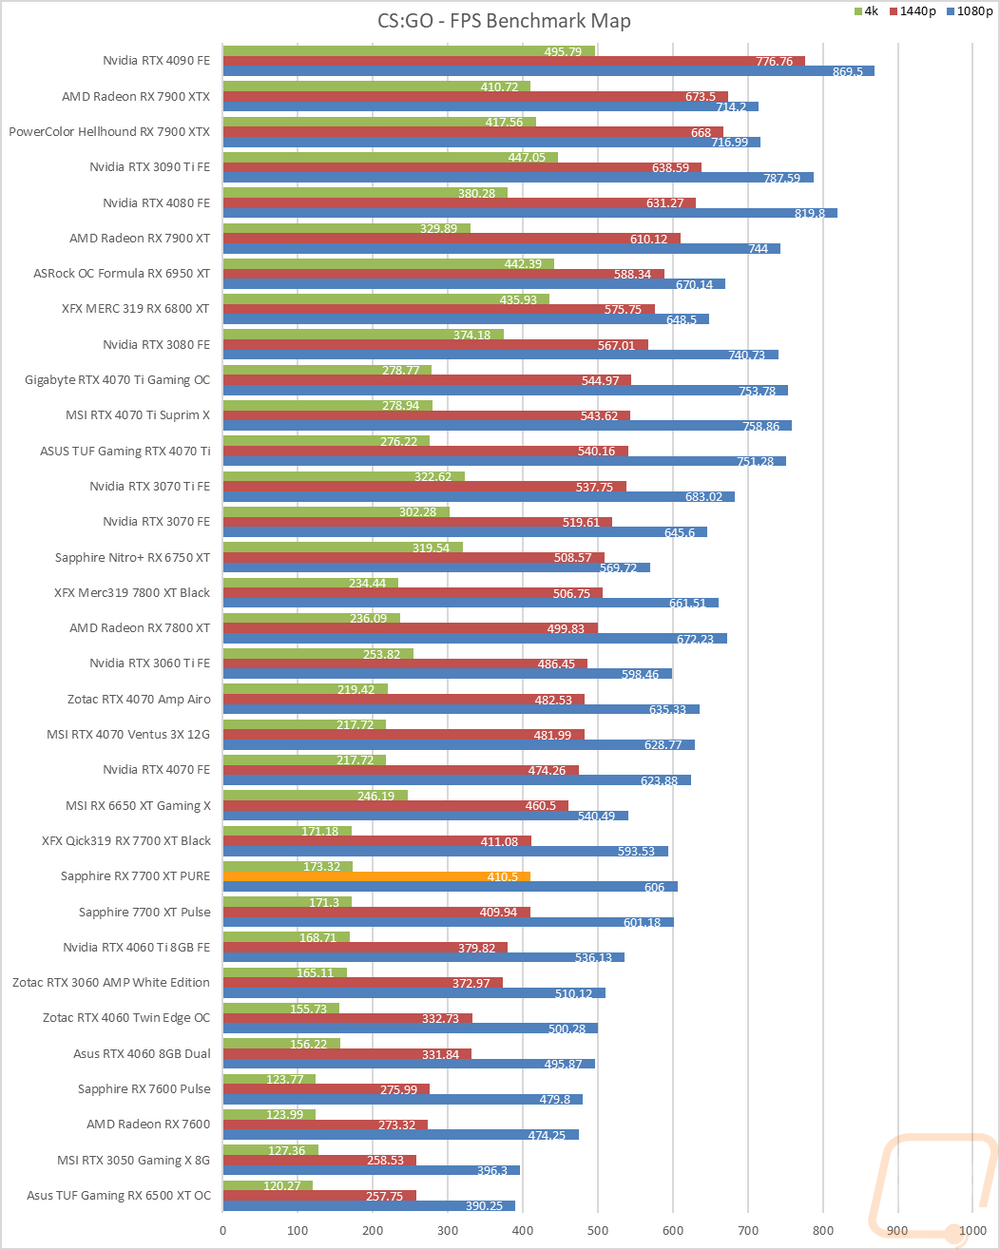
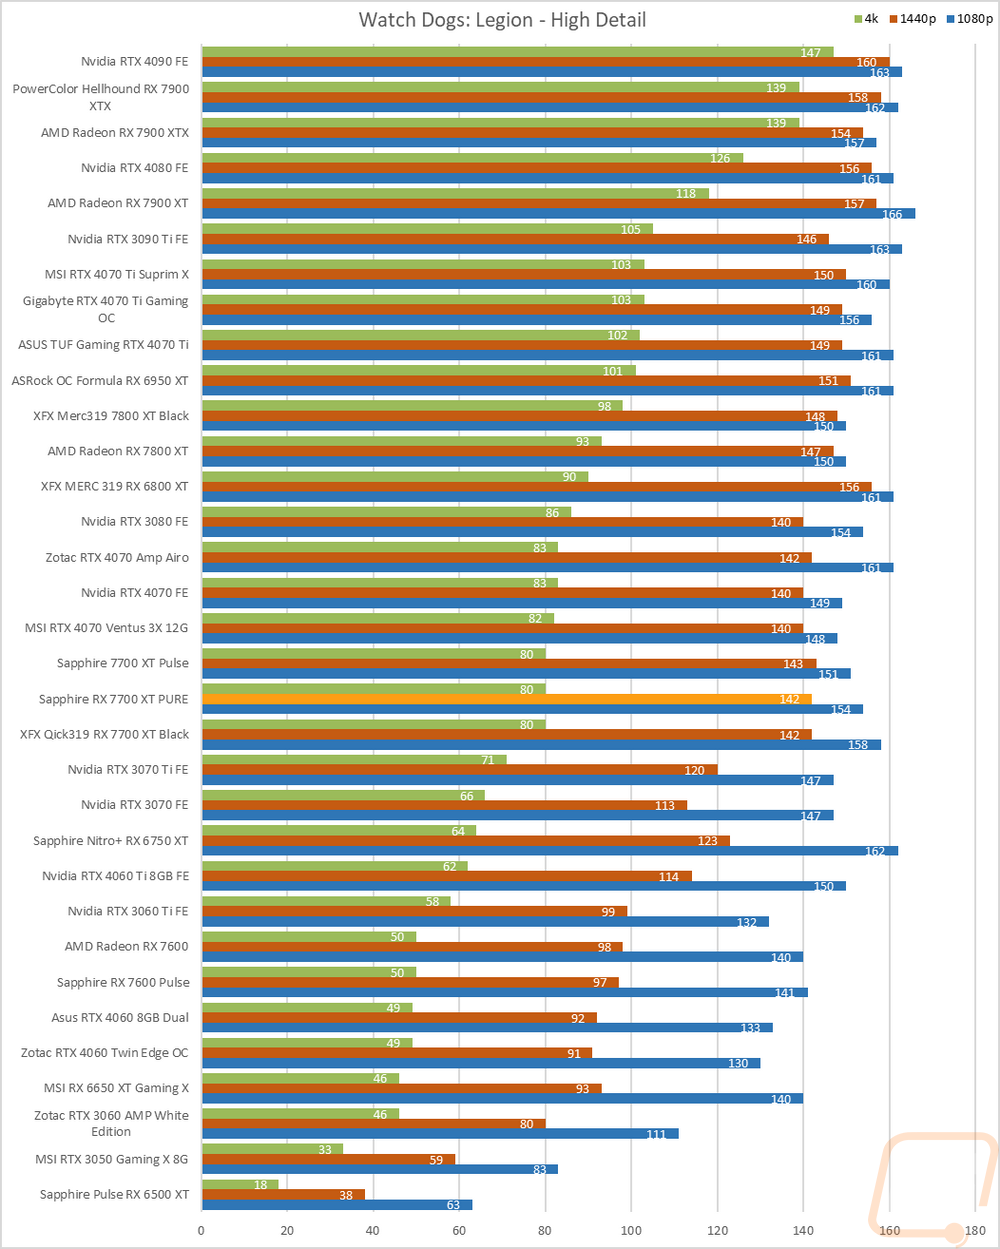
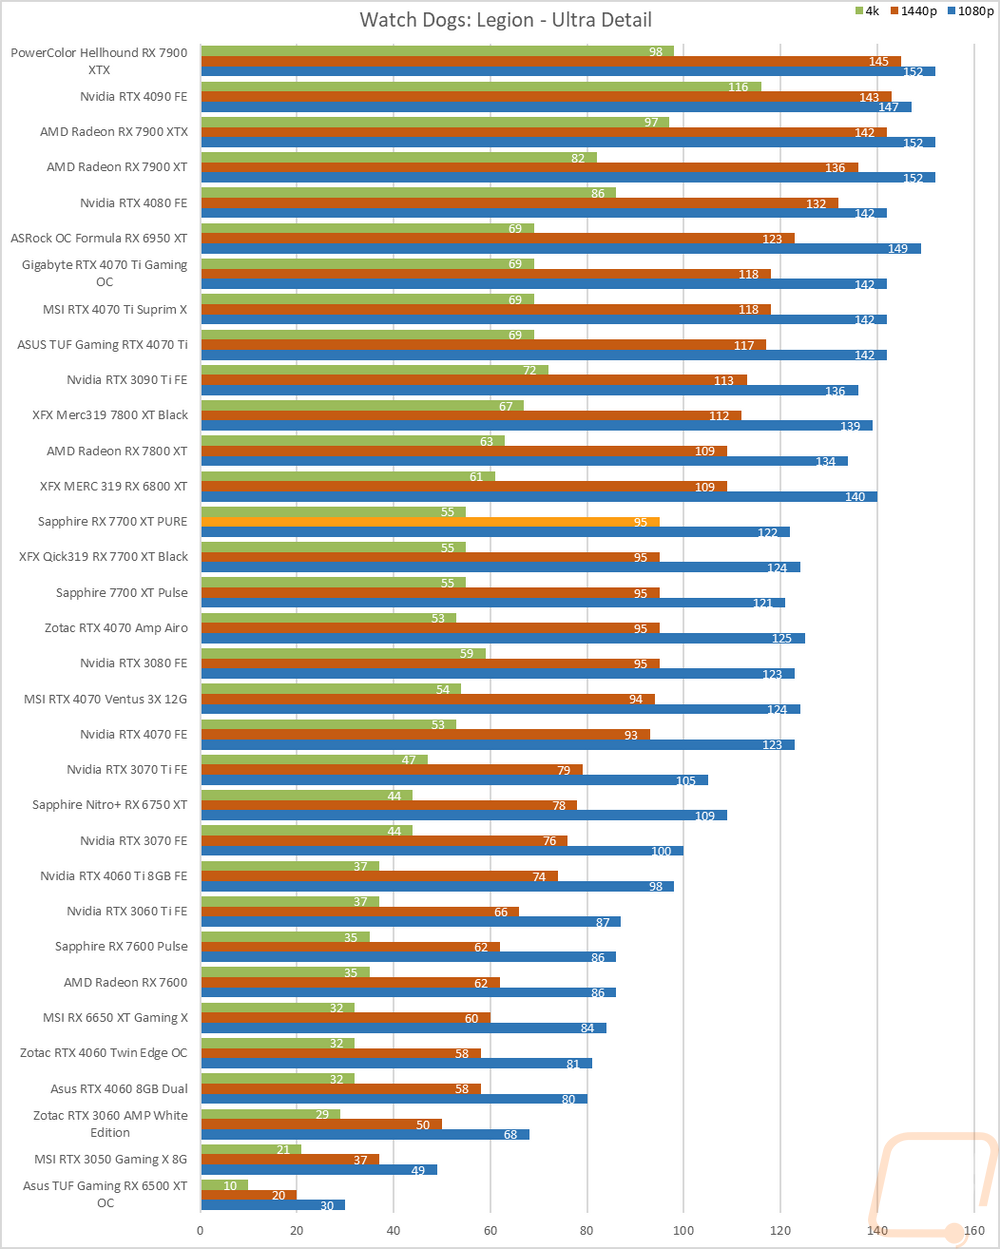
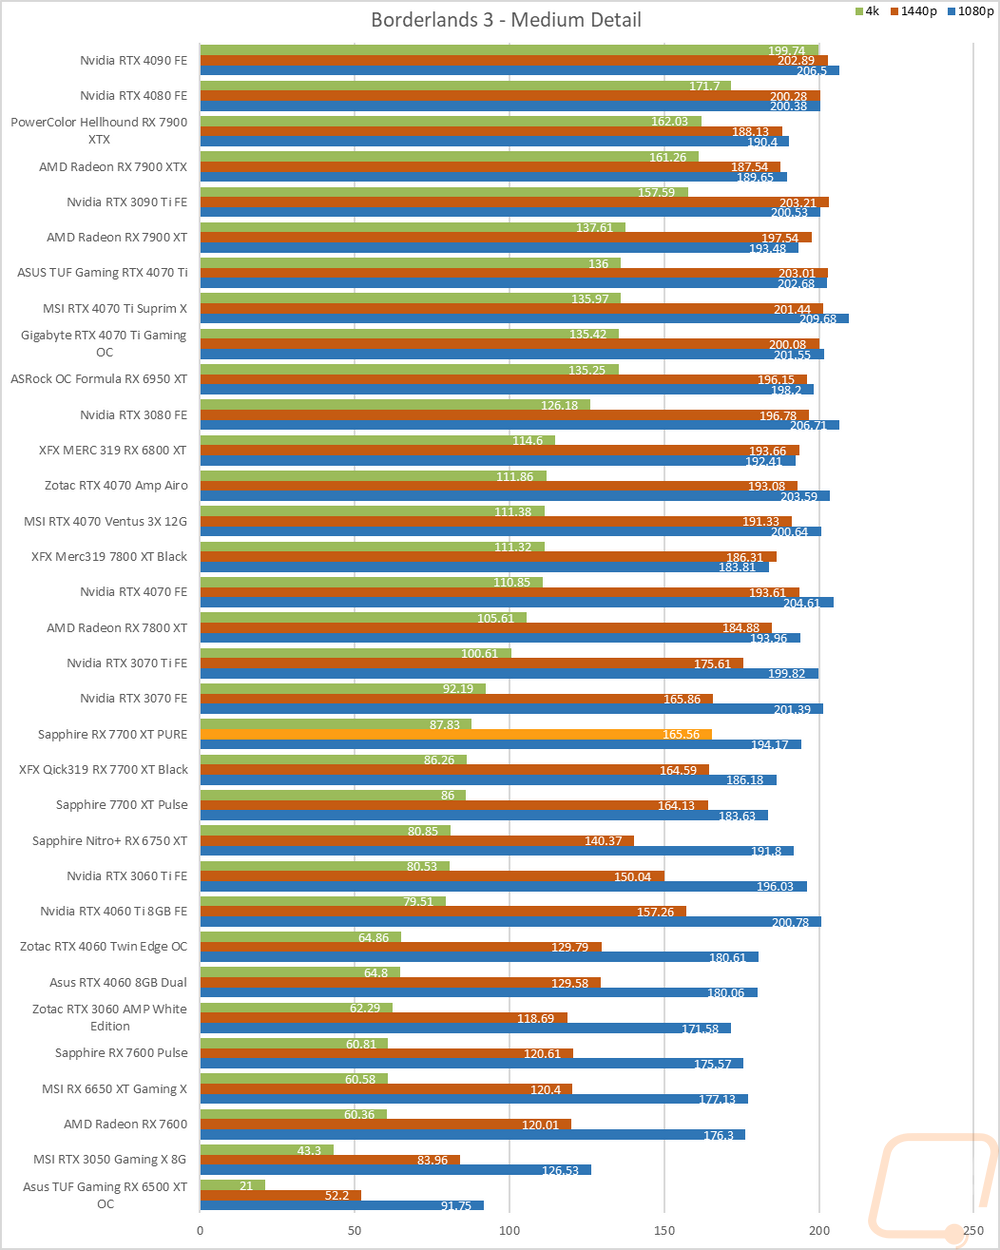
Of course, I have all of the actual in game results as well for anyone who wants to sort through the wall of graphs below. I also have averaged out the numbers for all of the cards around the RX 7700 XT PURE at all three resolutions that we tested at. There weren’t any big surprises when it comes to where the RX 7700 XT fits in the market, like with our other reviews the RX 7700 XT PURE was surprisingly close to the RTX 4070 and ahead of the RTX 3070 Ti. The RTX 4060 Ti 8GB is down farther with it averaging 115.3 FPS at 1440p to the RX 7700 XT PURE at 138.0. As for how the RX 7700 XT PURE compared to the Qick and Pulse they are all close together. At 1440p the QICK is ahead by .2 FPS but at 4K the RX 7700 XT PURE is ahead by .3 FPS or in other words not far enough apart to matter.
|
|
1080p |
1440p |
4K |
|
XFX MERC 319 RX 6800 XT |
197.1 |
162.3 |
92.4 |
|
XFX Merc 319 RX 7800 XT Black |
194.0 |
161.0 |
93.3 |
|
Radeon RX 7800 XT |
190.7 |
156.3 |
89.3 |
|
Nvidia RTX 4070 FE |
190.6 |
147.6 |
83.5 |
|
XFX QICK 319 RX 7700 XT Black |
179.9 |
138.2 |
75.2 |
|
Sapphire RX 7700 XT PURE |
180.9 |
138.0 |
75.5 |
|
Sapphire RX 7700 XT Pulse |
178.1 |
137.5 |
74.7 |
|
Nvidia RTX 3070 Ti FE |
165.8 |
125.7 |
72.9 |
|
Sapphire Nitro+ RX 6750 XT |
165.2 |
119.4 |
64.5 |
|
Nvidia RTX 3070 FE |
160.9 |
118.8 |
67.2 |
|
Nvidia RTX 4060 Ti 8GB FE |
160.1 |
115.3 |
62.0 |
|
Zotac RTX 4060 Twin Edge OC |
135.7 |
94.5 |
50.1 |