Cooling Noise and Power
For my last few tests, rather than focusing on in game performance, I like to check out other aspects of video card performance. These are also the most important ways to differentiate the performance between cards that have the same GPU. To start things off I took a look at power usage.
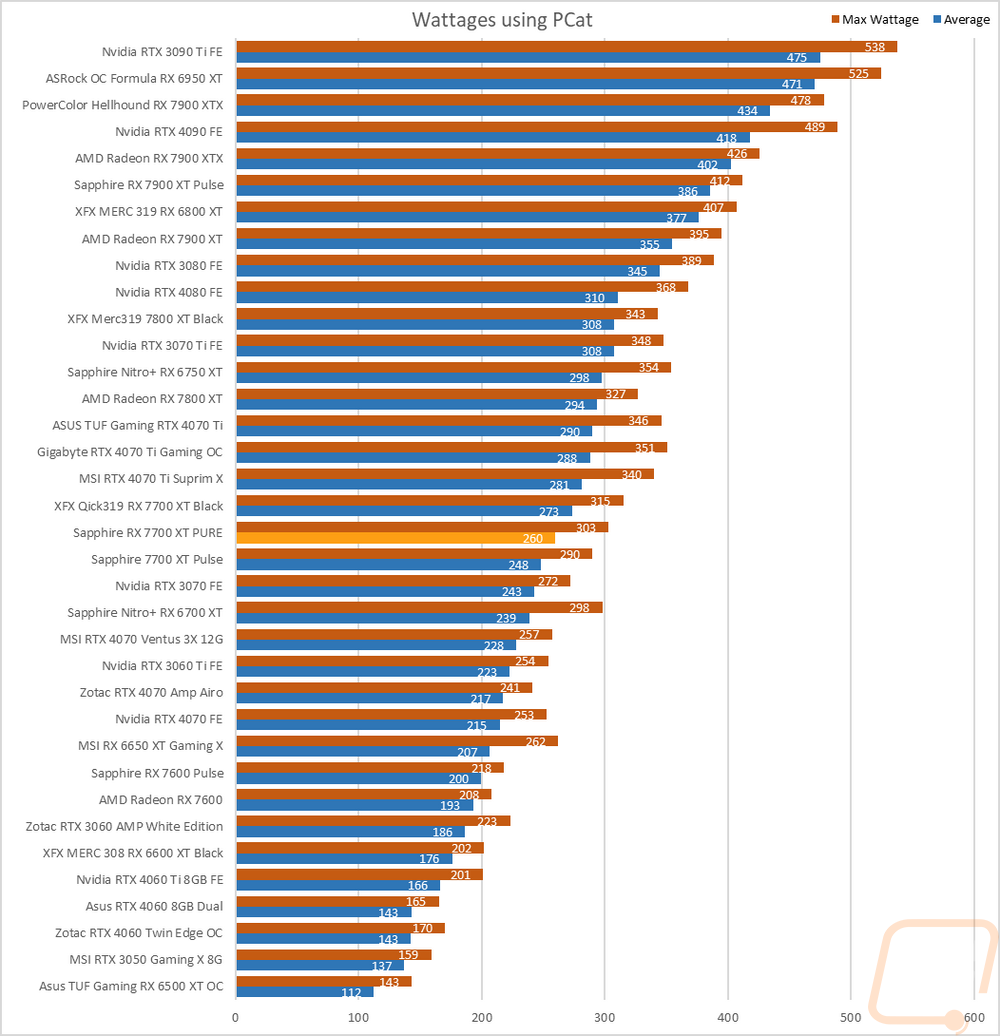
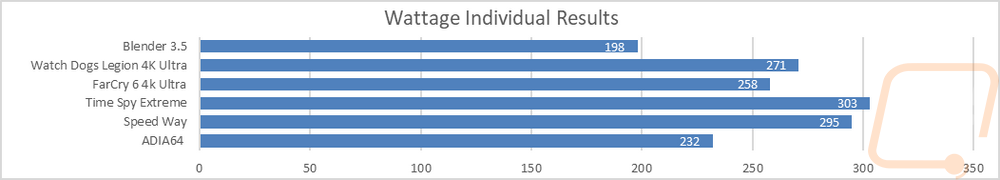
For this, our new test setup utilizes the Nvidia-designed PCat v2 along with cables to handle both traditional 6 or 8-pin connections as well as the new 12VHPWR. The PCat also utilizes a PCIe adapter to measure any power going to the card through the PCIe slot so we can measure the video card wattage exclusively, not the entire system as we have done in the past. I test with a mix of applications to get both in game, synthetic benchmarks, and other workloads like Blender and AIDA64. Then everything is averaged together for our result. I also have the individual results for this specific card and I document the peak wattage result as well which is almost always Time Spy Extreme. The RX 7700 XT PURE averaged 260 watts across all of the tests and peaked at 303 watts. This came in right in the middle of the pack between the Pulse and the QICK with the QICK 13 watts higher on the average and 13 watts higher on the peak as well. The wattage range between the three cards is the most surprising thing really with 33 watts between the top and bottom cards.
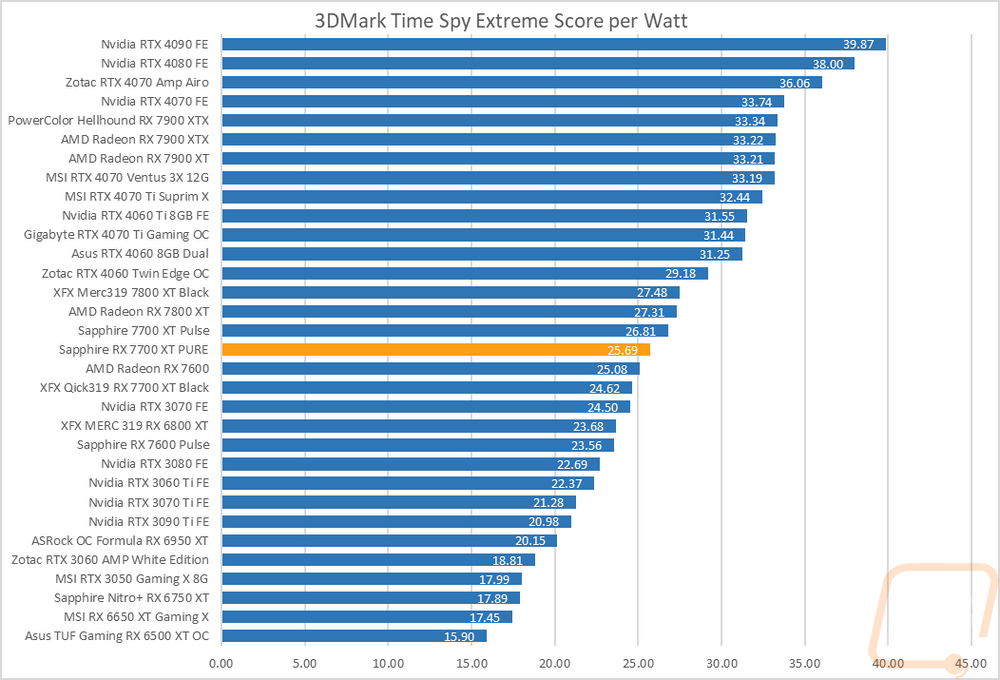
With having exact peak wattage numbers when running Time Spy Extreme I was also able to put together a graph showing the total score for each watt that a card draws which gives us an interesting look at overall power efficiency in the popular and demanding benchmark. Landing in the middle for power draw between the three 7700 XT helped the RX 7700 XT PURE a lot in the efficiency numbers. The stock-clocked Pulse is still more efficient but the PURE did do better than the QICK. That at least kept it above the reference RX 7600 but the Nvidia cards from this generation are still noticeably better on efficiency with the 4060 Ti for example 5.86 points per watt more efficient.
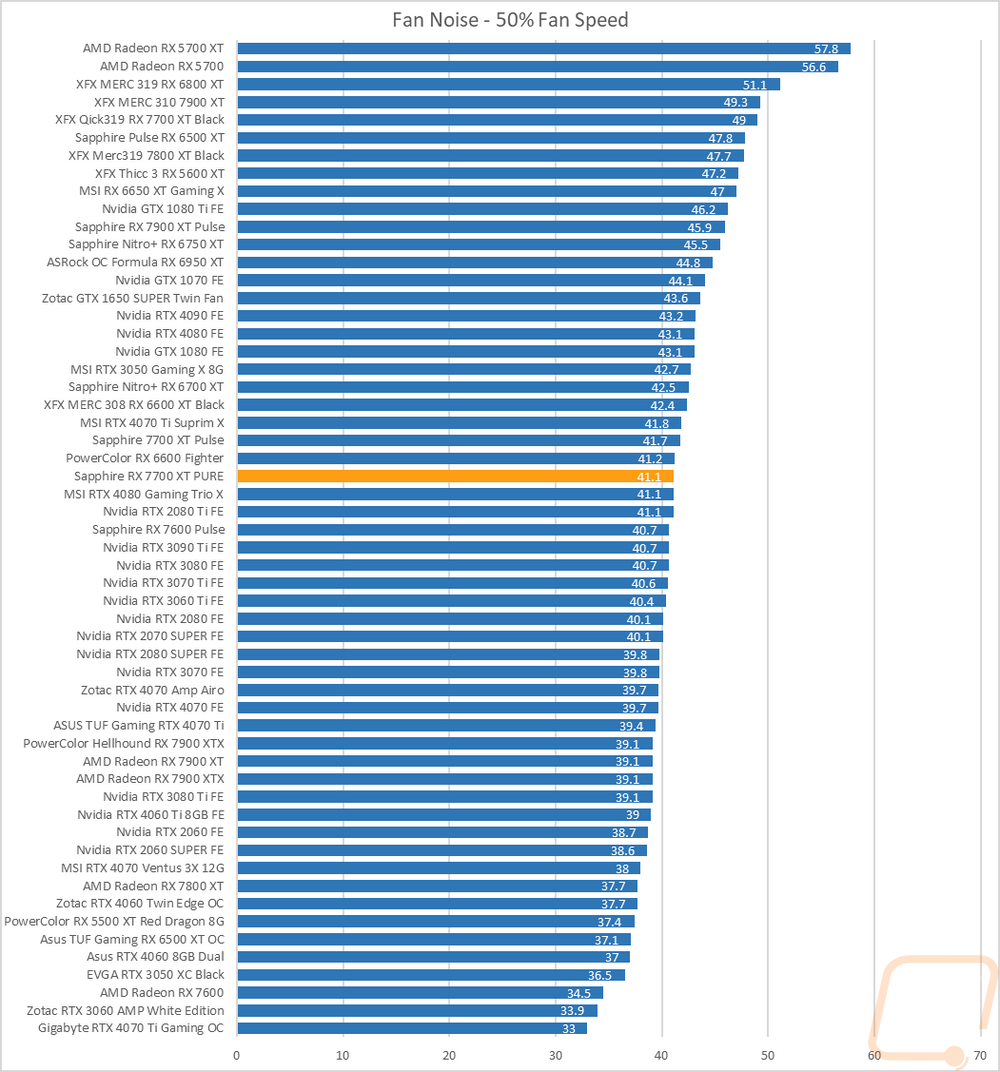
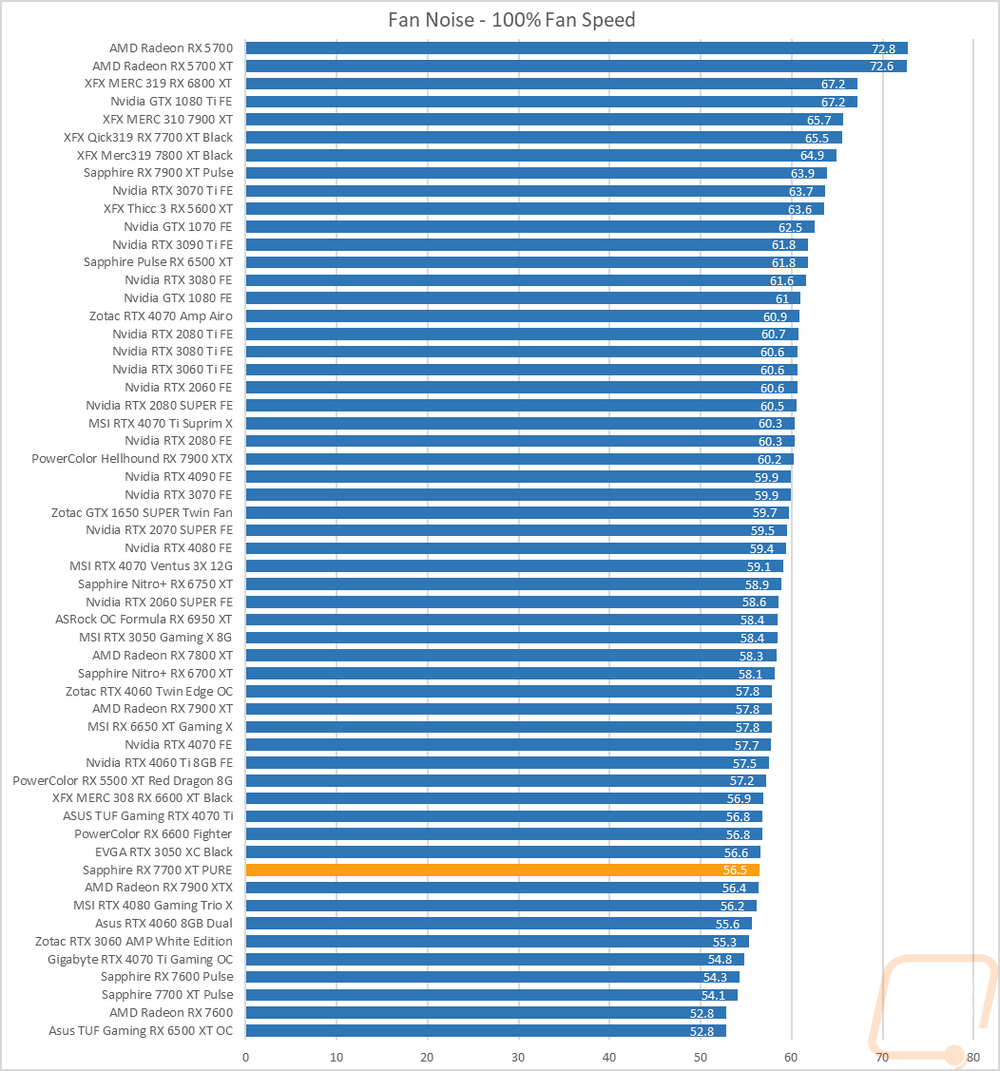
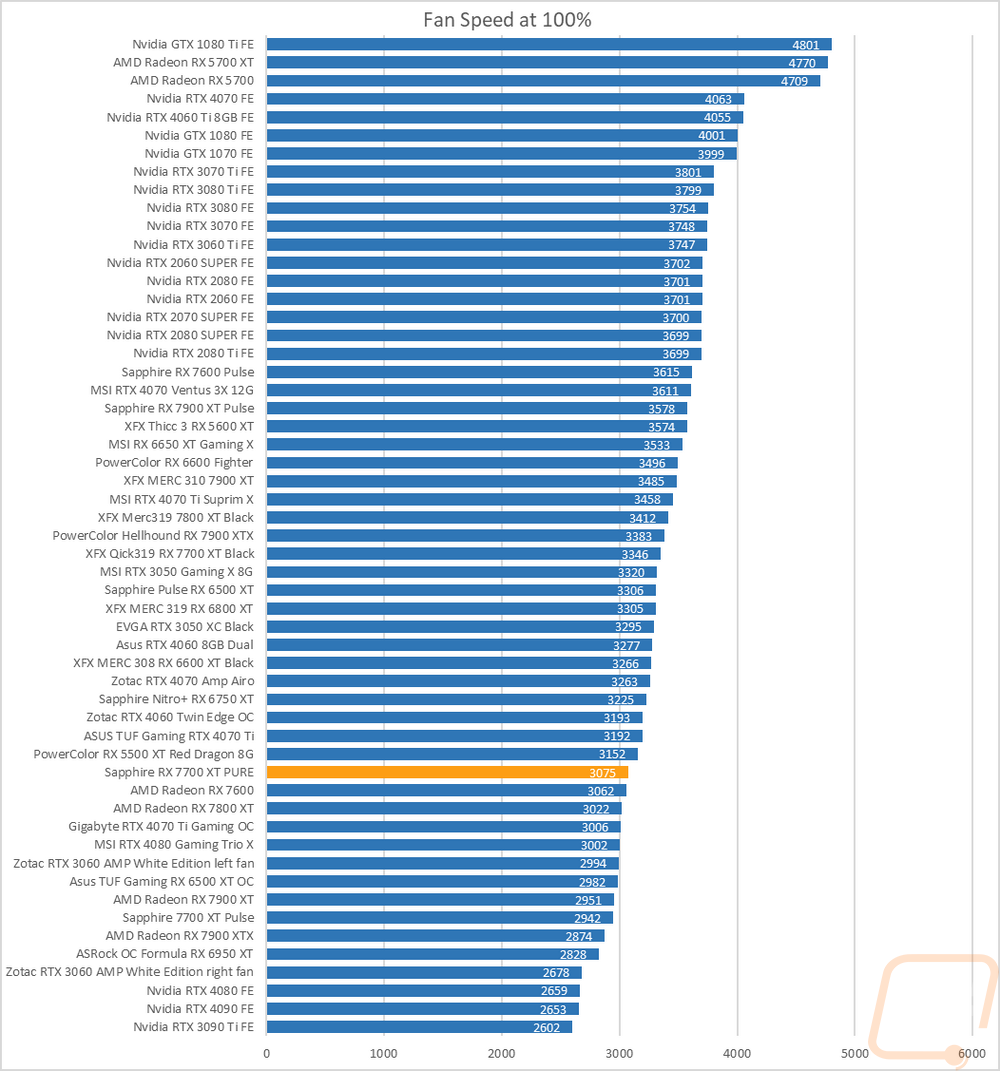
My next round of tests were looking at noise levels. These are especially important to me because I can’t stand to listen to my PC whirling. Especially when I’m not in game and other applications are using the GPU. For my testing, though I first tested with the fan cranked up to 100% to get an idea of how loud it can get, then again at 50% to get an idea of its range. The RX 7700 XT PURE came in the middle of the pack at 50% fan speed, similar to the Pulse which isn’t a surprise given that they have the same fans just the PURE has one more. What is more impressive though is how at 100% fan speed the RX 7700 XT PURE and the Pulse both dropped down the chart when the XFX card went the other direction.
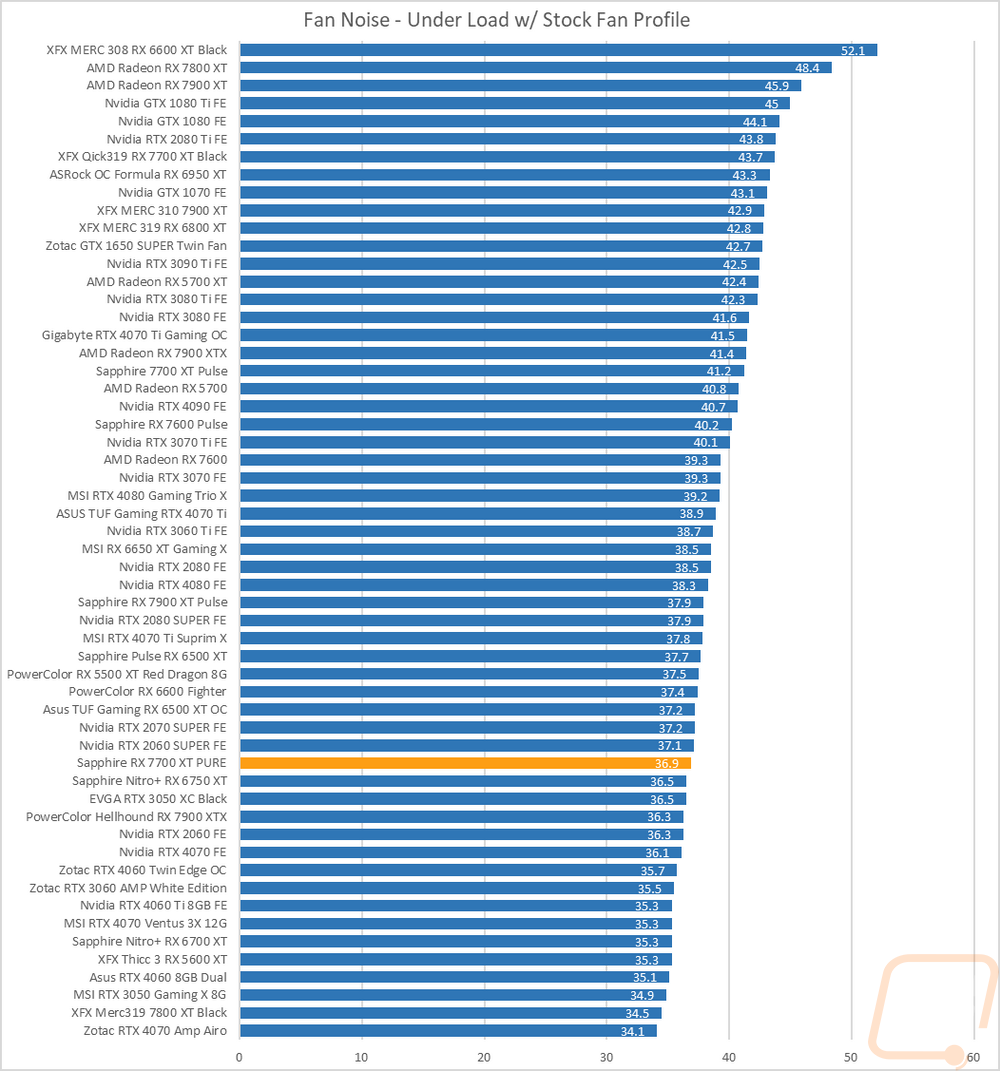
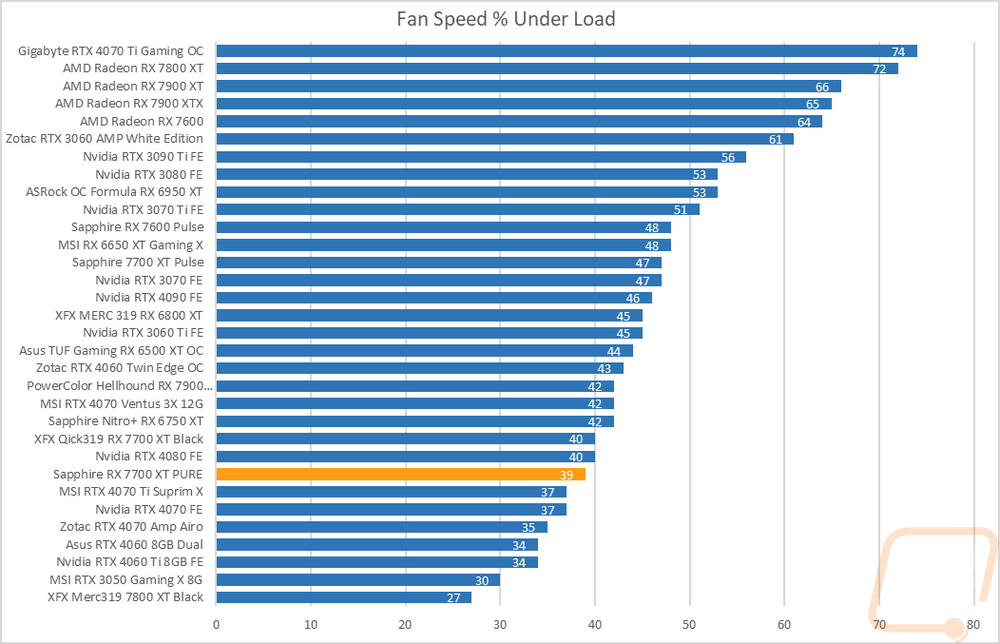
I also take a look at noise performance while under load. For that when running AIDA64’s stress test I wait until the temperature of the card has leveled off and then measure how loud things are when the card is at its worst-case scenario with the stock fan profile. In my opinion, this is also the most important noise result as well, how loud the card can be is one thing, how loud it is when you are actually using it is a lot more important. The RX 7700 XT PURE is down in the bottom 1/3 of the chart at 36.9 dB. This was 4.3 dB lower than the RX 7700 XT Pulse and 6.8 dB lower than the XFX QICK 7700 XT making the RX 7700 XT PURE the quietest of the three cards tested while in game and it isn’t even close. When under load the cards fans were running at a max of 39% so there is still plenty of headroom left as well.
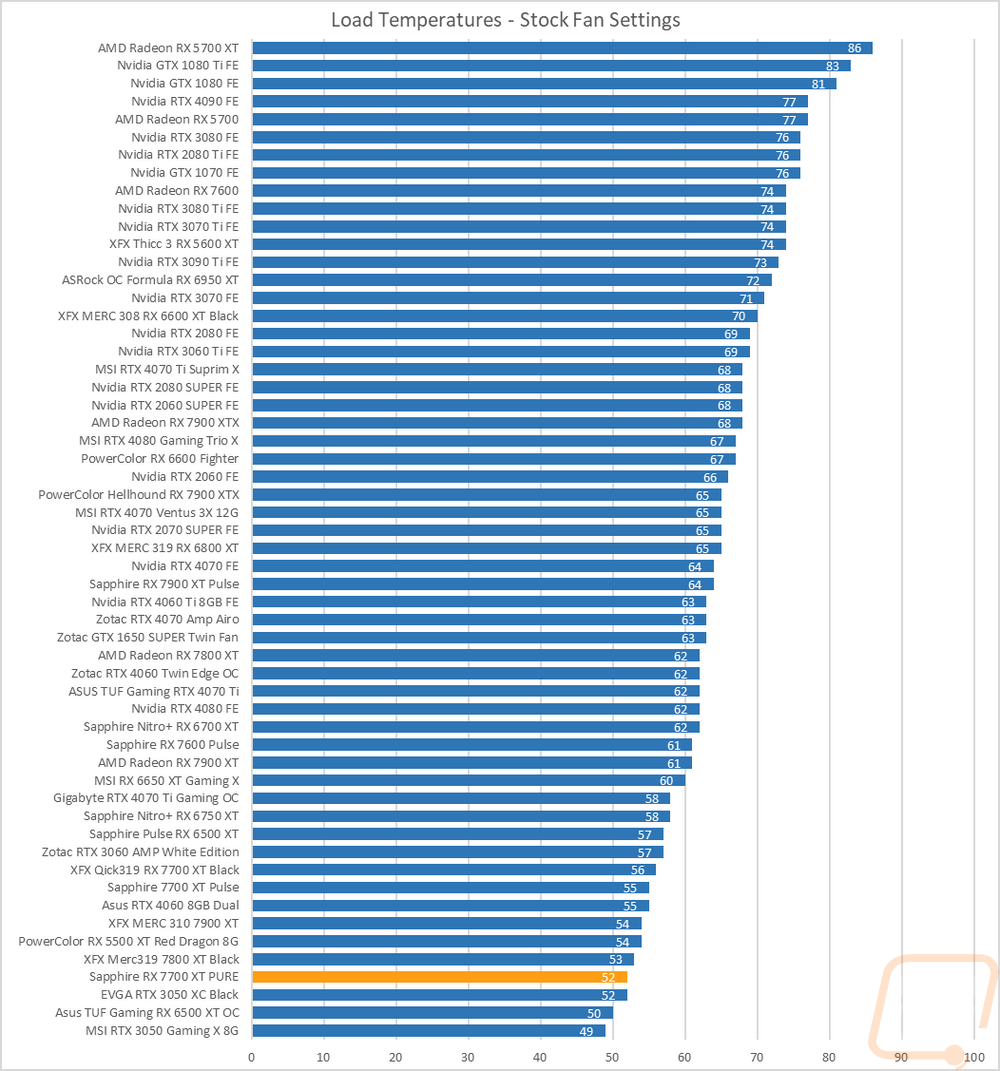
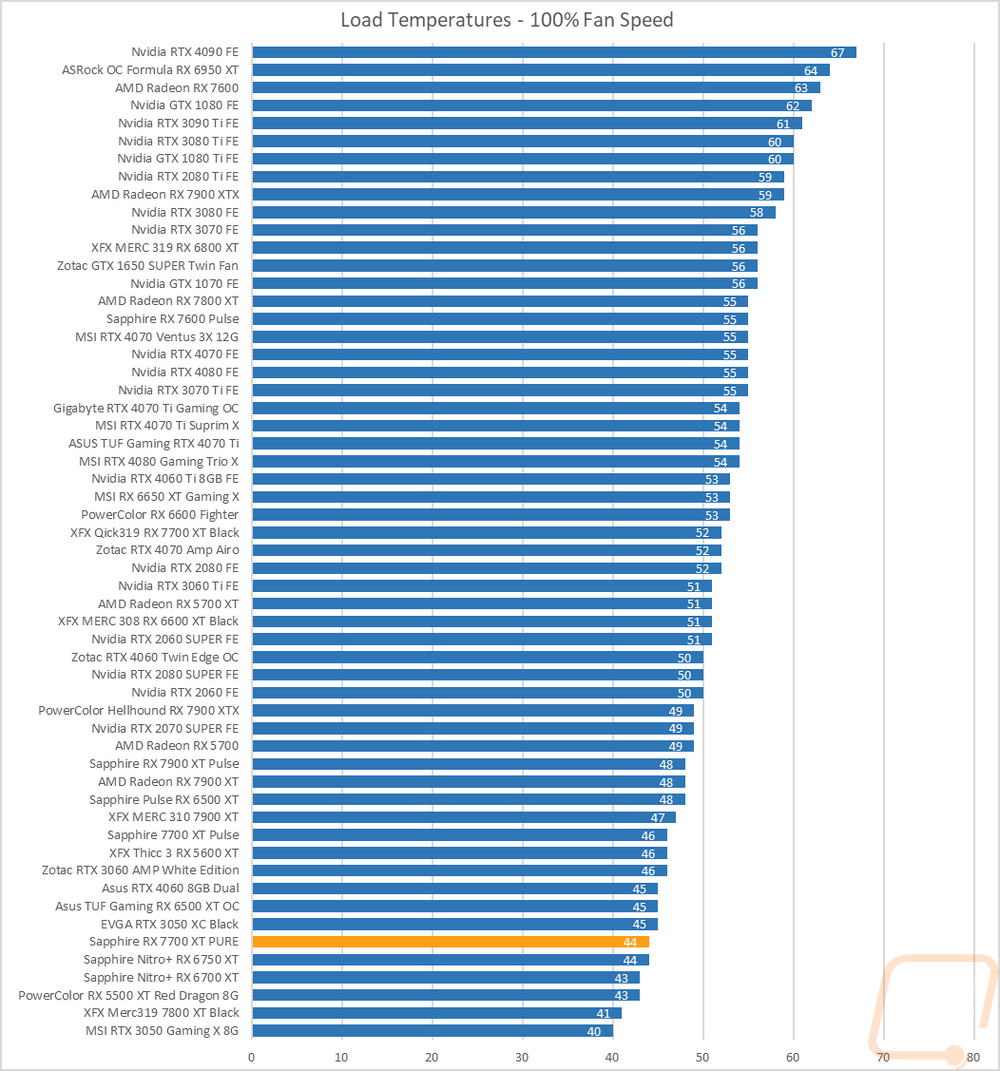
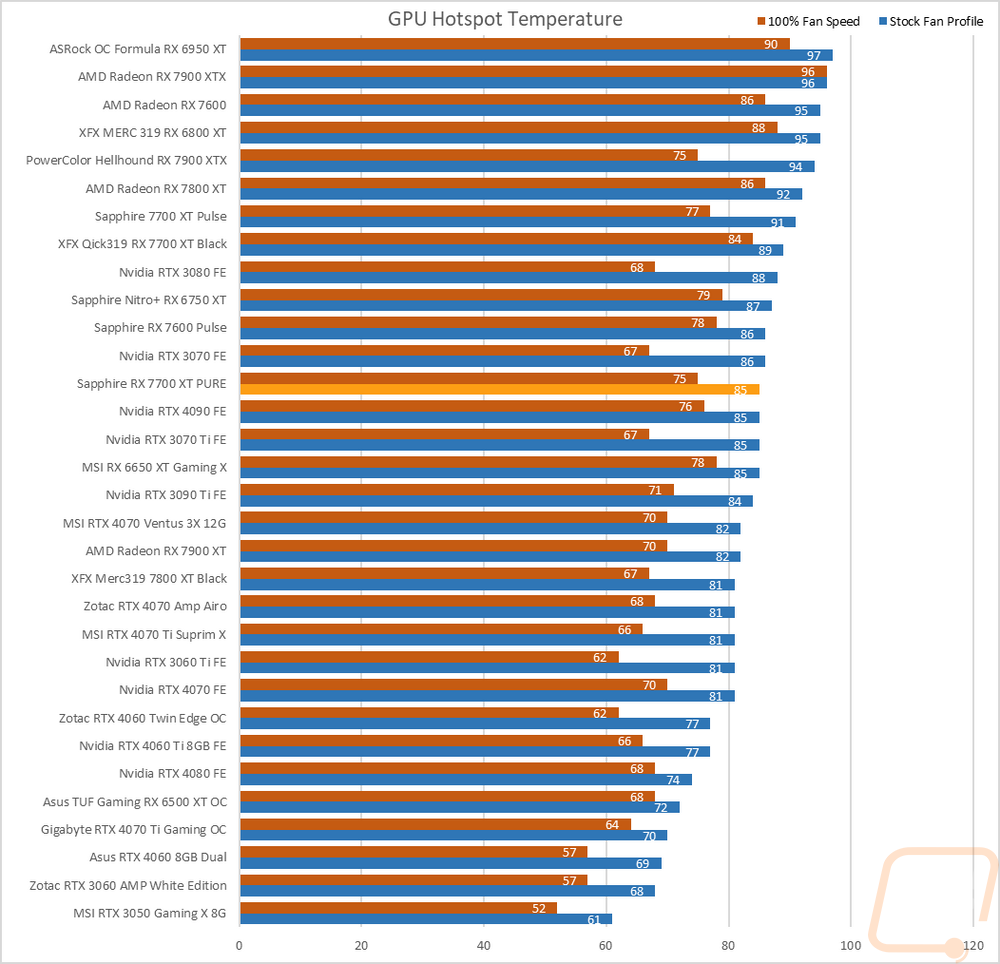
To finish up my testing I of course had to check out the cooling performance. To do this I ran two different tests. I used AIDA64’s Stress Test run for a half-hour each to warm things up. Then I documented what temperature the GPU leveled out at with the stock fan profile and then again with the fans cranked up to 100%. With the stock profile, the RX 7700 XT PURE is down at the bottom of the chart with an impressive 52c. For comparison, the Pulse was 55c and the XFX card was 56c in this same test. The RX 7700 XT PURE had its GPU hotspot at 85c with the stock fan profile, 6c lower than the Pulse, and 4c lower than the XFX QICK. At 100% fan speed the RX 7700 XT PURE is still down near the bottom of the chart, dropping down to 44c here which is just 2c lower than the stock-clocked Pulse but 8c lower than the QICK. Its GPU hotspot was 75c at 100% fan speed, 2c lower than the Pulse, and 9c lower than the QICK.
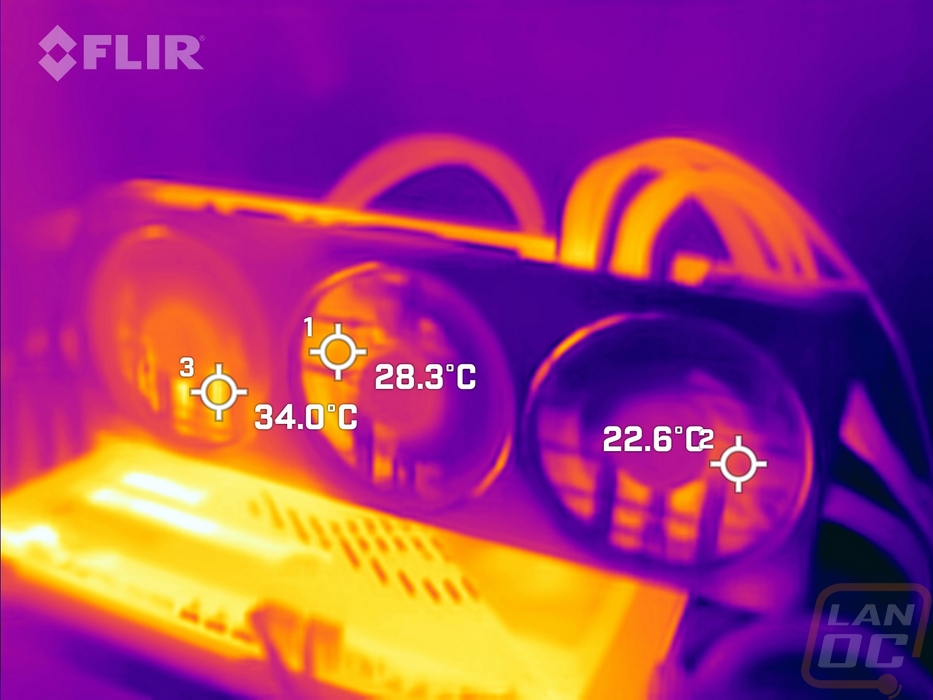
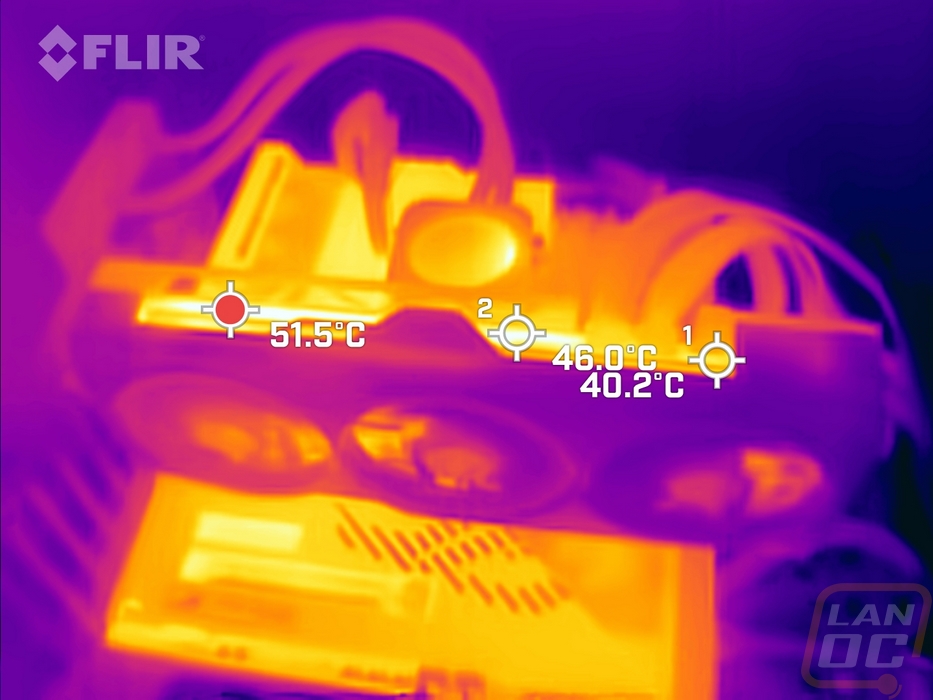
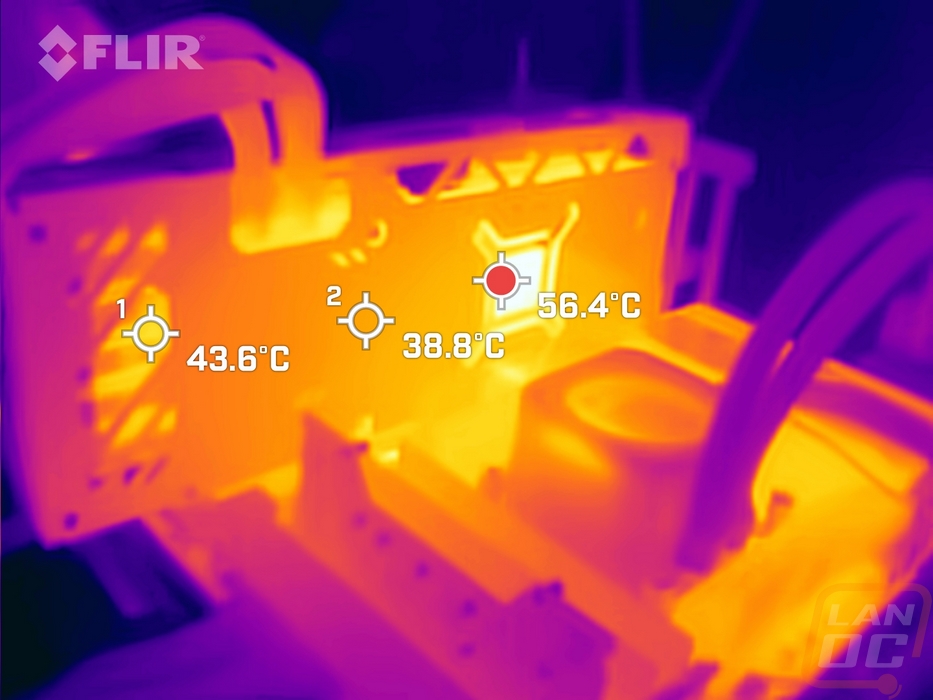
While running the stock fan profile testing I also took the time to get a few thermal images so we could see what is going on. The fan side of the RX 7700 XT PURE is nearly room temperature down at the end with the blow-through section. Even to the left of that though the hottest spot I could find was just 34c and that was just a small spot behind the far left fan. Up on the top edge however it is a different story, the fans are pushing all of the air up this direction and the PCB is exposed here as well which is the hot stripe you see on the top edge. The cooler is running around 40c but the PCB peaks out at 51.5c over on the left closer to the GPU. The same goes for the back of the card with the exposed PCB directly behind the GPU, that spot is the hottest spot on the card at 56.4c. The rest of the metal backplate has soaked up some heat and you can see how the farther away from the GPU you get the cooler it is. Overall though there wasn’t anything of concern on the thermals.